Article

Mechanism and Effect of the Dilution Gas Flow Rate on Various Fe–Si/SiO2 Soft Magnetic Composites during Fluidised Bed Chemical Vapour Deposition

1
Key Laboratory of Metallurgical Emission Reduction & Resources Recycling, Anhui University of Technology, Ma’anshan 243002, China
2
International Science & Technology Cooperation Base for Intelligent Equipment Manufacturing under Special Work Environment, Anhui University of Technology, Ma’anshan 243002, China
3
Ansteel Group, Ansteel Group Iron and Steel Research Institute, Anshan 114021, China
*
Authors to whom correspondence should be addressed.
Crystals 2021, 11(8), 963; https://doi.org/10.3390/cryst11080963
Submission received: 12 July 2021 / Revised: 10 August 2021 / Accepted: 13 August 2021 / Published: 16 August 2021
(This article belongs to the Special Issue 2D Crystalline Monolayer Nanosheets)

Abstract

:
The effect of the dilution gas flow rate on inorganic oxide insulating layers can improve fluidised bed chemical vapour deposition (FBCVD) in Fe–Si/inorganic-oxide soft magnetic composites and obtain excellent magnetic properties. Herein, Fe–Si/SiO2 composite particles coated via FBCVD and deposited at a 125–350 mL/min Ar-dilution gas flow rate were prepared and sintered into soft magnetic composites. Results demonstrate that SiO2 deposited on the Fe–Si substrate particle surface changed from submicron SiO2 clusters (125 mL/min) to an incomplete SiO2 film, then to a complete SiO2 film, and finally to a porous SiO2 film as the Ar-dilution gas flow rate increased. SiO2 layers began to transform from the amorphous to the beta-cristobalite state with a hexagonal crystal structure between 1149.45 K and 1280.75 K. However, the SiO2 amorphous layers’ crystallisation did not affect the Fe–Si substrate particles’ crystal structure. With the increasing Ar-dilution gas flow rate, the saturation magnetisation of Fe–Si/SiO2 soft magnetic composites initially decreased and then increased. The electrical resistivity increased before 150 mL/min, followed by an increase between 150 and 250 mL/min and then decreased, whereas the total core loss exhibited the opposite trend. These results show that magnetic performance can be promoted by selecting a suitable dilution flow rate.

Graphical Abstract

1. Introduction

For advanced performance, as an energy conversion material in electromagnetic devices [1,2,3] and high-power high-frequency electrical devices [4], Fe–Si/inorganic-oxide soft magnetic composites have been studied by researchers worldwide. To coat an inorganic oxide insulating layer on Fe–Si magnetic particles, several methods, such as ball milling [5], mixed sintering [6], and the sol–gel process [7,8], were used to obtain Fe–Si/inorganic-oxide core–shell particles with high insulating quality. The disadvantage of these methods is the uncontrollability of homogeneity for the inorganic oxide-insulating layer. The fluidised bed chemical vapour deposition (FBCVD) method was first used to coat inorganic oxides on particles ~30 years ago [9]. Moreover, laboratory studies demonstrate that the FBCVD technique is a suitable and effective method for coating inorganic oxide-insulating layers on Fe–Si magnetic particles [10]. An 800-nm-thick inorganic oxide insulating layer can be deposited at a rate ranging between 4.2 and 17.6 nm/min on Fe–Si substrate particles [11].
The inorganic oxide-insulating layers are deposited on the particle surface by thermally decomposing the precursors [12,13,14]. However, during the subsequent particle-moulding process, the inorganic oxide-insulating layers easily break and collapse because of the large lattice mismatch and thermal expansion coefficient mismatch between inorganic oxides and particle substrates [15,16], which may negatively impact performance. Therefore, research attention should be focused on the interfacial bonding between inorganic oxides and particle substrates and the compactness of the inorganic oxide-insulating layer’s deposition. In the FBCVD system, multiple conditions, such as the deposition temperature, pressure, particle substrate size, precursor flow rate, and dilution gases, affect the deposition process and the properties of the final product. Recently, many studies have reported the effect of FBCVD process parameters on the quality of inorganic oxide deposition and related performance. Complete FBCVD experimental investigations were conducted to study the effect of the deposition time and the precursor’s mole fraction on SnO2 deposition with large hollow Ni particles [17]. To improve SiO2 layer deposition using FBCVD, the effects of the deposition time and injection mode of SiH4 on the deposition process were examined [18]. The effects of deposition temperature on the uniformity of the TiO2 distribution of the Fe–Ni particles and photocatalysis were examined using the geometric limitation of real experiments [19]. Although these studies have significantly promoted research, the FBCVD experimental conditions on the compactness of inorganic oxide insulating layers deposited on the Fe–Si particle surface and the magnetic properties of Fe–Si/inorganic-oxide soft magnetic composites have not been reported thus far.
Herein, the impact of the Ar dilution gas flow rate on the microstructure of the SiO2 layers deposited via FBCVD was examined. Further, the evolution mechanisms of SiO2 layers under a series of Ar dilution gas flow rates are reported, and the effect of the magnetic properties of Fe–Si/SiO2 soft magnetic composites is described. The results provide a certain basis for improving the Fe–Si/inorganic-oxide soft magnetic composites and process knowledge of FBCVD.

2. Materials and Methods

2.1. Materials

In this study, the substrate particles used were commercial gas-atomized Fe–Si particles with a particle size ranging between 45 and 90 µm. The nominal composition of the Fe–Si particles was Fe = 93.26, Si = 6.65, O = 0.02, C = 0. 07 (wt.%). Tetraethyl orthosilicate (National Medicine Group Chemical Reagent Co., Ltd., Shanghai, China) with a purity of 99.0 wt.% was selected as the SiO2 precursor. Pure Ar gas (Nanjing Special Gas Plant Co. Ltd., Nanjing, China) with a purity of 99.999 wt.% was used as the dilution and carrier gas.

2.2. Preparation of Fe–Si/SiO2 Composites Using FBCVD-HPS

Herein, Fe–Si/SiO2 soft magnetic composites were fabricated through an FBCVD-hot press sintering (HPS) process, which involves two primary steps: (i) 50 g of Fe–Si particles was placed on a stainless steel strainer, with 30-μm-diameter pores, within a vertical tube furnace and fluidised using Ar dilution gas. Tetraethyl orthosilicate (outgassed at 423 K) was introduced into the furnace by another Ar carrier gas flow (at a rate of 100 mL/min) for 60 min when the furnace temperature reached 930 K. The Fe–Si/SiO2 composite particles were collected after the furnace cooled to room temperature. (ii) Next, 26 g of Fe–Si/SiO2 composite particles was packed into a graphite mould and sintered using an HPS condition (Hubei Changjiang Jinggong Material Technology Co. Ltd., Ezhou, China). The pressure was increased to 20 MPa, and then the temperature was increased to 1223 K in 10 min. The Fe–Si/SiO2 soft magnetic composites were sintered at this temperature at a dwelling time of 10 min. The Fe–Si/SiO2 composite particles and soft magnetic composites were adjusted by varying the flow rate of the Ar dilution gas from 125 to 350 mL/min.

2.3. Characterisation

The element distribution, surface, and cross-section morphologies of Fe–Si/SiO2 composite particles and soft magnetic composites were characterised via scanning electron microscopy (SEM, Zeiss Sigma 300, Sigma, Ronkonkoma, NY, USA) and energy-dispersive spectrometry (EDS, OxfordX-MAX). A Bruker D8 Advance X-ray diffractometer (XRD, Bruker, Billerica, MA, USA), with CuKα radiation, was used to examine the phase composition of the synthesised Fe–Si/SiO2 composite particles and soft magnetic composites. Furthermore, the changes in the crystal structure information, for the Fe–Si/SiO2 soft magnetic composites during HPS, were obtained using Rietveld refinement. The Fe–Si/SiO2 composite particles were thermally analysed via differential scanning calorimetry (DSC, Netasch 499C, Netzsch, Bavaria, Germany) at a heating rate of 10 K/min from 373.15 K to 1473.15 K under an argon atmosphere. The magnetic hysteresis loops of Fe–Si/SiO2 soft magnetic composites were measured using a vibrating sample magnetometer (VSM, MPMS XL-7, Quantum Design, CA, USA) at room temperature with a maximum applied field of 20 kOe. Sheet resistances of the Fe–Si/SiO2 soft magnetic composites were measured using a four-probe resistivity test system. The total core loss of Fe–Si/SiO2 soft magnetic composites from 10 mT and 25–200 kHz, respectively, was examined using a B–H curve analyser (SY-8219, IWATSU, Tokyo, Japan).

3. Results

3.1. Morphology of Fe–Si/SiO2 Composite Particles and Soft Magnetic Composites

The SEM and EDS mappings of the Fe–Si/SiO2 composite particles were used to demonstrate the deposition of SiO2 layers on Fe–Si substrate particles. The surface morphology of the Fe–Si/SiO2 composite particles deposited at a flow rate of 250 mL/min for the Ar dilution gas is shown in Figure 1. The elemental signals of O obtained from the Fe–Si/SiO2 composite particles are consistent with those of Fe and Si. The even distribution of these three elements indicates that an excellent and uniform SiO2 layer can be deposited on the surface of the Fe–Si substrate particles through FBCVD. Figure 2 shows the surface morphologies of Fe–Si/SiO2 composite particles obtained at various Ar dilution gas flow rates. Following FBCVD, compared with the clean and smooth surface of Fe–Si substrate particles seen in Figure S1, the surface of the Fe–Si/SiO2 composite particles became rougher. Moreover, the particle surface morphology and SiO2 layer quality were influenced by the flow rate of the Ar dilution gas. The submicron-sized SiO2 clusters can be observed on the local areas of the sample surface when the flow rate of Ar dilution gas was relatively low (125 mL/min, Figure 2a), and the as-formed SiO2 layer was unconnected. The deposited SiO2 showed a decrease in the particle size, and its deposition changed from particles to a film as the flow rate of Ar dilution gas increased to 150 mL/min (Figure 2b). Moreover, the SiO2 layers deposited on the surface of the Fe–Si substrate were evenly distributed at a flow rate of 200 mL/min of the Ar dilution gas, and the existing pits on the substrate surface were covered (Figure 2c). As the flow rate of the Ar dilution gas increased (Figure 2e), visible pores appeared among the SiO2 layers, indicating that the homogeneity and compactness worsened at this stage. Furthermore, the cross-section backscattered images in Figure 2 confirmed that the Fe–Si/SiO2 composite particles could be obtained at a gas flow rate of 125 mL/min for the Ar dilution gas; however, the optimal Ar dilution gas flow rate range for forming an integrated Fe–Si/SiO2 core/shell heterostructure was between 200 and 300 mL/min. During FBCVD, the relationship between the deposition rate and Ar dilution gas flow rate can be obtained from the average thickness of the SiO2 layers measured from the cross-section backscattered images using ImageJ software (shown in Figure 2g). The deposition rate for SiO2 layers on the Fe–Si substrate particle surface initially increased from 2.20 (200 mL/min) to 9.70 nm/min (250 mL/min) and subsequently decreased to 2.68 nm/min (300 mL/min) after the integrated Fe–Si/SiO2 core/shell heterostructure formed.
Figure 3a shows the SEM and EDS results of Fe–Si/SiO2 soft magnetic composites sintered from the Fe–Si/SiO2 composite particles deposited at an Ar dilution gas flow rate of 250 mL/min. A backscattered electron is sensitive to the mean atomic number of the material: the larger the mean atomic number, the brighter the corresponding backscattered electron image. The elemental distribution signal shows that the Fe element was mainly concentrated in the inner Fe–Si particle area. The O element was distributed at the interface between the Fe–Si particles, indicating that the Fe–Si/SiO2 soft magnetic composites featured a core/shell heterostructure with a SiO2 layer shell and an Fe–Si-particle core. The detected backscattered high-energy electrons in Figure 3c–h indicate the evolution of the cross-section morphology for the Fe–Si/SiO2 soft magnetic composites from an Ar dilution gas flow rate of 125–350 mL/min. The Fe–Si compacts in Figure 3b showed a smooth polished surface without defects or air gaps, indicating a high density and mechanical strength. However, the uneven SiO2 layers with several pores can be observed in the cross-sections of Fe–Si/SiO2 soft magnetic composites deposited at an Ar dilution gas flow rate of 125 mL/min. A small portion of the interface between the Fe–Si particles became difficult to distinguish. The uniformity, continuity, and average thickness of SiO2 layers increased and the interface between the Fe–Si particles became more distinct when the Ar dilution gas flow rate increased from 125 to 250 mL/min. However, with increase in the Ar dilution gas flow rate from 300 to 350 mL/min, the inhomogeneous phenomenon of SiO2 layers reappeared. Furthermore, the mean thickness of the SiO2 layers decreased.

3.2. Influential Mechanism of the Ar-Dilution Gas Flow Rate

Based on the typical fluidisation behaviour of Geldart-B particles [20], the gas flow rate (VAr) of Ar gas, which contacts with the Fe–Si substrate particles, and the initial fluidisation velocity (VFe(Si))) of Fe–Si substrate particles can be expressed as follows:
V A r = ( V A r 1 + V A r 2 ) × 10 6 60 × π r 2
V F e ( S i ) = d 2 ( ρ F e ( S i ) ρ A r ) g 1650 × μ A r ,
where VAr1 and VAr2 are the flow rates of the Ar dilution and carrier gases, respectively (mL/min). r is the radius of the stainless steel strainer (m); d is the particle size of the Fe–Si substrate particles (m); ρFe(Si) and ρAr are the densities of Fe–Si substrate particles and Ar gas, respectively (kg/m3); g is the acceleration because of gravity (N/kg); and μAr is the viscosity of Ar gas (Pa·s). To maintain Fe–Si substrate particles in a fluidised condition during FBCVD, the VAr should exceed VFe(Si). Figure 4 shows the schematic of the possible influential mechanism of the Ar-dilution gas flow rate on the microscopic appearances of Fe–Si/SiO2 composite particles. In this study, the gasflow status in the reaction during FBCVD was determined by the flow rate of the Ar dilution gas. Under the condition that the partial pressure of the gaseous SiO2 precursor was maintained constant in the experimental system, the Ar-dilution gas flow rate corresponded to a variation in gasflow boundary layer thickness. The SiO2 layers on the Fe–Si/SiO2 composite particle surface changed with the flow rate of the Ar dilution gas as follows.
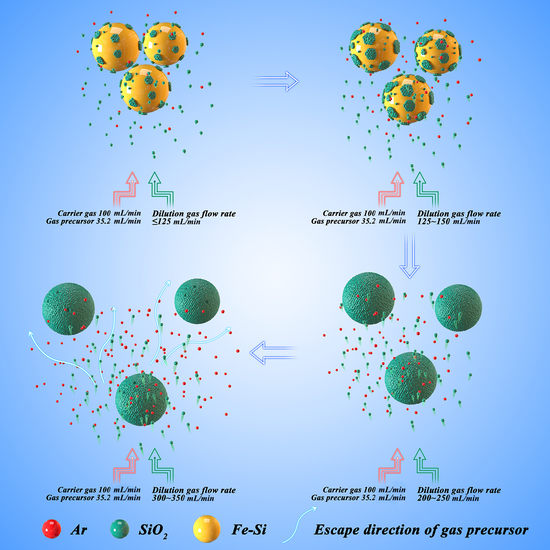
  • When the Ar dilution gas flow is relatively low (125 mL/min), the dynamic viscosity of Ar gas increases with the reaction temperature, although VAr before the reaction is greater than VFe(Si). The Fe–Si substrate particles cannot continue to maintain fluidisation and the gas SiO2 precursor contacts with the partial surface of accumulated Fe–Si substrate particles. At this stage, the SiO2 deposition presents submicron clusters.
  • As the Ar dilution gas flow rate increases to 150 mL/min, the Fe–Si substrate particles break away from the state of being unable to fluidise because of high temperature, and the gas SiO2 precursor passes through the substrate particles. However, the content of the gas SiO2 precursor in the reaction system is less because of the low flow rate of the Ar dilution gas. The submicron SiO2 clusters transition towards incomplete and uneven SiO2 layers. Simultaneously, the deposition rate of the SiO2 layers drops.
  • When the Ar-dilution gas flow rate increases to some extent (200 and 250 mL/min), the Ar dilution gas can maintain the Fe–Si substrate particles in a fluidised suspension motion despite the increase in temperature during the deposition reaction. The gaseous SiO2 precursor is uniformly distributed on the surface of the Fe–Si substrate particles. According to the theory of sedimentary process [21], Ar gas functions as a carrier and dilute gas precursor, belonging to quality transport control. The diffusion resistance of the gaseous SiO2 precursor through the gasflow boundary layer decreases with in the increasing Ar-dilution gas flow rate. Thus, the number of gas–solid collisions and the reaction rate at the gas–solid interface are increased by decreasing the occurrence of homogenous gas-nucleation reactions before contact with the Fe–Si substrate particle surface. As the Ar dilution gas flow rate increases, the SiO2 layer deposition rate increases. SiO2 layers exist in the form of a coated film.
  • However, as the Ar-dilution gas flow rate continues to increase (300 and 350 mL/min), the excessive Ar dilution gas flow, at this time, reduces the diffusion resistance of the gaseous SiO2 precursor, the retention time of the gaseous SiO2 precursor in the vertical tube furnace, and the effective reaction time with the Fe–Si substrate particle surface. Certain gaseous SiO2 precursors are expelled with the Ar dilution gas prior to deposition, and the high gas flow rate will reduce the temperature around the Fe–Si substrate particles. The deposition rate of the SiO2 layer at this Ar-dilution gas flow rate decreases owing to the reduced reaction rate at the gas–solid interface. Thus, surface defects, such as holes, appear in the SiO2 layers.

3.3. Crystal Structure Evolution during HPS

Figure 5a shows the XRD pattern of the Fe–Si/SiO2 composite particles deposited at a Ar carrier gas flow rate of 250 mL/min. The observed peaks at 44.8°, 65.2°, and 82.6° indexed as (110), (200), and (211) agree with the α-Fe(Si) solid-solution (JCPDS file No. 3-065-6323). One extra amorphous peak arose at ~22°, indicating that the SiO2 layer is amorphous. An ultra-low intensity diffraction peak located at 26.6° appeared in the Fe–Si/SiO2 soft magnetic composites (Figure 5b), corresponding to the (011) plane of the SiO2 crystal phase (JCPDS file No. 1-070-2517). The results show that SiO2 layers crystallised during HPS. Furthermore, the XRD experimental results were refined using Fullprof to estimate the effect of the crystallisation of amorphous SiO2 layers on the crystal structure of the Fe–Si substrate particles [22]. Table 1 lists the crystal refinement data. The low values for Rwp (weighted peak residual variance factor), Rp (peak residual variance factor), and S (fitting degree) indicate that the Rietveld calculations are consistent with the experimental results. The additional SiO2 crystal phase in the Fe–Si/SiO2 soft magnetic composites was arranged in a hexagonal crystal structure, in which the ratio of the vertical cell (c) to the bottom cell (a) parameters was 1.368. Herein, the experimental conditions were maintained in the thermodynamically stable region of tridymite (monoclinic system); however, this contradicts the XRD results. This phenomenon can be interpreted using Ostwald’s step rule [23,24], which states that the beta-cristobalite mesophase (hexagonal system) appears during the transformation from amorphous SiO2 to the thermodynamic-stable phase (quartz or tridymite). However, the amorphous SiO2 first converted to beta-cristobalite, and then to quartz or tridymite. The long-term and stable existence of beta-cristobalite is attributed to the different rate constants of these two reactions. The rate constant of the former reaction is larger than that of the latter reaction. In the above-mentioned two reactions, the new phase is formed via the destruction and reconstruction of the Si–O bond, which requires high activation energy. However, in practice, the formation conditions of beta-cristobalite are benign because the free energy difference between beta-cristobalite and quartz or tridymite is low and even <10 kJ/mol with amorphous SiO2 [25]. It can be hypothesised that the dynamic disordered structure of beta-cristobalite is similar to the medium-range ordered structure of amorphous SiO2, increasing the reaction rate of the transformation from amorphous SiO2 to beta-cristobalite. Therefore, the crystalline structure of beta-cristobalite can be detected rather than that of the thermodynamically stable tridymite after amorphous SiO2 crystallisation occurring at the temperature range in this study. However, cell parameters (a = b = c = 2.859 Å) of the body-centred cubic α-Fe(Si) phase in the Fe–Si/SiO2 soft magnetic composites are almost identical to those in the Fe–Si/SiO2 composite particles. The schematic of the crystal structure of Fe–Si/SiO2 composite particles and soft magnetic composites were drawn using Vesta [26] based on the structural parameters, after refinement in Figure 5c. The results show that the crystallisation of SiO2 layers can occur during HPS but does not influence the crystal structure of Fe–Si substrate particles. To demonstrate the thermal effect and temperature range for the crystallisation of SiO2 layers, Figure 5d shows the DSC curve and the relative crystallinity as a function of the temperature of Fe–Si/SiO2 composite particles. The DSC result shows that the SiO2 layers transformed from the amorphous to the beta-cristobalite state between 1149.45 K and 1280.75 K. Furthermore, the crystallinity of Fe–Si/SiO2 composite particles rose before 1226.05 K, which is attributed to the increase in crystal nuclei number. Then, with an increase in temperature, the crystallisation rate curve tended to be relatively flat and became smooth at 1280.75 K.

3.4. Magnetic Behaviour of Fe–Si/SiO2 Soft Magnetic Composites

Figure 6 shows the magnetic hysteresis curves of Fe–Si compacts and Fe–Si/SiO2 soft magnetic composites sintered from the composite particles deposited at different Ar-dilution gas flow rates. The saturation magnetisation and the coercivity of Fe–Si compacts reached 195.9 emu/g and 11 Oe, respectively. However, all saturation magnetisation values decreased in Fe–Si/SiO2 soft magnetic composites compared with Fe–Si compacts, and the saturation magnetisation of Fe–Si/SiO2 soft magnetic composites initially decreased and then increased with the increase in the Ar-dilution gas flow rate, thus exhibiting a trend opposite to that of the deposition rate of the SiO2 layers. This trend is attributed to the Fe–Si/SiO2 soft magnetic composites, which are equivalent to the introduction of non-magnetic SiO2 into the Fe–Si compacts, wherein the number of non-magnetic SiO2 first increased and then decreased with the increase in the Ar-dilution gas flow rate, thus varying the magnetic moment ratio of magnetic materials. Therefore, during FBCVD, Fe–Si/SiO2 soft magnetic composites with different saturation magnetisation values can be obtained by controlling the Ar-dilution gas flow rate. However, the coercivity of magnetic materials is an inherent property influenced by the number and strength of magnetic dipole moments and the interaction between adjacent magnetic domains. No difference was observed between the Fe–Si/SiO2 soft magnetic composites and the Fe–Si compacts, indicating that the non-magnetic SiO2 layers and Fe–Si/SiO2 core–shell structures affected the magnetic domain.
Figure 7 shows the measured results of the bulk material’s electrical resistivity for Fe–Si compacts and Fe–Si/SiO2 soft magnetic composites. According to the permeability theory, the introduction of SiO2 layers with high resistivity (1011–1013 μΩ·cm) into the Fe–Si compacts will increase the distance between conductive Fe–Si particles and destroy the continuous and dense conductive network formed by the conductive Fe–Si particles, thereby increasing the electron tunnelling barrier and reducing the electron tunnelling probability. Therefore, all Fe–Si/SiO2 soft magnetic composites had higher electrical resistivity values than the Fe–Si compacts (Figure 7). The electrical resistivity of Fe–Si/SiO2 soft magnetic composites increased before 150 mL/min, followed by a rapid increase between 150 and 250 mL/min and then decreased. This result can be explained by combining with the possible influential mechanism of the Ar-dilution gas flow rate on the microstructure of Fe–Si/SiO2 composite particles (Figure 4). The electrical resistivity of Fe–Si/SiO2 soft magnetic composites was affected by contact with the conductive Fe–Si particles and the distance between conductive Fe–Si particles. SiO2 is deposited on the surface of Fe–Si substrate particles in the form of molecules, one by one, during FBCVD. SiO2 deposition on the surface of Fe–Si substrate particles is accompanied by several surface defects when the Ar dilution gas flow is relatively low; thus, the conductive Fe–Si particles can directly contact and generate a slow increase in electrical resistivity. SiO2 layers existed in the form of a complete film as the Ar-dilution gas flow rate increased to 150 mL/min. The vacancies filled up, and the conductive Fe–Si particles were no longer contacted. However, the distance between Fe–Si particles increased with the increasing thickness of the SiO2 layer; thus, the electrical resistivity rapidly increased. However, because the Ar-dilution gas flow rate continued to increase, the surface defects, such as holes, appeared in SiO2 layers and the conductive Fe–Si particle contact; thus, the electrical resistivity began to decrease.
The total core loss (Wcv, W/kg) was a magnetic parameter for the Fe–Si compacts and Fe–Si/SiO2 soft magnetic composites used in the power application. Table 2 lists Wcv measured at 10 mT and 50–200 kHz for the Fe–Si compacts and Fe–Si/SiO2 soft magnetic composites deposited at various Ar-dilution gas flow rates. With increasing measurement frequency and maximum magnetic flux density, Wcv demonstrated a persistent increasing trend for the Fe–Si/SiO2 soft magnetic composites. Moreover, we observed that the Wcv of Fe–Si/SiO2 soft magnetic composites decreased slowly as the Ar-dilution gas flow rate increased and then rapidly decreased and finally increased. When the Ar-dilution gas flow rate reached 250 mL/min, the Wcv of Fe–Si/SiO2 soft magnetic composites was 215.7 W/kg, which was 51.0% lower than the Fe–Si compacts at 200 kHz. This can be attributed to the superior resistivity of the SiO2 layer, limiting eddy current losses at high frequencies.

4. Conclusions

FeSi/SiO2 soft magnetic composites were fabricated via FBCVD and HPS technologies. The mechanism of the microstructural evolution of SiO2 layers, under a series of Ar-dilution gas flow rates and its effect on magnetic properties of Fe–Si/SiO2 soft magnetic composites, was examined. The results in this study can be summarized as follows.
  • With an increase in the Ar-dilution gas flow rate from 125 to 350 mL/min during FBCVD, SiO2 deposited on the Fe–Si substrate particle surface presented the microscopic characteristics of “sub-micron SiO2 clusters (125 mL/min) → incomplete SiO2 layers (150 mL/min) → complete SiO2 film (200 and 250 mL/min) → porous SiO2 film (300 and 350 mL/min)”.
  • The dynamic disordered structure of beta-cristobalite was similar to the medium-range ordered structure of amorphous SiO2, increasing the reaction rate of the transformation from amorphous SiO2 to beta-cristobalite. Thus, SiO2 layers transformed from the amorphous to the beta-cristobalite state with a hexagonal crystal structure at 1226.05 K during HPS. However, the crystallisation of SiO2 layers did not affect the crystal structure of Fe–Si substrate particles.
  • The saturation magnetisation of Fe–Si/SiO2 soft magnetic composites initially decreased and then increased with increasing Ar-dilution gas flow rate. The electrical resistivity of Fe–Si/SiO2 soft magnetic composites slowly increased before 150 mL/min, followed by a rapid increase, between 150 and 250 mL/min, and then decreased while the total core loss exhibited the opposite trend. The lowest total core loss value (215.7 W/kg) was observed at the Ar-dilution gas flow rate of 250 mL/min.
The results pave the way for the efficient production of the Fe–Si/inorganic-oxide soft magnetic composites and provide a certain basis for improving FBCVD technology.

Supplementary Materials

The following are available online at https://www.mdpi.com/article/10.3390/cryst11080963/s1. Figure S1: Surface morphology, partial enlargement morphology, and cross-sectional morphology of Fe–Si substrate particles.

Author Contributions

Conceptualization, Z.W. and H.K.; methodology, Z.W.; software, Z.G.; validation, J.J.; investigation, Z.G. and J.J.; writing—original draft preparation, Z.W. and J.J.; writing—review and editing, M.L.; visualization, Q.Z.; project administration, M.L. All authors have read and agreed to the published version of the manuscript.

Funding

This work was supported by the Chinese National Science Foundation (grant number 51904002), Natural Science Foundation of Anhui Province (grant number 1908085QE190), Research Project of Education Department of Anhui Province (grant number KJ2019A0077), National Engineering Research Center of Powder Metallurgy of Titanium & Rare Metals Foundation (grant number 2019001), and Anhui special support plan (grant number T000609).

Institutional Review Board Statement

Not applicable.

Informed Consent Statement

Not applicable.

Data Availability Statement

The data presented in this study are available within the article.

Acknowledgments

The authors would like to thank Chunhua Duan from Shiyanjia Lab. (www.shiyanjia.com) for the XRD Rietveld refinement.

Conflicts of Interest

The authors declare no conflict of interest.

References

  1. Shokrollahi, H.; Janghorban, K. Soft magnetic composite materials (SMCs). J. Mater. Process. Technol. 2007, 189, 1–12. [Google Scholar] [CrossRef]
  2. Vijayakumar, K.; Thiagarajan, Y.; Rajendirakumar, R.; Basanth, A.J.; Karthikeyan, R.; Kannan, S. Development of an iron powder metallurgy soft magnetic composite core switched reluctance motor. Mater. Today Proc. 2021, 41, 1195–1201. [Google Scholar]
  3. Talaat, A.; Suraj, M.V.; Byerly, K.; Wang, A.; Wang, Y.; Lee, J.K.; Ohodnicki, P.R. Review on soft magnetic metal and inorganic oxide nanocomposites for power applications. J. Alloys Compd. 2021, 870, 159500. [Google Scholar] [CrossRef]
  4. Svensson, L.; Frogner, K.; Jeppsson, P.; Cedell, T.; Andersson, M. Soft magnetic moldable composites: Properties and applications. J. Magn. Magn. Mater. 2012, 324, 2717–2722. [Google Scholar] [CrossRef]
  5. Wu, Z.; Fan, X.; Jian, W.; Li, G.; Zhang, Z. Core loss reduction in Fe–6.5 wt.%Si/SiO2 core–shell composites by ball milling coating and spark plasma sintering. J. Alloys Compd. 2014, 617, 21–28. [Google Scholar] [CrossRef]
  6. Gheisari, K.; Javadpour, S.; Shokrollahi, H.; Hashemi, B. Magnetic losses of the soft magnetic composites consisting of iron and Ni–Zn ferrite. J. Magn. Magn. Mater. 2008, 320, 1544–1548. [Google Scholar] [CrossRef]
  7. Clapsaddle, B.J.; Gash, A.E.; Satcher, J.H.; Simpson, R.L. Silicon oxide in an iron(III) oxide matrix: The sol–gel synthesis and characterization of Fe–Si mixed oxide nanocomposites that contain iron oxide as the major phase. J. Non-Cryst. Solids 2003, 331, 190–201. [Google Scholar] [CrossRef]
  8. Zhou, B.; Dong, Y.; Chi, Q.; Zhang, Y.; Chang, L.; Gong, M.; Huang, J.; Pan, Y.; Wang, X. Fe-based amorphous soft magnetic composites with SiO2 insulation coatings: A study on coatings thickness, microstructure and magnetic properties. Ceram. Int. 2020, 46, 13449–13459. [Google Scholar] [CrossRef]
  9. Aizawa, T.; Ito, M.; Kihara, J. Acoustic diagnosis for nondestructive evaluation of ceramic coatings on the steel substrates. Am. Soc. Mech. Eng. 1995, 302, 257–270. [Google Scholar]
  10. Wu, Z.Y.; Jiang, Z.; Fan, X.A.; Zhou, L.J.; Wang, W.L.; Xu, K. Facile synthesis of Fe-6.5wt%Si/SiO2 soft magnetic composites as an efficient soft magnetic composite material at medium and high frequencies. J. Alloys Compd. 2018, 742, 90–98. [Google Scholar] [CrossRef]
  11. Liu, L.; Liao, X.W.; Jia, J.X.; Kong, H.; Fan, X.A.; Wu, Z.Y.; Wang, X.S. Temperature-controlled conversion from Fe–Si particles to integrated Fe–Si/SiO2 core–shell structure particles during fluidised bed chemical vapour deposition. Ceram. Int. 2020, 46, 3059–3065. [Google Scholar] [CrossRef]
  12. Labropoulos, A.I.; Romanos, G.E.; Karanikolos, G.N.; Katsaros, F.K.; Kakizis, N.K.; Kanellopoulos, N.K. Comparative study of the rate and locality of silica deposition during the CVD treatment of porous membranes with TEOS and TMOS. Microporous Mesoporous Mater. 2009, 120, 177–185. [Google Scholar] [CrossRef]
  13. Baux, A.; Jacques, S.; Allemand, A.; Vignoles, G.L.; David, P.; Piquero, T.; Stempin, M.P.; Chollon, G. Complex geometry macroporous SiC ceramics obtained by 3D-printing, polymer impregnation and pyrolysis (PIP) and chemical vapor deposition (CVD). J. Eur. Ceram. Soc. 2021, 41, 3274–3284. [Google Scholar] [CrossRef]
  14. Bain, M.F.; Low, Y.H.; Bien, D.C.S.; Montgomery, J.H.; Armstrong, B.M.; Gamble, H.S. Investigation into the selectivity of CVD iron from Fe(CO)5 precursor on various metal and dielectric patterned substrates. Surf. Coat. Technol. 2007, 201, 8998–9002. [Google Scholar] [CrossRef]
  15. Vlasenko, V.G.; Zubkov, S.V.; Shuvaeva, V.A.; Abdulvakhidov, K.G.; Shevtsova, S.I. Crystal structure and dielectric properties of aurivillius phases A 0.5 Bi 4.5 B 0.5 Ti 3.5 O 15 ( A = Na, Ca, Sr, Pb; B = Cr, Co, Ni, Fe, Mn, Ga). Physics Solid State 2014, 56, 1554–1560. [Google Scholar] [CrossRef]
  16. Zhang, S.; Hattori, N.; Enomoto, M.; Tarui, T. Ferrite Nucleation at Ceramic/Austenite Interfaces. ISIJ Int. 1996, 36, 1301–1309. [Google Scholar] [CrossRef]
  17. Bertrand, N.; Maury, F.; Duverneuil, P. SnO2 coated Ni particles prepared by fluidized bed chemical vapor deposition. Surf. Coat. Technol. 2006, 200, 6733–6739. [Google Scholar] [CrossRef] [Green Version]
  18. Cadoret, L.; Rossignol, C.; Dexpert-Ghys, J.; Caussat, B. Chemical vapor deposition of silicon nanodots on TiO2 submicronic powders in vibrated fluidized bed. Mater. Sci. Eng. B 2010, 170, 41–50. [Google Scholar] [CrossRef] [Green Version]
  19. Ma, L.; Chen, A.; Lu, J.; Zhang, Z.; He, H.; Li, C. In situ synthesis of CNTs/Fe–Ni/TiO2 nanocomposite by fluidized bed chemical vapor deposition and the synergistic effect in photocatalysis. Particuology 2014, 14, 24–32. [Google Scholar] [CrossRef]
  20. Amarasinghe, W.S.; Jayarathna, C.K.; Ahangama, B.S.; Tokheim, L.A.; Moldestad, B.M.E. Experimental Study and CFD Modelling of Minimum Fluidization Velocity for Geldart A, B and D Particles. Int. J. Modeling Optim. 2017, 7, 152–156. [Google Scholar] [CrossRef] [Green Version]
  21. Grabke, H.J.; Moszynski, D.; Müller-Lorenz, E.; Schneider, A. Role on sulfur in carburization, carbide formation and metal dusting on iron. Surf. Interface Anal. 2010, 34, 369–374. [Google Scholar] [CrossRef]
  22. Frontera, C.; Rodríguez-Carvajal, J. FullProf as a new tool for flipping ratio analysis: Further improvements. Phys. B Condens. Matter 2004, 350, E731–E733. [Google Scholar] [CrossRef]
  23. Nordeng, S.H.; Sibley, D.F. Dolomite stoichiometry and Ostwald’s Step Rule. Geochim. Cosmochim. Acta 1994, 58, 191–196. [Google Scholar] [CrossRef]
  24. Morse, J.W.; Casey, W.H. Ostwald processes and mineral paragenesis in sediments. Am. J. Sci. 1988, 288, 537–560. [Google Scholar] [CrossRef]
  25. Berman, R.G. Internally-Consistent Thermodynamic Data for Minerals in the System Na2O-K2O-CaO-MgO-FeO-Fe2O3-Al2O3-SiO2-TiO2-H2O-CO2. J. Petrol. 1988, 29, 445–522. [Google Scholar] [CrossRef]
  26. Momma, K.; Izumi, F. VESTA: A three-dimensional visualization system for electronic and structural analysis. J. Appl. Crystallogr. 2008, 41, 653–658. [Google Scholar] [CrossRef]
Figure 1. (a) SEM morphology of Fe–Si/SiO2 composite particles deposited at an Ar dilution gas flow rate of 250 mL/min and elemental distribution images of Fe (b), Si (c), and O (d).
Crystals 11 00963 g001
Figure 2. Surface morphology, partial enlargement morphology, and cross-sectional morphology of Fe–Si/SiO2 composite particles deposited at 125 (a), 150 (b), 200 (c), 250 (d), 300 (e), and 350 (f) mL/min Ar-dilution gas flow rate; (g) SiO2 layer deposition rate of particles prepared at various Ar-dilution gas flow rates.
Crystals 11 00963 g002
Figure 3. (a) EDS Fe, Si and O maps of Fe–Si/SiO2 soft magnetic composites deposited at an Ar-dilution gas flow rate of 250 mL/min. Backscattered electron images of Fe–Si compacts (b) and Fe–Si/SiO2 soft magnetic composites deposited at an Ar-dilution gas flow rate of (c) 125, (d) 150, (e) 200, (f) 250, (g) 300, and (h) 350 mL/min.
Crystals 11 00963 g003
Figure 4. Schematic of a possible influential mechanism of the Ar-carrier gas flow rate on the microscopic appearances of Fe–Si/SiO2 composite particles.
Crystals 11 00963 g004
Figure 5. Rietveld refinement patterns of XRD data for (a) Fe–Si/SiO2 composite particles and (b) soft magnetic composites; (c) schematics of the crystal structure of Fe–Si/SiO2 composite particles and soft magnetic composites; (d) DSC curves and relative crystallinity, as a function of temperature, for Fe–Si/SiO2 composite particles.
Crystals 11 00963 g005
Figure 6. Magnetic hysteresis and partial enlarged curves of Fe–Si compacts and Fe–Si/SiO2 soft magnetic composites at different Ar-dilution gas flow rates.
Crystals 11 00963 g006
Figure 7. Bulk material’s electrical resistivity for Fe–Si compacts and Fe–Si/SiO2 soft magnetic composites.
Crystals 11 00963 g007
Table 1. Crystal refinement data of Fe–Si/SiO2 composite particles and soft magnetic composites.
Refinement ParametersPhaseCell ParametersBond Angle
RwpRpS abcαβγ
Fe–Si/SiO2 composite particles5.58%4.18%2.36Fe–Si2.8592.8592.85990.0090.0090.00
Fe–Si/SiO2 soft magnetic composites5.96%4.37%2.78Fe–Si2.8592.8592.85990.0090.0090.00
SiO25.0415.0415.25390.0090.00120.00
Table 2. Comparison of the total core loss of Fe–Si compacts and Fe–Si/SiO2 soft magnetic composites.
SamplesAr Dilution Gas Flow Rate (mL/min)Total Core Loss (W/kg)
W10/25W10/50W10/100W10/150W10/200
Fe–Si compacts019.854.6151.4274.1423.2
Fe–Si/SiO2 composite compacts12519.553.9150.7225.5275.8
15015.642.8119215.9271.2
20013.939.1108.1197.4259.3
25011.030.783.7152.7215.7
30011.431.990.6169.5221.5
35013.938.3106.4192.1232.5
Publisher’s Note: MDPI stays neutral with regard to jurisdictional claims in published maps and institutional affiliations.

