Article

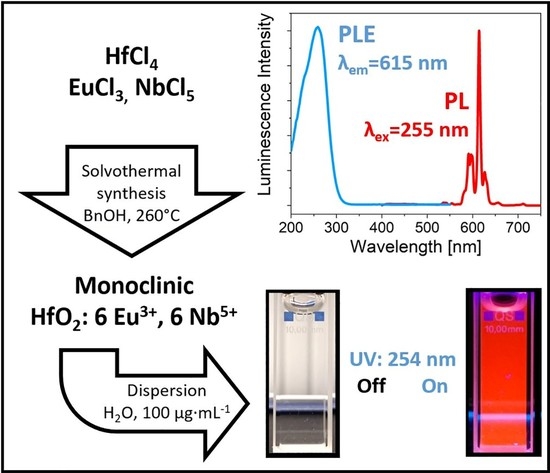
Charge Compensation in Europium-Doped Hafnia Nanoparticles: Solvothermal Synthesis and Colloidal Dispersion

by
Xavier H. Guichard
,
Francesco Bernasconi
and
Alessandro Lauria
*
Laboratory for Multifunctional Materials, Department of Materials, ETH Zürich, Vladimir-Prelog-Weg 5, 8093 Zürich, Switzerland
*
Author to whom correspondence should be addressed.
Crystals 2021, 11(9), 1042; https://doi.org/10.3390/cryst11091042
Submission received: 16 July 2021 / Revised: 18 August 2021 / Accepted: 24 August 2021 / Published: 30 August 2021
(This article belongs to the Special Issue Optical and Spectroscopic Properties of Rare-Earth-Doped Crystals)

Abstract

:
Effective charge compensation of europium in hafnium oxide nanoparticles was achieved at low temperature, allowing high doping incorporation (up to 6 at.%) and enhanced luminescence. The efficiency of the incorporation and charge compensation was confirmed by scanning electron microscope energy dispersive X-ray spectroscopy and powder X-ray diffraction measurements. Despite the known polymorphism of hafnium oxide, when doped to a concentration above 3 at.%, only the pure monoclinic phase was observed up to 6 at.% of europium. Furthermore, the low-temperature solvothermal route allowed the direct formation of stable dispersions of the synthesized material over a wide range of concentrations in aqueous media. The dispersions were studied by diffuse light scattering (DLS) to evaluate their quality and by photoluminescence to investigate the incorporation of the dopants into the lattice.

Graphical Abstract

1. Introduction

The cubic polymorph of hafnia can be stabilized at room temperature when sufficient doping with rare earth ions was achieved [1,2,3,4,5,6]. Indeed for doping levels exceeding 3 at.% the thermodynamically stable monoclinic phase of hafnium was not anymore the only favourable crystal structure, often leading to the simultaneous appearance of the cubic polymorph. A similar behaviour was also reported for zirconia with stabilization of cubic/tetragonal polymorph from 0.5 at.% on [7,8,9,10,11]. The origin of these structural modifications are attributed to the charge mismatch at the doping lattice site, and the consequent creation of defects by the substitutional doping. One proposed approach to avoid the effect of this defective dopant implies the simultaneous doping with elements with higher oxidation state than hafnium or zirconium, in order to compensate for the charge mismatch induced by the substitution of Hf4+ or Zr4+ by only trivalent RE3+ ions [2,7,9,11,12]. This strategy was successfully applied to hafnia and zirconia by using Nb5+ or Ta5+ as co-dopants and a significant improvement of the Eu3+ related emission was reported with increase ranging from 5 to 50 times [2,7,12]. However, if the dopants incorporation is not well controlled, a only partial charge compensation may occur, and indeed often the remaining cubic/tetragonal phase was reported at Eu3+ concentrations of few at.% [2,7,9,11,12,13]. It would therefore be desirable to obtain higher control over the doping incorporation, and on its effects on the crystal lattice symmetry, in order to obtain phase pure functional nanocrystals. Charge compensation was demonstrated to be effective also to improve the incorporation of functional dopants in titania synthesized by solvothermal methods, increasing the tolerance of the host toward trivalent ions [14]. Moreover, the synthetic pathways explored to produce charge compensated RE doped hafnia nanocrystals, usually imply high temperatures (above 300 °C), and further treatments at around 1000 °C, or higher, are often needed to optimise the dopant incorporation [9,11,13]. These treatments typically induce a certain degree of particle agglomeration, strongly limiting the possibility to exploit these systems to obtain stable dispersions. In fact, in order to enable easier and more versatile approaches for advanced additive manufacturing and further processing of particle-based materials, colloidal syntheses requiring lower temperatures, seem to represent a more suitable strategy.
In this work, a solvothermal synthetic approach, for the incorporation of Eu3+ ions in hafnia nanocrystals at relatively low temperatures (namely 260 °C) was studied, aiming at maximizing the light output of Eu3+ fluorescence. Moreover, the realization of stable dispersions was investigated, in the attempt to formulate high quality functional inks suitable for a wide variety of processes and applications.
The incorporation of the dopants (charge compensation and luminescence activator ions) was studied by analysing the particles photoluminescence (PL) properties. At the same time, the effects of the charge compensation on the lattice symmetry of the obtained nanocrystals was monitored by means of powder X-ray diffraction (PXRD) and scanning transmission electron microscopy (STEM) coupled with energy dispersive X-ray spectroscopy (EDX). The attribution of characteristic excitation pathways of europium in charge compensated colloidal nano-systems, compared to literature data on ZrO2, was also discussed.

2. Materials and Methods

2.1. Preparation of HfO2:Eu Dispersions

The doped HfO2 nanoparticles were prepared through a slightly modified microwave assisted solvothermal synthesis reported elsewhere [15]. Benzyl alcohol solutions of each precursor: HfCl4 1 M and EuCl3, NbCl5, TaCl5 0.1 M were prepared to be used as stock solutions. Each precursor was initially dissolved in five molar equivalents of methanol and stirred until the solution turned clear, before the final addition of solvent required to reach the desired concentration. Subsequently in a 10 mL microwave glass tube the different stock solution were mixed in the appropriate quantity to reach the desired composition with a total amount of precursor of 5 mmol. For the synthesis of hafnia with 3 at.% Eu3+, the stock solutions of HfCl4 was mixed with that of EuCl3 (485 and 150 μL, respectively) then the mixture was completed to 1.5 mL with benzyl alcohol and stirred. Finally, 2.5 mL of a 0.5M HCl solution in benzyl alcohol were used to yield to a total volume of 4 mL of clear reacting mixture. The vial was sealed with a Teflon lid and heated in a Discover SP CEM microwave (Kamp-Lintfort, Germany), with the subsequent steps 100 °C, 1 min; 200 °C, 1 min; 260 °C, 14 min. During these steps the pressure rose up to a final maximum value of 17 bars. After the synthesis, the formation of a white product was observed. The reaction mixture was then washed twice with diethyl ether and the product was collected by centrifugation (4000 rmp, 10 min). The centrifuged particles were dispersed in 5 mL of Millipore water yielding to a transparent dispersion. Part of the dispersion was dried for characterization. The particles were readily dispersible irrespective of the doping concentration and no precipitation was observed upon dilution of the particles in water.

2.2. Characterisation Methods
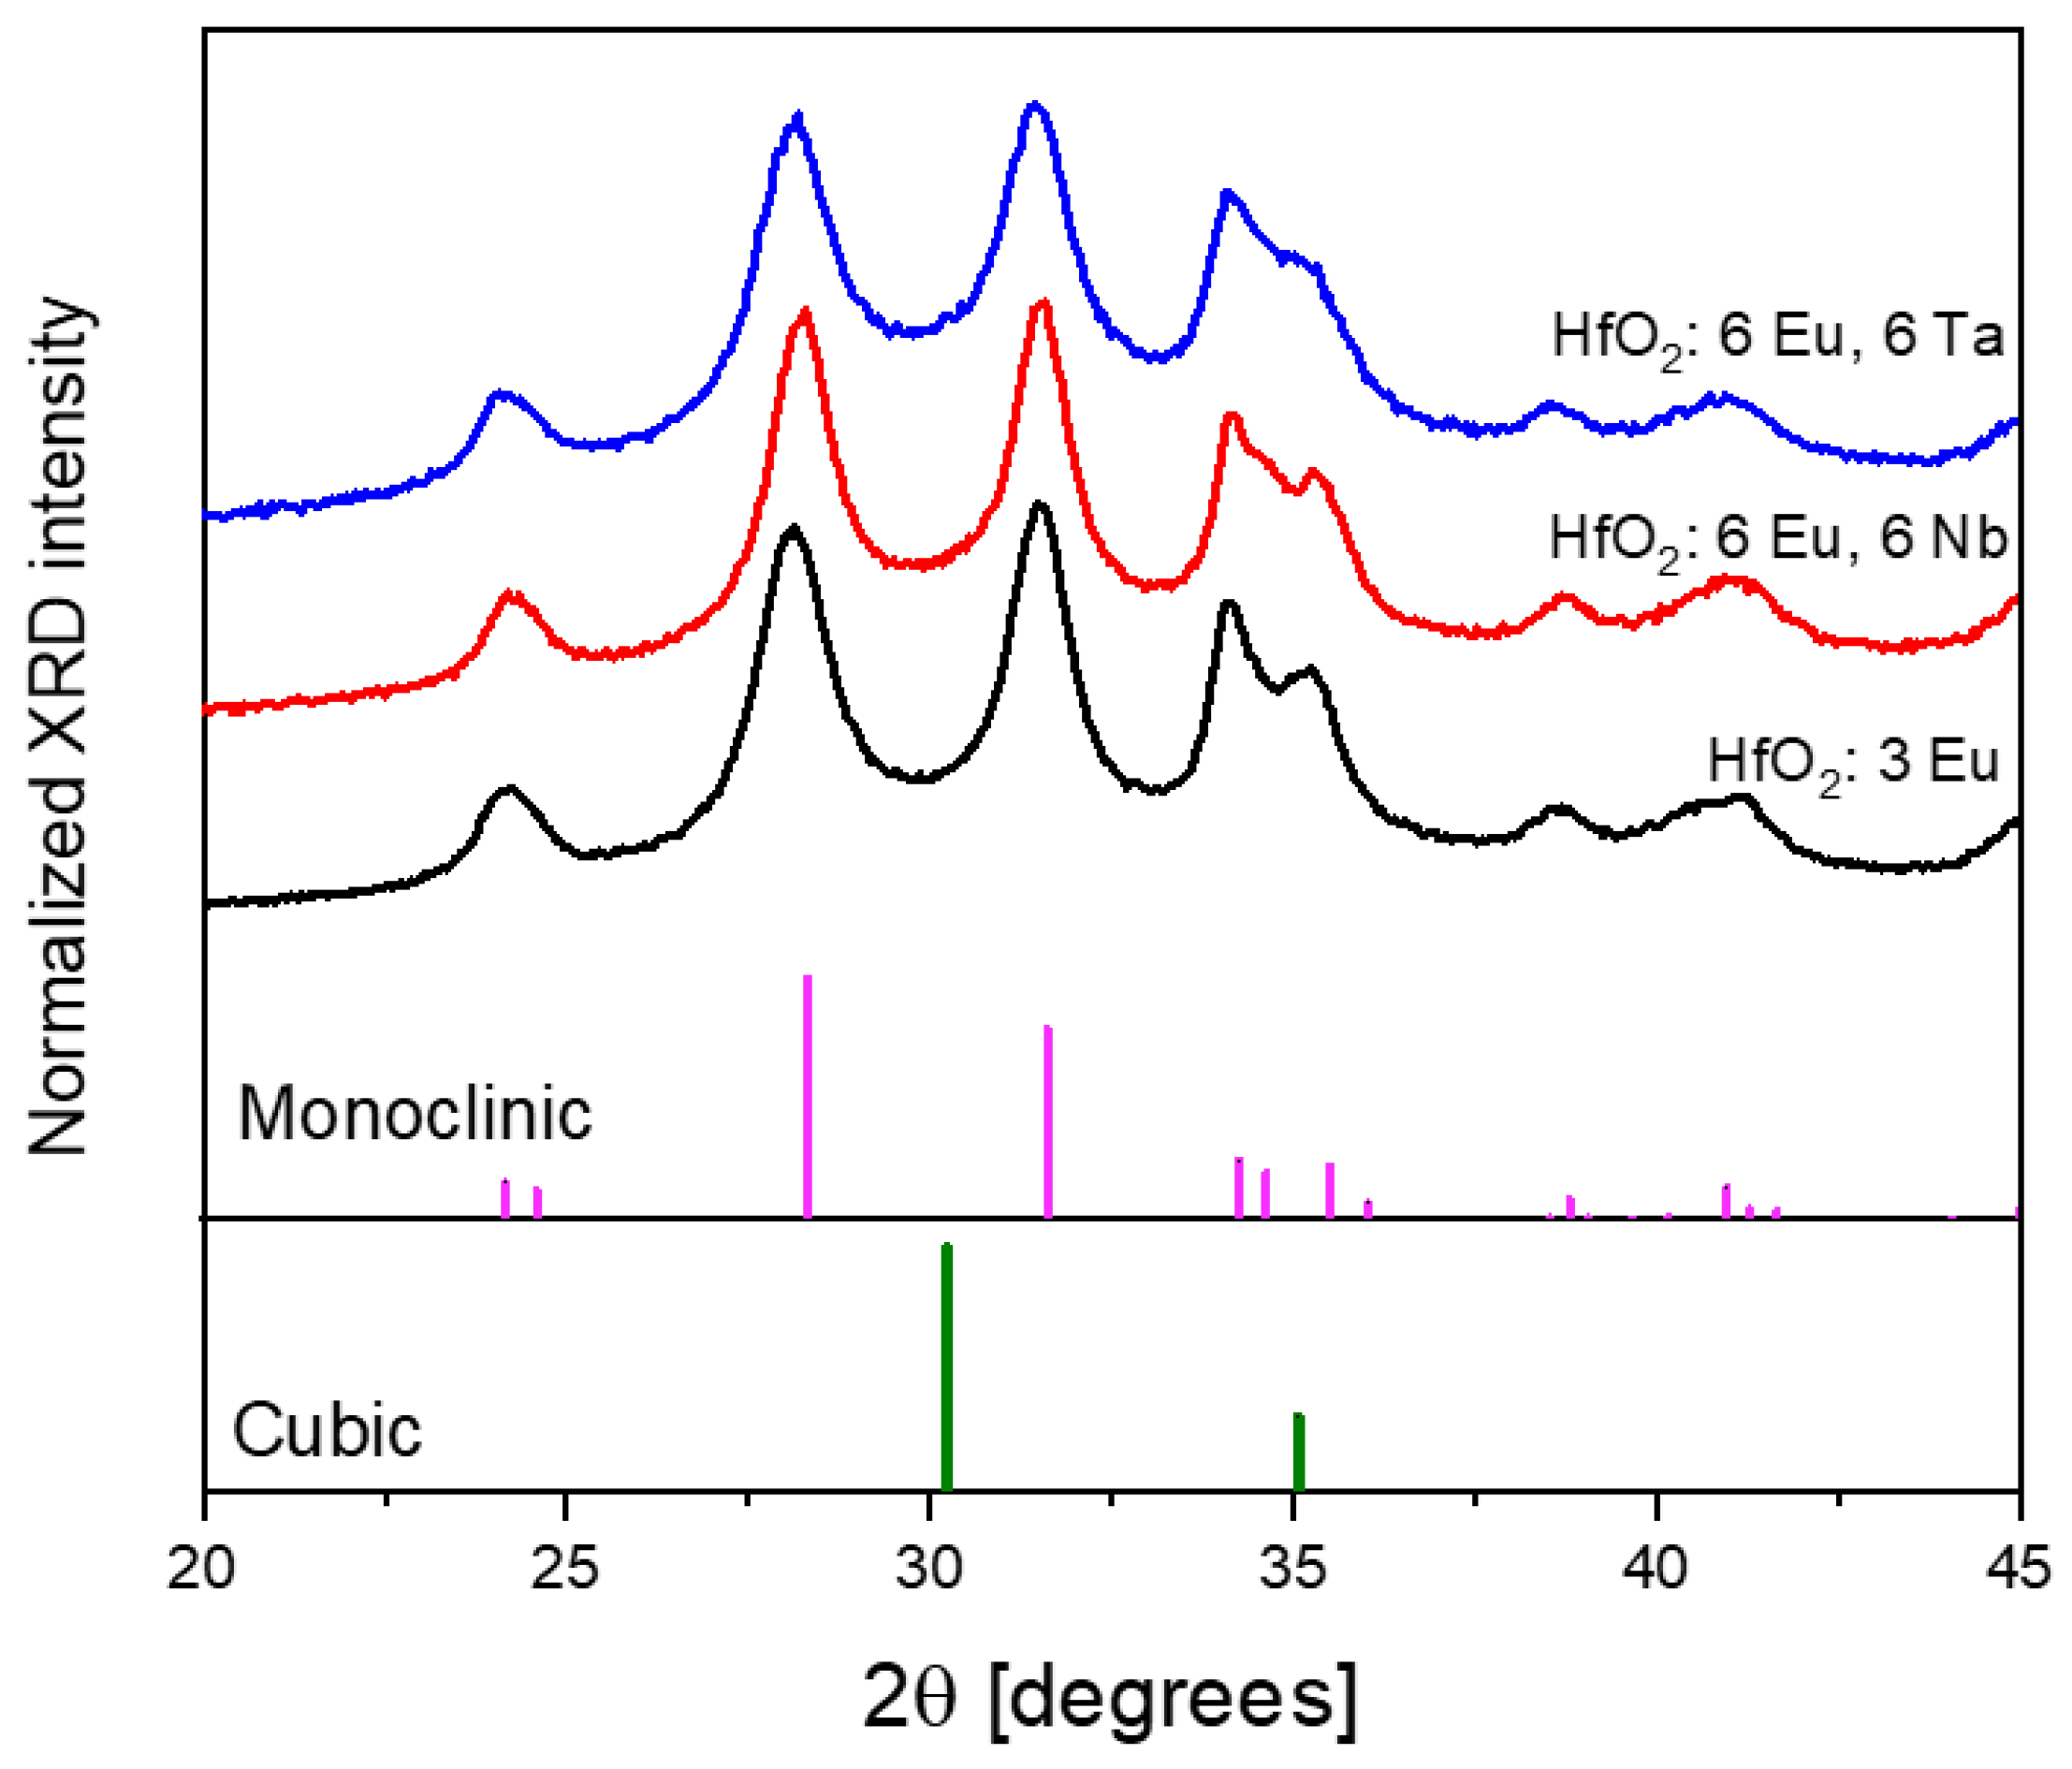
All X-ray diffraction (XRD) measurements were performed on powders in reflection mode (Cu Kα radiation at 45 kV and 40 mA) on Empyrean diffractometer from PANalytical (Almelo, Netherlands). STEM and TEM was performed on a FEI Talos F200X (ThermoFisher Scientific, Zurich, Switzerland) operated at 200 kV. STEM analyses were carried out with a bright field detector (BF STEM) and were accompanied by the high resolution energy dispersive spectroscopy (EDS) using the SuperX integrated EDS-system with four silicon drift detectors (SDDs). The EDS-STEM analyses were performed with a probe size of 0.5 nm. The samples were prepared by dropping 10 μL of water dispersion of nanocrystals (100 μg/mL) on lacey carbon Au grids. Photoluminescence (PL) and photoluminescence excitation (PLE) measurements were performed using a 90°-optical geometry Jasco FP-8500 spectrofluorometer (Tokyo, Japan). All photoluminescence measurement were collected at room temperature on water dispersions of particles in 10 × 10 mm2 quartz cuvettes (Thorlabs, Bergkirchen, Germany). Dynamic light scattering (DLS) of diluted particle water dispersions (100 μg*mL−1) was collected on a Zetasizer NS instrument (Malvern Panalytical, Malvern, UK) in backscattering mode (scattering angle 173°) at a temperature of 25 °C.

3. Results

Readily dispersible doped and co-doped HfO2 nanocrystals were obtained right after the synthesis. The initial treatments of the precursors with methanol indeed allowed a homogeneous dissolution of the precursor in benzyl alcohol, and it also prevented the formation of side products of the solvent polymerization during the forthcoming microwave reaction [16,17]. In addition, the presence of HCl in the reactive mixture proved to be essential for obtaining high quality dispersions.

3.1. Structural Analysis of the Nanocrystals

Figure 1 shows X-ray diffraction, recorded on 3 at.% Eu3+ HfO2; 6 at.% Eu3+ and 6 at.% Nd5+ HfO2; and 6 at.% Eu3+ and 6 at.% Ta5+ HfO2 nanopowder samples. The expected monoclinic structure is observed for the 3 at.% doped HfO2, as well as for the samples doped with 6 at.% of Eu3+ and charge compensated with either Ta5+ or Nb5+ showing nearly identical diffractograms, where we could not find traces of cubic phase. Besides identical crystal geometry, the samples show similar broadening of the diffraction peaks, indicating that the crystal size is little affected by the different kind and amount of dopants. In fact, the Scherrer analysis held on the (111) peak at 31.5 degrees led to quite similar values of the average crystal size for Eu doped and Eu/Nb co-doped particles, namely 8.1 and 8.5 ± 1.5 nm, respectively, while slightly smaller sizes of 7.3 ± 1.5 nm were obtained for for the Eu/Ta co-doped sample. These results are further supported by TEM investigations (see Figure S1 in the Supplementary Materials for representative micrographs of Eu/Nb co-doped HfO2) where nanocrystals with diameters ranging between 5 and 10 nm could be observed.

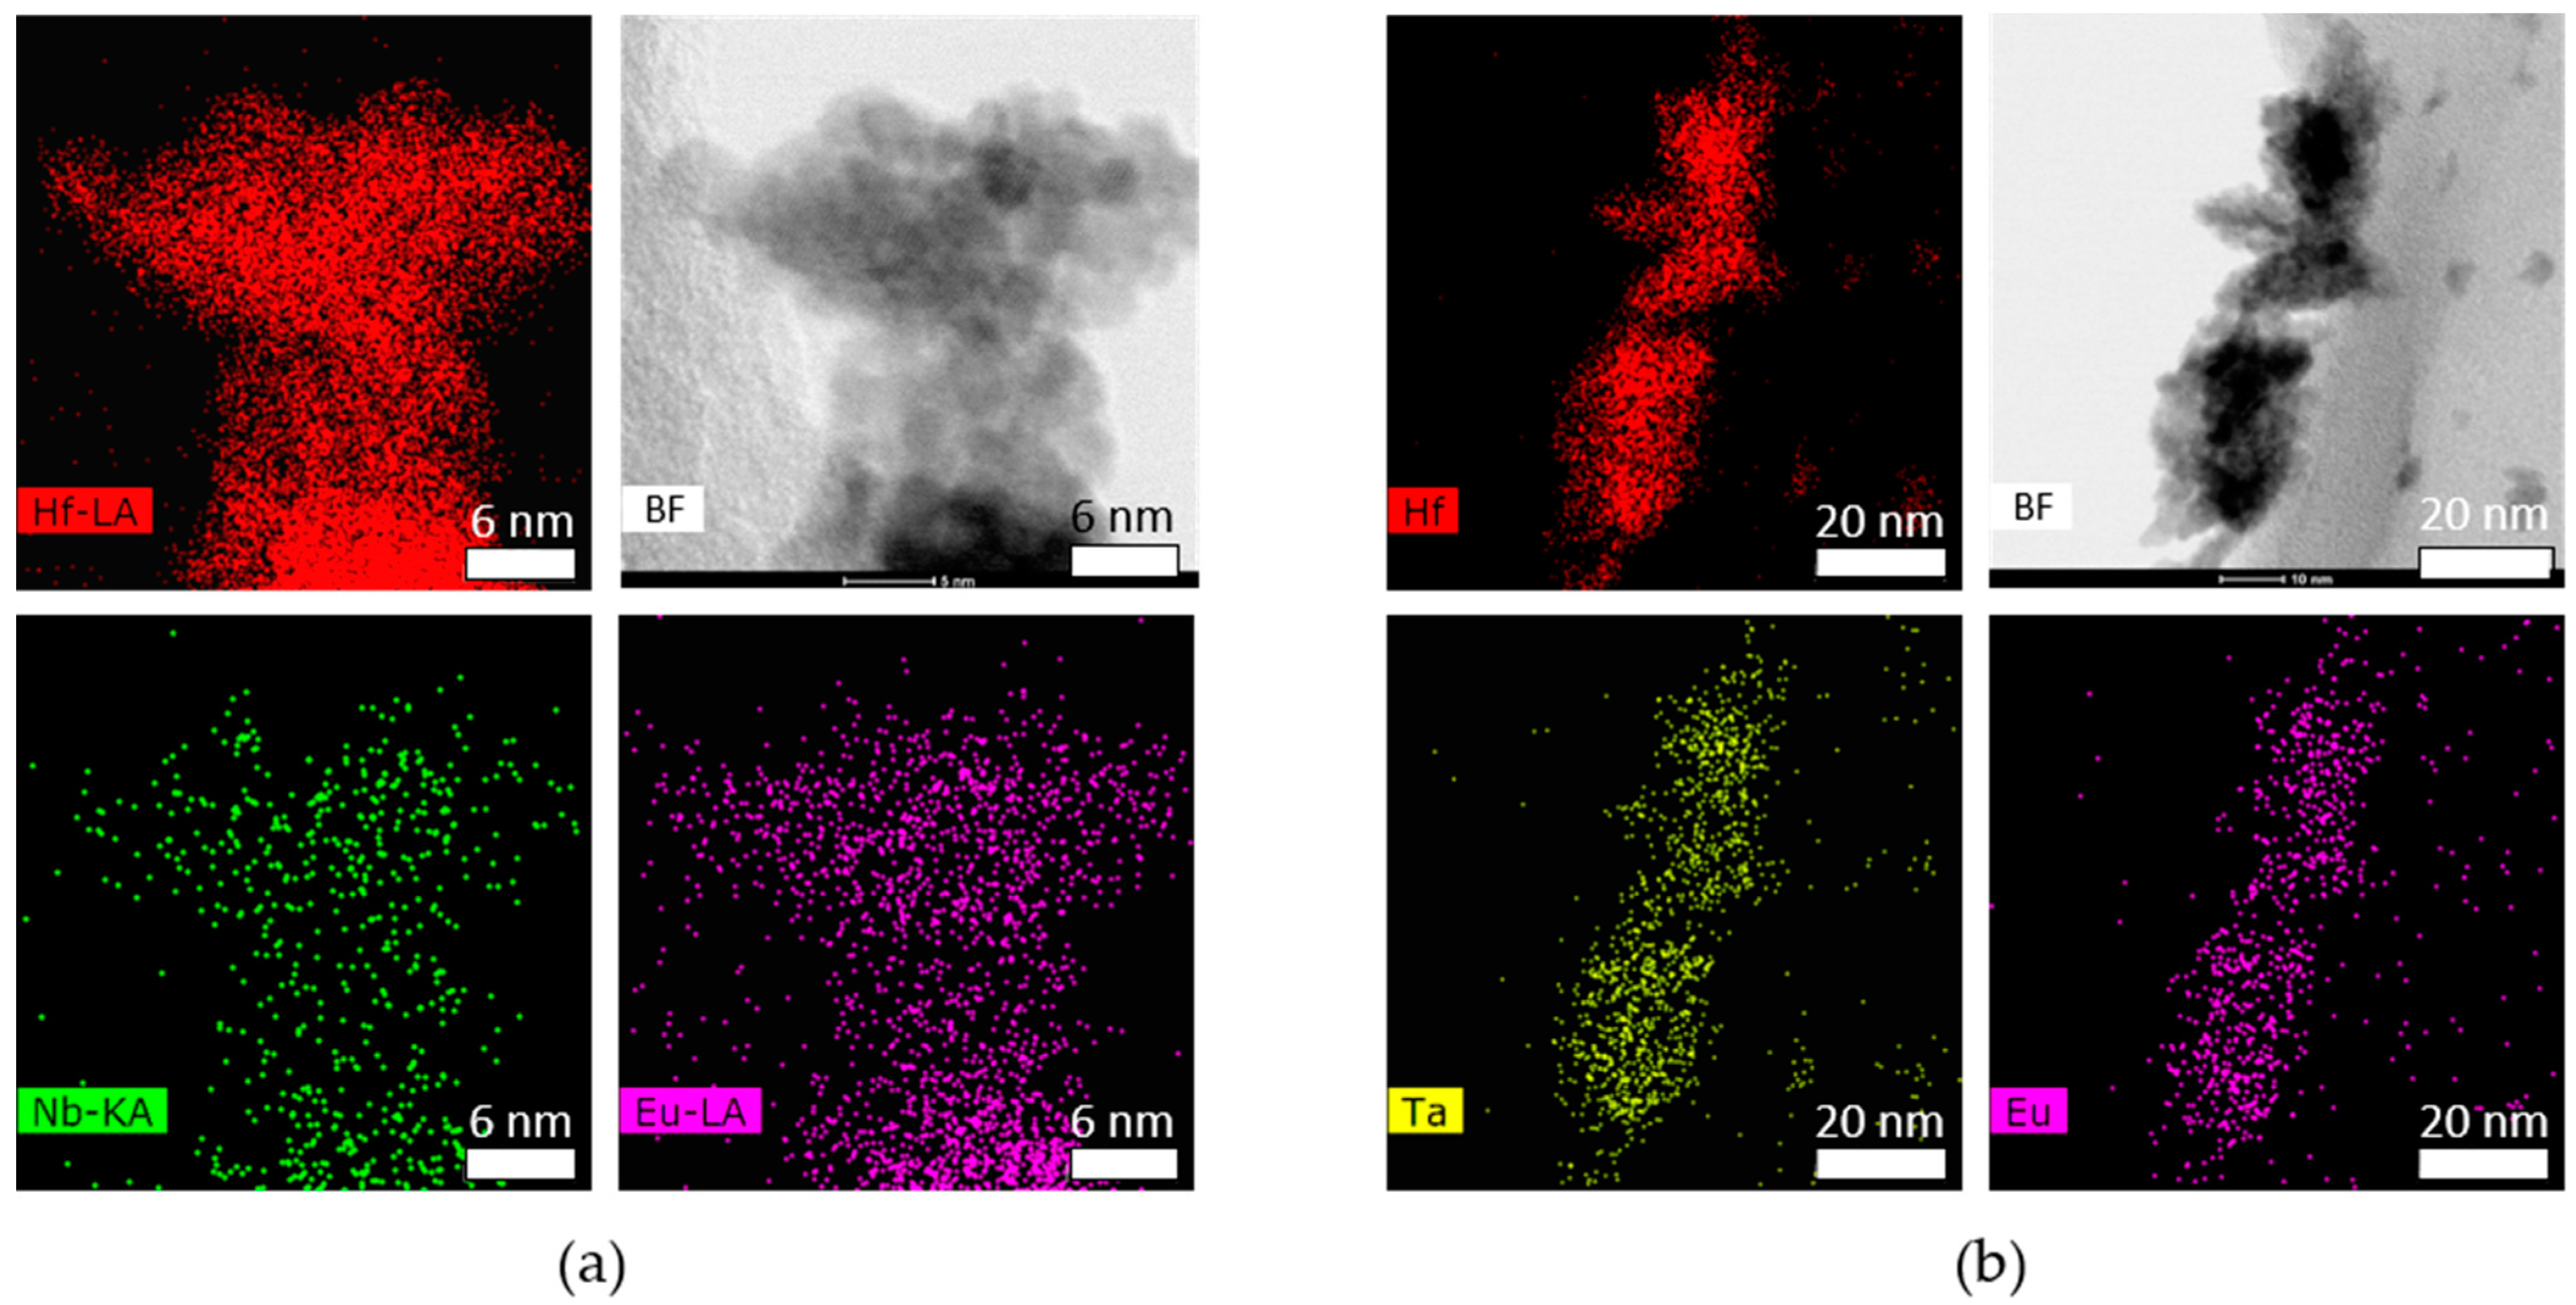
3.2. STEM-EDX Elemental Analysis

STEM analysis on co-doped HfO2 nanocrystals evidences the occurrence of particle agglomerates of 10 to 40 nm. Moreover, the elemental analysis presented as EDX mappings in Figure 2 shows dopants homogeneously distributed in the particles, irrespective of the nature of the co-dopant. The results of the quantitative EDX analysis, reported in Table 1, account for the high doping efficiency of the solvothermal method presented in this work. This can be inferred based on the good agreement between measured and nominal compositions. Indeed, the concentration of Nb and Eu are quite similar to the nominal ones, while slightly higher values are measured for Ta. This disagreement might derive from some overdoping, which can not be excluded, although its most probable origin could lie in the partial overlap of the EDX signals of Ta and Hf (Figure S2), leading to lower accuracy of the quantitative dermination of this element in hafnia by this method.

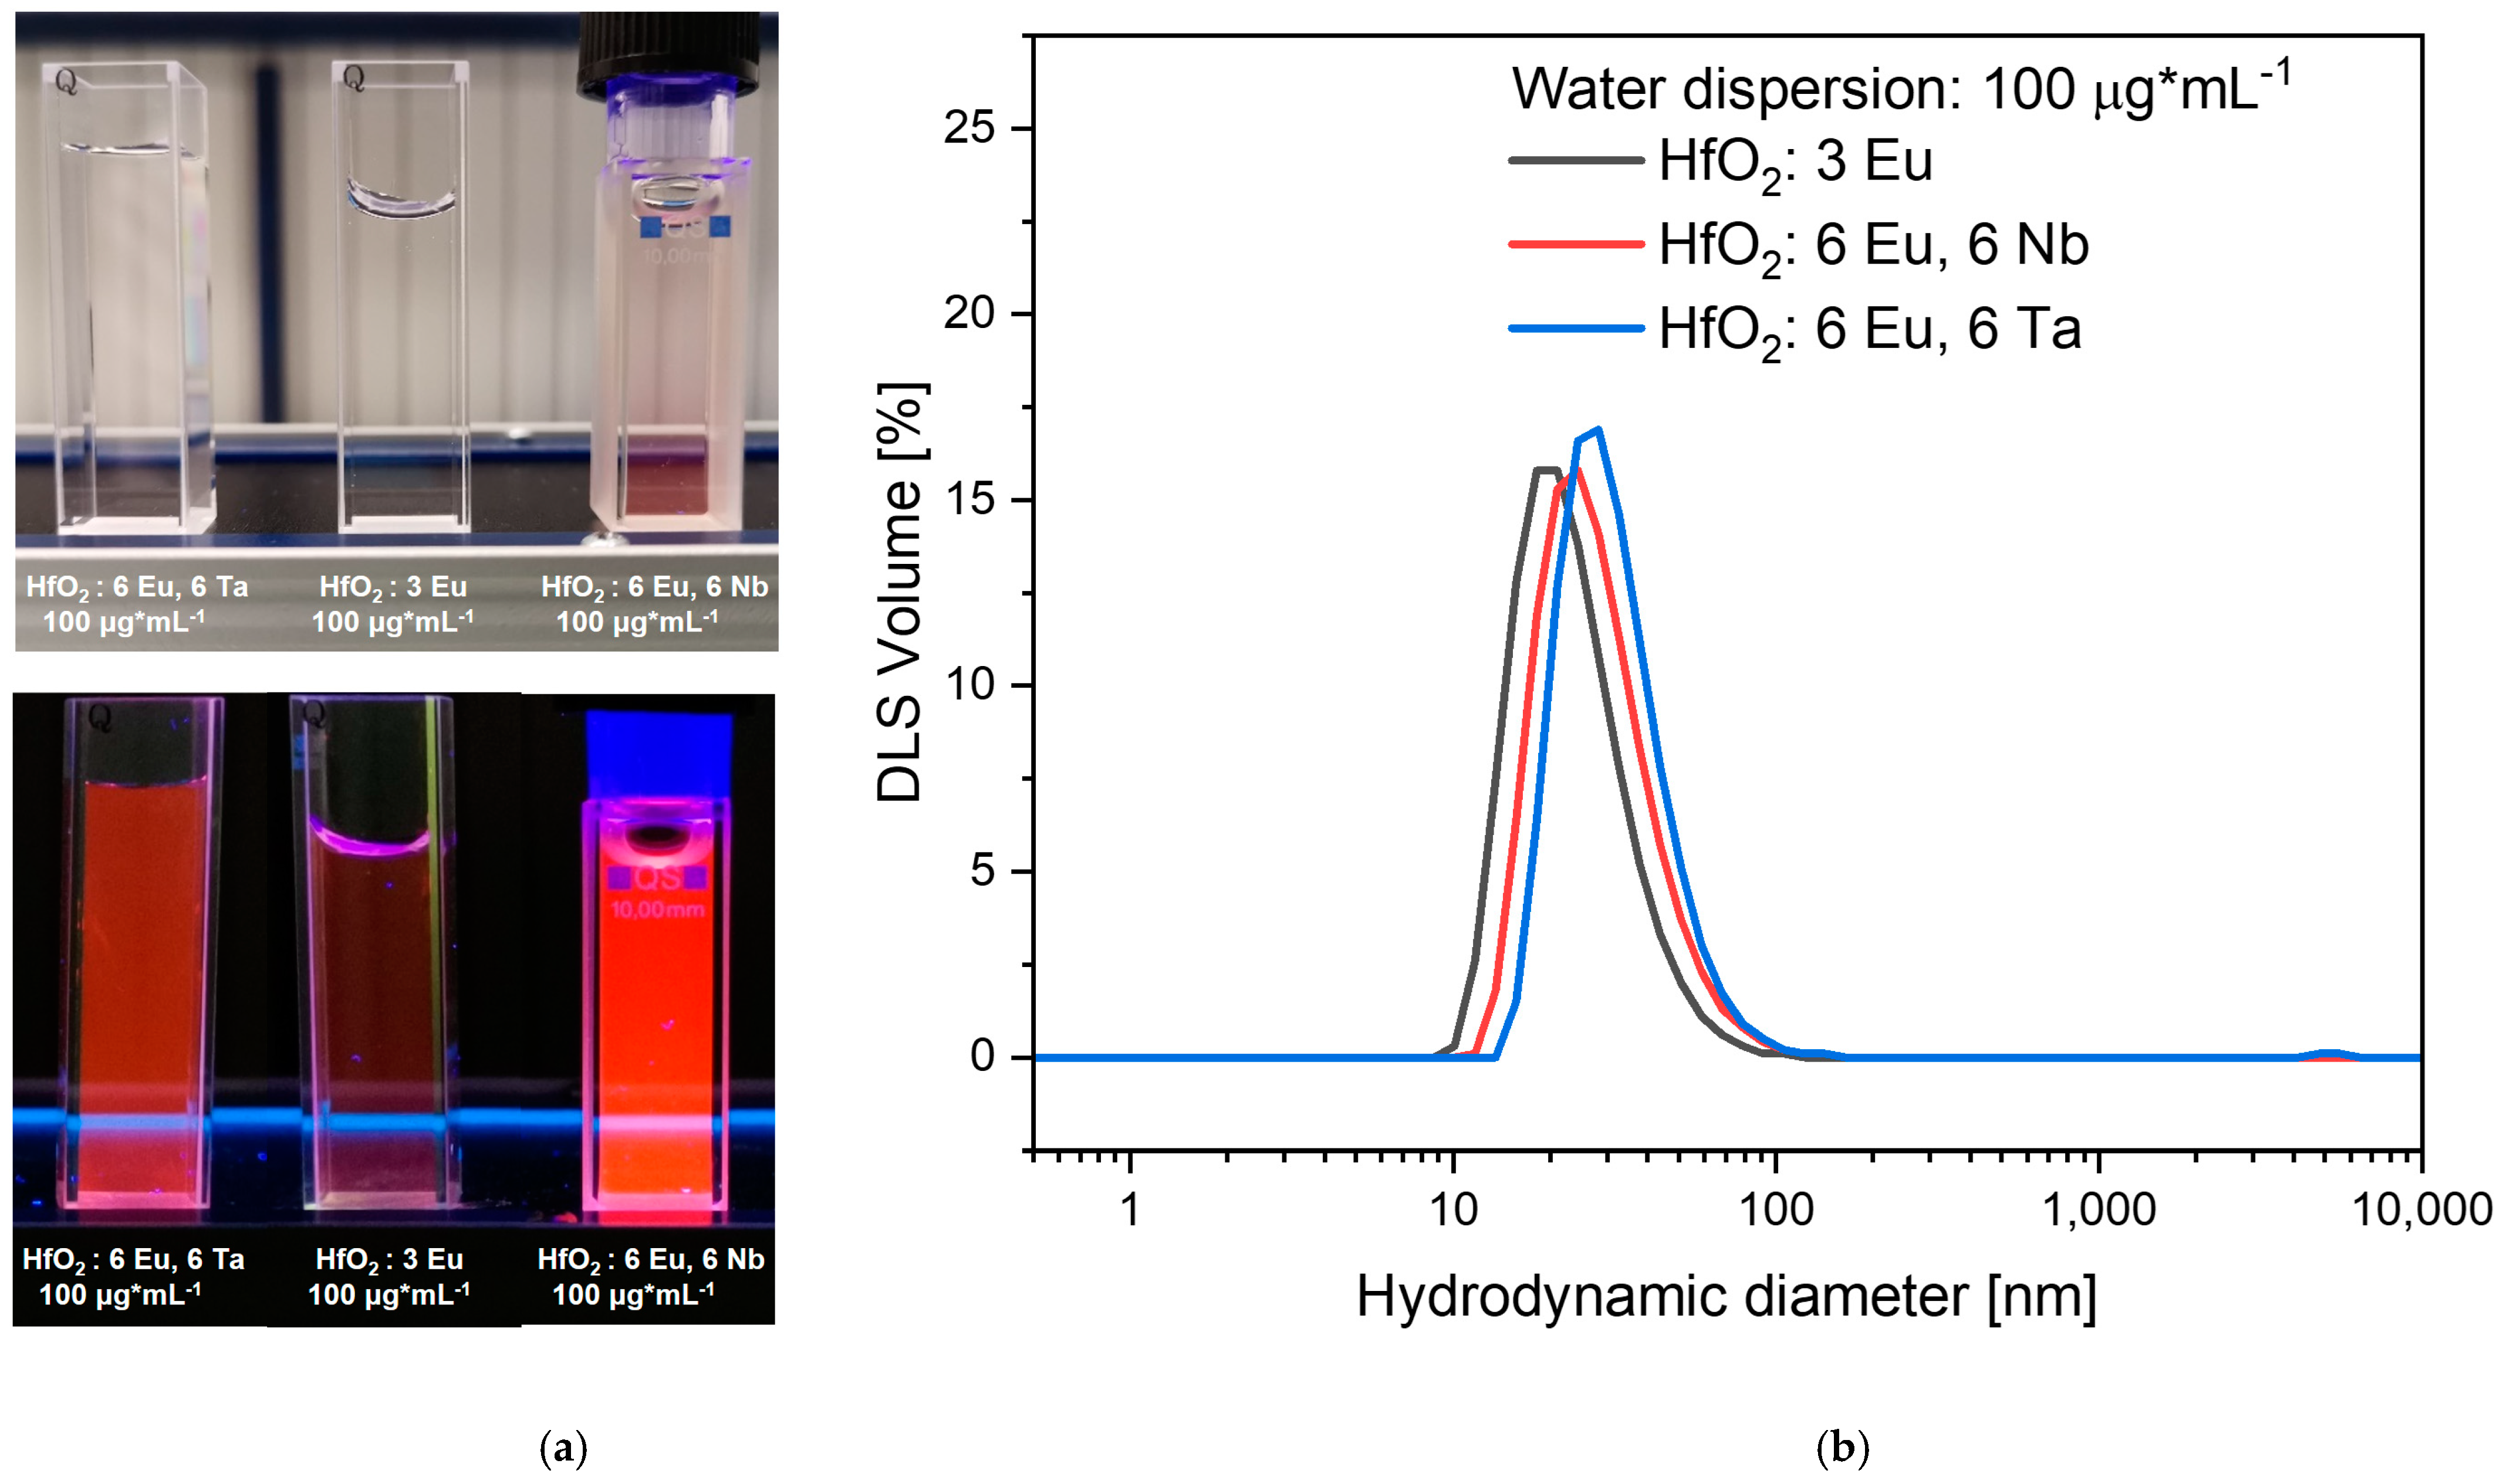
3.3. Evaluation of the Particle Dispersion

Figure 3a shows digital images of water dispersions of the obtained nanocrystals. The dispersions are stable without further particle functionalization right after the washing stage. No signs of sedimentation could be observed after weeks assessing the stability of the particles in water. This is in agreement with previous observations on TiO2 nanoparticles obtained through a similar method where positively charged particles could be obtained, also showing high stability in water due to their strong electrostatic repulsion [18]. Figure 3b shows DLS hydrodynamic size distributions, which lie in the 10–50 nm range for all samples, without formation of larger agglomerates. These values are in good agreement with TEM observations (Figure 2 and Figure S1), where also 10–40 nm clusters of smaller primary particles could be recognised.

3.4. Optical Charcterization

Photoluminescence excitation (PLE) spectra obtained monitoring the Eu3+ luminescence on particle dispersions are presented in Figure 4a, revealing the dominance of broad excitation bands located at wavelengths lower than 300 nm. The sharp intra-center excitation lines of Eu3+ occur between 300 and 465 nm (Figure 4a, inset). While these intra-center excitation are negligibly affected by the presence of co-dopants, and compatible with the expected intrinsic transitions of Eu3+ ions in hafnia, the high energy bands in the UVC spectral region are strongly affected by the charge compensation. Indeed, the main band at 205 nm of the Eu doped sample, is coupled to an additional band centered at around 225 nm in the Ta5+ doped sample. In the case of the nanocrystals co-doped with Nb5+, the PLE is dominated by a broad band at around 260 nm. However, these different excitation channels lead to the typical PL (Figure 4b) of Eu3+ ions in monoclinic HfO2, mostly unaltered by the co-dopants. The only observable difference is the minor change in the 5D07F1 transition (see Figure S3) where the charge compensated samples shows a stronger splitting of the energy sublevels which can be attributed to an increase in the strength of the crystal field [19,20].
When rising the particle concentration in dispersion, a linear response of the PL intensity is observed up to a loading of 200 μg*mL−1 (Figure S4), as expected for low concentration regime of unperturbed systems. At higher particle concentration, detrimental scattering and absorption phenomena should be expected. Indeed, the recorded emission increases but deviates from the linear trend, likely due to the light diffusion and absorption of the incident beam, before it reaches the center of the sampling cuvette concequently reducing the detected intensity. This feature is of quite high importance, especially when considering that the PL output of the dispersion could be also increased by rising the doping level at constant particle loading. Indeed, when the nominal dopant concentration is increased, a higher PL output is observed (Figure 5a), as expected for a higher activator concentration. Additionally, the shape of the emission was not altered by variations in doping levels, as shown in the inset. However, it should be noted that the intensity of the HfO2: Eu, Nb emission increases linearly with the dopant content through the whole concentration range according to the PL integrals reported in Figure 5b (calculated in the spectral range between 515–745 nm).

4. Discussion

Eu3+ related emission is highly dependent on its local environment [19,21]. In fact, the PL spectra of europium can be used as a direct indication of its site symmetry. In Figure 4b the emission of all samples corresponds to that expected for Eu3+ in monoclinic HfO2 [1,19]. It is therefore possible to argue that the observed emissions originates from Eu3+ laying inside the nanocrystals, i.e., that the europium locates inside the crystals irrespective of the presence of charge compensating ions.
In absence of charge compensation, Eu-doped HfO2 shows an intense excitation band near 5.85 eV, which could be related to the host free exciton [12]. When charge compensation takes place, additional excitation bands appear, strongly depending on the nature of the co-dopant, demonstrating the equally effective incorporation of the pentavalent Ta and Nb ions into the lattice during the synthesis. Such excitation bands at around 260 nm and 230 nm measured for HfO2: 6 Eu, 6 Nb and HfO2: 6 Eu, 6 Ta, respectively, well agree with similar trends reported by Yin et al. [7] in ZrO2:Eu,Nb and ZrO2:Eu,Ta. Other works on similarly doped HfO2 by Wiatrowska et al. [12] observed similar features, which were interpreted as the O2− → M5+ (M = Ta and Nb) charge transfer transitions. Since the Eu3+ f-f emissions in the monoclinic site are effectively excited through such charge transfer states, we may infer that Eu3+ ions as well as Nb5+ and Ta5+ lie within the hafnia lattice in near proximity. EDX elemental analysis (Figure 2 and Figure S1) also supports this conclusion, showing the presence of both dopants in the same locations, i.e., within the hafnia particles and in the proportion expected based on the nominal composition set during the synthesis. All these results, point at the effective incorporation of the dopants through this synthetic route and to the strong association of activator ions and co-dopants at very close distance.
At last, the direct proportionality between the europium content and the intensity of the emission combined with the consistency of the spectral shape shown in Figure 5 proves both the quantitative incorporation in the monoclinic host and that the doping sites are not quenched at higher europium concentration. This effect is often not observed in the literature where, for similar concentration ranges, higher Eu3+ concentration induces a minimal PL increase [1,3,7,8,22]. Altogether, the good incorporation of co-dopants seems to effectively reduce non radiative decay pathways which might be the reason behind such early onset of luminescence quenching in other systems.

5. Conclusions

In this work a modified solvothermal synthesis of Eu3+ doped HfO2 was reported. The structural effects of europium trivalent ions, usually responsible for the occurrence of even small amounts of cubic phase already at concentrations of few at.%, could be avoided through charge compensation by co-doping the materials with equal amounts of pentavalent tantalum or niobium ions. The obtained materials show phase pure monoclinic structure of HfO2, even at unprecedented Eu3+ concentration values up to 6 at.%. The compositional analysis and luminescence studies suggest a quite effective incorporation of both the luminescence activator ions and the co-dopant, lying in close proximity. Through a wide range of Eu3+ doping, not only the stabilization of the monoclinic polymorph was achieved, but also a linear dependence of the bright RE-related red emission, suggesting the role of the co-dopants in the reduction of non radiative decay pathways.
The colloidal synthesis proposed here, not requiring high temperatures and leading to very small agglomerates, led to particle dispersions showing high stability over several weeks. This feature enables the design of functional inks with tunable excitation based on the nature of the co-dopant, and with controlled luminescence intensity based either on the RE concentration or on the particle loading. These features represent a further improvement toward employing luminescent hafnia nanocrystals for several advanced processes and for many practical applications.

Supplementary Materials

The following are available online at https://www.mdpi.com/article/10.3390/cryst11091042/s1, Figure S1: TEM micrographs of HfO2: 6 Eu, 6 Nb, Figure S2: EDX spectra of HfO2:6 Eu, 6 Nb and HfO2: 6 Eu, 6 Ta, Figure S3: Enlarged PL spectra showing the splitting of the 7F1 level of Eu3+, Figure S4: Optical characterization of the HfO2:6 Nb, 6 Eu water dispersion at different particle loadings.

Author Contributions

Conceptualization X.H.G. and A.L.; investigation X.H.G. and F.B.; writing-original draft preparation X.H.G. and A.L.; writing—review and editing X.H.G., F.B. and A.L.; supervision A.L. All authors have read and agreed to the published version of the manuscript.

Funding

This research received no external funding.

Data Availability Statement

The data that support the findings of this study are available from the authors upon request.

Acknowledgments

The authors are grateful to ETH Zurich for financial support. They also acknowledge the Scientific Center for Optical and Electron Microscopy (ScopeM) of ETH Zurich for providing the electron microscopy facilities and Alla Sologubenko for help on TEM analyses.

Conflicts of Interest

The authors declare no conflict of interest.

References

  1. Lauria, A.; Villa, I.; Fasoli, M.; Niederberger, M.; Vedda, A. Multifunctional Role of Rare Earth Doping in Optical Materials: Nonaqueous Sol–Gel Synthesis of Stabilized Cubic HfO2 Luminescent Nanoparticles. ACS Nano 2013, 7, 7041–7052. [Google Scholar] [CrossRef]
  2. Laganovska, K.; Bite, I.; Zolotarjovs, A.; Smits, K. Niobium enhanced europium ion luminescence in hafnia nanocrystals. J. Lumin. 2018, 203, 358–363. [Google Scholar] [CrossRef]
  3. LeLuyer, C.; Villanueva-Ibañez, M.; Pillonnet, A.; Dujardin, C. HfO2:X (X = Eu3+, Ce3+, Y3+) Sol Gel Powders for Ultradense Scintillating Materials. J. Phys. Chem. A 2008, 112, 10152–10155. [Google Scholar] [CrossRef]
  4. Gerken, L.R.H.; Keevend, K.; Zhang, Y.; Starsich, F.H.L.; Eberhardt, C.; Panzarasa, G.; Matter, M.T.; Wichser, A.; Boss, A.; Neels, A.; et al. Lanthanide-Doped Hafnia Nanoparticles for Multimodal Theranostics: Tailoring the Physicochemical Properties and Interactions with Biological Entities. ACS Appl. Mater. Interfaces 2019, 11, 437–448. [Google Scholar] [CrossRef]
  5. Villanueva-Ibañez, M.; Le Luyer, C.; Marty, O.; Mugnier, J. Annealing and doping effects on the structure of europium-doped HfO2 sol-gel material. Opt. Mater. (Amst.) 2003, 24, 51–57. [Google Scholar] [CrossRef]
  6. Fujimori, H.; Yashima, M.; Sasaki, S.; Kakihana, M.; Mori, T.; Tanaka, M.; Yoshimura, M. Cubic-tetragonal phase change of yttria-doped hafnia solid solution: High-resolution X-ray diffraction and Raman scattering. Chem. Phys. Lett. 2001, 346, 217–223. [Google Scholar] [CrossRef]
  7. Yin, X.; Wang, Y.; Wan, D.; Huang, F.; Yao, J. Red-luminescence enhancement of ZrO2-based phosphor by codoping Eu3+ and M5+ (M = Nb, Ta). Opt. Mater. (Amst.) 2012, 34, 1353–1356. [Google Scholar] [CrossRef]
  8. Hui, Y.; Zou, B.; Liu, S.; Zhao, S.; Xu, J.; Zhao, Y.; Fan, X.; Zhu, L.; Wang, Y.; Cao, X. Effects of Eu3+-doping and annealing on structure and fluorescence of zirconia phosphors. Ceram. Int. 2015, 41, 2760–2769. [Google Scholar] [CrossRef]
  9. Smits, K.; Olsteins, D.; Zolotarjovs, A.; Laganovska, K.; Millers, D.; Ignatans, R.; Grabis, J. Doped zirconia phase and luminescence dependence on the nature of charge compensation. Sci. Rep. 2017, 7, 44453. [Google Scholar] [CrossRef] [PubMed] [Green Version]
  10. Bugrov, A.N.; Smyslov, R.Y.; Zavialova, A.Y.; Kopitsa, G.P.; Khamova, T.V.; Kirilenko, D.A.; Kolesnikov, I.E.; Pankin, D.V.; Baigildin, V.A.; Licitra, C. Influence of Stabilizing Ion Content on the Structure, Photoluminescence and Biological Properties of Zr1−xEuxO2−0.5x Nanoparticles. Crystals 2020, 10, 1038. [Google Scholar] [CrossRef]
  11. Smits, K.; Sarakovskis, A.; Grigorjeva, L.; Millers, D.; Grabis, J. The role of Nb in intensity increase of Er ion upconversion luminescence in zirconia. J. Appl. Phys. 2014, 115, 213520. [Google Scholar] [CrossRef] [Green Version]
  12. Wiatrowska, A.; Zych, E. Modeling Luminescent Properties of HfO2:Eu Powders with Li, Ta, Nb, and V Codopants. J. Phys. Chem. C 2012, 116, 6409–6419. [Google Scholar] [CrossRef]
  13. Kiisk, V.; Puust, L.; Mändar, H.; Ritslaid, P.; Rähn, M.; Bite, I.; Jankovica, D.; Sildos, I.; Jaaniso, R. Phase stability and oxygen-sensitive photoluminescence of ZrO2:Eu,Nb nanopowders. Mater. Chem. Phys. 2018, 214, 135–142. [Google Scholar] [CrossRef]
  14. Primc, D.; Zeng, G.; Leute, R.; Walter, M.; Mayrhofer, L.; Niederberger, M. Chemical Substitution—Alignment of the Surface Potentials for Efficient Charge Transport in Nanocrystalline TiO2 Photocatalysts. Chem. Mater. 2016, 28, 4223–4230. [Google Scholar] [CrossRef]
  15. De Keukeleere, K.; De Roo, J.; Lommens, P.; Martins, J.C.; Van Der Voort, P.; Van Driessche, I. Fast and Tunable Synthesis of ZrO2 Nanocrystals: Mechanistic Insights into Precursor Dependence. Inorg. Chem. 2015, 54, 3469–3476. [Google Scholar] [CrossRef] [PubMed] [Green Version]
  16. Olliges-Stadler, I.; Rossell, M.D.; Niederberger, M. Co-operative Formation of Monolithic Tungsten Oxide-Polybenzylene Hybrids via Polymerization of Benzyl Alcohol and Study of the Catalytic Activity of the Tungsten Oxide Nanoparticles. Small 2010, 6, 960–966. [Google Scholar] [CrossRef] [PubMed]
  17. Braendle, A.; Perevedentsev, A.; Cheetham, N.J.; Stavrinou, P.N.; Schachner, J.A.; Mösch-Zanetti, N.C.; Niederberger, M.; Caseri, W.R. Homoconjugation in poly(phenylene methylene)s: A case study of non-π-conjugated polymers with unexpected fluorescent properties. J. Polym. Sci. Part B Polym. Phys. 2017, 55, 707–720. [Google Scholar] [CrossRef]
  18. Frantz, C.; Lauria, A.; Manzano, C.V.; Guerra-Nuñez, C.; Niederberger, M.; Storrer, C.; Michler, J.; Philippe, L. Nonaqueous Sol-Gel Synthesis of Anatase Nanoparticles and Their Electrophoretic Deposition in Porous Alumina. Langmuir 2017, 33, 12404–12418. [Google Scholar] [CrossRef] [PubMed]
  19. Binnemans, K.; Görller-Walrand, C. A simple model for crystal field splittings of the 7F1 and 5D1 energy levels of Eu3+. Chem. Phys. Lett. 1995, 245, 75–78. [Google Scholar] [CrossRef]
  20. Bünzli, J.-C.G.; Chauvin, A.-S.; Vandevyver, C.D.B.; Bo, S.; Comby, S. Lanthanide Bimetallic Helicates for in Vitro Imaging and Sensing. Ann. N. Y. Acad. Sci. 2008, 1130, 97–105. [Google Scholar] [CrossRef] [PubMed]
  21. Binnemans, K. Interpretation of europium(III) spectra. Coord. Chem. Rev. 2015, 295, 1–45. [Google Scholar] [CrossRef] [Green Version]
  22. Gupta, S.K.; Reghukumar, C.; Kadam, R.M. Eu3+ local site analysis and emission characteristics of novel Nd2Zr2O7:Eu phosphor: Insight into the effect of europium concentration on its photoluminescence properties. RSC Adv. 2016, 6, 53614–53624. [Google Scholar] [CrossRef]
Figure 1. PXRD of HfO2: 3 Eu (black curve), HfO2: 6 Eu, 6 Nb (red curve), HfO2: 6 Eu, 6 Ta (blue curve). The pattern of monoclinic (pink bars, PDF 04-007-8630) and cubic (green bars, PDF 04-002-0037) HfO2 are shown as reference.
Crystals 11 01042 g001
Figure 2. STEM of co-doped nanoparticles. Elemental mapping and bright field (BF) stem image of the HfO2: 6 Eu, 6 Nb (a) and HfO2: 6 Eu, 6 Ta samples (b).
Crystals 11 01042 g002
Figure 3. High quality dispersions of doped and co-doped HfO2 nanocrystals. (a) Digital images of dispersions with particle concentration of 100 μg*mL−1 illuminated by the 254 nm line of a Wood-lamp with (top panel) and without (bottom panel) ambient light. (b) Hydrodynamic diameter distribution of HfO2 nanoparticles dispersed in water as measured by dynamic light scattering.
Crystals 11 01042 g003
Figure 4. Optical characterization of water dispersions of HfO2: Eu charge compensated and non-charge compensated samples. (a) normalized PL spectra of HfO2: 3 Eu (black line), HfO2: 6 Eu, 6 Nb (red line), and HfO2: 6 Eu, 6 Ta (blue line). All spectra were collected by monitoring the emission at 610 nm. Inset: zoom in the 300–500 nm spectral range. (b) PL spectra of HfO2: 3 Eu, HfO2: 6 Eu, 6 Ta, and HfO2: 6 Eu, 6 Nb, excited at 205, 225, and 255 nm, respectively.
Crystals 11 01042 g004
Figure 5. PL of Eu3+ doped HfO2 nanocrystals co doped by Nb5+ as a function of the doping level. (a) PL spectra recorded by exciting at 280 nm. Inset: PL normalised at its maximum. (b) Integrated intensities as a function of Eu3+ nominal concentration and linear fit.
Crystals 11 01042 g005
Table 1. EDX quantitative elemental analysis on charge compensated co-doped HfO2 nanopowders.
ElementHfO2: 6 Eu, 6 NbHfO2: 6 Eu, 6 Ta
HfNominal 88.0 measured 88.2 ± 1 at.%Nominal 88.0 measured 85.7 ± 1 at.%
EuNominal 6.0 measured 5.8 ± 1 at.%Nominal 6.0 measured 6.1 ± 1 at.%
NdNominal 6.0 measured 6.0 ± 1 at.%-
Ta-Nominal 6.0 measured 8.2 ± 1 at.%
Publisher’s Note: MDPI stays neutral with regard to jurisdictional claims in published maps and institutional affiliations.

