Article

Depicting the DNA Binding and Cytotoxicity Studies against Human Colorectal Cancer of Aquabis (1-Formyl-2-Naphtholato-k2O,O′) Copper(II): A Biophysical and Molecular Docking Perspective

Department of Chemistry, College of Science, King Saud University, Riyadh 11451, Saudi Arabia
*
Authors to whom correspondence should be addressed.
Crystals 2022, 12(1), 15; https://doi.org/10.3390/cryst12010015
Submission received: 30 October 2021 / Revised: 21 November 2021 / Accepted: 6 December 2021 / Published: 22 December 2021
(This article belongs to the Special Issue New Trends in Crystals at Saudi Arabia)

Abstract

:
In this study, we attempted to examine the biological activity of the copper(II)–based small molecule aquabis (1-formyl-2-naphtholato-k2O,O′)copper(II) (1) against colon cancer. The characterization of complex 1 was established by analytical and spectral methods in accordance with the single-crystal X-ray results. A monomeric unit of complex 1 exists in an O4 (H2O) coordination environment with slightly distorted square pyramidal geometry (τ = ~0.1). The interaction of complex 1 with calf thymus DNA (ctDNA) was determined by employing various biophysical techniques, which revealed that complex 1 binds to ctDNA at the minor groove with a binding constant of 2.38 × 10⁵ M–1. The cytotoxicity of complex 1 towards human colorectal cell line (HCT116) was evaluated by the MTT assay, which showed an IC50 value of 11.6 μM after treatment with complex 1 for 24 h. Furthermore, the apoptotic effect induced by complex 1 was validated by DNA fragmentation pattern, which clarified that apoptosis might be regulated through the mitochondrial-mediated production of reactive oxygen species (ROS) causing DNA damage pathway. Additionally, molecular docking was also carried out to confirm the recognition of complex 1 at the minor groove.

1. Introduction

Regardless of the significant advancement in the treatment of colon cancer, its frequency is steadily rising, and it has become one of the leading causes of death worldwide [1,2,3]. It is often recognized that the development of cancer is linked with diverse genetic competencies attained throughout the growth of the tumour [4]. Apart from conventional chemotherapy based on organic and platinum-based drugs, other treatment regimes such as surgery, radiation, and immunotherapy therapy are also available to treat colon cancer [5,6,7,8]. Therefore, great efforts have been made to search for new metal-based agents to improve and optimize the action.
Recently, a remarkable study on small molecules binding with nucleic acids (DNA and RNA), which displayed significant impression owing to their vital roles in molecular biology, was carried out [9,10,11]. Several other cellular constituents have also been established as potential targets for metal-based drugs [12,13]. In particular, metal-based enzyme and protein inhibition plays a crucial role in metabolic pathways associated with cancer, which present common targets for the design of metal-based drugs [14,15]. Literature reports revealed that DNA remains a versatile target for metal-based therapeutic agents, and it has been examined by several factors in terms of the coordination environment and the nature of the organic frameworks [16,17]. Of all the transition metal complexes, the Cu(II) metal ion is the most widely studied and known to play a significant role in cancer research because some genetic pathways require a higher level of copper during cancer progression than can be found in normal tissues [18,19].
Hence, it is imperative to that we understand the DNA binding of the copper complex and its possible relationship to cytotoxicity in tumour cell lines [3]. Copper(II) complexes can identify DNA via non-covalent binding modes such as intercalation, groove, and external electrostatic contacts, leading to significant distortion in its structure and the proper biological function [20,21]. Intercalative binding, which is facilitated through well-tailored aromatic structures able to stabilize the π–π interactions, is considered to be the most effective mode for DNA targeting drugs [22,23]. At the same time, in copper(II) complexes, the number of single ligands acts in a bidentate manner in combination with a fourth monodentate labile one, which enables the complex to covalently bind with the nucleobases or the phosphate backbone or other interactions with cellular targets, thereby exerting their cytotoxicity [24,25]. Previous results show that the copper(II) complexes contain a labile ligand substituted mainly by an N7 guanine nitrogen base of DNA [26,27,28].
In this scenario, copper(II) complexes are of specific concern, because of their involvement in respiration, energy metabolism, and capability of interacting with DNA [21,29]. It is evident that the cellular uptake of copper(II) complexes occurs largely through passive diffusion without any involvement with the human copper transporter1 protein (hCtr1), while free copper(II) ion requires hCtr1 [30,31,32]. This indicates that ligands play an important character in tempering its permeability by means of their lipophilicity, changing the redox properties of the metal ion and displaying intrinsic cytotoxicity [33,34]. Meanwhile, DNA damage induced by copper(II) complexes also depends on the ligand planarity, which promotes the diversification of the complex structures to enhance the binding propensity with DNA and influences the Cu2+–Cu+ redox couples [35,36]. Thus, the combined effect of the metal ion and the ligand has a noticeable effect on the biological membranes as well as the DNA binding propensity.
Up to now, the DNA binding profiles of various Cu(II)–Schiff base complexes with 2-hydroxy-1-naphthaldehyde have been investigated, which displayed potential cytotoxic effects on cancer cells [37,38,39,40,41]. Recently, Khan et al. reported the multitargeting anticancer mechanisms and endoplasmic reticulum stress-mediated apoptosis of copper(II) 2-hydroxy-1-naphthaldehyde complexes using confocal fluorescence microscopy [38]. Hajrezaie et al. observed a copper(II) Schiff complex Cu (BrHAP)2, a potent antiproliferative effect in HT-29 colon cancer cells, undergoing apoptosis cell death [42]. However, till now no emphasis has been made on the copper(II) complex achieved from 2-hydroxy-1-naphthaldehyde as a small molecule to precisely forecast the DNA binding mode.
Herein, we extend our discussion about analytical and spectroscopic characterization, topological analysis, and the Hirshfeld surface analysis of copper(II) complex (1) reported earlier [43]. Exploiting different biophysical methods, we have successfully shown that complex 1 avidly binds to a DNA minor groove. The binding propensity was further confirmed by molecular docking results. Furthermore, cytotoxicity towards the human colorectal cell line (HCT116) was evaluated by an MTT assay, and cellular uptake was monitored by fluorescence microscopy.

2. Materials and Methods

2.1. Materials

2-hydroxy-1-naphthaldehyde and copper(II) acetate monohydrate were procured from Sigma-Aldrich, St. Louis, MO, USA. Analytical standard solvents were acquired from Fisher Scientific, Leicestershire, UK.

2.2. Methods and Instrumentation

Infrared spectrum was recorded (KBr disk, 400–4000 cm−1) with FT-IR PerkinElmer (1000 FT-IR spectrum BX, PerkinElmer, Waltham, MA, USA). The mass spectrum was obtained using an Accu-TOF LC-plus JMS-T100 LP atmospheric pressure ionization ToF-MS spectrometer (JEOL, Tokyo, Japan). Thermogravimetric analysis (TGA) was carried out on Pyris 1 TGA from PerkinElmer (Waltham, MA, USA). Elemental analysis was measured using a CE-440 elemental analyzer (Exeter Analytical, Inc, Chelmsford, MA, USA). Powder X-ray diffraction measurements were performed on a Rigaku MiniFlex600 (Rigaku, Tokyo, Japan). UV-visible and fluorescence studies were performed with Hitachi U-2900 Spectrophotometer (Hitachi, Tokyo, Japan) and Shimadzu 6000 spectrophotometer (Shimadzu, Kyoto, Japan), respectively. Fluorescence measurements were handled using RF-6000 (Shimadzu, Kyoto, Japan) spectrofluorometer. Photoluminescence spectra related to biological examination were collected with PerkinElmer LS55 fluorescence spectrophotometer (PerkinElmer, Waltham, MA, USA).

2.3. Synthesis of Aquabis (1-Formyl-2-Naphtholato-k2O,O′) Copper(II) (1)

The copper(II) complex (1) was obtained by the slight alteration of the procedure mentioned earlier [43]. A solution of Cu(II) acetate monohydrate (0.199 g, 0.93 mmol) was mixed into a stirred methanolic solution (20 mL) of 2-hydroxy-1-naphthaldehyde (0.172 g, 1 mmol). The resulting mixture was refluxed at 80 °C for 2 h to obtain olive green colour solution. Slow evaporation of the clear solution led to block-shaped green colour crystals, which were collected after couple of days.
Yield: 45%, M.P.: 196 °C. CHN analysis (%): Calcd. For C22H16CuO5 (423.90): C, 62.33; H, 3.80; Found: C, 62.41; H, 3.86. IR (KBr, cm−1): 3400 ν (O–H), 1620 ν (C–O), 1184 ν (HC=O), 745 (H2O rocking mode), 586 cm−1 ν (Cu–O). UV–vis (DMSO, λmax, nm): 227, 314, 416. ToF-MS: (m/z+) 423.1 (Supplementary Materials, Figure S1–S3).

2.4. Crystallography

The details of single-crystal measurement have been given in supporting information (See the Supplementary Materials).

2.5. DNA Binding Studies

ctDNA was procured from Sigma-Aldrich (St. Louis, MO, USA) and kept at 4 °C. The purity ctDNA was assured by the absorbance ratio at A260/A280 between ~1.8 and 1.9. The concentration of ctDNA (ε260 = 6600 cm−1 M−1) was determined from absorption spectroscopy [44].
Change in absorption pattern of a fixed amount of the complex 1 (60 µM) was monitored in presence of varying DNA concentrations. The binding constant (Kb) was calculated by employing the Wolf–Shimmer Equation (1) [45];
[ DNA ] ε a ε f = [ DNA ] ε b ε f + 1 K b   ( ε a ε f )
where [DNA] is the concentration of DNA, εa, εf, and εb are the extinction coefficients of apparent, free, and bound metal complex, respectively. A plot of [DNA]/(εa−εf) versus [DNA] provides Kb is the slope to the intercept ratio.
Ethidium bromide (EB) competitive ability of increasing amount of complex towards ctDNA was assessed for the solution of almost fully bound EB (20 μM) to DNA (100 μM) in aqueous buffer. The increasing concentration of 1 directly impacted the emission profile of EB–DNA system [16]. Stern–Volmer quenching constant (KSV) can determined from the graph of F0/F verses [Q], where F0 and F are the are the fluorescence intensities in the absence and the presence of the complex 1 as a quencher [Q], respectively [46].
F 0 F = 1 + K SV [ Q ]
Ostwald viscometer was used to monitor the change in specific viscosity of ctDNA (30 µM) at room temperature. The flow time inside the viscometer was recorded thrice, and the average values were used for obtaining the corresponding relative viscosity. The plot of (η/η0)1/3 versus r ([complex 1]/[ctDNA]; r = 0.0, 0.2, 0.4, 0.6, 0.8, 1.2, 1.6, 2.0) was obtained, where η and η0 represent the viscosity of DNA in the presence and absence of complex 1, respectively [44].
Thermal denaturation was conducted on a Shimadzu Pharmaspec 1700 unit equipped with the Peltier controller (TMSPC-8) (Shimadzu, Kyoto, Japan). Absorbance versus temperature plot of DNA alone and complex 1–DNA system was detected with a rising temperature at a fixed wavelength (260 nm).

2.6. Cytotoxicity Studies

Studies related to cell line examinations (cell culture, MTT assay, quantification of apoptosis, and determination of mitochondrial ROS) are given in supporting information (See the Supplementary Materials).

2.7. Molecular Docking

Molecular docking of complex 1 with double-helical DNA was performed using AutoDock vina [47]. This docking program has been documented to carry out more accurate parameters than AutoDock within a shorter time [48,49]. Structure of DNA [PDB: 1BNA] was retrieved from RCSB Protein Data Bank. The water molecules from the structure were removed using AutoDock tools 1.5.6. Non-polar hydrogens were incorporated into the receptor molecules. The grid spacing was fixed at 1 Å, and details of grid are given in Supplementary Materials, Table S1. The PDB structure of complex 1 was converted from cif file using Mercury crystallographic software version 4.2. The post-docking analysis was performed using Discovery studio visualizer.

3. Results and Discussion

3.1. Synthesis and Characterization

The present investigation aims to ascertain the effect of Cu(II) complex bearing naphthalene rings on DNA binding events and in vitro anticancer activity towards colorectal cancer. The proposed geometry of complex 1 (Scheme 1) was proven by microanalytical, TGA, PXRD, FTIR, ToF-MS techniques, and electronic spectral studies in accordance with the single-crystal analysis.
Complex 1 displayed the characteristic ʋ (C-H) stretching vibration at 3100–3000 cm−1 due to presence of the aromatic ring. A medium intensity envelope at ~3400 cm−1 specified the coordinated water molecule, which was further confirmed by the presence of the rocking mode of water at 745 cm−1 [50]. The ligand exhibited stretching frequency due to carbaldehyde ʋ (HC=O) group and υ (C-O) at 1157 cm−1 and 1600 cm−1 moving to 1184 and 1620 cm−1 after complexation, indicating the coordination of the carbaldehyde and naphtholate oxygen at the metal centre [51,52]. The bands appearing at 980–838 cm−1 may correspond to the ring breathing mode, C–H, and C–C deformation. The band at 586 cm−1 because of the stretching vibration of ʋ (Cu-O) further confirms the Cu2+ ion coordination in a bidentate manner via naphtholate and carbonyl oxygen (Supplementary Materials, Figure S1).
The electronic spectrum of complex 1 in DMSO at room temperature has been provided. (Supplementary Materials, Figure S2). As can be seen, there are three obvious absorption bands in the spectrum. The bands at 230 and 314 nm can be assigned to the π⟶π and n⟶π transitions of the benzene rings, respectively. The broadening at 416 nm indicates ligand-to metal charge transfer (LMCT) transition, most probably from the naphtholate oxygen atoms [53]. However, the d–d band was observed at 595 nm, similar to other reported copper(II) ions (d9 electronic configuration) in a distorted square pyramidal manner [54].
To examine the thermal stability of complex 1, thermogravimetric analysis (TGA) was performed (Supplementary Materials, Figure S4). The complex started to decompose after 260 °C. The thermogram of complex 1 showed single-step decomposition corresponding to the loss of two molecules of the ligand along with one coordinated water molecule at 310 °C (found: 85.06%; calc: 85.48%). This kind of single-stage pyrolysis of the complexes usually occurs because of electron delocalization as a result of regularity in the bond strength along a conjugated system. The final product of the mixture of CuO and C is produced at temperatures above 800 °C.
Powder-XRD analysis of complex 1 confirmed the bulk phase purity of the sample (Supplementary Materials, Figure S5). Nevertheless, some diffraction peaks of small intensity were detected due to the different orientation of the crystalline sample.

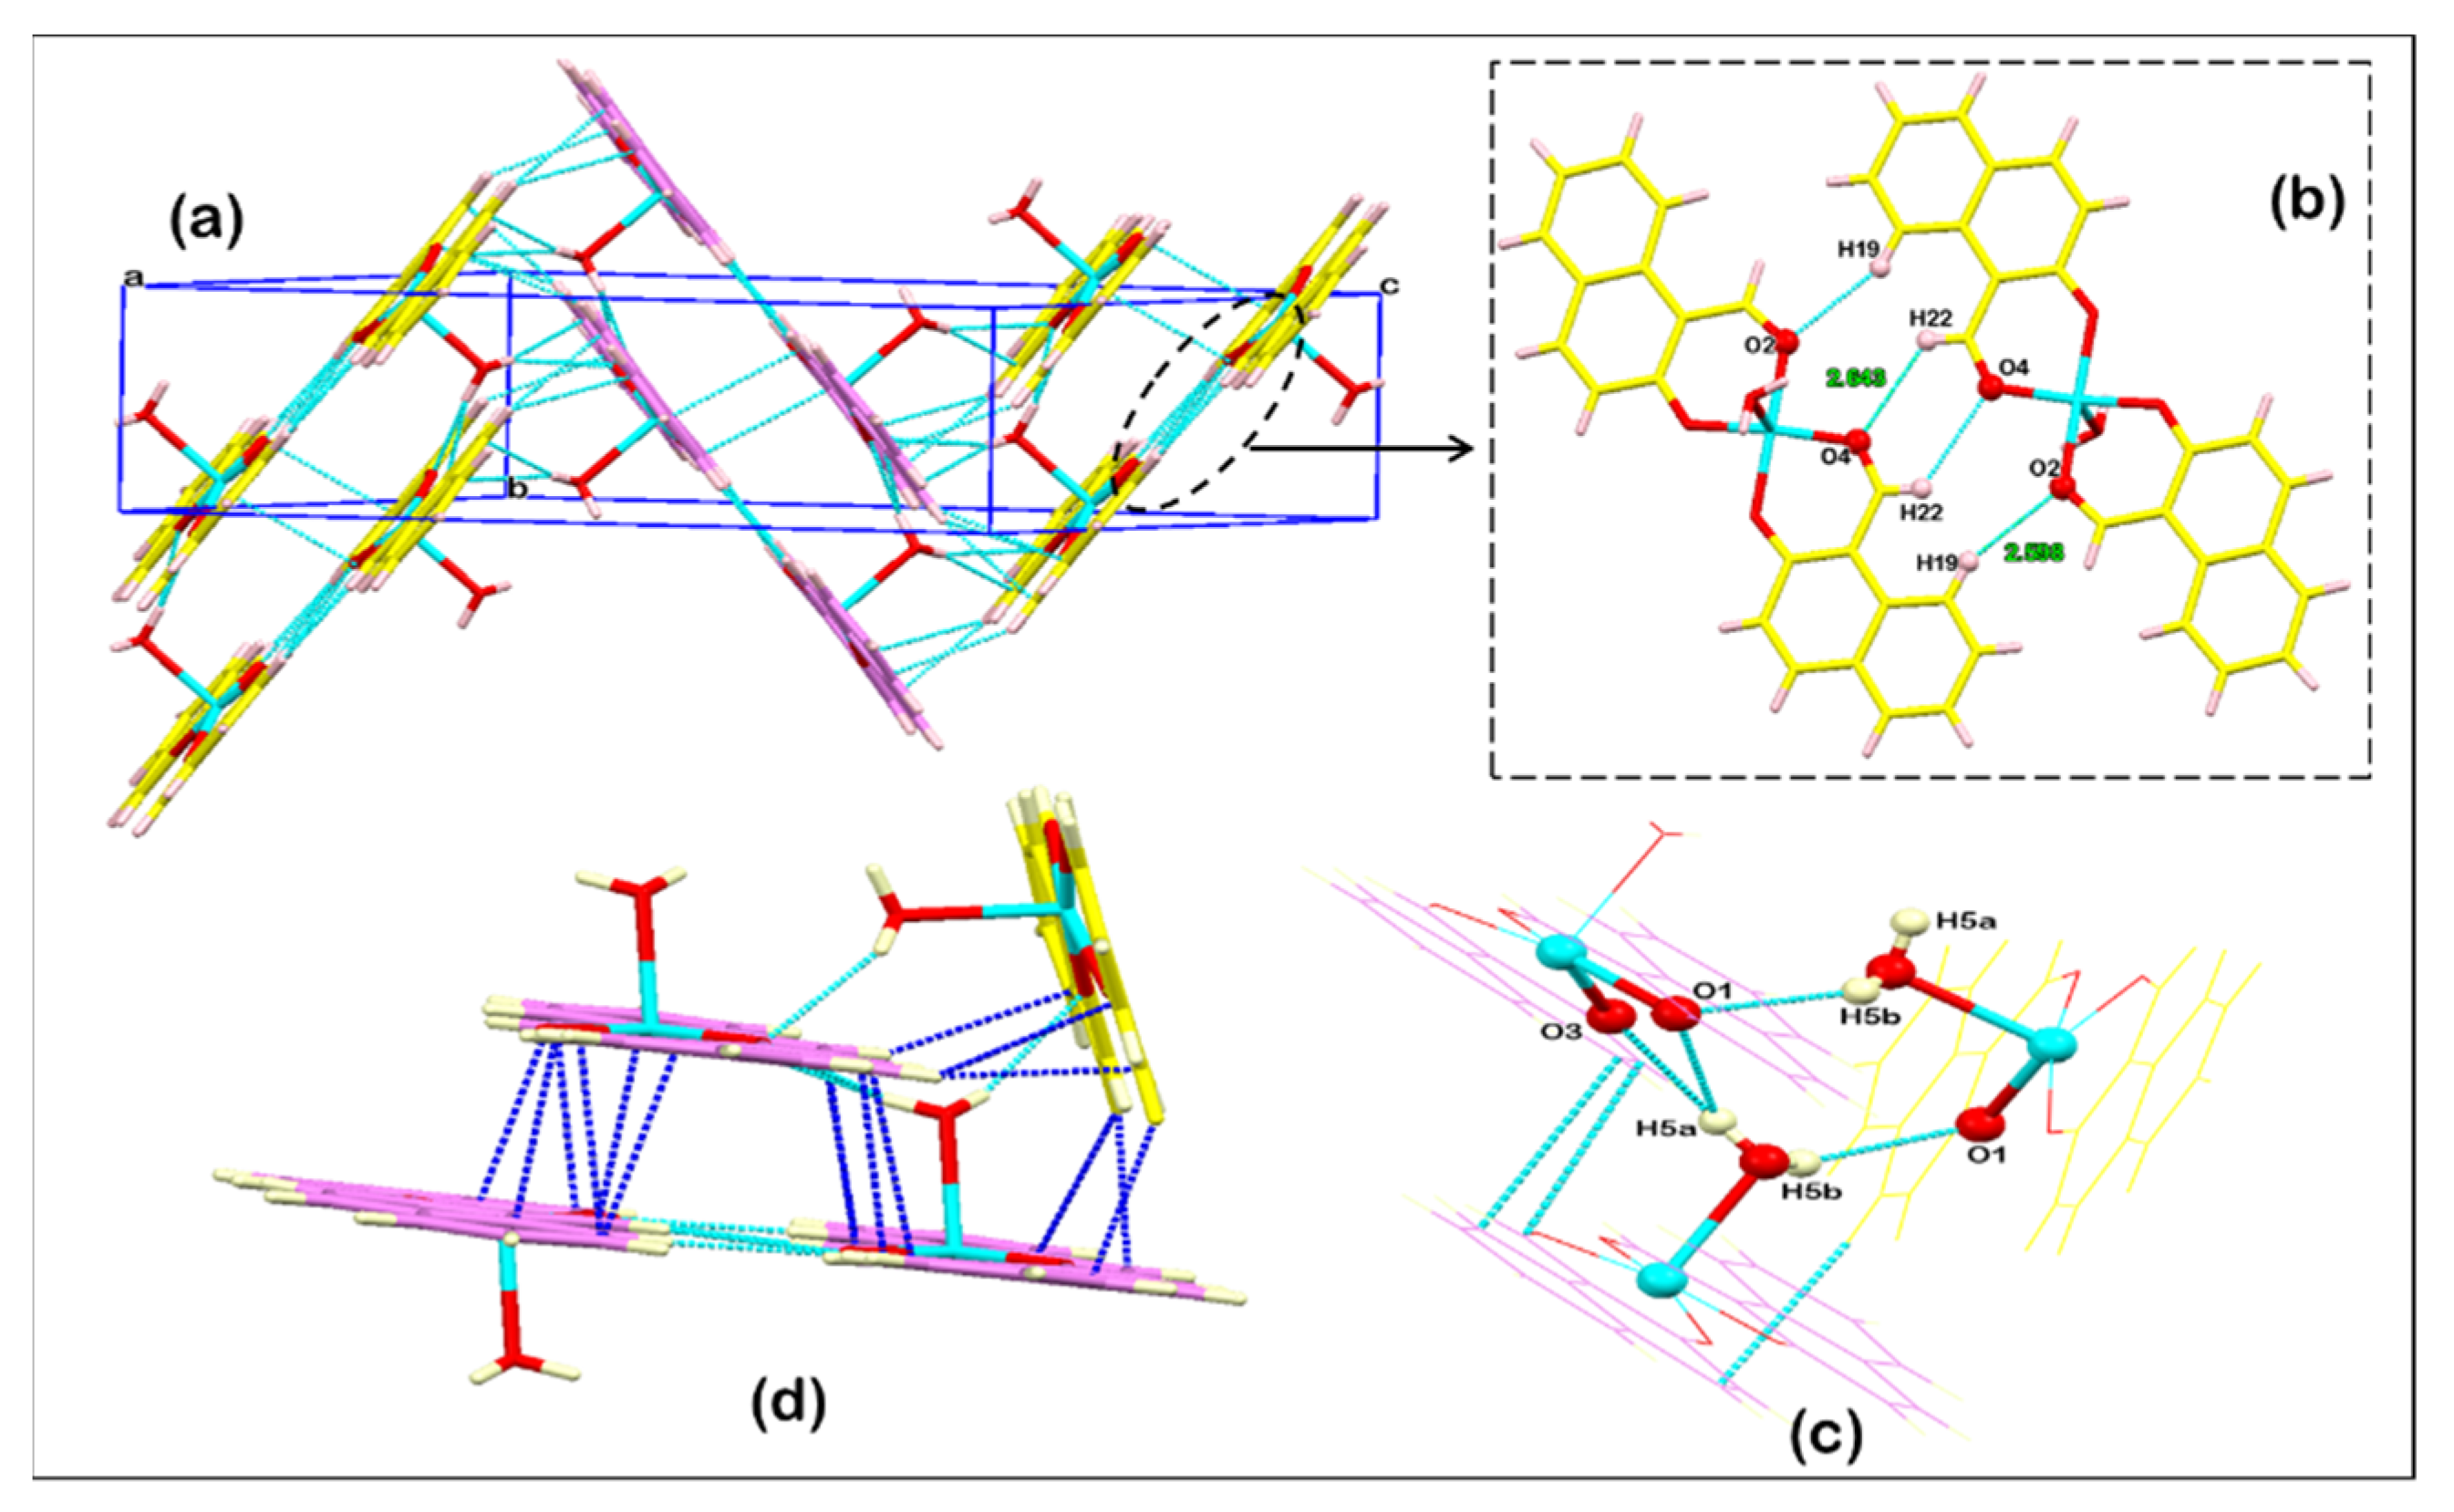
3.2. Structure Description

Crystal X-ray analysis revealed complex 1 contains a Cu(II) centre and crystalizes in a monoclinic P21/c space group (Table 1). The asymmetric unit of 1 involves two L1 ligands, one molecule of water, and a Cu(II) ion, as shown in Figure 1. In complex 1, the Cu(II) centre has five coordinated positions, and all the positions are occupied by the O-atom, in which the O-atom of L1 ligand occupies four equatorial positions, and the axial position is coordinated by the O5 of water molecule. The Cu-O distance is in the range of 1.902 to 2.256Å. The bond angle around the Cu(II) centre is in the range from 83.8 (2) to 171.7 (2)⁰. The coordination around the Cu(II) centre can be determined by calculating the geometry parameter τ (τ = (β − α)/60, where α and β are the two greatest valence angles of the coordination centre. For complex 1, τ = 0.071, indicating distorted square pyramidal geometry, is shown in Figure 1. The bond distances and angles for 1 are given in Supplementary Materials, Table S2.
The crystal packing structure of reveals the H-bonding network of the crystal. Each independent Cu(II) complex is linked through intermolecular hydrogen bonds C19―H19...O2 of 2.598Å and C22―H22...O4 of 2.643 Å forming dimers, then each dimer is coordinated by the O5―H5a...O1 of 2.495Å, O5―H5a...O3 of 2.201 Å, and O5―H5b...O1 of 2.207Å, respectively, with a water molecule forming a two-dimensional zig-zag layer structure, as shown in Figure 2a–c. These layers are also strengthened via C-H...π, interactions (the distance in range from 3.280 to 3.90 Å), as shown in Figure 2d. The H-bonding details are mentioned in the Supplementary Materials, Table S3.
To obtain the involvement of even weak interactions existing in complex 1, we also performed topological analysis, which revealed the coordination formula as AB012M1 [55], where B01 is C11H7O2 and M1 is H2O. On the basis of a standard representation of valence-bonded MOFs (Supplementary Materials, Figure S6), the topology of the resulting 1,3-c net is 1,3M4-1 with the point symbol: {0}.
Similarly, the standard exemplification of H-bonded molecular MOFs structures resulted in the 4-c uninodal net of the (3,6) (1,2) topological type (Supplementary Materials, Figure S7) with the point symbol for the net {33.42.5} as a chain running in the direction [010]. In the course of the simplification method based on H- and vdW-bonded molecular MOFs, one can find an account of the molecular packing. The calculation results expose that the underlying net is characterized by the 13T5 topological type (Supplementary Materials, Figure S8).
Various subnets can be acquired from the underlying net (contain edges of a weight no less than a specified value) by applying subroutine implemented in ToposPro. On the basis of a multilevel investigation [56], the following order of the subnets can describe the packing of the structure on different levels of the minimal solid angle (Ωi) (Supplementary Materials, Table S5). The formation of the 13-c net depends on the minimal solid angle value (Supplementary Materials, Figure S9).

3.3. Hirshfeld Surface Analysis

To quantitatively explore intermolecular interactions within the crystal structure, Hirshfeld surface (HF) analysis was performed [57]. HF surfaces can be utilized by generating three-dimensional images of dnorm, curvedness, and shape index, while the associated two-dimensional fingerprint plot provides quantitative images of the involved close interactions [58,59,60]. The HF analysis of complex 1 was mapped with dnorm, shape index, and curvedness in a range from −0.213 to 0.887, −1.0 to 1.0, and −4.0 to 0.40E, respectively (Supplementary Materials, Figure S10). The red, white, and blue colours in dnorm showed the distance as shorter, equal to, and longer than the total of vdW separation, respectively. In Figure S10a, intense, medium, and faint red spots are suggestive of the O-H…O, C-H…π, and C-H…O interaction, respectively. In Figure S10b, shape index shows the red and blue outlines that are symbolic of the C-H…π interaction, while Figure S10c of curvedness is also evident the presence of a flat region, which corresponds to the C-H...π.
For the quantitative analysis, 2D fingerprint plots were generated for complex 1 (Supplementary Materials, Figure S11). The sum of all the contacts contributing to the Hirshfeld surface indicated the most significant interaction is C-H, contributing 38.8% of attributes to the C-H…π interaction. The second most significant interaction is H…H contact, contributing 34.9%. This is followed by O-H and C-O contact with 16.9% and 4.6%, respectively, which is indicative of O-H…O and C-H…O interactions. Then, C-C contact with 2.2% corresponds to the π…π interaction. The rest corresponds to minor contacts such as Cu…H and Cu…C, contributing only 2.6% of the total interactions (Supplementary Materials, Figure S10a–h).

3.4. DNA Binding

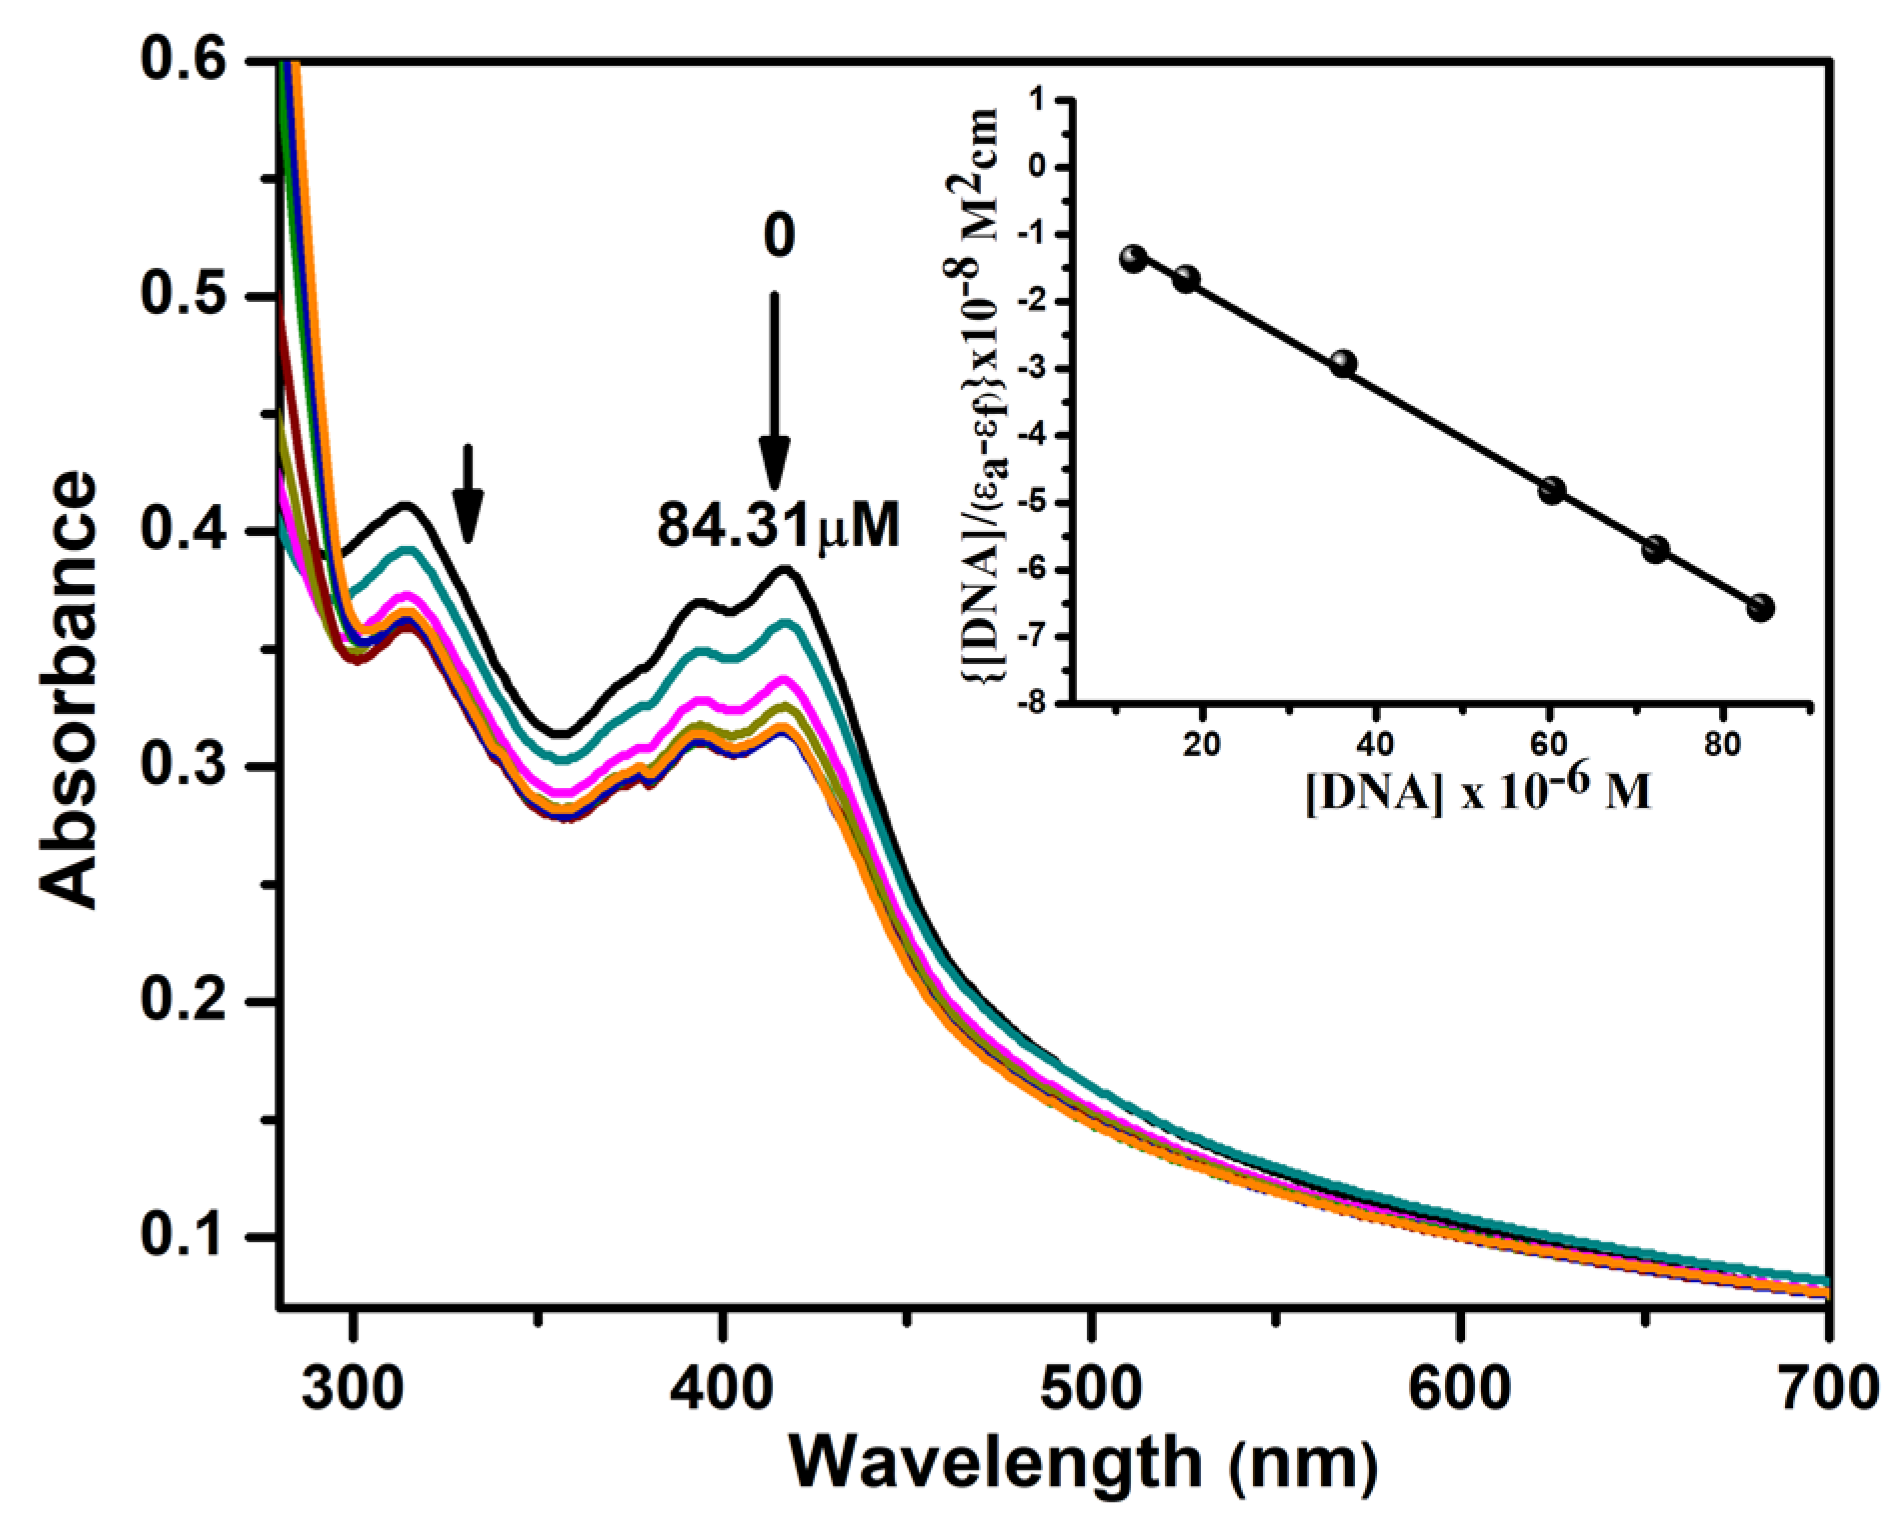
3.4.1. Absorption Titrations

Electronic absorption is an important tool for examining the drug–DNA interaction [61,62]. Figure 3 shows the absorption spectra of the complex 1 in the absence and presence of different amounts of ctDNA. Upon addition of ctDNA to the buffered solution of complex 1, the absorbance of these two bands at 314 and 416 nm decreased without any shift in wavelength maxima (λmax). A small drop in absorbance and no alterations in λmax position were associated with groove binding [63]. The significant decrease in absorbance (hypochromism) of complex 1 in the presence of DNA without any shift suggests that 1 binds avidly with ctDNA via groove-binding mode. The presence of hypochromism (22%) may indicate the DNA complex stabilization due to π–π* stacking occurs between the aromatic naphthalene rings, which approaches partial intercalation of the base moiety through non-covalent interaction [64].
The binding strength of complex 1 was quantitatively determined by calculating the intrinsic binding constant Kb, and it was found to be 2.38 × 10⁵ M–1. The Kb value of the complex was smaller than that reported by classical intercalators [65] and comparable with the other Cu(II) complexes [61,66,67].

3.4.2. Ethidium Bromide Displacement

Fluorescence quenching experiments were carried out to assess the relative binding affinity of complex 1 to ctDNA with respect to ethidium bromide (EB) as a probe. Upon excitation at 510 nm, the conjugated planar EB had weak fluorescence in the aqueous buffer due to the solvent quenching effect. However, the emission intensity of EB increased at a higher DNA concentration (100 µM), where the alteration of fluorescence intensity was minimal. This indicates that EB completely stacked onto double-stranded DNA. The addition of another DNA-binding molecule quenched the EB emission by replacing DNA-bound EB [68]. The emission spectrum of EB bound to DNA in the absence and presence of complex 1 is shown in Figure 4. It is evident from Figure 4 that increasing concentrations of complex 1 to the EB–DNA system caused obvious quenching (ca. 20%) of the emission maxima. These findings indicate that the DNA-bound EB is partially substituted by complex 1, leading to partial intercalation into the DNA minor groove.
The Ksv determined using Equation (2) was found to be 4.10 × 10⁵ M−1, which further confirms the outcomes obtained from absorption titrations. The apparent DNA-binding constant (Kapp) was obtained from the following equation:
KEB [EB] = Kapp [complex 1]50%
where [complex 1] is the concentration at which a 50% decrease in the emission intensity of the ctDNA–EB complex was observed, KEB (1 × 10⁷ M−1) is the binding constant of EB with DNA, and [EB] is the amount of EB (20 µM). The Kapp value for complex 1 was found to be 8.16 × 10⁸ M−1.

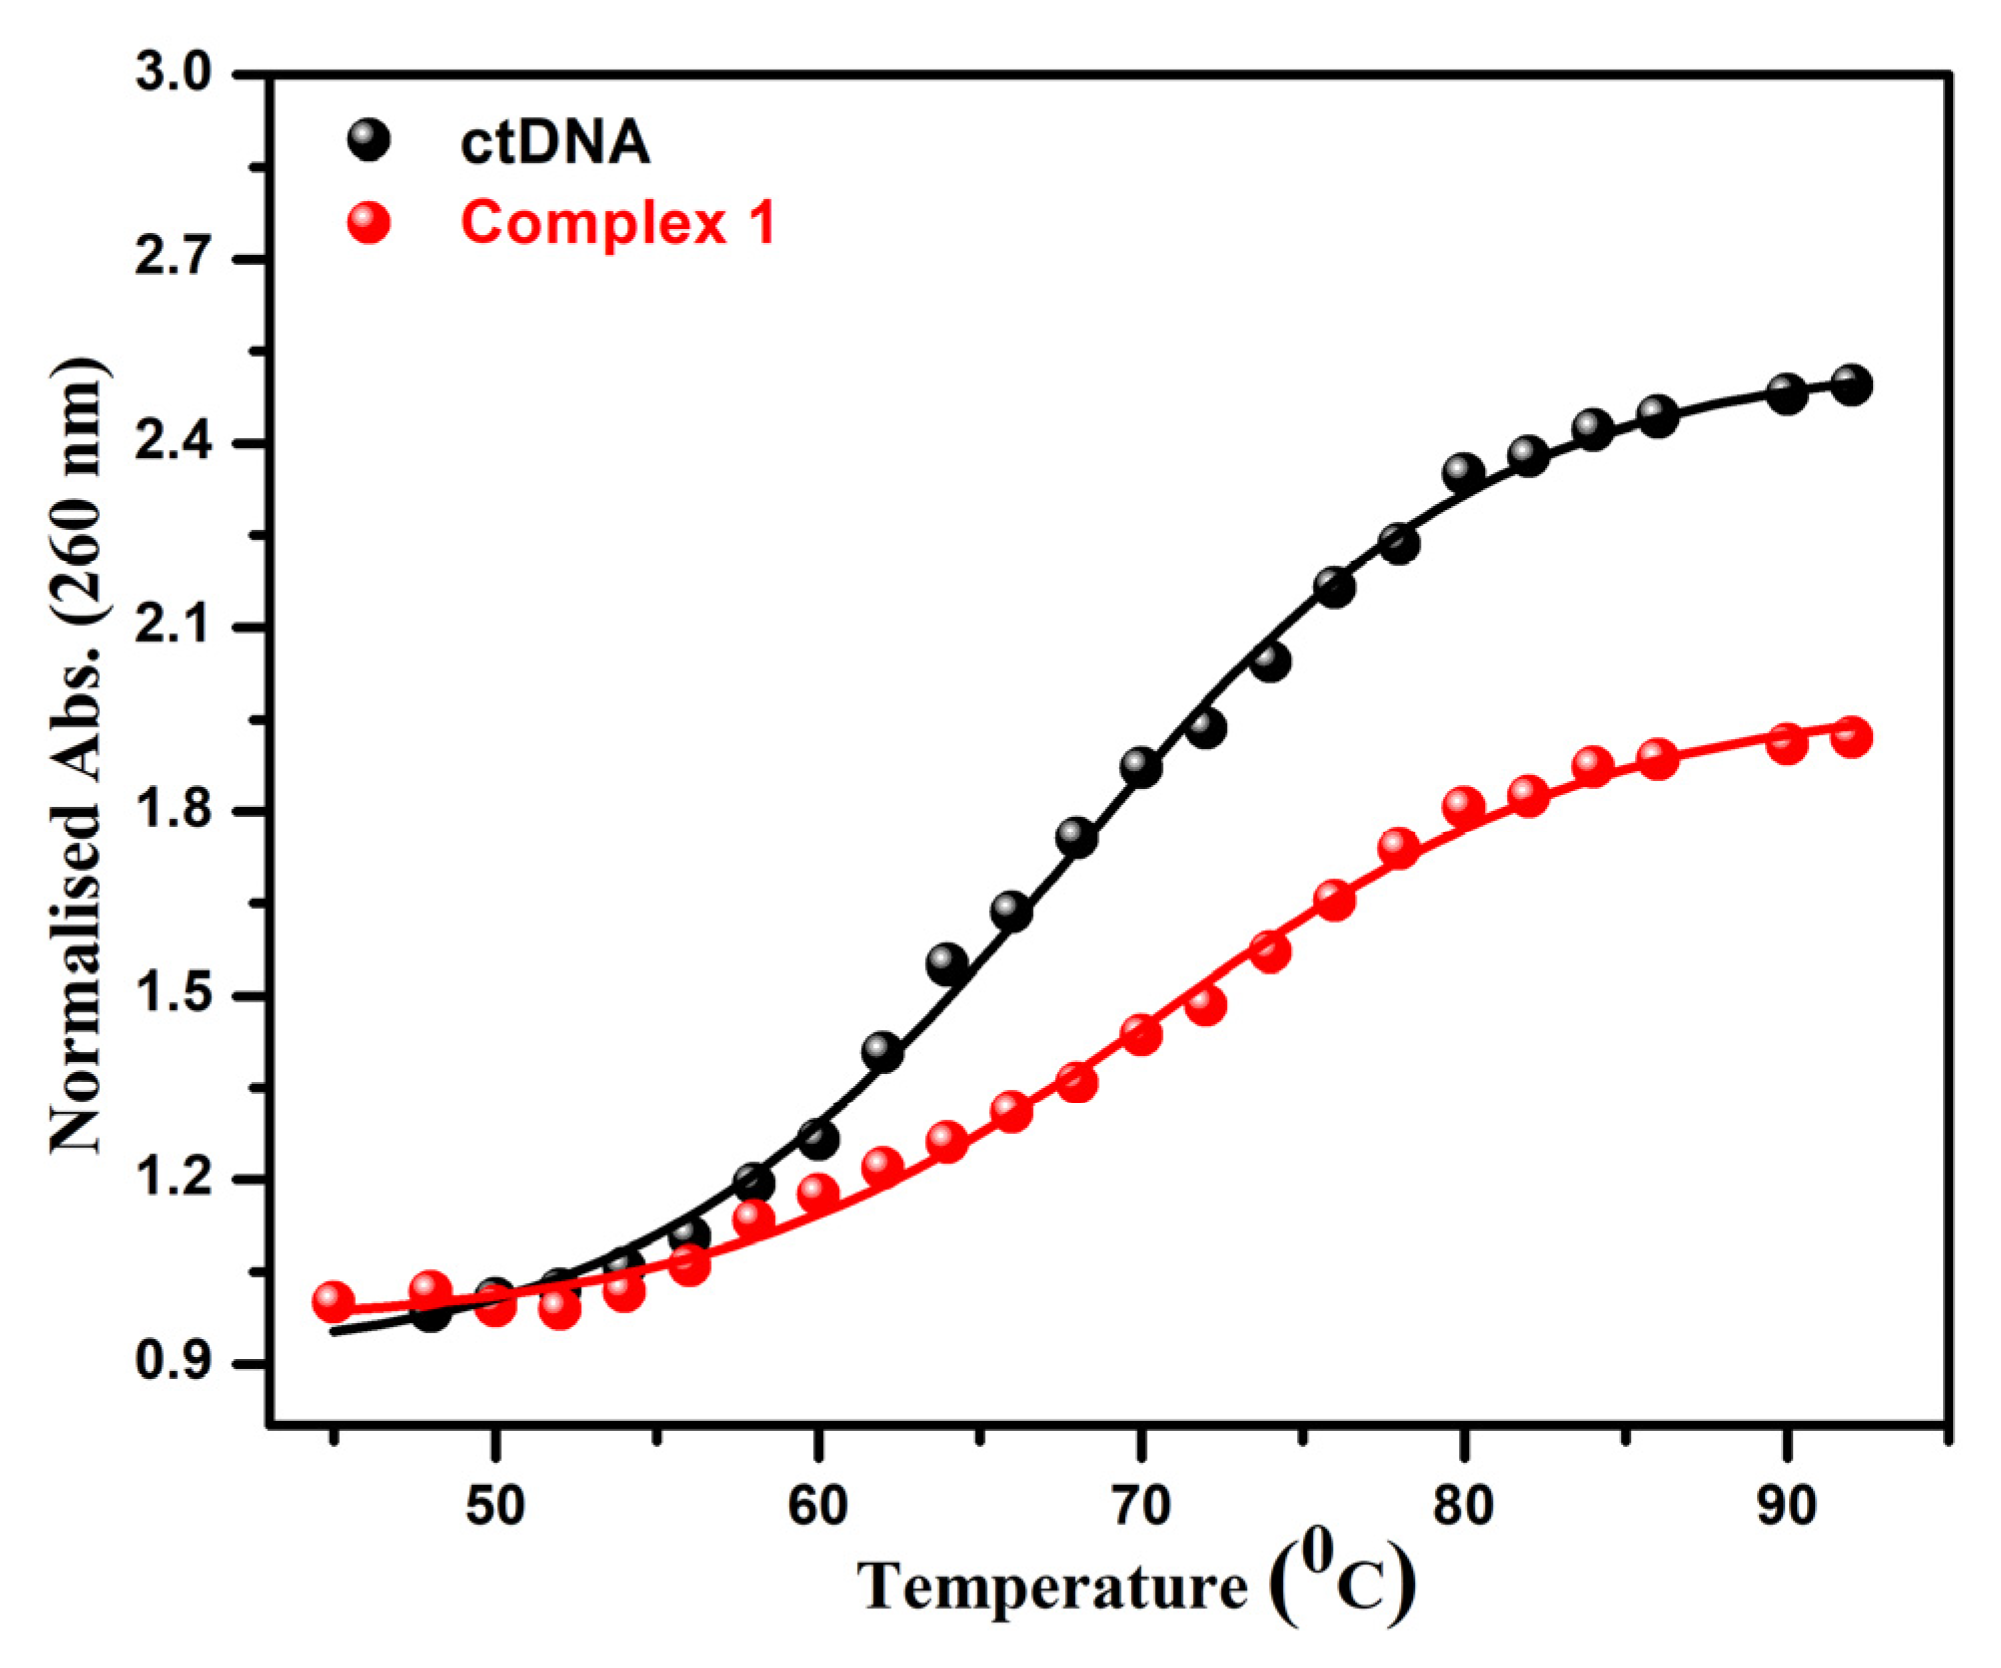
3.4.3. UV Optical Melting

A melting experiment was performed to predict the mode and relative binding strength of the metal complex to DNA [69]. Upon increasing the temperature of the DNA solution, hydrogen bonding of the DNA double helix was affected, resulting in the disruption of the helical structure. The damage which caused the transformation of ds-DNA into ss-DNA can be distinguished as the “hyperchromic effect” [70]. The range of ΔTm is the midpoint between the values triggered by different binding modes. Only a subtle change (1–3 °C) is observed in the case of groove binding or electrostatic mode of binding, while a high value is suggestive of an intercalative mode of binding (5–6 °C). With this consideration, the melting curve of ct-DNA (70 μM) in the absence and presence of complex 1 (10 μM) are presented in Figure 5. The melting temperature of free ctDNA was estimated to be 71.3 ± 0.3 °C. The addition of complex 1 to the DNA solution led to 74.6 ± 0.3 °C (Figure 5). The ΔTm values of DNA in the presence of complex 1 (3.3 °C) suggest that the complex binds to the DNA groove.

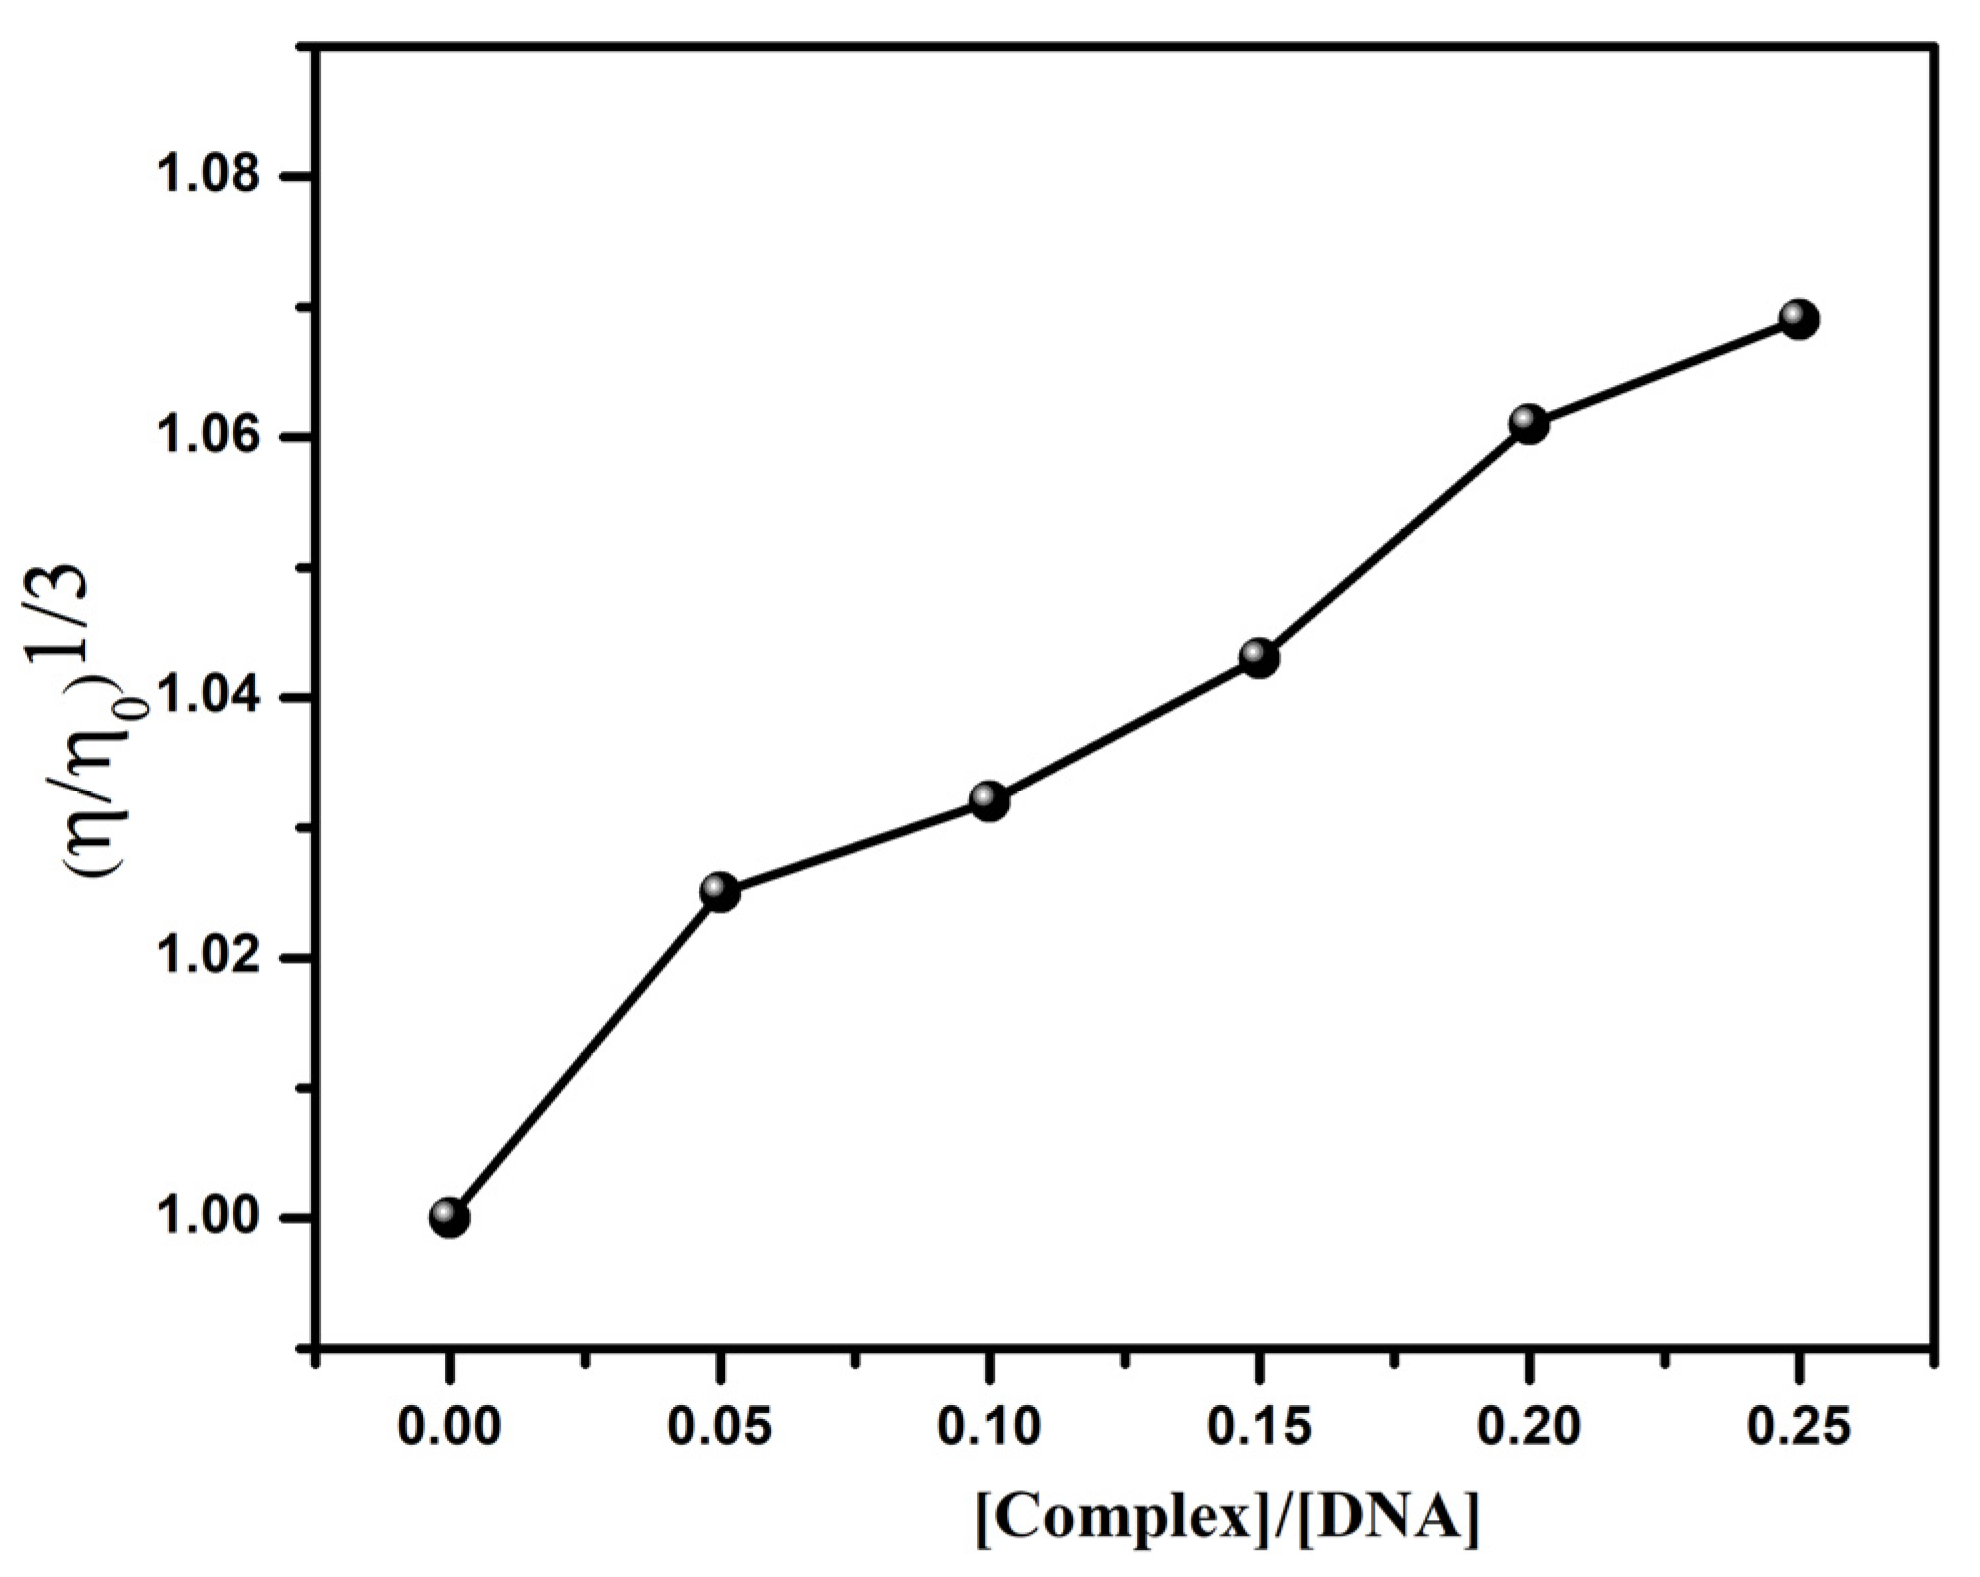
3.4.4. Viscosity Measurements

The viscosity measurement of DNA is the most reliable tool to explain the DNA-binding mode in absence of a crystal structure. Regarding intercalation, the enhancement of DNA viscosity is associated with the DNA length, owing to the stacking of the planar ring of the molecule between DNA base pairs [20]. On the contrary, the electrostatic and groove-binding mode leads to a twisting or bending in the DNA helix, with a slight decrease in the viscosity [71,72]. A plot between relative specific viscosity (η/ηo)1/3 versus the concentration of the complex 1/DNA ratio (r = 0.0, 0.05, 0.1, 0.15, 0.2, 0.25) is shown in Figure 6. A nominal rise in the DNA solution viscosity was observed in the presence of complex 1, suggesting the intercalation of their planar parts into the base pairs of double-helical DNA. However, the relative viscosity increments are much smaller than expected for a classical intercalator, indicating groove binding.

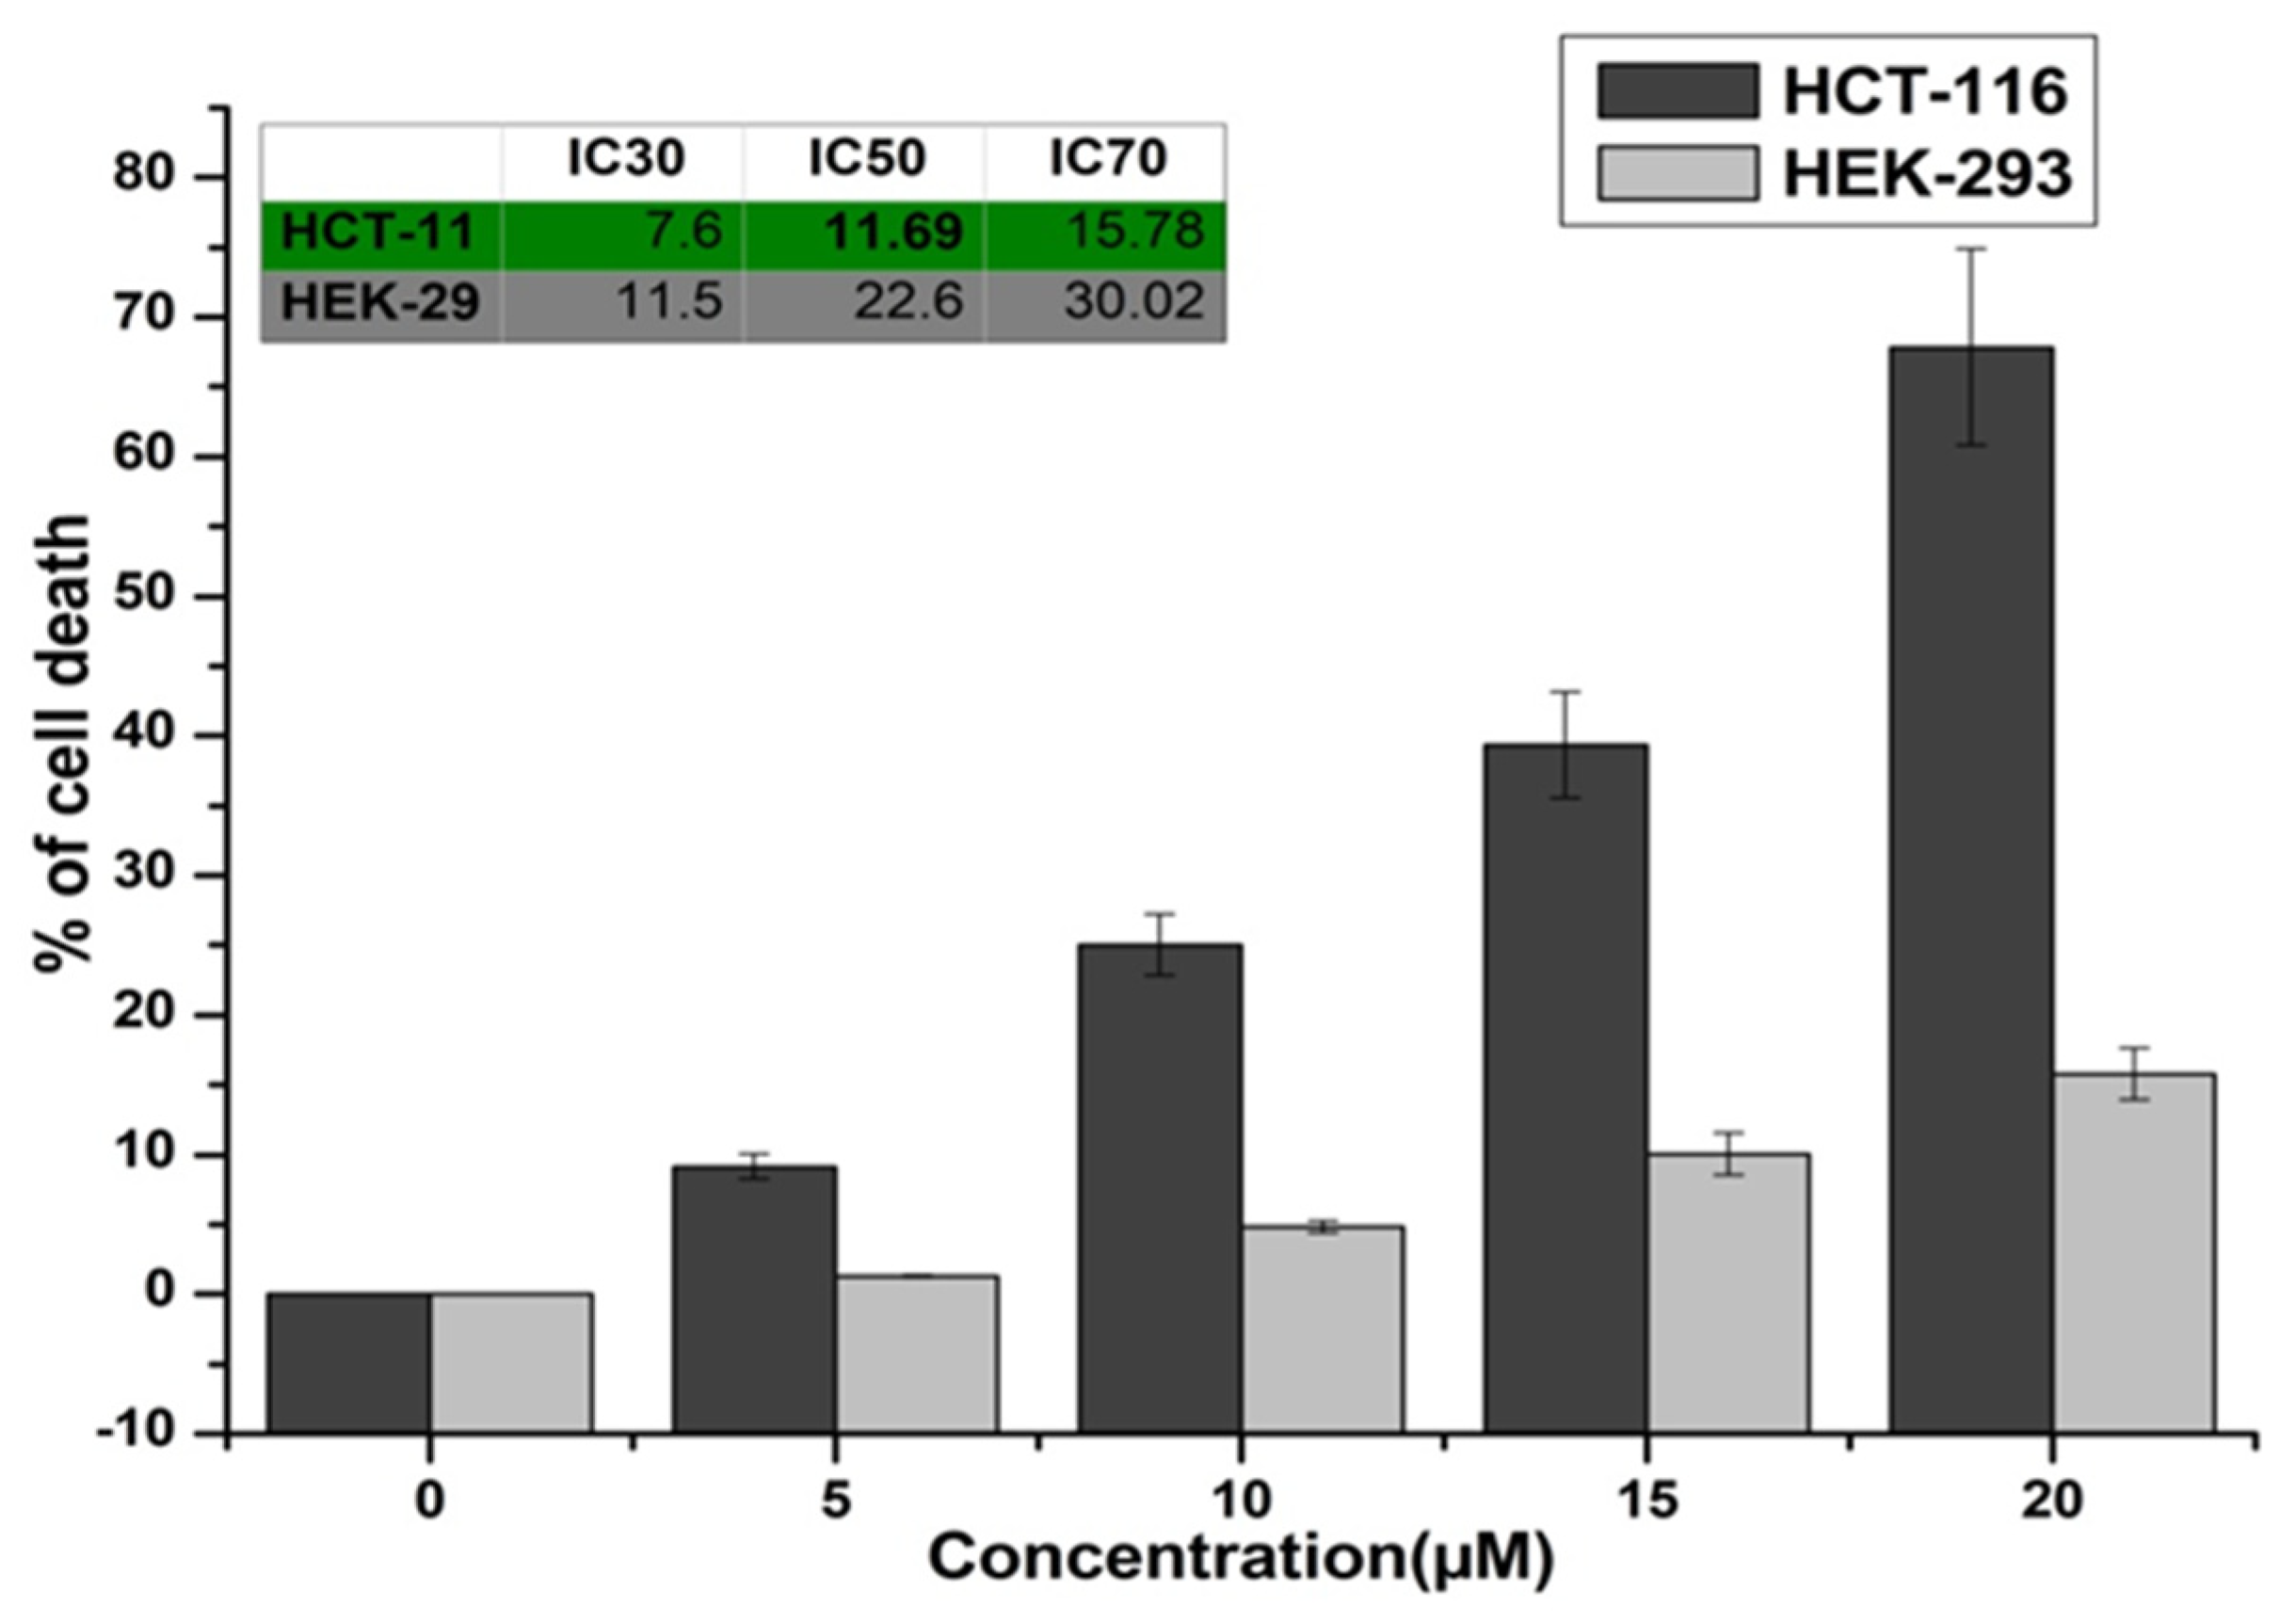
3.5. In Vitro Cytotoxicity

The cytotoxicity of complex 1 was performed at various concentrations (0–20 μM) against human colon cancer (HCT116) and human embryonic kidney 293 cells (HEK 293) using an MTT assay (Figure 7). In the case of the HCT116 cell line, more than 70% of cell deaths were observed at the concentration of 20 μM after 24 h. The data reveal that at 30%, 50%, and 70% HCT 116 cell deaths were observed at 7.6 μM, 11.6 μM, and 15.7 μM, respectively, of the complex 1 treatment after 24 h, whereas in the case of HEK 293, IC30, IC50, and IC70 were detected at 11.5 μM, 22.6 μM, and 30.02 μM, which is almost double compared to HCT 116, which exposes that complex 1 exhibits selective cytotoxicity towards HCT 116 cancer cells, leaving behind normal cells that are scarcely affected. Therefore, we preferred the IC50 value (11.6 μM) for further evaluation against HCT 116.

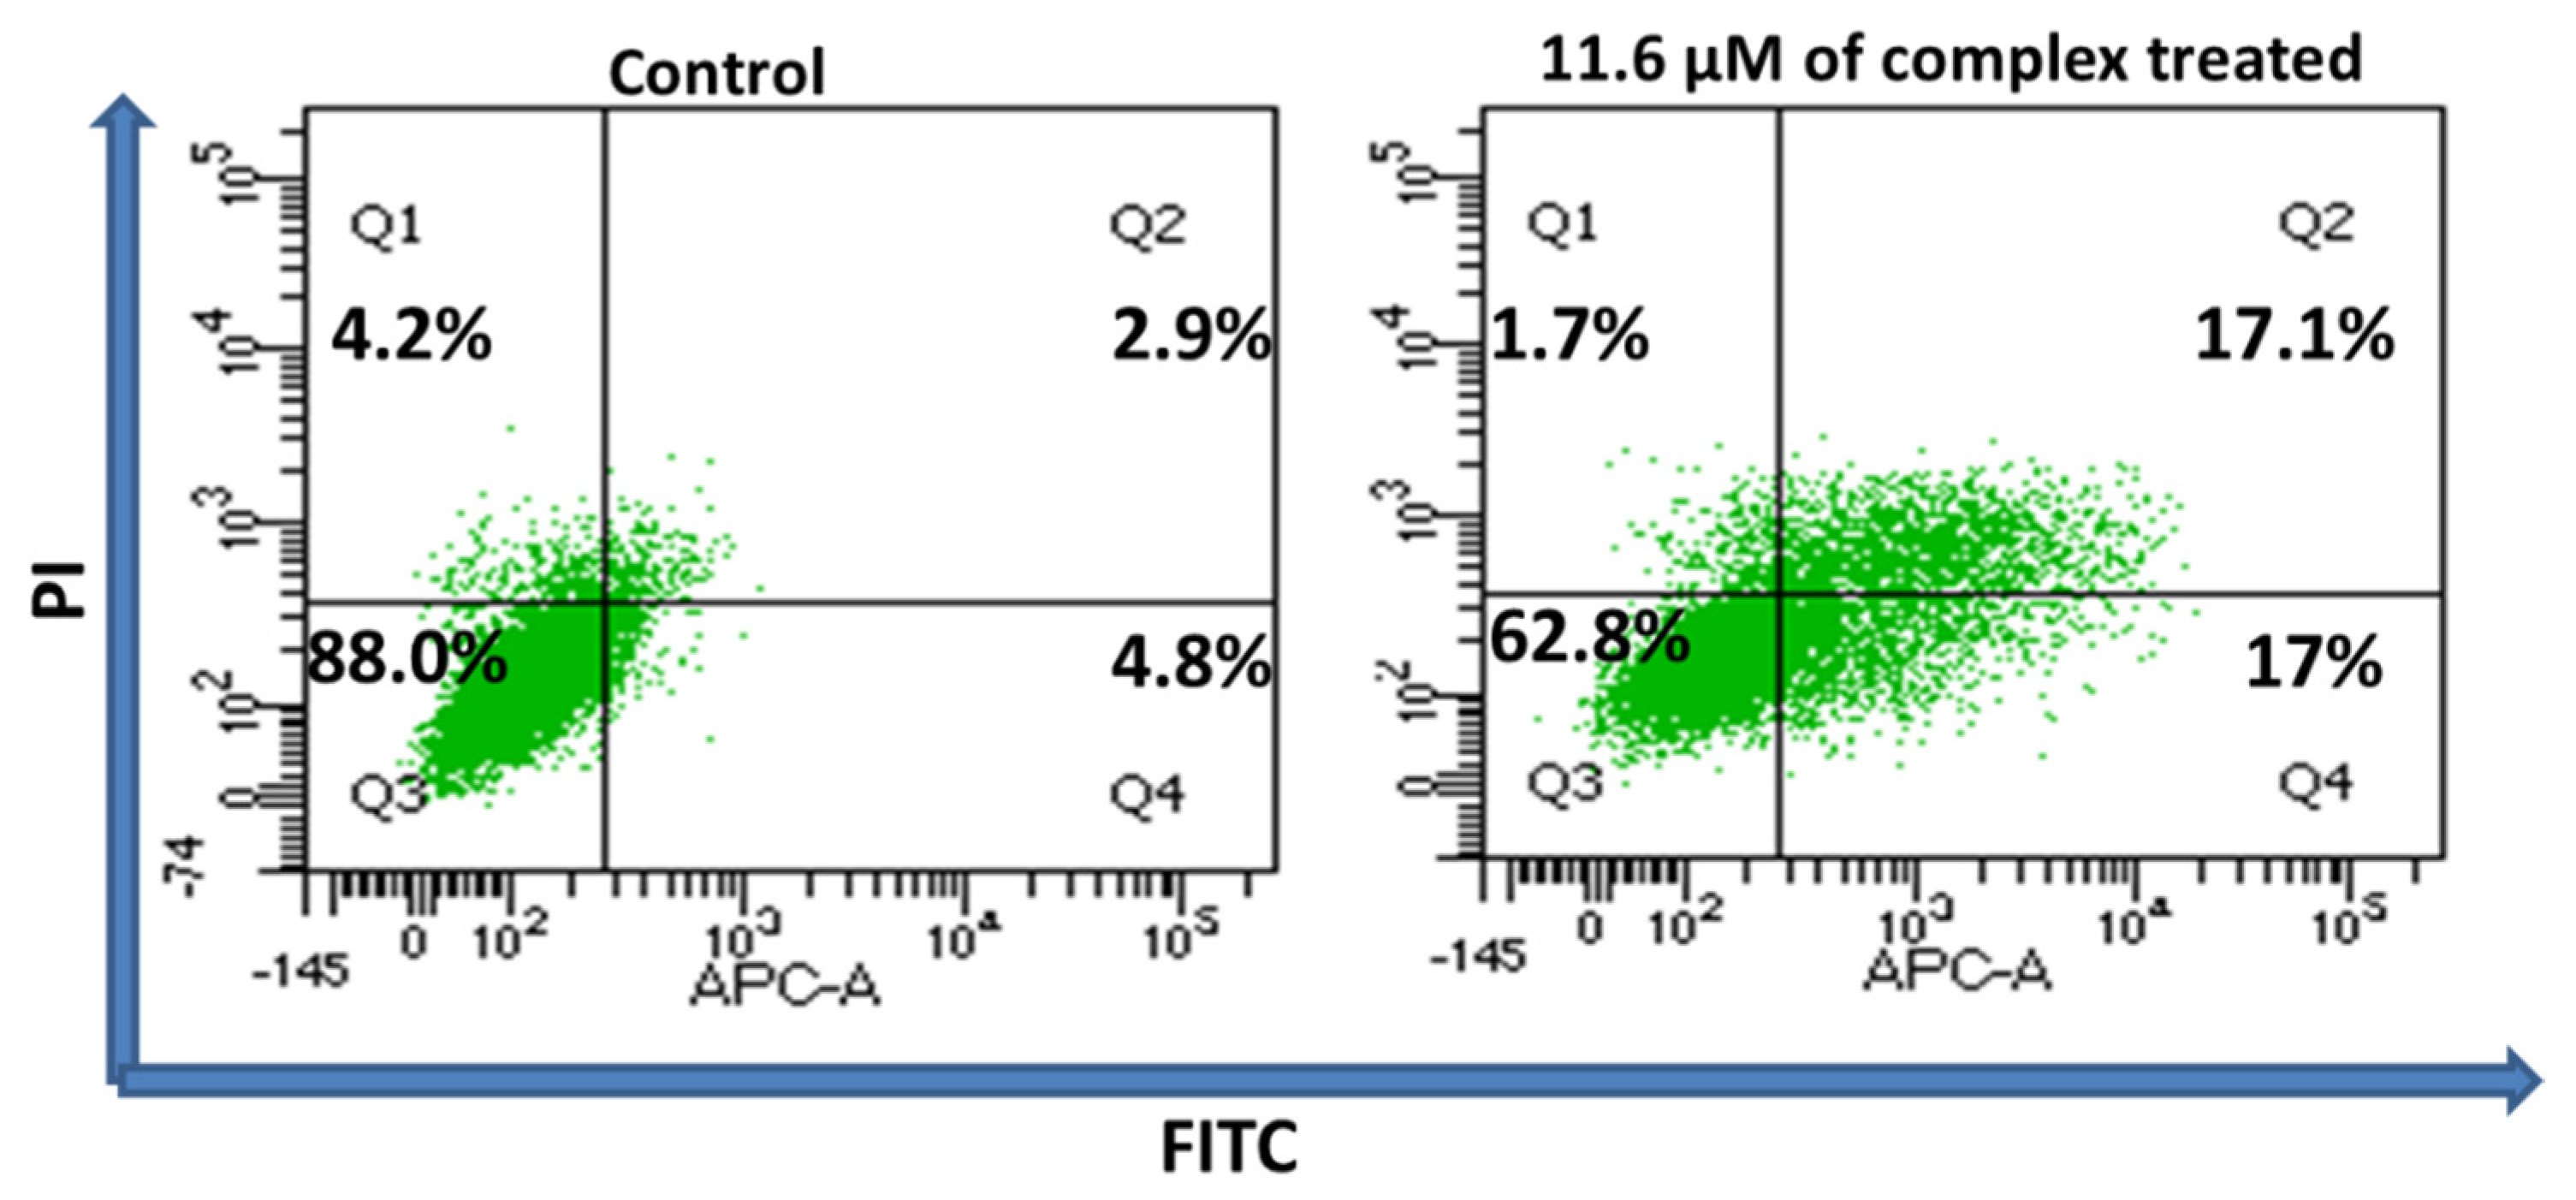
3.6. Quantification of Apoptosis and Necrosis Using Flow Cytometry

To determine the necessary mechanism of the anticancer effectiveness of complex 1 on HCT 116 cells, the flow cytometric technique was used to analyse using Annexin V-FITC/PI (Figure 8). The percentage of the viable cell population in the control was 88% following mild early apoptosis of 4.8%, late apoptosis of 2.9%, and necrosis of 4.2%. After 24 h of 11.6 μM of complex 1 treatment, the viable cell population was altered to 62.8%, resulting in mild early apoptosis of 17%, late apoptosis of 17.1% and necrosis of 1.7%. These data confirm that the cause of cytotoxicity of complex 1 was due to apoptosis.

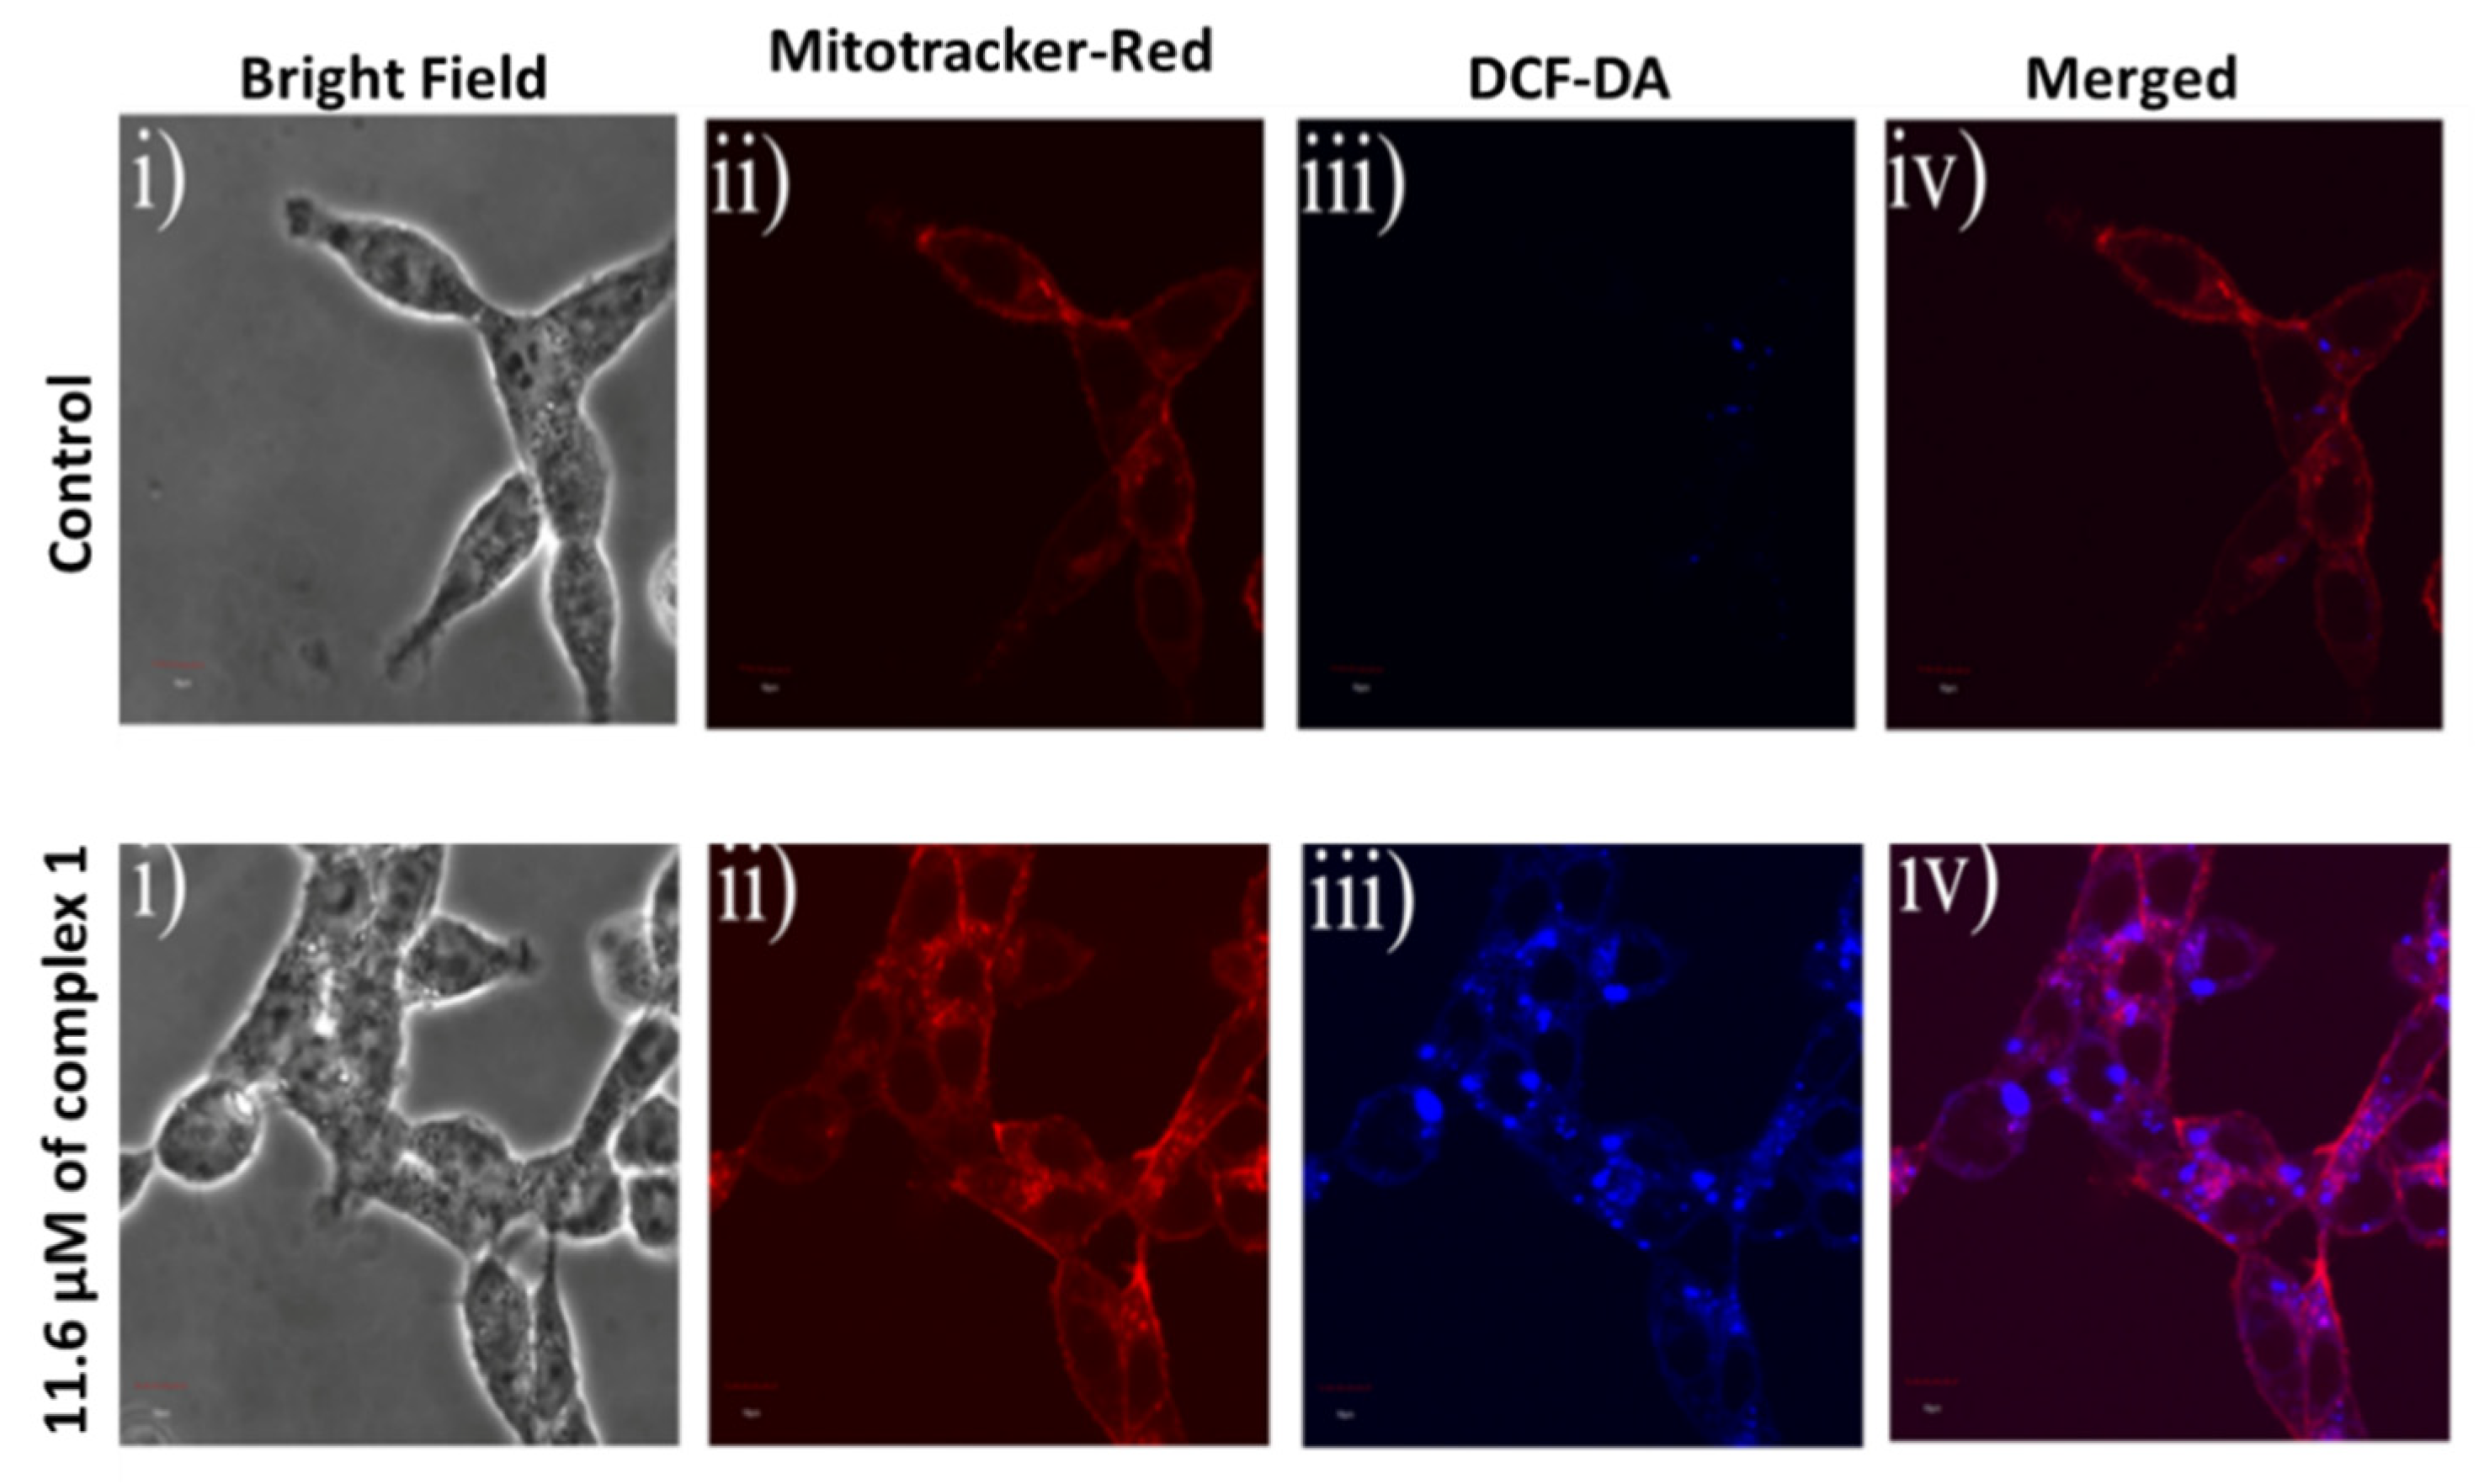
3.7. Quantification of Mitochondrial Reactive Oxygen Species (ROS)

We assessed the mitochondrial ROS by DCF-DA in the presence of Mitotracker Red (Figure 9) to elucidate the anticancer potential of complex 1. The microscopic data show that after 24 h of complex 1 (11.6 μM) treatment, mitochondrial ROS generation increased compared to the untreated one. This conformation exposes that the generation of ROS is the prime cause of apoptosis in HCT 116 cell line induced by complex 1.

3.8. DNA Fragmentation Assay

Elevated levels of reactive oxygen species (ROS) prompt oxidative damage to the DNA and other cell’s components and ultimately leads to cell death. Therefore, a DNA fragmentation assay was undertaken, in which the cells treated with complex 1 at different concentrations (0–20 μg/mL) were analysed for 24 h. Then, the resultant fragmented DNA was analysed using commercially accessible kits at 405 nm according to the earlier protocols [73,74]. The colorimetric data display that DNA fragmentation increased with the increasing concentration of 1 (Figure 10). Our experimental investigations revealed that cell death provoked by complex 1 is associated with typical apoptotic changes such as the externalization of phosphatidylserine and DNA fragmentation. In brief, the results clarify that complex 1’s facilitated apoptosis might be controlled through a mitochondrial ROS-driven DNA damage route, which has significant potential as an anticancer agent.

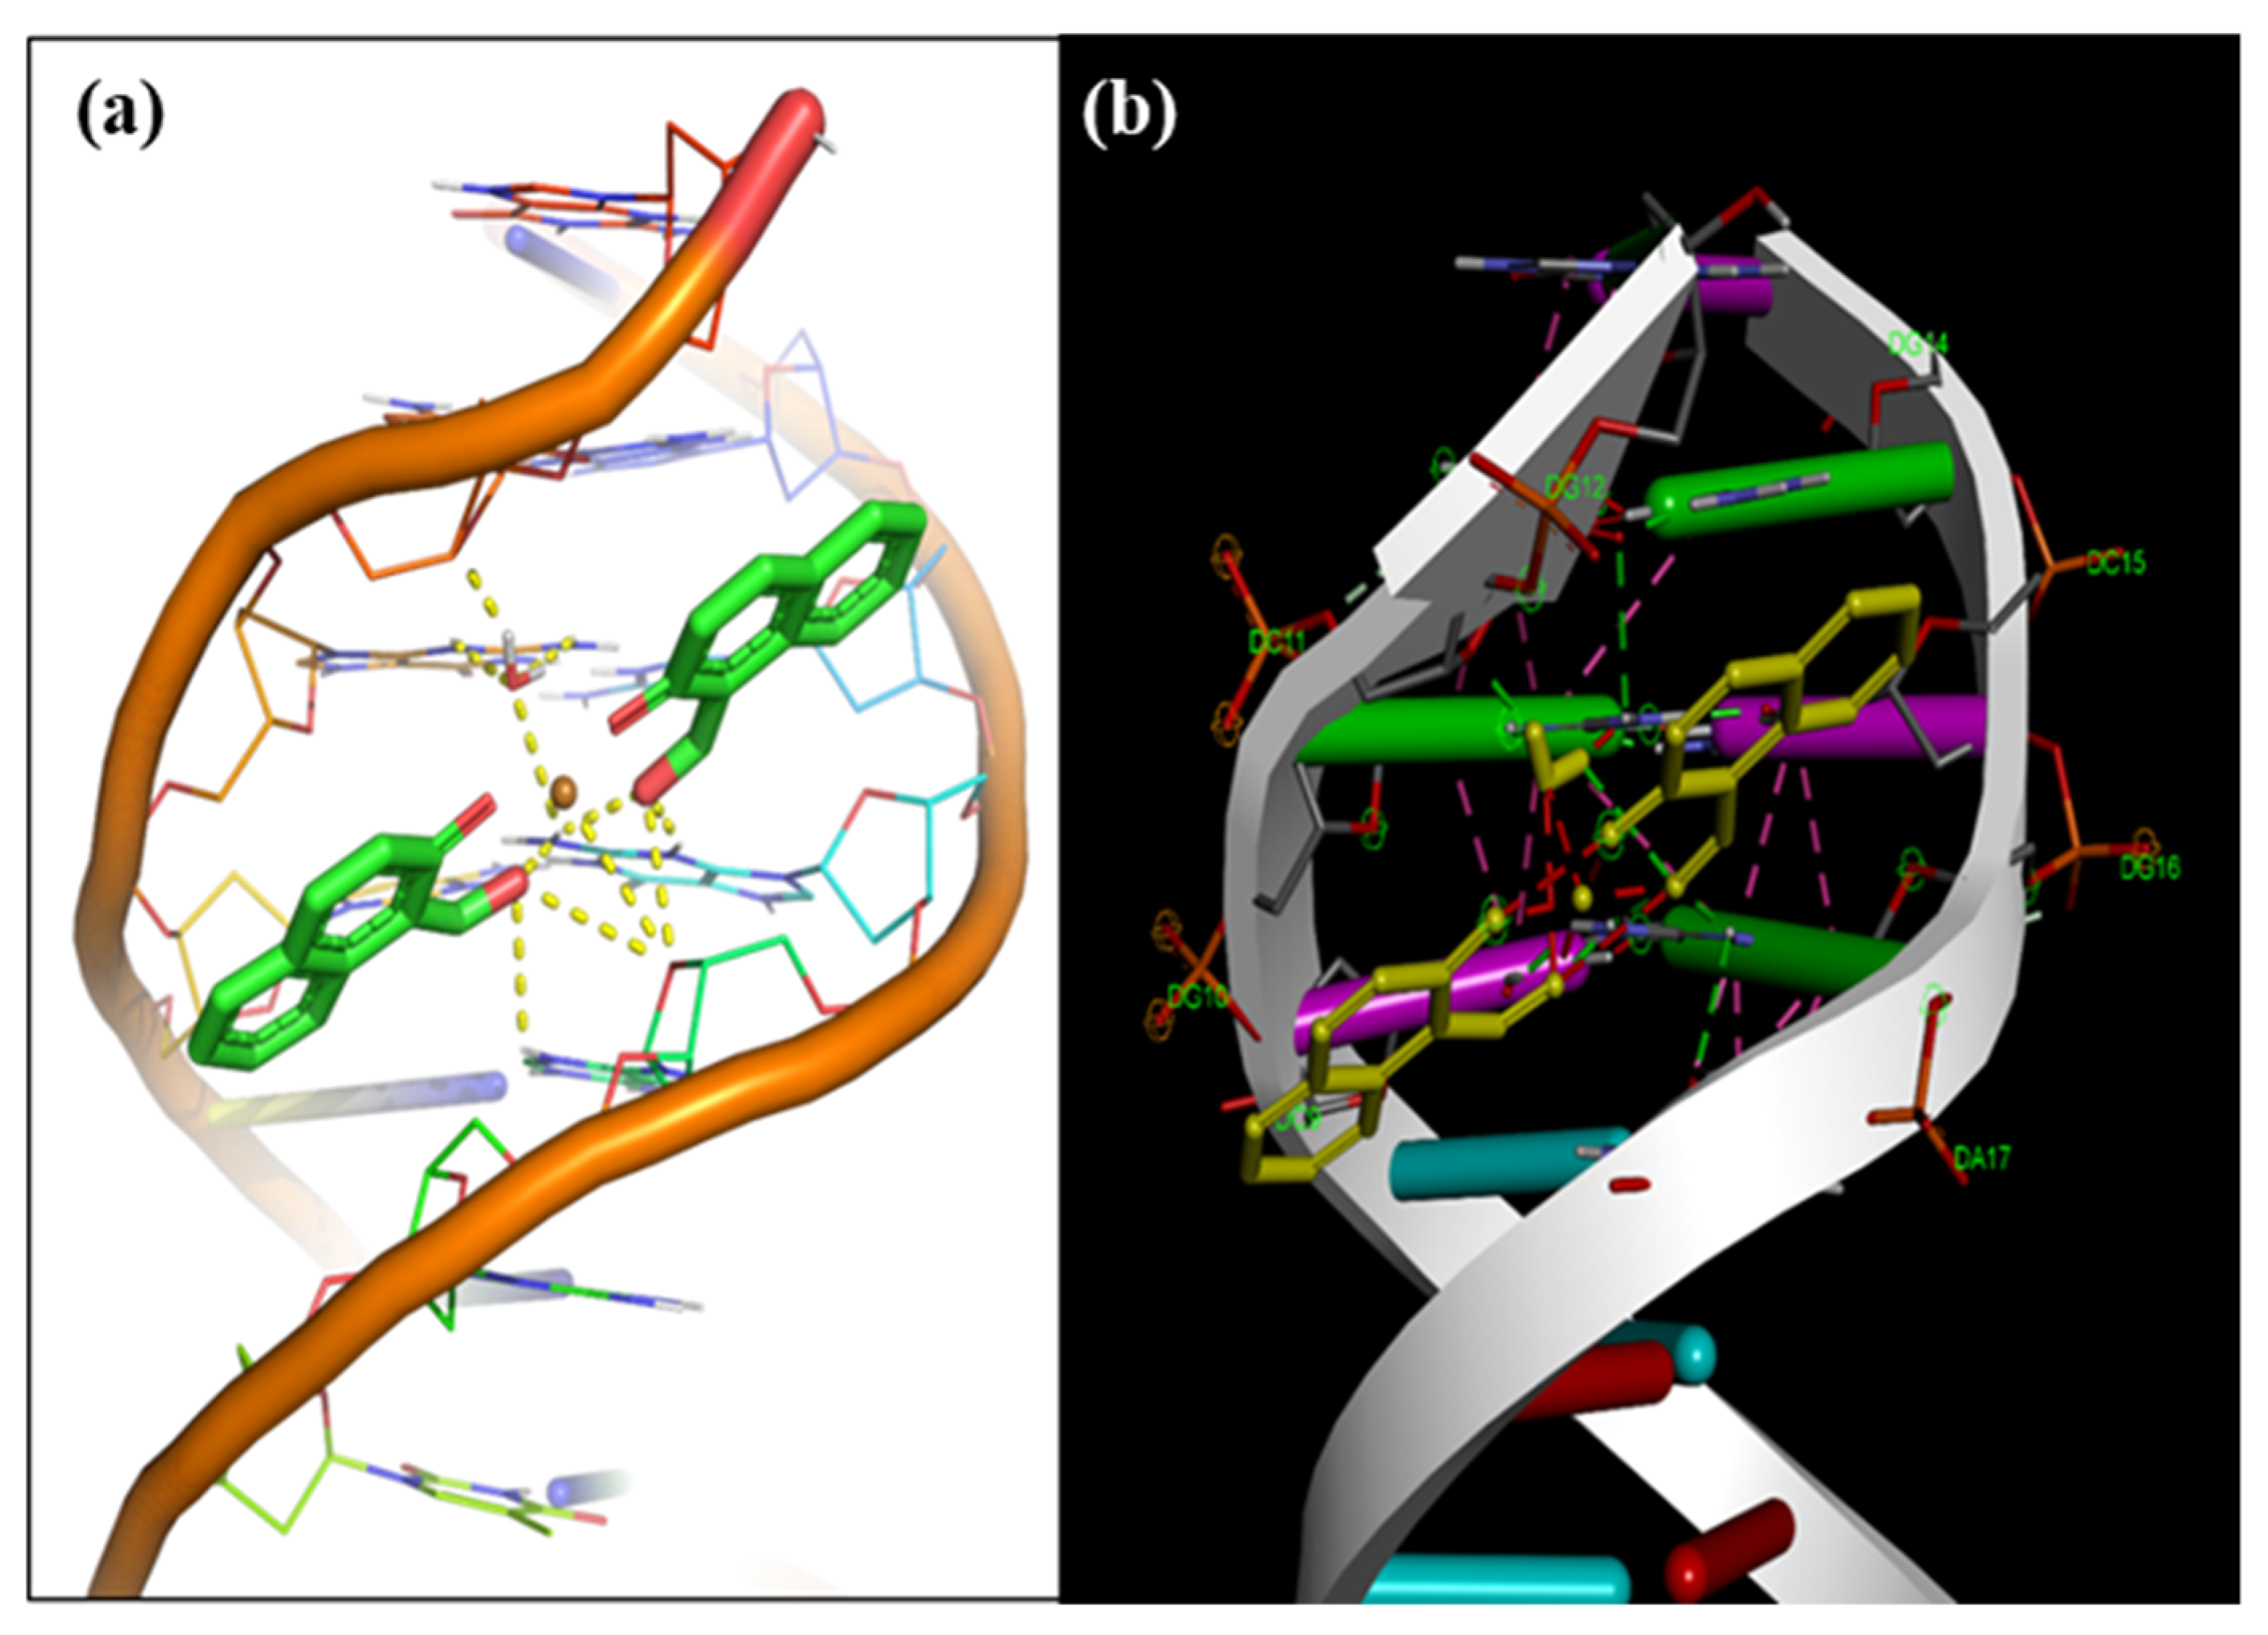
3.9. Molecular Docking

Molecular docking is an imposing computational tool that can be used visualize the molecules–DNA interaction to validate the experimental findings. The interaction of complex 1 with DNA was explored using AutoDock vina, which offered nine various conformations. Among these, the lowest binding energy conformation is presented in Figure 11a. The outcomes revealed that complex 1 bound to a minor groove of DNA with the binding energy of −10.0 kcal mol−1. Additionally, complex 1 formed two hydrogen bonds with dC11 and dD16 of the DNA (Figure 11b). Other nucleotides such as dC9, dG10, dG12, dG14, dC15, A17, etc. were also involved in the complexation.

4. Conclusions

Herein, we have discussed the structural elucidation and topological analysis of a Cu(II) complex (1), derived from 2-hydroxy-1-naphthaldehyde under basic conditions. To observe the outcome of complex 1 on DNA-binding propensity, several biophysical techniques were employed. The experimental results reveal the partial intercalation between the DNA nucleotides. Additionally, a molecular docking study was also performed, which shows that the complex binds to the minor groove of DNA via hydrogen bonding in the C–G region. Complex 1 showed potential inhibition activity against human colon cancer cell line (HCT116) in a dose-dependent mode. Moreover, complex 1 showed higher intracellular ROS levels and induced apoptosis via mitochondrial-mediated pathways. Therefore, it is established that a synergistic combination of ligands and Cu(II) metal ions is important for the realization Cu(II)-based anticancer drug.

Supplementary Materials

The following are available online at https://www.mdpi.com/article/10.3390/cryst12010015/s1. The details of X-ray crystal refinement, protocols, molecular docking, and other material related to topological analysis; Table S1–S5; Selected bond lengths [Å], bond angles [°], hydrogen atom coordinates, multilevel analysis of molecular complex packing as monomer, and dimer of complex 1. Figure S1: IR spectrum; Figure S2: UV-Vis; Figure S3: TGA pattern; Figure S4: PXRD; Figure S5–S8: Topological analysis; Figure S9: Hirshfeld surface mapped over; Figure S10: 2D fingerprint plot.

Author Contributions

All authors have contributed reasonably and take full liability for the work. All authors approve the corresponding authors (M.A. and M.M.) as the representative persons for the manuscript conduct. Validation, preparation, creation of the published work, and specifically writing the initial draft, M.A. and E.A.; Validation, Formal analysis, E.A. and M.A.; Data curation, M.A.; Methodology, formal analysis, M.A.; Resources, A.A., M.M. and A.B.; Funding acquisition, A.A.; Project administration, M.A., M.M., A.A., and A.B.; Visualization, E.A. and M.A. All authors have read and agreed to the published version of the manuscript.

Funding

The authors extend their sincere appreciation to the Researchers Supporting Project number (RSP-2021/288), King Saud University, Riyadh, Saudi Arabia for financial support.

Institutional Review Board Statement

Not applicable.

Informed Consent Statement

Not applicable.

Data Availability Statement

Not applicable.

Conflicts of Interest

There are no conflict to declare.

References

  1. Araghi, M.; Soerjomataram, I.; Jenkins, M.; Brierley, J.; Morris, E.; Bray, F.; Arnold, M. Global trends in colorectal cancer mortality: Projections to the year 2035. Int. J. Cancer 2019, 144, 2992–3000. [Google Scholar] [CrossRef] [Green Version]
  2. Ferlay, J.; Soerjomataram, I.; Dikshit, R.; Eser, S.; Mathers, C.; Rebelo, M.; Parkin, D.M.; Forman, D.; Bray, F. Cancer incidence and mortality worldwide: Sources, methods and major patterns in GLOBOCAN 2012. Int. J. Cancer 2015, 136, E359–E386. [Google Scholar] [CrossRef]
  3. González-Ballesteros, N.; Pérez-Álvarez, D.; Rodríguez-Argüelles, M.C.; Henriques, M.S.C.; Paixão, J.A.; Prado-López, S. Synthesis, spectral characterization and X-ray crystallographic study of new copper(I) complexes. Antitumor activity in colon cancer. Polyhedron 2016, 119, 112–119. [Google Scholar] [CrossRef]
  4. Hanahan, D.; Weinberg, R.A. Hallmarks of Cancer: The Next Generation. Cell 2011, 144, 646–674. [Google Scholar] [CrossRef] [Green Version]
  5. Li, Y.; Sun, Z.; Cui, Y.; Zhang, H.; Zhang, S.; Wang, X.; Liu, S.; Gao, Q. Oxaliplatin derived monofunctional triazole-containing platinum(II) complex counteracts oxaliplatin-induced drug resistance in colorectal cancer. Bioorg. Chem. 2021, 107, 104636. [Google Scholar] [CrossRef] [PubMed]
  6. Golshani, G.; Zhang, Y. Advances in immunotherapy for colorectal cancer: A review. Therap. Adv. Gastroenterol. 2020, 13, 175628482091752. [Google Scholar] [CrossRef]
  7. Wahab, S.; Alshahrani, M.Y.; Ahmad, M.F.; Abbas, H. Current trends and future perspectives of nanomedicine for the management of colon cancer. Eur. J. Pharmacol. 2021, 910, 174464. [Google Scholar] [CrossRef]
  8. Park, J.; Baik, H.; Kang, S.H.; Seo, S.H.; Kim, K.H.; Oh, M.K.; Lee, H.S.; Lee, S.H.; Kim, K.H.; An, M.S. Comparison between oxaliplatin therapy and capecitabine monotherapy for high-risk stage II–III elderly colon cancer patients. Asian J. Surg. 2021. [Google Scholar] [CrossRef] [PubMed]
  9. Rottenberg, S.; Disler, C.; Perego, P. The rediscovery of platinum-based cancer therapy. Nat. Rev. Cancer 2021, 21, 37–50. [Google Scholar] [CrossRef] [PubMed]
  10. Bhattacharjee, A.; Das, S.; Das, B.; Roy, P. Intercalative DNA binding, protein binding, antibacterial activities and cytotoxicity studies of a mononuclear copper(II) complex. Inorganica Chim. Acta 2021, 514, 119961. [Google Scholar] [CrossRef]
  11. Bhattacharjee, M.; Boruah, S.R.; Dutta Purkayastha, R.N.; Ganguly, R.; Maiti, D.; Franconetti, A.; Frontera, A.; Kirillov, A.M.; Chowdhury, S.; Roy, S.; et al. Synthesis, characterization, DNA binding ability, in vitro cytotoxicity, electrochemical properties and theoretical studies of copper(II) carboxylate complexes. Inorganica Chim. Acta 2021, 518, 120235. [Google Scholar] [CrossRef]
  12. Liccardi, G.; Hartley, J.A.; Hochhauser, D. EGFR Nuclear Translocation Modulates DNA Repair following Cisplatin and Ionizing Radiation Treatment. Cancer Res. 2011, 71, 1103–1114. [Google Scholar] [CrossRef] [PubMed] [Green Version]
  13. Bharathi, S.; Mahendiran, D.; Kumar, R.S.; Kim, Y.G.; Gajendiran, M.; Kim, K.; Rahiman, A.K. Biocompatibility, in Vitro Antiproliferative, and in Silico EGFR/VEGFR2 Studies of Heteroleptic Metal(II) Complexes of Thiosemicarbazones and Naproxen. Chem. Res. Toxicol. 2019, 32, 1554–1571. [Google Scholar] [CrossRef] [PubMed]
  14. Hara, T.; Tatsuishi, H.; Banno, T.; Fujie, T.; Yamamoto, C.; Naka, H.; Kaji, T. Copper(II) Bis(diethyldithiocarbamate) Induces the Expression of Syndecan-4, a Transmembrane Heparan Sulfate Proteoglycan, via p38 MAPK Activation in Vascular Endothelial Cells. Int. J. Mol. Sci. 2018, 19, 3302. [Google Scholar] [CrossRef] [PubMed] [Green Version]
  15. Ng, C.H.; Kong, S.M.; Tiong, Y.L.; Maah, M.J.; Sukram, N.; Ahmad, M.; Khoo, A.S.B. Selective anticancer copper(II)-mixed ligand complexes: Targeting of ROS and proteasomes. Metallomics 2014, 6, 892–906. [Google Scholar] [CrossRef]
  16. Annaraj, B.; Balakrishnan, C.; Neelakantan, M.A. Synthesis, structure information, DNA/BSA binding affinity and in vitro cytotoxic studies of mixed ligand copper(II) complexes containing a phenylalanine derivative and diimine co-ligands. J. Photochem. Photobiol. B Biol. 2016, 160, 278–291. [Google Scholar] [CrossRef] [PubMed]
  17. Baskaran, S.; Krishnan, M.M.; Arumugham, M.N.; Kumar, R. Synthesis, crystal structure, DNA interaction, DFT analysis and molecular docking studies of copper(II) complexes with 1-methyl-l-tryptophan and phenanthroline units. J. Mol. Struct. 2021, 1224, 129236. [Google Scholar] [CrossRef]
  18. Shanbhag, V.C.; Gudekar, N.; Jasmer, K.; Papageorgiou, C.; Singh, K.; Petris, M.J. Copper metabolism as a unique vulnerability in cancer. Biochim. Biophys. Acta-Mol. Cell Res. 2021, 1868, 118893. [Google Scholar] [CrossRef]
  19. Denoyer, D.; Masaldan, S.; La Fontaine, S.; Cater, M.A. Targeting copper in cancer therapy: ‘Copper That Cancer. ’ Metallomics 2015, 7, 1459–1476. [Google Scholar] [CrossRef]
  20. Zarei, L.; Asadi, Z.; Dusek, M.; Eigner, V. Homodinuclear Ni(II) and Cu(II) Schiff base complexes derived from O-vanillin with a pyrazole bridge: Preparation, crystal structures, DNA and protein (BSA) binding, DNA cleavage, molecular docking and cytotoxicity study. J. Photochem. Photobiol. A Chem. 2019, 374, 145–160. [Google Scholar] [CrossRef]
  21. Paul, A.; Mistri, S.; Bertolasi, V.; Manna, S.C. DNA/protein binding and molecular docking studies of two tetranuclear Cu(II) complexes with double-open-cubane core like structure. Inorganica Chim. Acta 2019, 495, 119005. [Google Scholar] [CrossRef]
  22. Liu, H.-K.; Sadler, P.J. Metal Complexes as DNA Intercalators. Acc. Chem. Res. 2011, 44, 349–359. [Google Scholar] [CrossRef] [PubMed]
  23. Mohideen, M.; Kamaruzaman, N.A.; Hamali, M.A.; Mordi, M.N.; Mansor, S.M.; Rahman, A.F.M.M. N,N-Bis(Substituted benzyl)-β-Carbolineum Bromides as Potential Anticancer Therapeutics: Design, Synthesis, Cytotoxicity, Drug-DNA Intercalation and In-Silico Binding Properties. J. Mol. Struct. 2021, 1243, 130771. [Google Scholar] [CrossRef]
  24. Brissos, R.F.; Torrents, E.; Mariana dos Santos Mello, F.; Carvalho Pires, W.; de Paula Silveira-Lacerda, E.; Caballero, A.B.; Caubet, A.; Massera, C.; Roubeau, O.; Teat, S.J.; et al. Highly cytotoxic DNA-interacting copper(II) coordination compounds. Metallomics 2014, 6, 1853–1868. [Google Scholar] [CrossRef] [PubMed] [Green Version]
  25. Rigamonti, L.; Reginato, F.; Ferrari, E.; Pigani, L.; Gigli, L.; Demitri, N.; Kopel, P.; Tesarova, B.; Heger, Z. From solid state to in vitro anticancer activity of copper(II) compounds with electronically-modulated NNO Schiff base ligands. Dalt. Trans. 2020, 49, 14626–14639. [Google Scholar] [CrossRef]
  26. Mondal, S.S.; Jaiswal, N.; Bera, P.S.; Tiwari, R.K.; Behera, J.N.; Chanda, N.; Ghosal, S.; Saha, T.K. Cu(II) and Co(II/III) complexes of N,O-chelated Schiff base ligands: DNA interaction, protein binding, cytotoxicity, cell death mechanism and reactive oxygen species generation studies. Appl. Organomet. Chem. 2021, 35. [Google Scholar] [CrossRef]
  27. Zianna, A.; Psomas, G.; Hatzidimitriou, A.; Lalia-Kantouri, M. Copper(II) complexes of salicylaldehydes and 2-hydroxyphenones: Synthesis, structure, thermal decomposition study and interaction with calf-thymus DNA and albumins. RSC Adv. 2015, 5, 37495–37511. [Google Scholar] [CrossRef]
  28. Tabassum, S.; Afzal, M.; Arjmand, F. New heterobimetallic complex as potential topoisomerase I inhibitor: In vitro DNA binding, cleavage and cytotoxicity against human cancer cell lines. J. Photochem. Photobiol. B Biol. 2012, 115, 63–72. [Google Scholar] [CrossRef]
  29. Festa, R.A.; Thiele, D.J. Copper: An essential metal in biology. Curr. Biol. 2011, 21, R877–R883. [Google Scholar] [CrossRef] [Green Version]
  30. Du, X.; Li, H.; Wang, X.; Liu, Q.; Ni, J.; Sun, H. Kinetics and thermodynamics of metal binding to the N-terminus of a human copper transporter, hCTR1. Chem. Commun. 2013, 49, 9134. [Google Scholar] [CrossRef]
  31. Ivy, K.D.; Kaplan, J.H. A Re-Evaluation of the Role of hCTR1, the Human High-Affinity Copper Transporter, in Platinum-Drug Entry into Human Cells. Mol. Pharmacol. 2013, 83, 1237–1246. [Google Scholar] [CrossRef] [PubMed] [Green Version]
  32. Gupta, A.; Lutsenko, S. Human copper transporters: Mechanism, role in human diseases and therapeutic potential. Future Med. Chem. 2009, 1, 1125–1142. [Google Scholar] [CrossRef] [Green Version]
  33. Holden, L.; Burke, C.S.; Cullinane, D.; Keyes, T.E. Strategies to promote permeation and vectorization, and reduce cytotoxicity of metal complex luminophores for bioimaging and intracellular sensing. RSC Chem. Biol. 2021, 2, 1021–1049. [Google Scholar] [CrossRef]
  34. Zhang, Z.; Buffle, J.; van Leeuwen, H.P.; Wojciechowski, K. Roles of Metal Ion Complexation and Membrane Permeability in the Metal Flux through Lipophilic Membranes. Labile Complexes at Permeation Liquid Membranes. Anal. Chem. 2006, 78, 5693–5703. [Google Scholar] [CrossRef]
  35. Liu, C. DNA damage by copper(II) complexes: Coordination-structural dependence of reactivities. J. Inorg. Biochem. 1999, 75, 233–240. [Google Scholar] [CrossRef]
  36. De Medeiros, W.M.T.Q.; de Medeiros, M.J.C.; Carvalho, E.M.; de Lima, J.A.; da S. Oliveira, V.; de B. Pontes, A.C.F.; da Silva, F.O.N.; Ellena, J.A.; de O. Rocha, H.A.; de Sousa, E.H.S.; et al. A vanillin-based copper(II) metal complex with a DNA-mediated apoptotic activity. RSC Adv. 2018, 8, 16873–16886. [Google Scholar] [CrossRef] [Green Version]
  37. Mukherjee, S.; Chowdhury, S.; Ghorai, A.; Ghosh, U.; Stoeckli-Evans, H. Synthesis, structure, interaction with DNA and cytotoxicity of a luminescent copper(II) complex with a hydrazone ligand. Polyhedron 2013, 51, 228–234. [Google Scholar] [CrossRef]
  38. Khan, M.H.; Cai, M.; Deng, J.; Yu, P.; Liang, H.; Yang, F. Anticancer Function and ROS-Mediated Multi-Targeting Anticancer Mechanisms of Copper(II) 2-hydroxy-1-naphthaldehyde Complexes. Molecules 2019, 24, 2544. [Google Scholar] [CrossRef] [Green Version]
  39. Abbasi, Z.; Salehi, M.; Khaleghian, A.; Kubicki, M. In vitro cytotoxic activity of a novel Schiff base ligand derived from 2-hydroxy-1-naphthaldehyde and its mononuclear metal complexes. J. Mol. Struct. 2018, 1173, 213–220. [Google Scholar] [CrossRef]
  40. Li, J.; Dong, J.; Cui, H.; Xu, T.; Li, L. A copper(II) complex of the Schiff base from l-valine and 2-hydroxy-1-naphthalidene plus 1,10-phenanthroline: Synthesis, crystal structure, and DNA interaction. Transit. Met. Chem. 2012, 37, 175–182. [Google Scholar] [CrossRef]
  41. Nagesh, G.Y.; Mruthyunjayaswamy, B.H.M. Synthesis, characterization and biological relevance of some metal(II) complexes with oxygen, nitrogen and oxygen (ONO) donor Schiff base ligand derived from thiazole and 2-hydroxy-1-naphthaldehyde. J. Mol. Struct. 2015, 1085, 198–206. [Google Scholar] [CrossRef]
  42. Hajrezaie, M.; Paydar, M.; Zorofchian Moghadamtousi, S.; Hassandarvish, P.; Gwaram, N.S.; Zahedifard, M.; Rouhollahi, E.; Karimian, H.; Looi, C.Y.; Ali, H.M.; et al. A Schiff Base-Derived Copper(II) Complex Is a Potent Inducer of Apoptosis in Colon Cancer Cells by Activating the Intrinsic Pathway. Sci. World J. 2014, 2014, 1–12. [Google Scholar] [CrossRef]
  43. Yu, Q.; Li, C.-Y.; Yang, X.-E.; He-Dong, B.; Liang, H. Aquabis(1-formyl-2-naphtholato-κ2 O,O′)copper(II). Acta Crystallogr. Sect. E Struct. Reports Online 2006, 62, m391–m393. [Google Scholar] [CrossRef]
  44. Afzal, M.; Alarifi, A.; Hasnain, M.S.; Muddassir, M. Elucidation of DNA binding interaction of new Cu(II)/Zn(II) complexes derived from Schiff base and L-tryptophan amino acid: A multispectroscopic and molecular docking approach. Environ. Sci. Pollut. Res. 2021, 28, 44039–44050. [Google Scholar] [CrossRef] [PubMed]
  45. Wolfe, A.; Shimer, G.H.; Meehan, T. Polycyclic aromatic hydrocarbons physically intercalate into duplex regions of denatured DNA. Biochemistry 1987, 26, 6392–6396. [Google Scholar] [CrossRef]
  46. Lakowicz, J.R.; Weber, G. Quenching of fluorescence by oxygen. Probe for structural fluctuations in macromolecules. Biochemistry 1973, 12, 4161–4170. [Google Scholar] [CrossRef] [PubMed]
  47. Trott, O.; Olson, A.J. AutoDock Vina: Improving the speed and accuracy of docking with a new scoring function, efficient optimization, and multithreading. J. Comput. Chem. 2010, 31, 455–461. [Google Scholar] [CrossRef] [Green Version]
  48. Qais, F.A.; Alam, M.M.; Naseem, I.; Ahmad, I. Understanding the mechanism of non-enzymatic glycation inhibition by cinnamic acid: An in vitro interaction and molecular modelling study. RSC Adv. 2016, 6, 65322–65337. [Google Scholar] [CrossRef]
  49. Pandya, P.; Agarwal, L.K.; Gupta, N.; Pal, S. Molecular recognition pattern of cytotoxic alkaloid vinblastine with multiple targets. J. Mol. Graph. Model. 2014, 54, 1–9. [Google Scholar] [CrossRef]
  50. Ebead, Y.H.; Salman, H.M.A.; Shebany, Y.M.; Abdellah, M.A. Synthesis, Spectroscopic, and Biological Investigations of the Ternary Metal Complexes of Schiff Bases Derived From 2-hydroxy-1-naphthaldehyde and Some Amino Acids. Synth. React. Inorganic, Met. Nano-Metal Chem. 2016, 46, 1819–1828. [Google Scholar] [CrossRef]
  51. Murukan, B.; Mohanan, K. Synthesis, Characterization, Electrochemical Properties and Antibacterial Activity of Some Transiton Metal Complexes with [(2-hydroxy-1-naphthaldehyde)-3-isatin]-bishydrazone. Transit. Met. Chem. 2006, 31, 441–446. [Google Scholar] [CrossRef]
  52. Shi, S.; Yu, S.; Quan, L.; Mansoor, M.; Chen, Z.; Hu, H.; Liu, D.; Liang, Y.; Liang, F. Synthesis and antitumor activities of transition metal complexes of a bis-Schiff base of 2-hydroxy-1-naphthalenecarboxaldehyde. J. Inorg. Biochem. 2020, 210, 111173. [Google Scholar] [CrossRef]
  53. Niu, M.; Cao, Z.; Xue, R.; Wang, S.; Dou, J.; Wang, D. Structural diversity of Cu(II) compounds of Schiff bases derived from 2-hydroxy-1-naphthaldehyde and a series of aminobenzoic acid. J. Mol. Struct. 2011, 996, 101–109. [Google Scholar] [CrossRef]
  54. Efthimiadou, E.K.; Thomadaki, H.; Sanakis, Y.; Raptopoulou, C.P.; Katsaros, N.; Scorilas, A.; Karaliota, A.; Psomas, G. Structure and biological properties of the copper(II) complex with the quinolone antibacterial drug N-propyl-norfloxacin and 2,2′-bipyridine. J. Inorg. Biochem. 2007, 101, 64–73. [Google Scholar] [CrossRef] [PubMed]
  55. Serezhkin, V.N.; Vologzhanina, A.V.; Serezhkina, L.B.; Smirnova, E.S.; Grachova, E.V.; Ostrova, P.V.; Antipin, M.Y. Crystallochemical formula as a tool for describing metal–ligand complexes – a pyridine-2,6-dicarboxylate example. Acta Crystallogr. Sect. B Struct. Sci. 2009, 65, 45–53. [Google Scholar] [CrossRef]
  56. Alexandrov, E.V.; Shevchenko, A.P.; Asiri, A.A.; Blatov, V.A. New knowledge and tools for crystal design: Local coordination versus overall network topology and much more. CrystEngComm 2015, 17, 2913–2924. [Google Scholar] [CrossRef]
  57. Spackman, M.A.; Jayatilaka, D. Hirshfeld surface analysis. CrystEngComm 2009, 11, 19–32. [Google Scholar] [CrossRef]
  58. Spackman, M.A.; McKinnon, J.J. Fingerprinting intermolecular interactions in molecular crystals. CrystEngComm 2002, 4, 378–392. [Google Scholar] [CrossRef]
  59. McKinnon, J.J.; Spackman, M.A.; Mitchell, A.S. Novel tools for visualizing and exploring intermolecular interactions in molecular crystals. Acta Crystallogr. Sect. B Struct. Sci. 2004, 60, 627–668. [Google Scholar] [CrossRef]
  60. McKinnon, J.J.; Jayatilaka, D.; Spackman, M.A. Towards quantitative analysis of intermolecular interactions with Hirshfeld surfaces. Chem. Commun. 2007, 3814–3816. [Google Scholar] [CrossRef]
  61. Patel, M.N.; Parmar, P.A.; Gandhi, D.S. Square pyramidal copper(II) complexes with forth generation fluoroquinolone and neutral bidentate ligand: Structure, antibacterial, SOD mimic and DNA-interaction studies. Bioorg. Med. Chem. 2010, 18, 1227–1235. [Google Scholar] [CrossRef]
  62. Wu, J.-Z.; Yuan, L. Synthesis and DNA interaction studies of a binuclear ruthenium(II) complex with 2,9-bis(2-imidazo[4,5- f ][1,10]phenanthroline)-1,10-phenanthroline as bridging and intercalating ligand. J. Inorg. Biochem. 2004, 98, 41–45. [Google Scholar] [CrossRef]
  63. Darabi, F.; Hadadzadeh, H.; Ebrahimi, M.; Khayamian, T.; Rudbari, H.A. The piroxicam complex of cobalt(II): Synthesis in two different ionic liquids, structure, DNA- and BSA interaction and molecular modeling. Inorganica Chim. Acta 2014, 409, 379–389. [Google Scholar] [CrossRef]
  64. Jyothi, P.; Koppu, S.; Sumalatha, V.; Ushaiah, B.; Gyana Kumari, C. Synthesis, characterisation, cytotoxicity, DNA binding and antimicrobial studies of binary and ternary metal complexes of Co(II). Inorg. Chem. Commun. 2019, 110, 107590. [Google Scholar] [CrossRef]
  65. Lincoln, P.; Broo, A.; Nordén, B. Diastereomeric DNA-Binding Geometries of Intercalated Ruthenium(II) Trischelates Probed by Linear Dichroism: [Ru(phen)2DPPZ]2+ and [Ru(phen)2BDPPZ]2+. J. Am. Chem. Soc. 1996, 118, 2644–2653. [Google Scholar] [CrossRef]
  66. Hirohama, T.; Kuranuki, Y.; Ebina, E.; Sugizaki, T.; Arii, H.; Chikira, M.; Tamil Selvi, P.; Palaniandavar, M. Copper(II) complexes of 1,10-phenanthroline-derived ligands: Studies on DNA binding properties and nuclease activity. J. Inorg. Biochem. 2005, 99, 1205–1219. [Google Scholar] [CrossRef]
  67. Qiu, L.; Lv, G.; Guo, L.; Chen, L.; Luo, S.; Zou, M.; Lin, J. Synthesis, crystal structure and antitumor effect of a novel copper(II) complex bearing zoledronic acid derivative. Eur. J. Med. Chem. 2015, 89, 42–50. [Google Scholar] [CrossRef] [PubMed]
  68. Meyer-Almes, F.J.; Porschke, D. Mechanism of intercalation into the DNA double helix by ethidium. Biochemistry 1993, 32, 4246–4253. [Google Scholar] [CrossRef]
  69. Chakraborty, A.; Panda, A.K.; Ghosh, R.; Biswas, A. DNA minor groove binding of a well known anti-mycobacterial drug dapsone: A spectroscopic, viscometric and molecular docking study. Arch. Biochem. Biophys. 2019, 665, 107–113. [Google Scholar] [CrossRef]
  70. Yılmaz, Z.T.; Odabaşoğlu, H.Y.; Şenel, P.; Adımcılar, V.; Erdoğan, T.; Özdemir, A.D.; Gölcü, A.; Odabaşoğlu, M. A novel 3-((5-methylpyridin-2-yl)amino)isobenzofuran-1(3H)-one: Molecular structure describe, X-ray diffractions and DFT calculations, antioxidant activity, DNA binding and molecular docking studies. J. Mol. Struct. 2020, 1205, 127585. [Google Scholar] [CrossRef]
  71. Mirzaei-Kalar, Z.; Yavari, A.; Jouyban, A. Increasing DNA binding affinity of doxorubicin by loading on Fe3O4 nanoparticles: A multi-spectroscopic study. Spectrochim. Acta Part A Mol. Biomol. Spectrosc. 2020, 229, 117985. [Google Scholar] [CrossRef]
  72. Joksimović, N.; Petronijević, J.; Janković, N.; Baskić, D.; Popović, S.; Todorović, D.; Matić, S.; Bogdanović, G.A.; Vraneš, M.; Tot, A.; et al. Synthesis, characterization, anticancer evaluation and mechanisms of cytotoxic activity of novel 3-hydroxy-3-pyrrolin-2-ones bearing thenoyl fragment: DNA, BSA interactions and molecular docking study. Bioorg. Chem. 2019, 88, 102954. [Google Scholar] [CrossRef] [PubMed]
  73. Bhanja, P.; Mishra, S.; Manna, K.; Mallick, A.; Das Saha, K.; Bhaumik, A. Covalent Organic Framework Material Bearing Phloroglucinol Building Units as a Potent Anticancer Agent. ACS Appl. Mater. Interfaces 2017, 9, 31411–31423. [Google Scholar] [CrossRef] [PubMed] [Green Version]
  74. Nandi, R.; Mishra, S.; Maji, T.K.; Manna, K.; Kar, P.; Banerjee, S.; Dutta, S.; Sharma, S.K.; Lemmens, P.; Das Saha, K.; et al. A novel nanohybrid for cancer theranostics: Folate sensitized Fe2O3 nanoparticles for colorectal cancer diagnosis and photodynamic therapy. J. Mater. Chem. B 2017, 5, 3927–3939. [Google Scholar] [CrossRef] [PubMed]
Scheme 1. Synthesis of complex 1.
Crystals 12 00015 sch001
Figure 1. Molecular representation of the asymmetric units of complex 1.
Crystals 12 00015 g001
Figure 2. (a) Crystal packing and insight view of (b) C-H...O interaction, (c) O-H...O interaction, and (d) C-H… π and C-H#x2026;O interactions.
Crystals 12 00015 g002
Figure 3. Absorption pattern of complex 1 (60 µM) upon the addition of ctDNA (0–84.31 × 10⁻⁶ M); Inset: Plots of [DNA]/(εa–εf) vs. [DNA] for the titration of ctDNA with complex.
Crystals 12 00015 g003
Figure 4. Quenching of EB (20 µM) bound to ctDNA (100 µM) upon addition of complex 1 (0–4.1 × 10⁻⁵ M) at 25 °C. Inset: Plots of (F0/F)−1 vs. [Q].
Crystals 12 00015 g004
Figure 5. Melting curves of ctDNA (●) and ctDNA + complex 1 (). [ctDNA] = 70 µM, [complex] = 10 µM.
Crystals 12 00015 g005
Figure 6. Relative viscosity (η/η0)1/3 of ctDNA solution (30 μM) in the presence of complex 1 at varying amounts (r) at 25 °C; r = [Complex 1]/[DNA]; 0.0, 0.05, 0.1, 0.15, 0.2, 0.25).
Crystals 12 00015 g006
Figure 7. Rate of cell death of HCT 116 and HEK-293 cells treated with complex 1 (0–20 μM) for 24 h.
Crystals 12 00015 g007
Figure 8. Annexin-V/PI staining data after 24 h of 11.6 µg/mL complex 1 treatment to analyse the percentage of cell death (apoptosis/necrosis) in HCT 116 cells. Where Q3, Q4, Q2, and Q1 indicate viable cells, early apoptosis, late apoptosis, and necrosis, respectively.
Crystals 12 00015 g008
Figure 9. Measurement of mitochondrial ROS in HCT116 after 24 h of 11.6 µM complex 1 treatment by confocal microscopy. Upper part showing i) bright field of control HCT116; ii) mitotracker red-stained image of control HCT116; iii) DCF-DA expression of control HCT116; iv) merged images of mitotracker red and DCF-DA in control HCT116. Lower part showing i) bright field; ii) mitotracker red; iii) DCF-DA expression; iv) merged images after 11.6 µM complex 1 treatment.
Crystals 12 00015 g009
Figure 10. DNA fragmentation assay of complex 1 (0–20 µM)-treated HCT 116 cancer cells. Value of each experiments taken three times (n = 3) (* p = 0.05, ** p = 0.01, *** p = 0.001) compared with control.
Crystals 12 00015 g010
Figure 11. Docked pose for complex 1 with DNA (1BNA).
Crystals 12 00015 g011
Table 1. Experimental details of single X-ray analysis of complex 1.
CCDC Number1986064
Empirical formulaC22H16CuO5
Formula weight423.91
Temperature/K100 (2)
Crystal systemmonoclinic
Space groupP21/c
a/Å16.1069 (14)
b/Å5.4478 (5)
c/Å19.531 (2)
α/°90
β/°95.936 (3)
γ/°90
Volume/Å31704.6 (3)
Z4
ρcalcg/cm31.6517
μ/mm−11.315
F (000)869.8
Crystal size/mm30.4 × 0.31 × 0.18
RadiationMo Kα (λ = 0.71073)
2Θ range for data collection/°5.08 to 50.1
Index ranges−21 ≤ h ≤ 21, −7 ≤ k ≤ 7, −26 ≤ l ≤ 26
Reflections collected17315
Independent reflections3017 [Rint = 0.0820, Rsigma = 0.0744]
Data/restraints/parameters3017/0/255
Goodness of fit on F21.106
Final R indexes [I > = 2σ (I)]R1 = 0.0731, wR2 = 0.2061
Final R indexes [all data]R1 = 0.0896, wR2 = 0.2262
Largest diff. peak/hole / e Å−32.46/−0.90
Publisher’s Note: MDPI stays neutral with regard to jurisdictional claims in published maps and institutional affiliations.

