
Fe3O4-Carbon-Based Composite Derived from the Charge-Transfer Reaction Using Waste Tea Leaves as the Carbon Precursor for Enhanced Removing of Azocarmine G2, Methyl Violet 2B, Eosin B, and Toluidine Blue from Aqueous Solution


Abstract
:1. Introduction
2. Experimentation
2.1. General
2.2. Composite Material
- (i)
- In a dry clean porcelain mortar, a porcelain pestle was used to mix 0.2 g of Fe3O4 oxide with 2.0 g of biomass-derived ACs.
- (ii)
- A few drops of methanol solvent were added to the mixture, and the mixing was continued for ~15 min until the mixture was completely uniform.
- (iii)
- The resulting product was collected from the mortar, dried in a vacuum desiccator containing CaCl2 (anhydrous), and then structurally characterized.
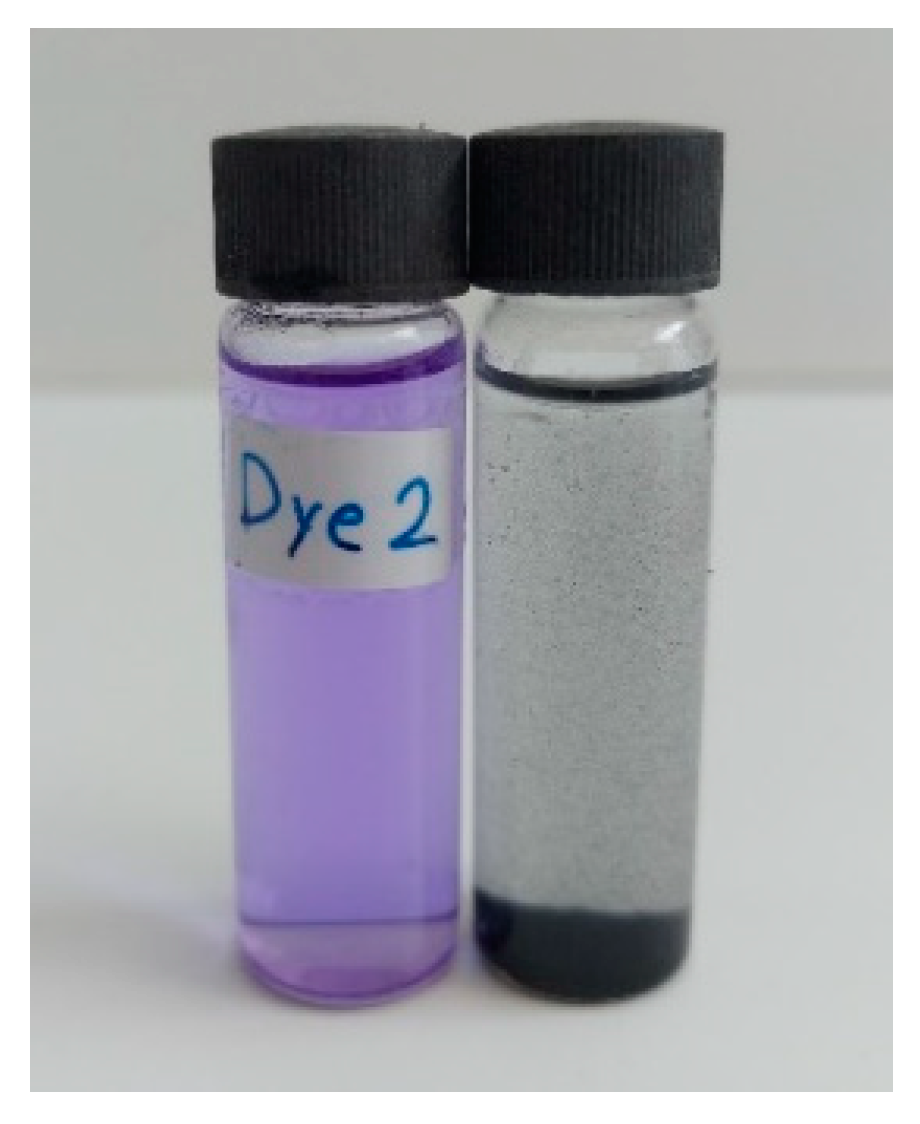
2.3. Batch Adsorption Technique
2.4. Instrumental
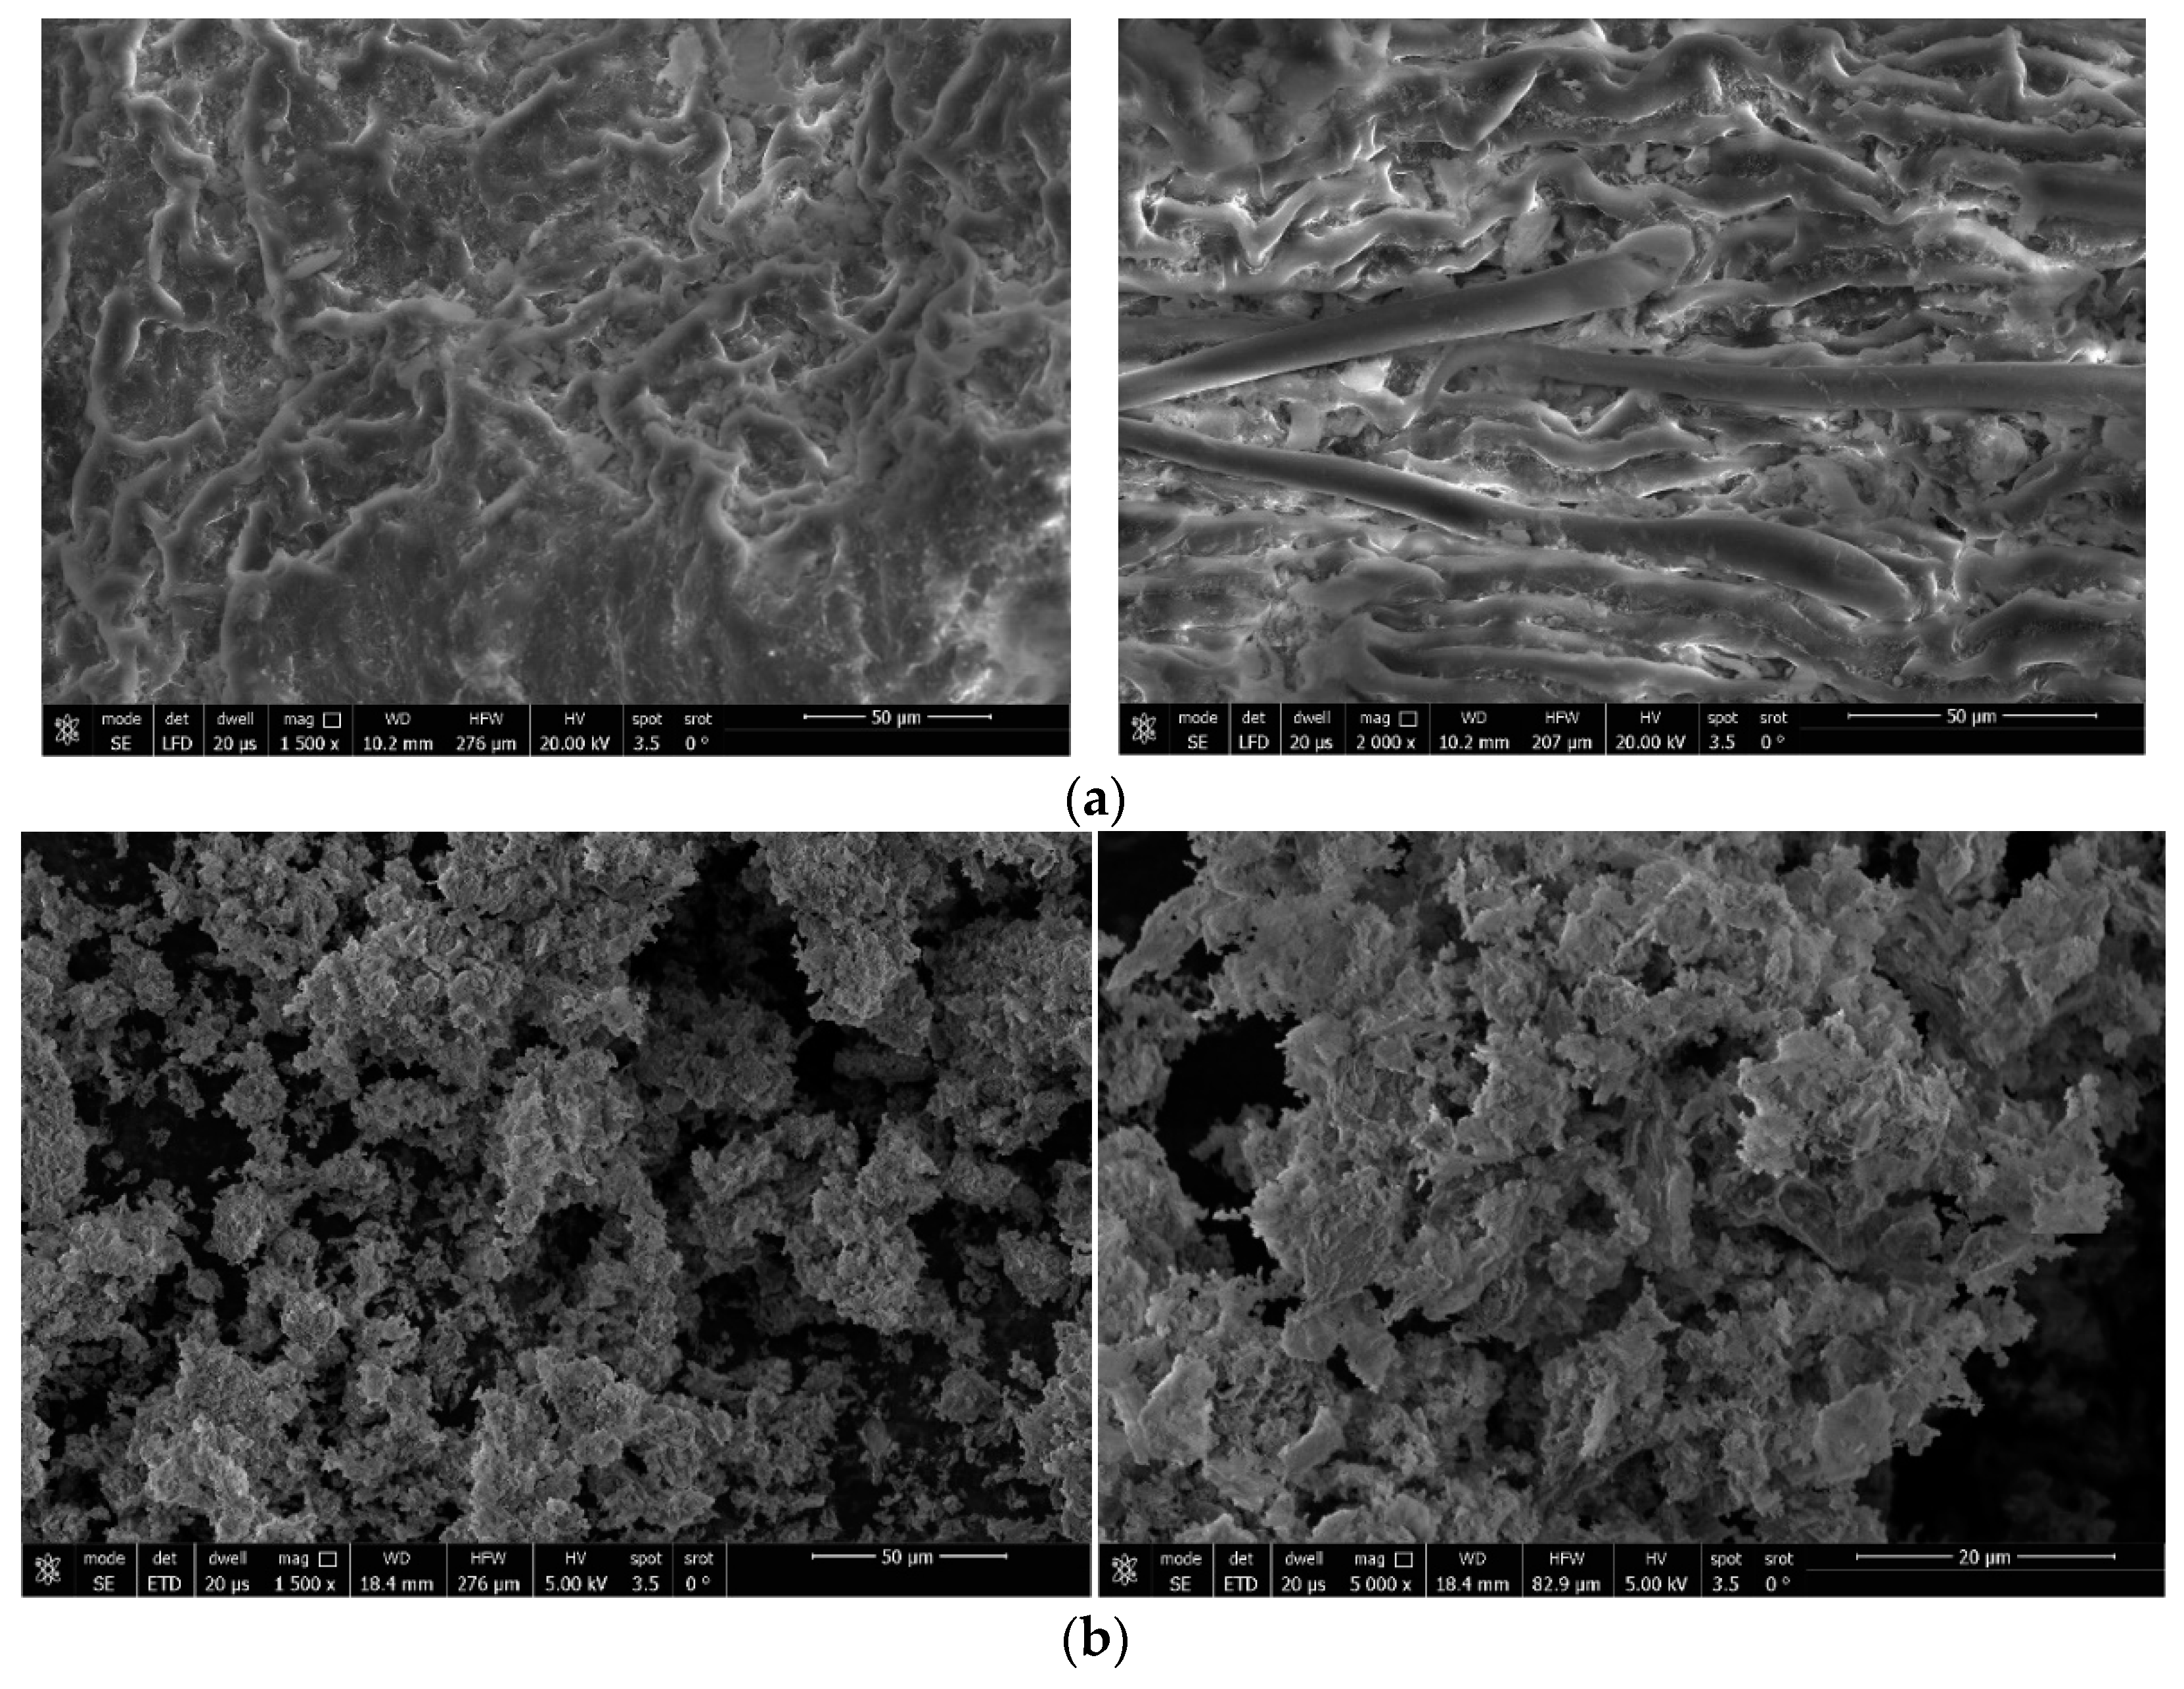
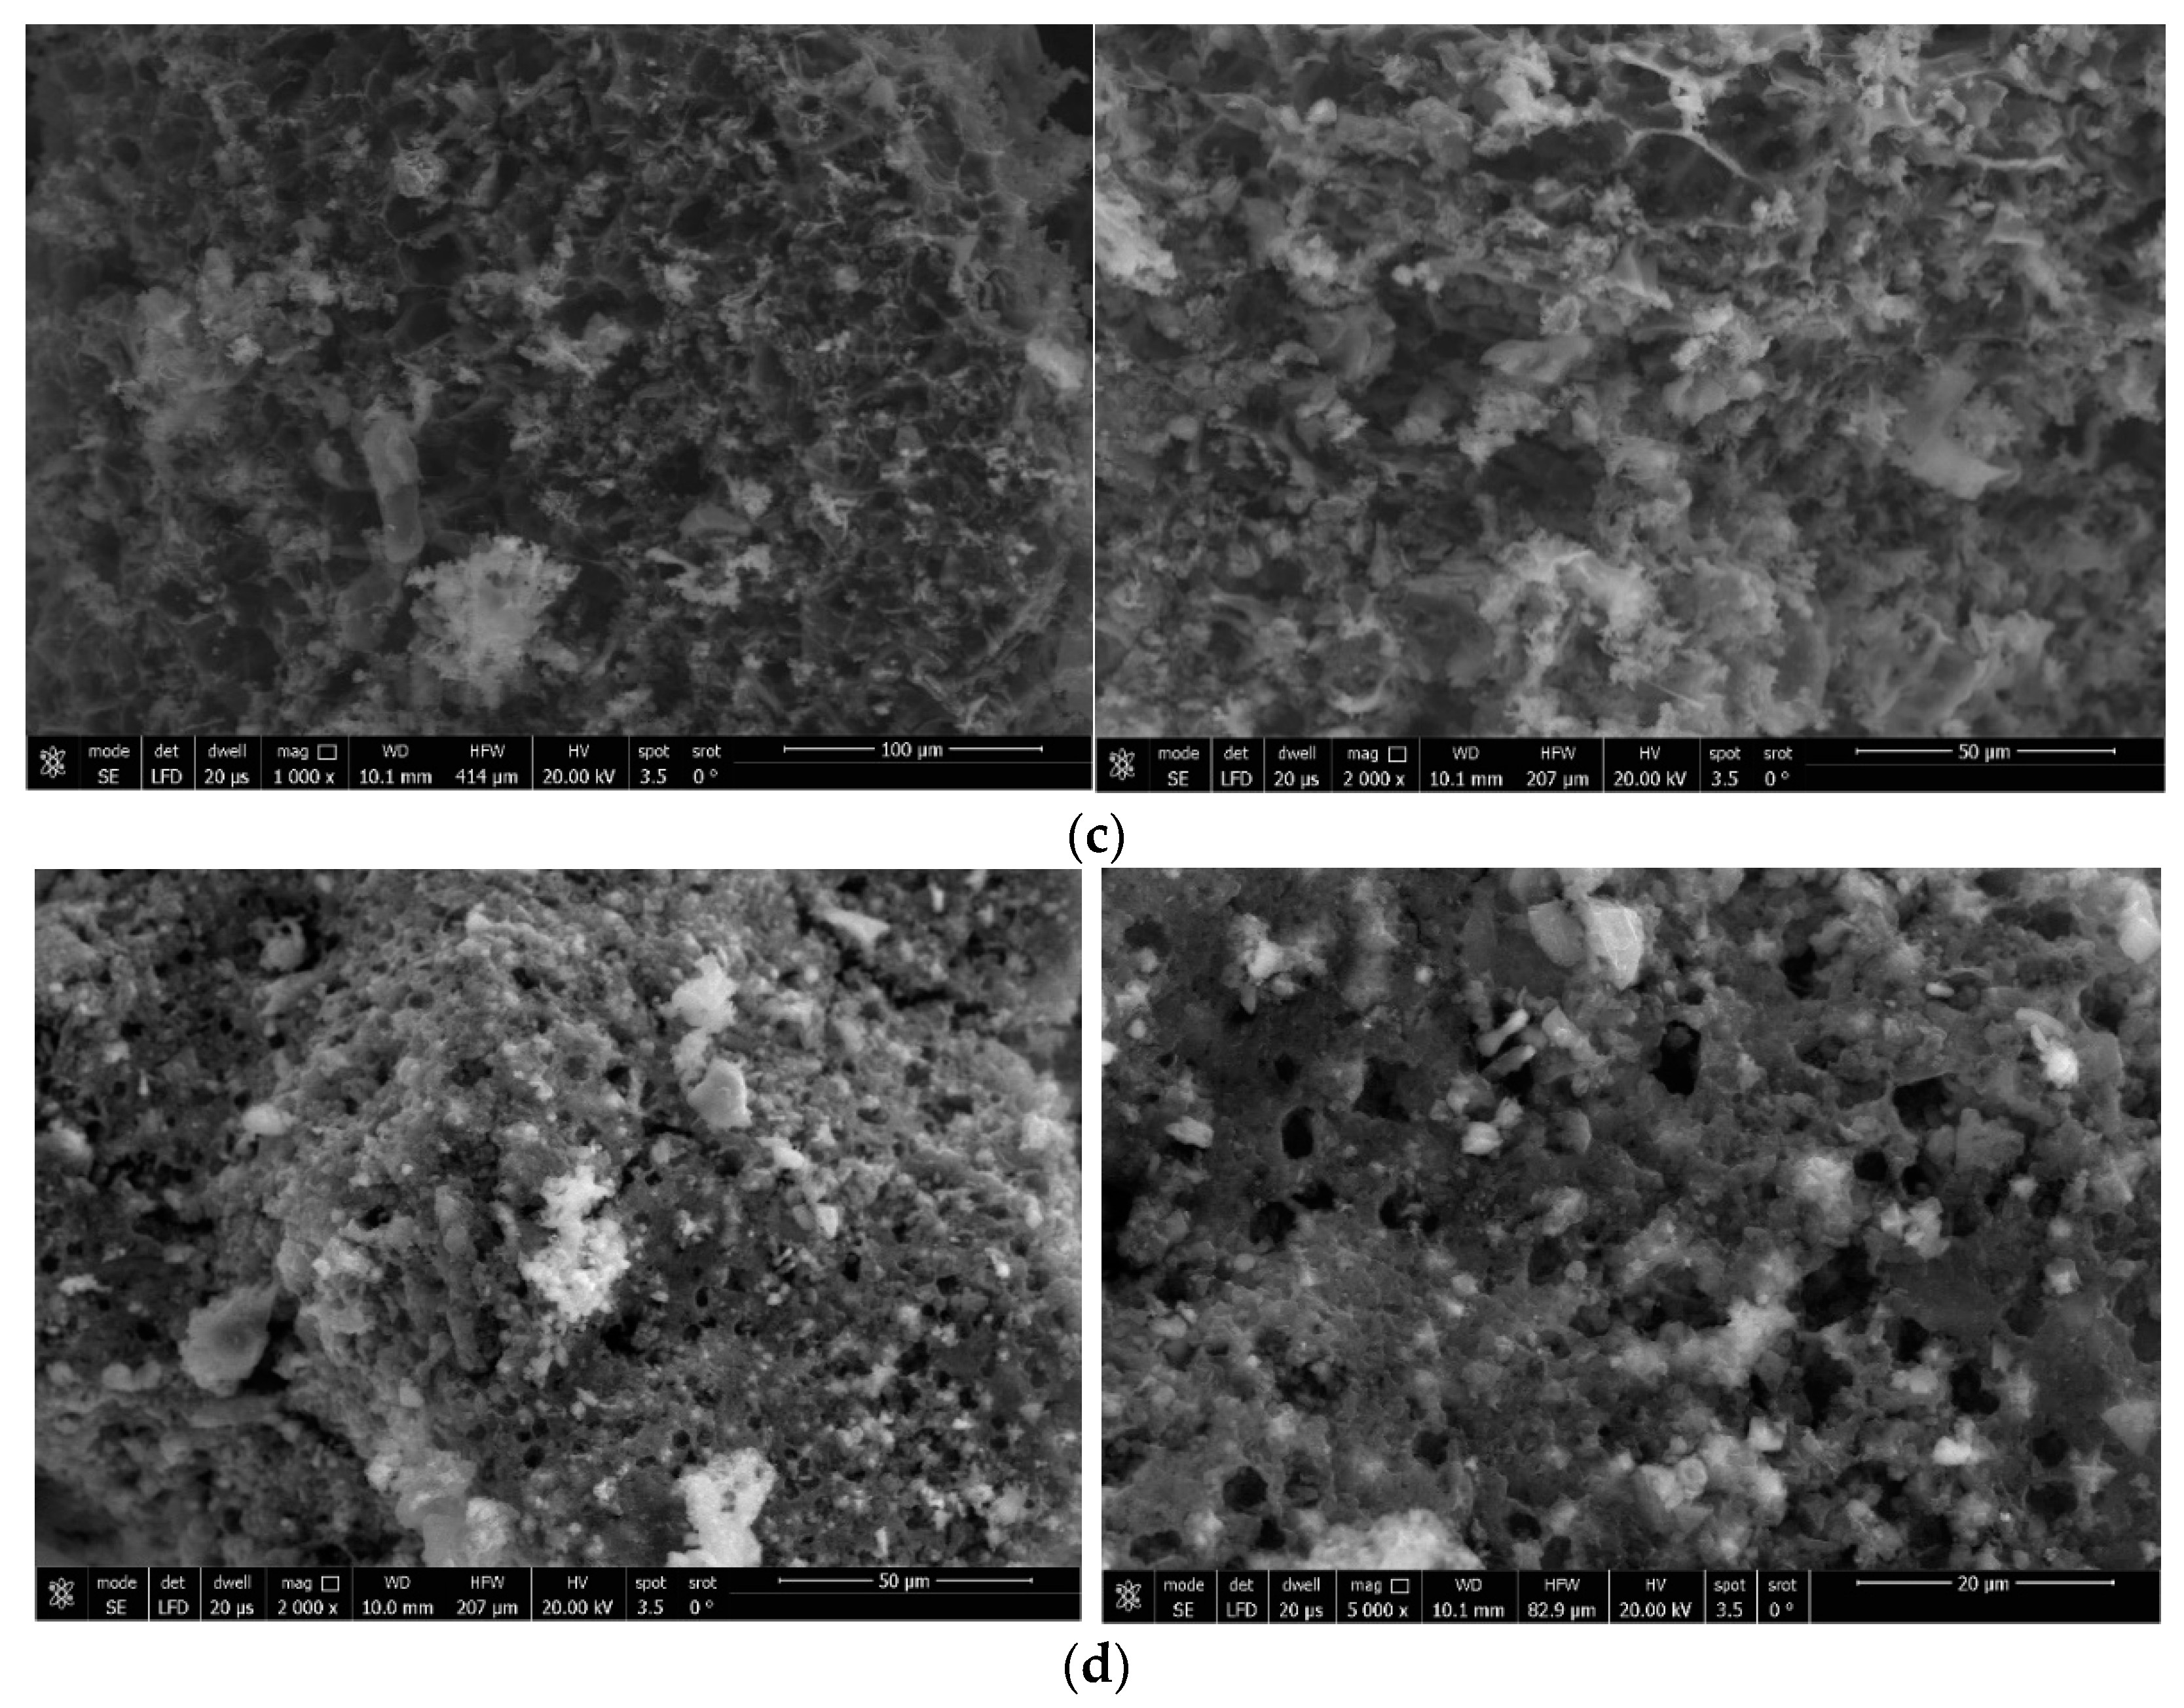
2.4.1. SEM Analysis
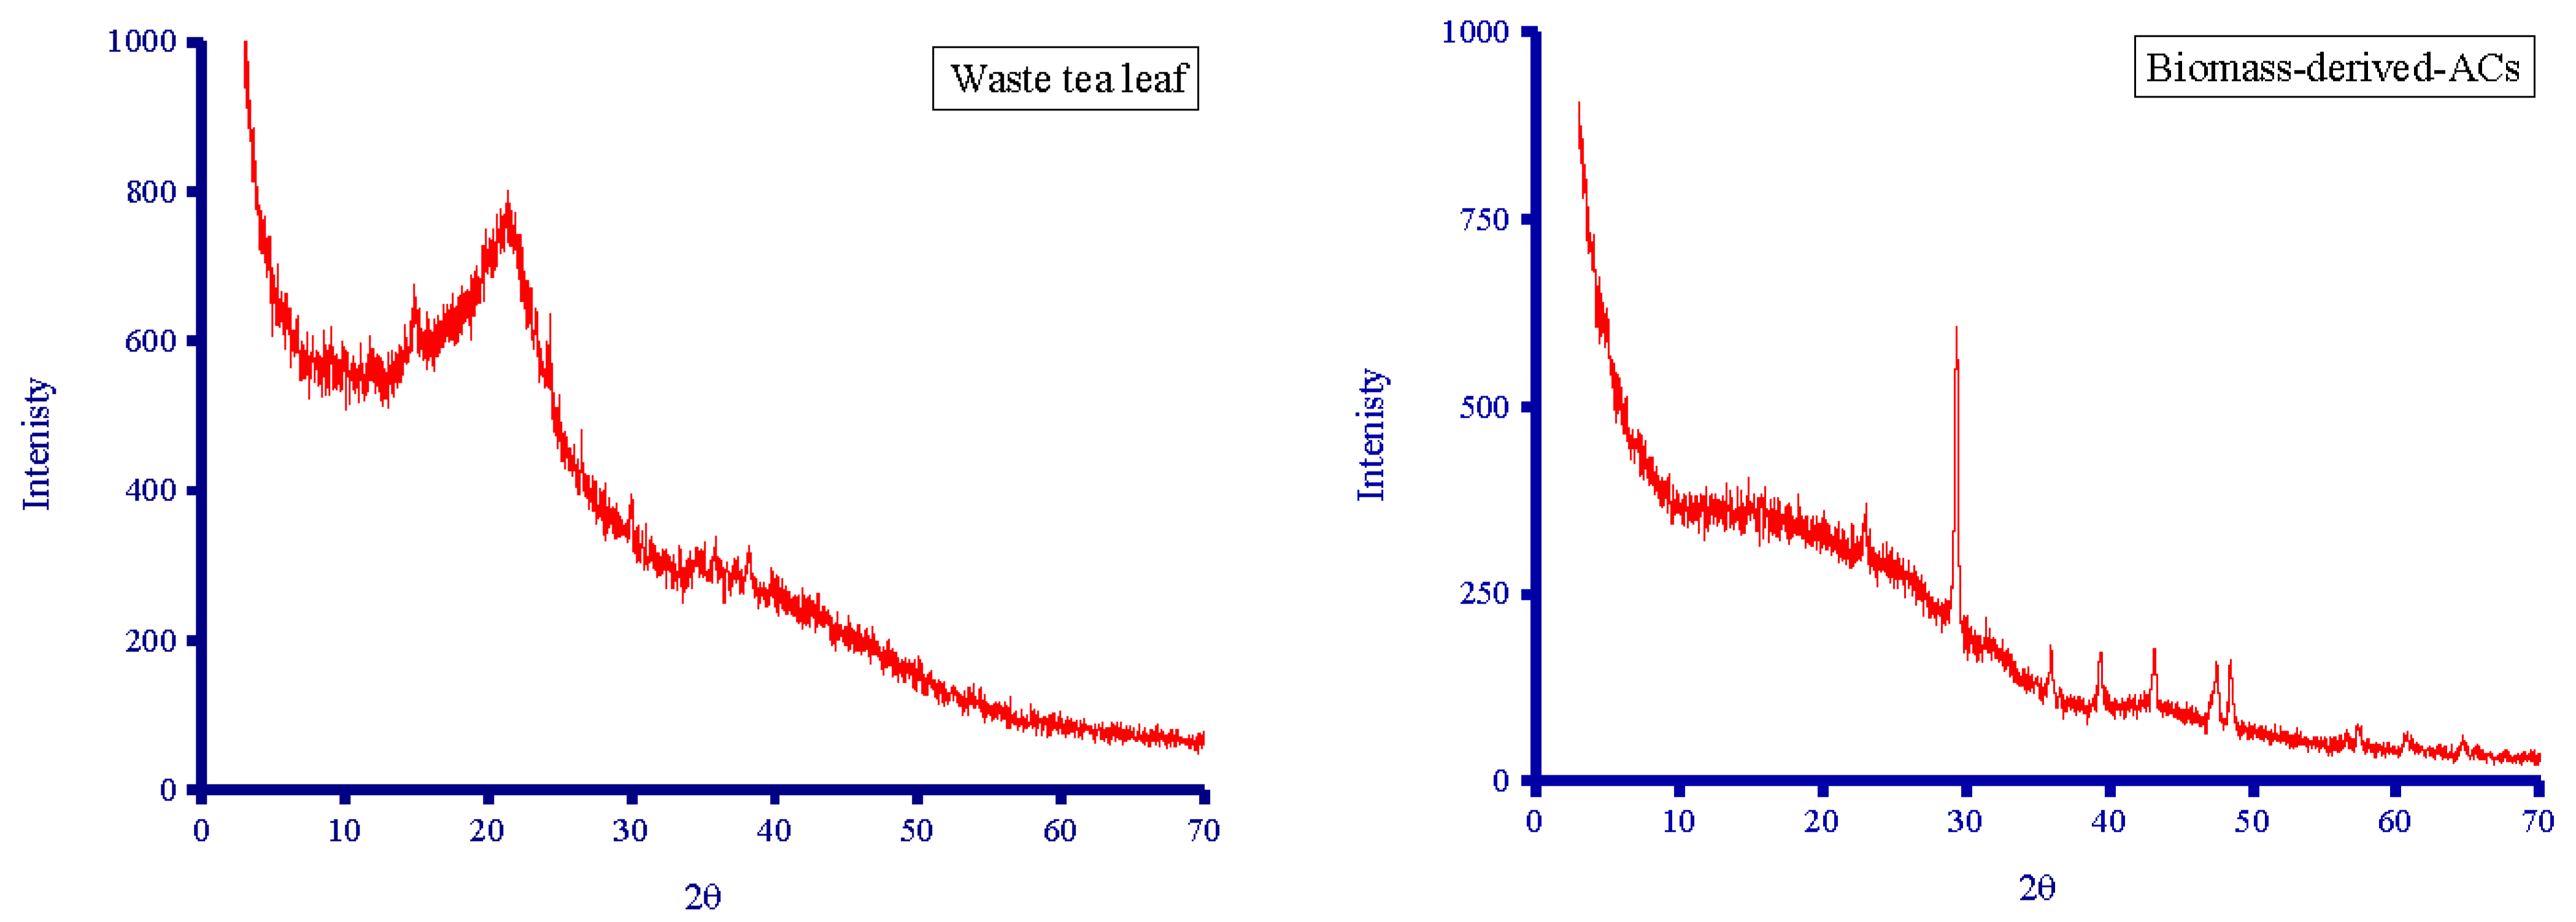
2.4.2. XRD Analysis
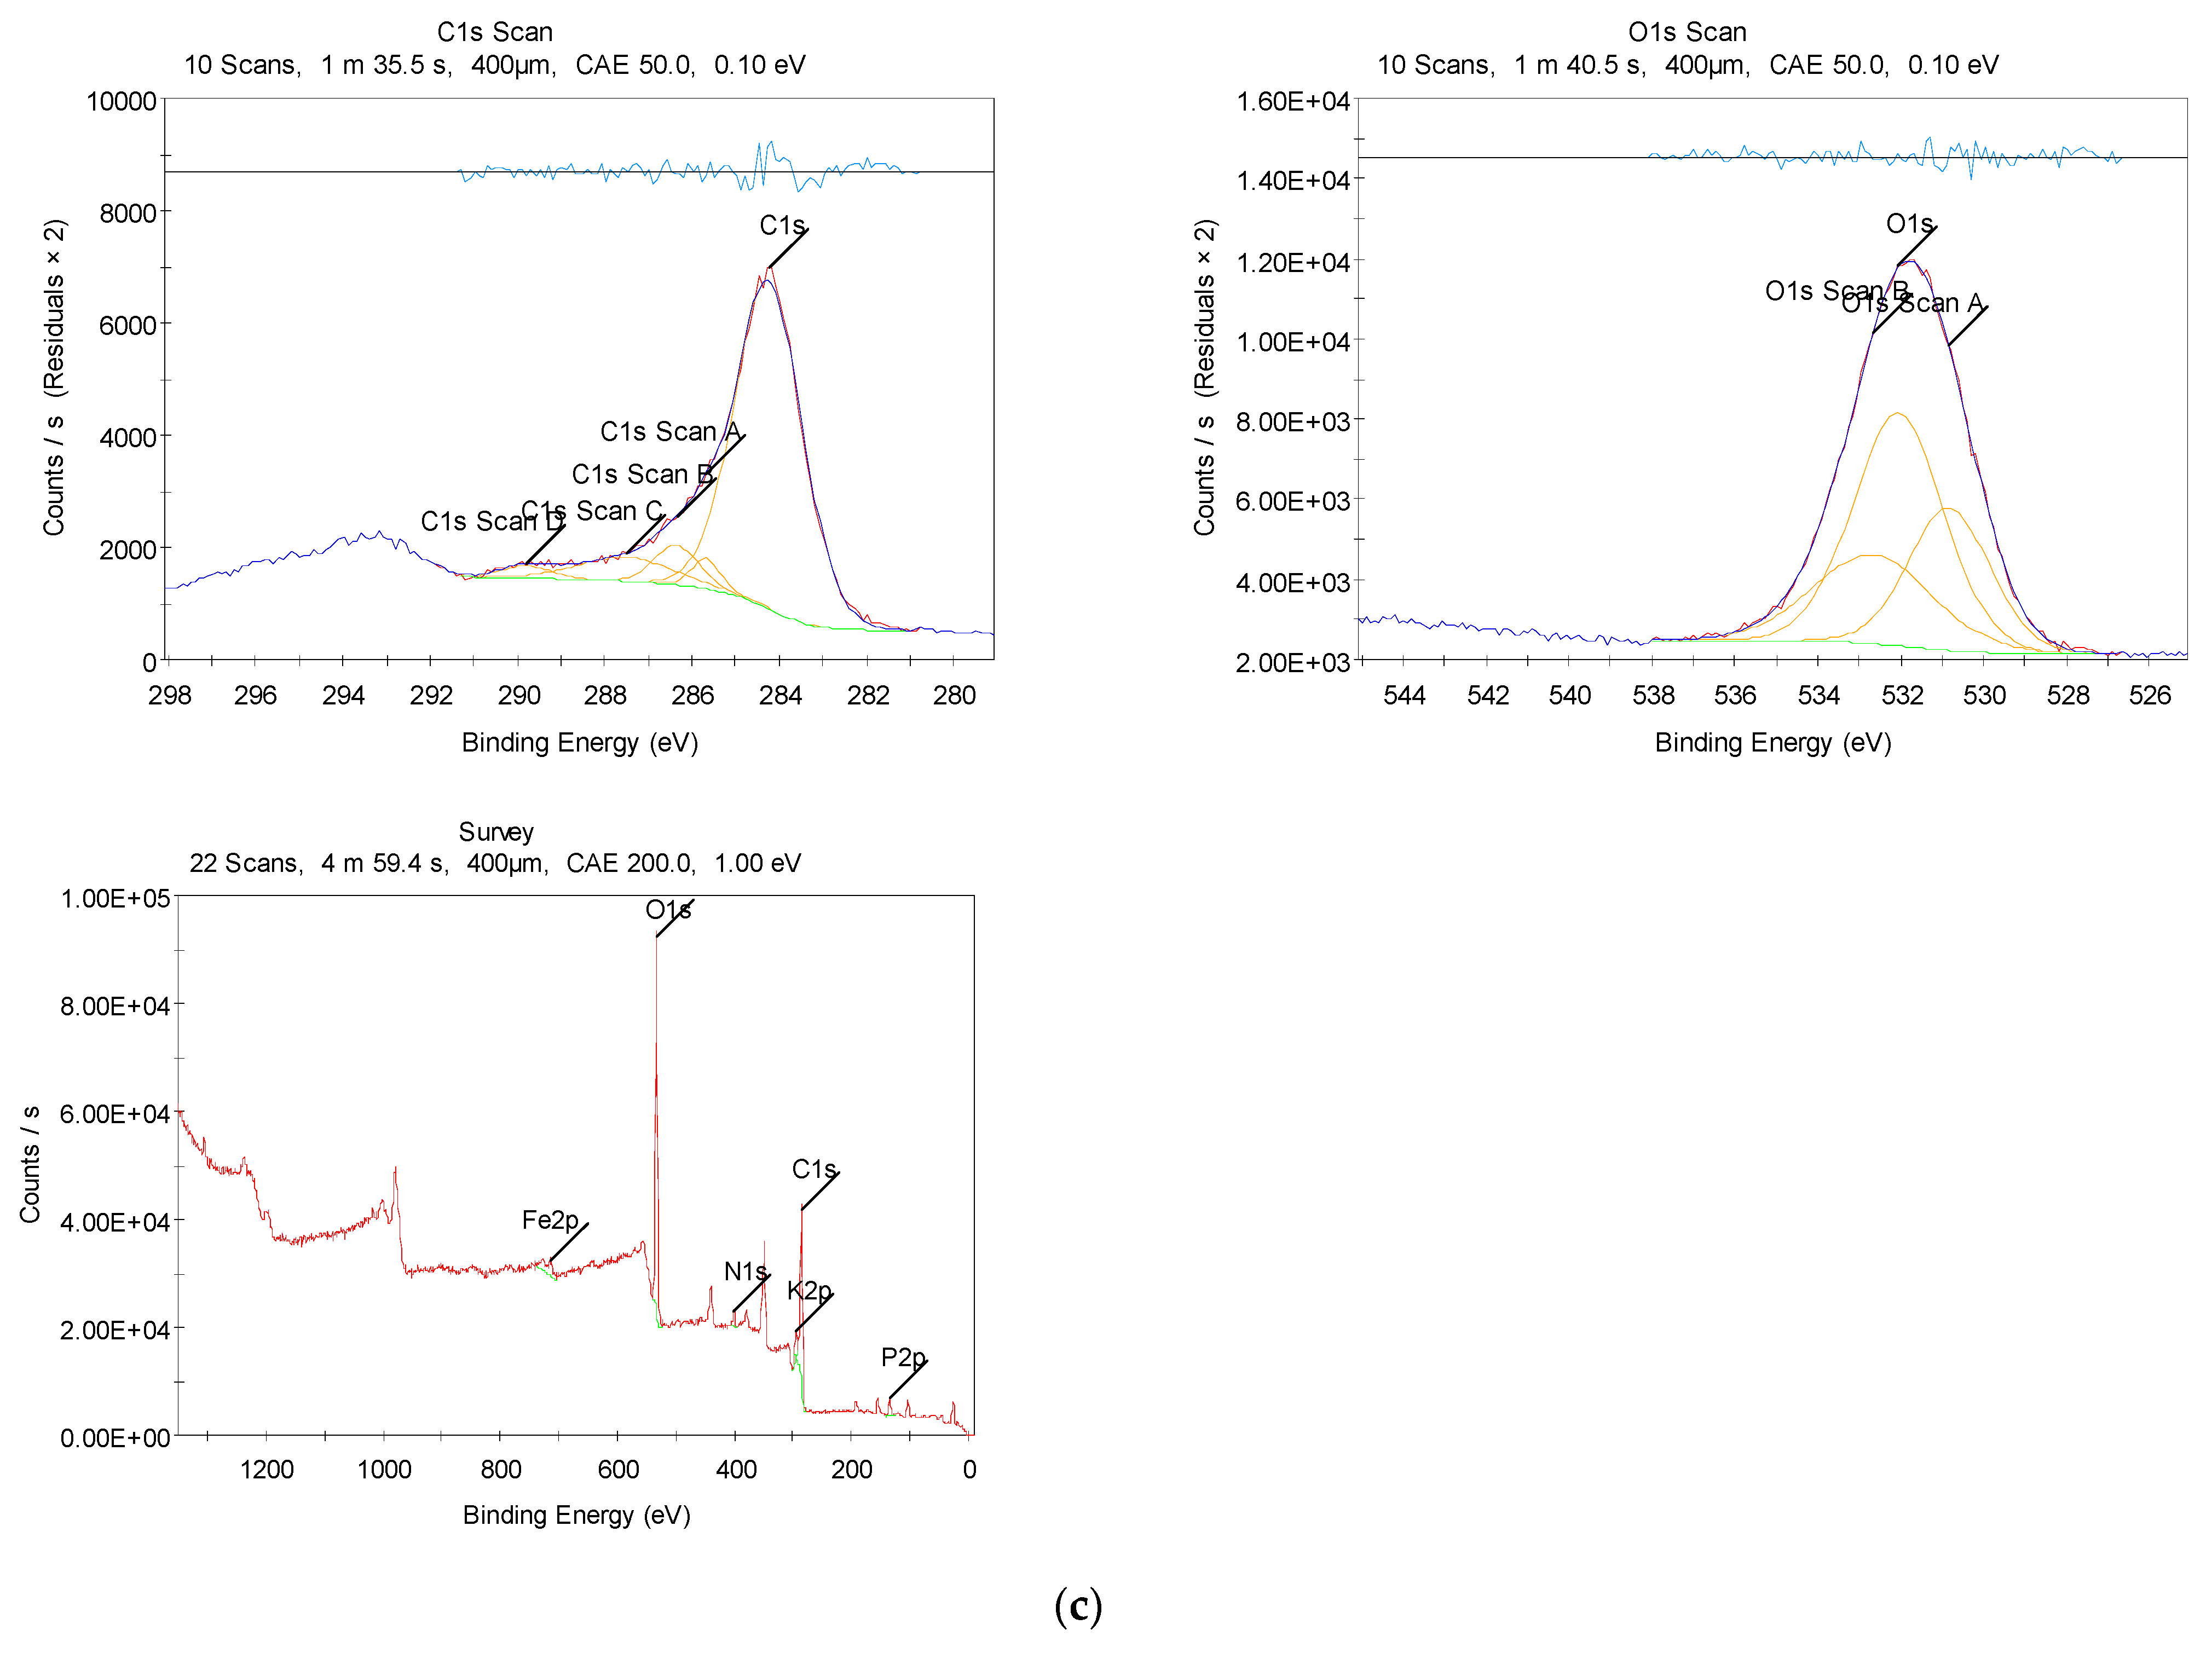
2.4.3. XPS Analysis
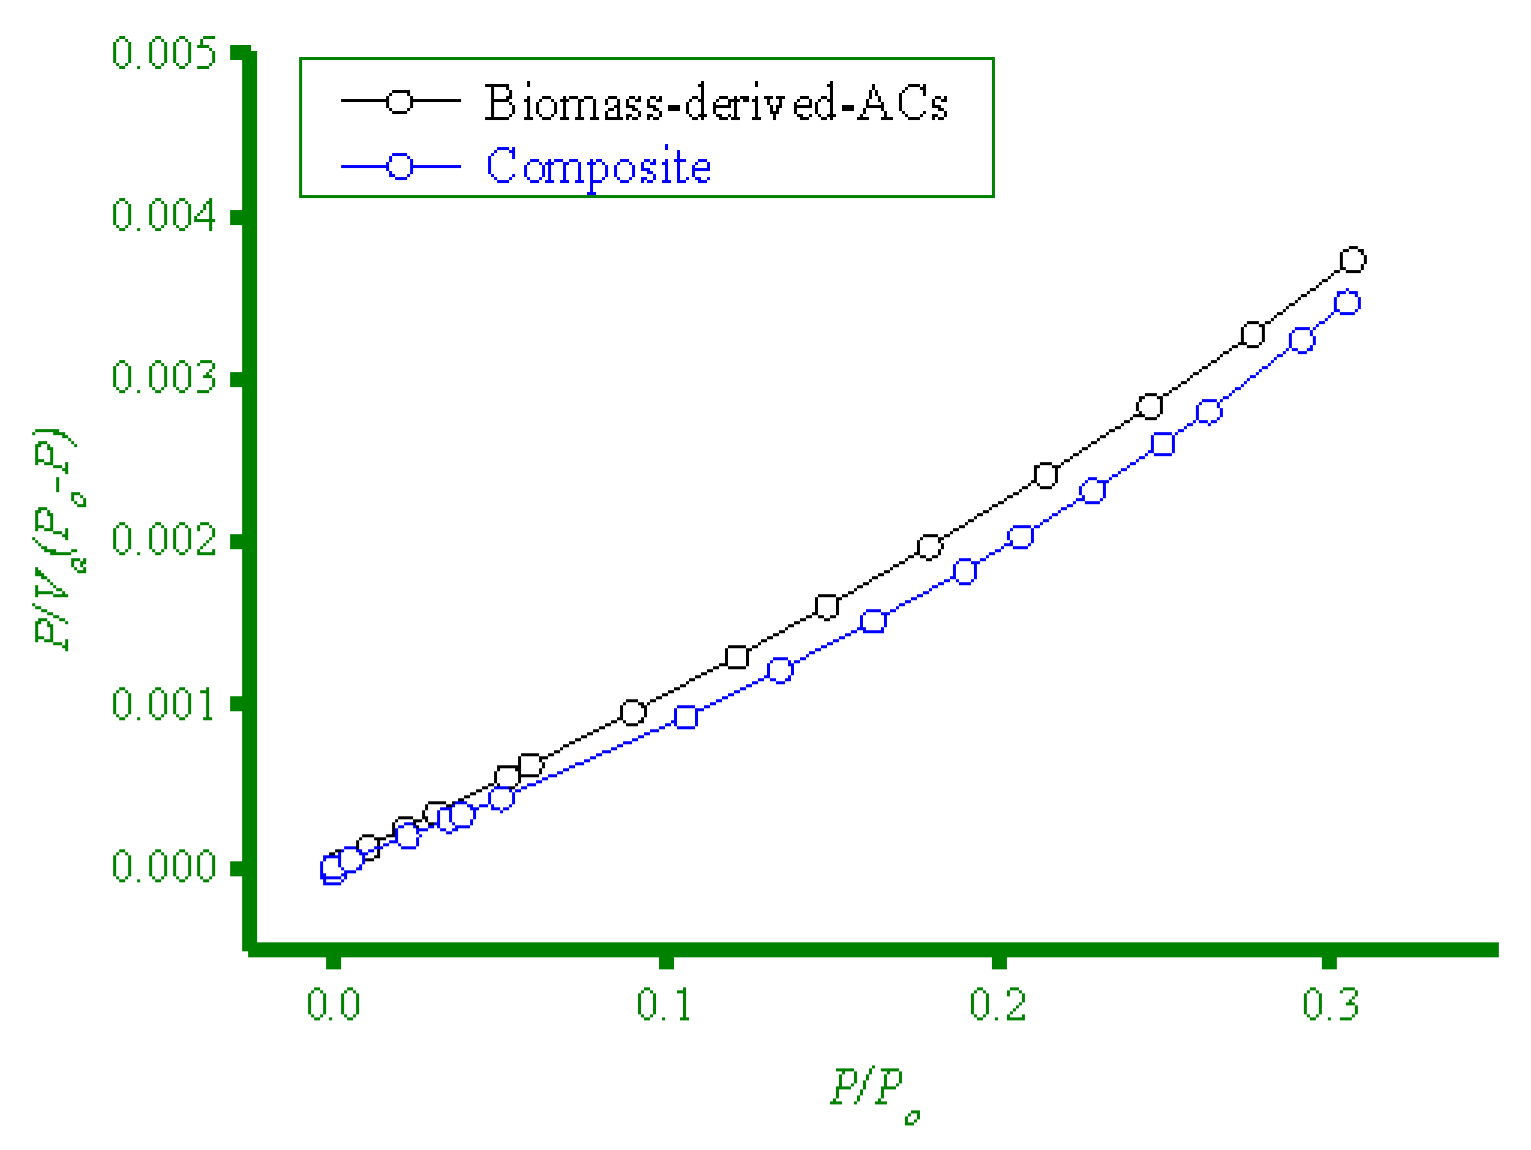
2.4.4. BET Analysis
2.4.5. Spectrophotometers
3. Results and Discussion
3.1. Carbon Precursor and Composite Material
3.2. Structural Characterizations
3.2.1. SEM Images
3.2.2. XRD Diffractometry
3.2.3. XPS Measurements
3.2.4. BET Surface Area Analysis
3.2.5. Raman Measurements
3.3. Batch Mode Adsorption
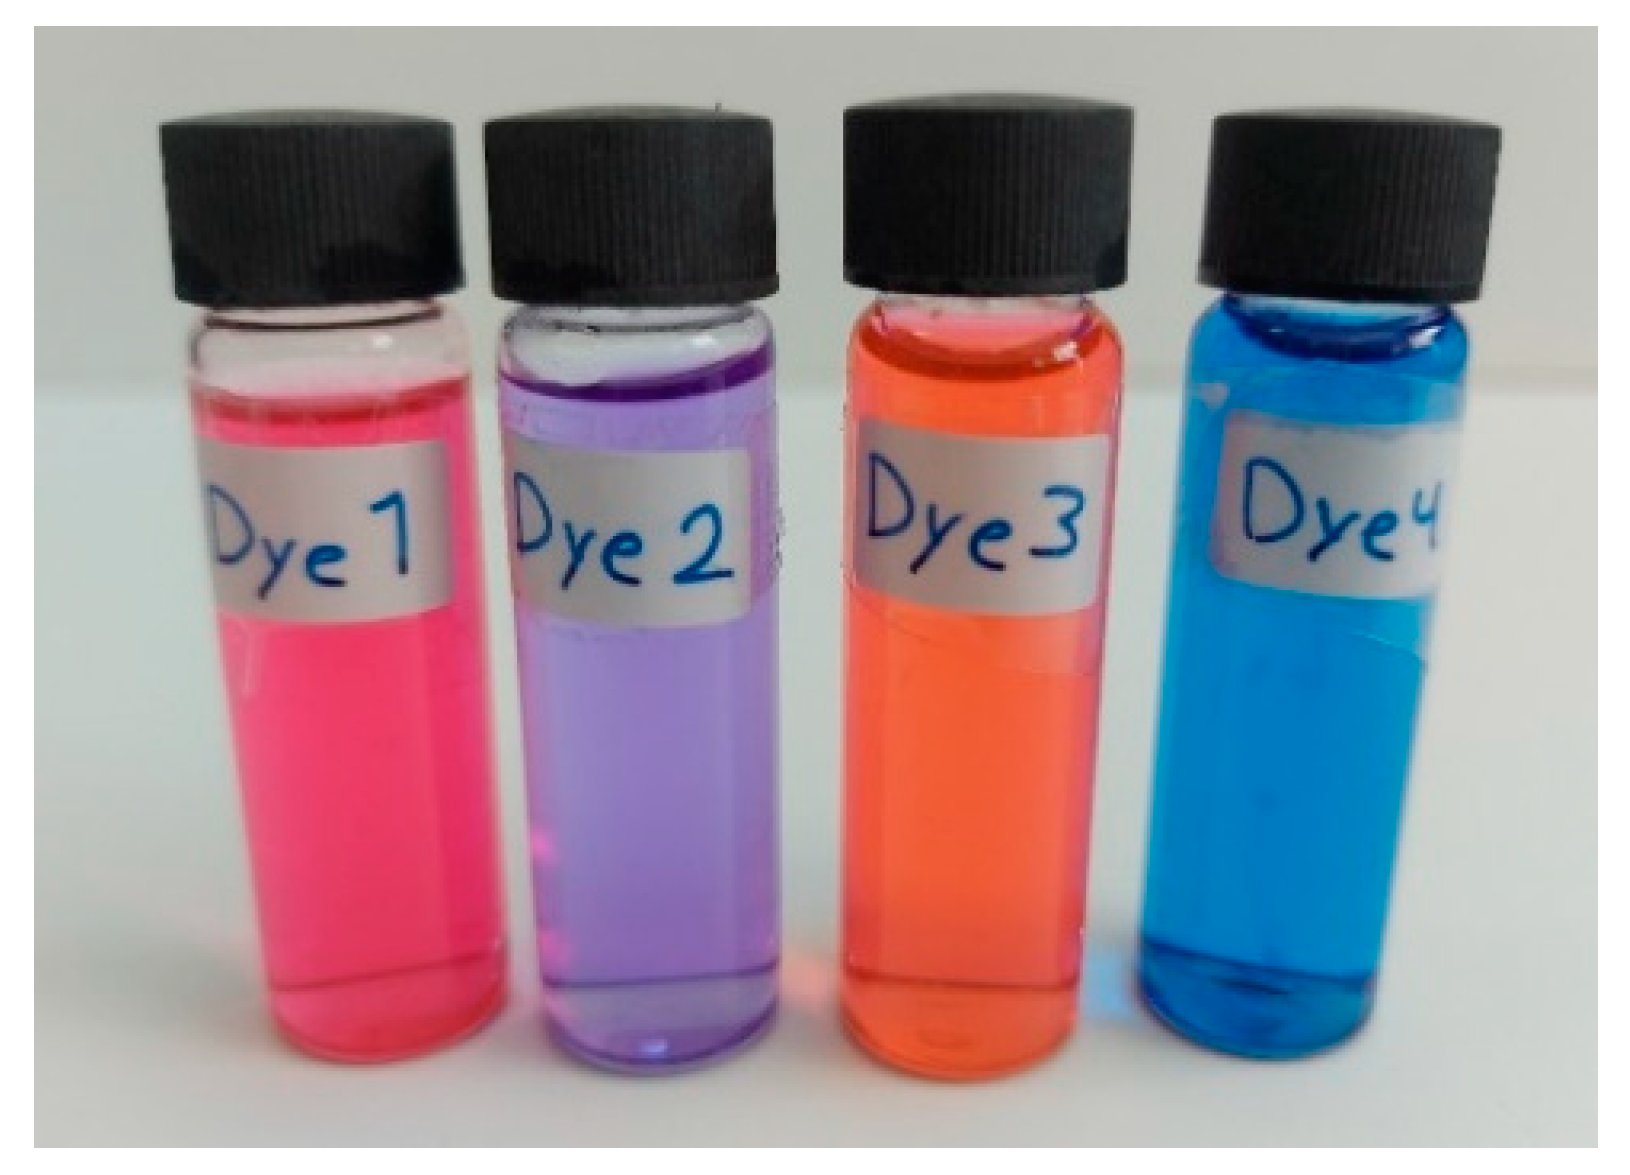
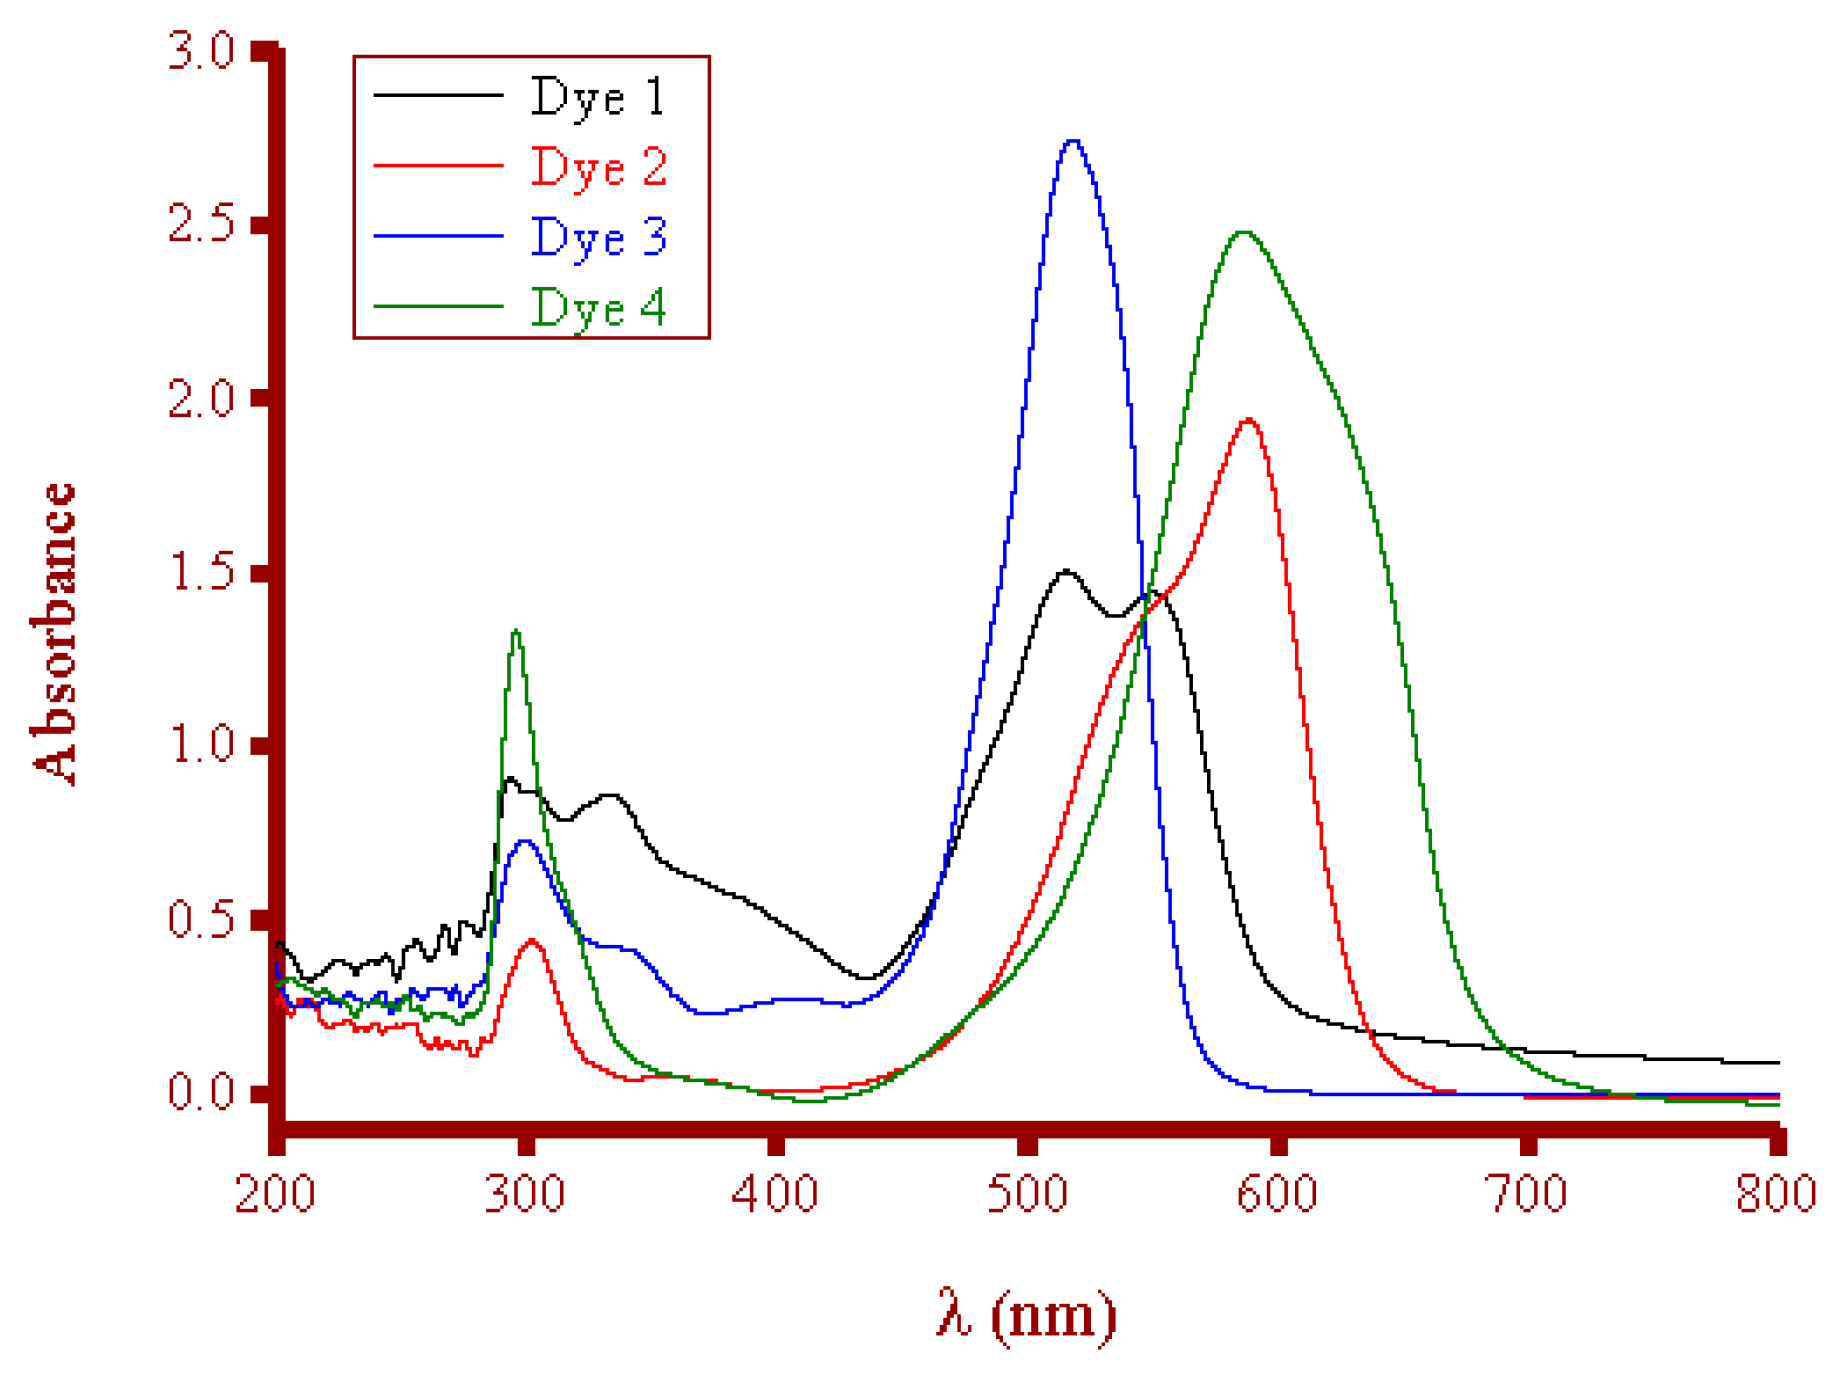
3.3.1. Dye Solutions
- (i)
- Temperature: Room temperature
- (ii)
- Time: 10–60 min
- (iii)
- Solution pH: 2–12
- (iv)
- Dye concentration: 100 mg/L
- (v)
- Composite dose: 0.05–0.20 g
- (vi)
- Detected band: 550 nm for Dye 1, 588 nm for Dye 2, 518 nm for Dye 3, and 586 nm for Dye 4
3.3.2. Factors Affecting Dye Removal
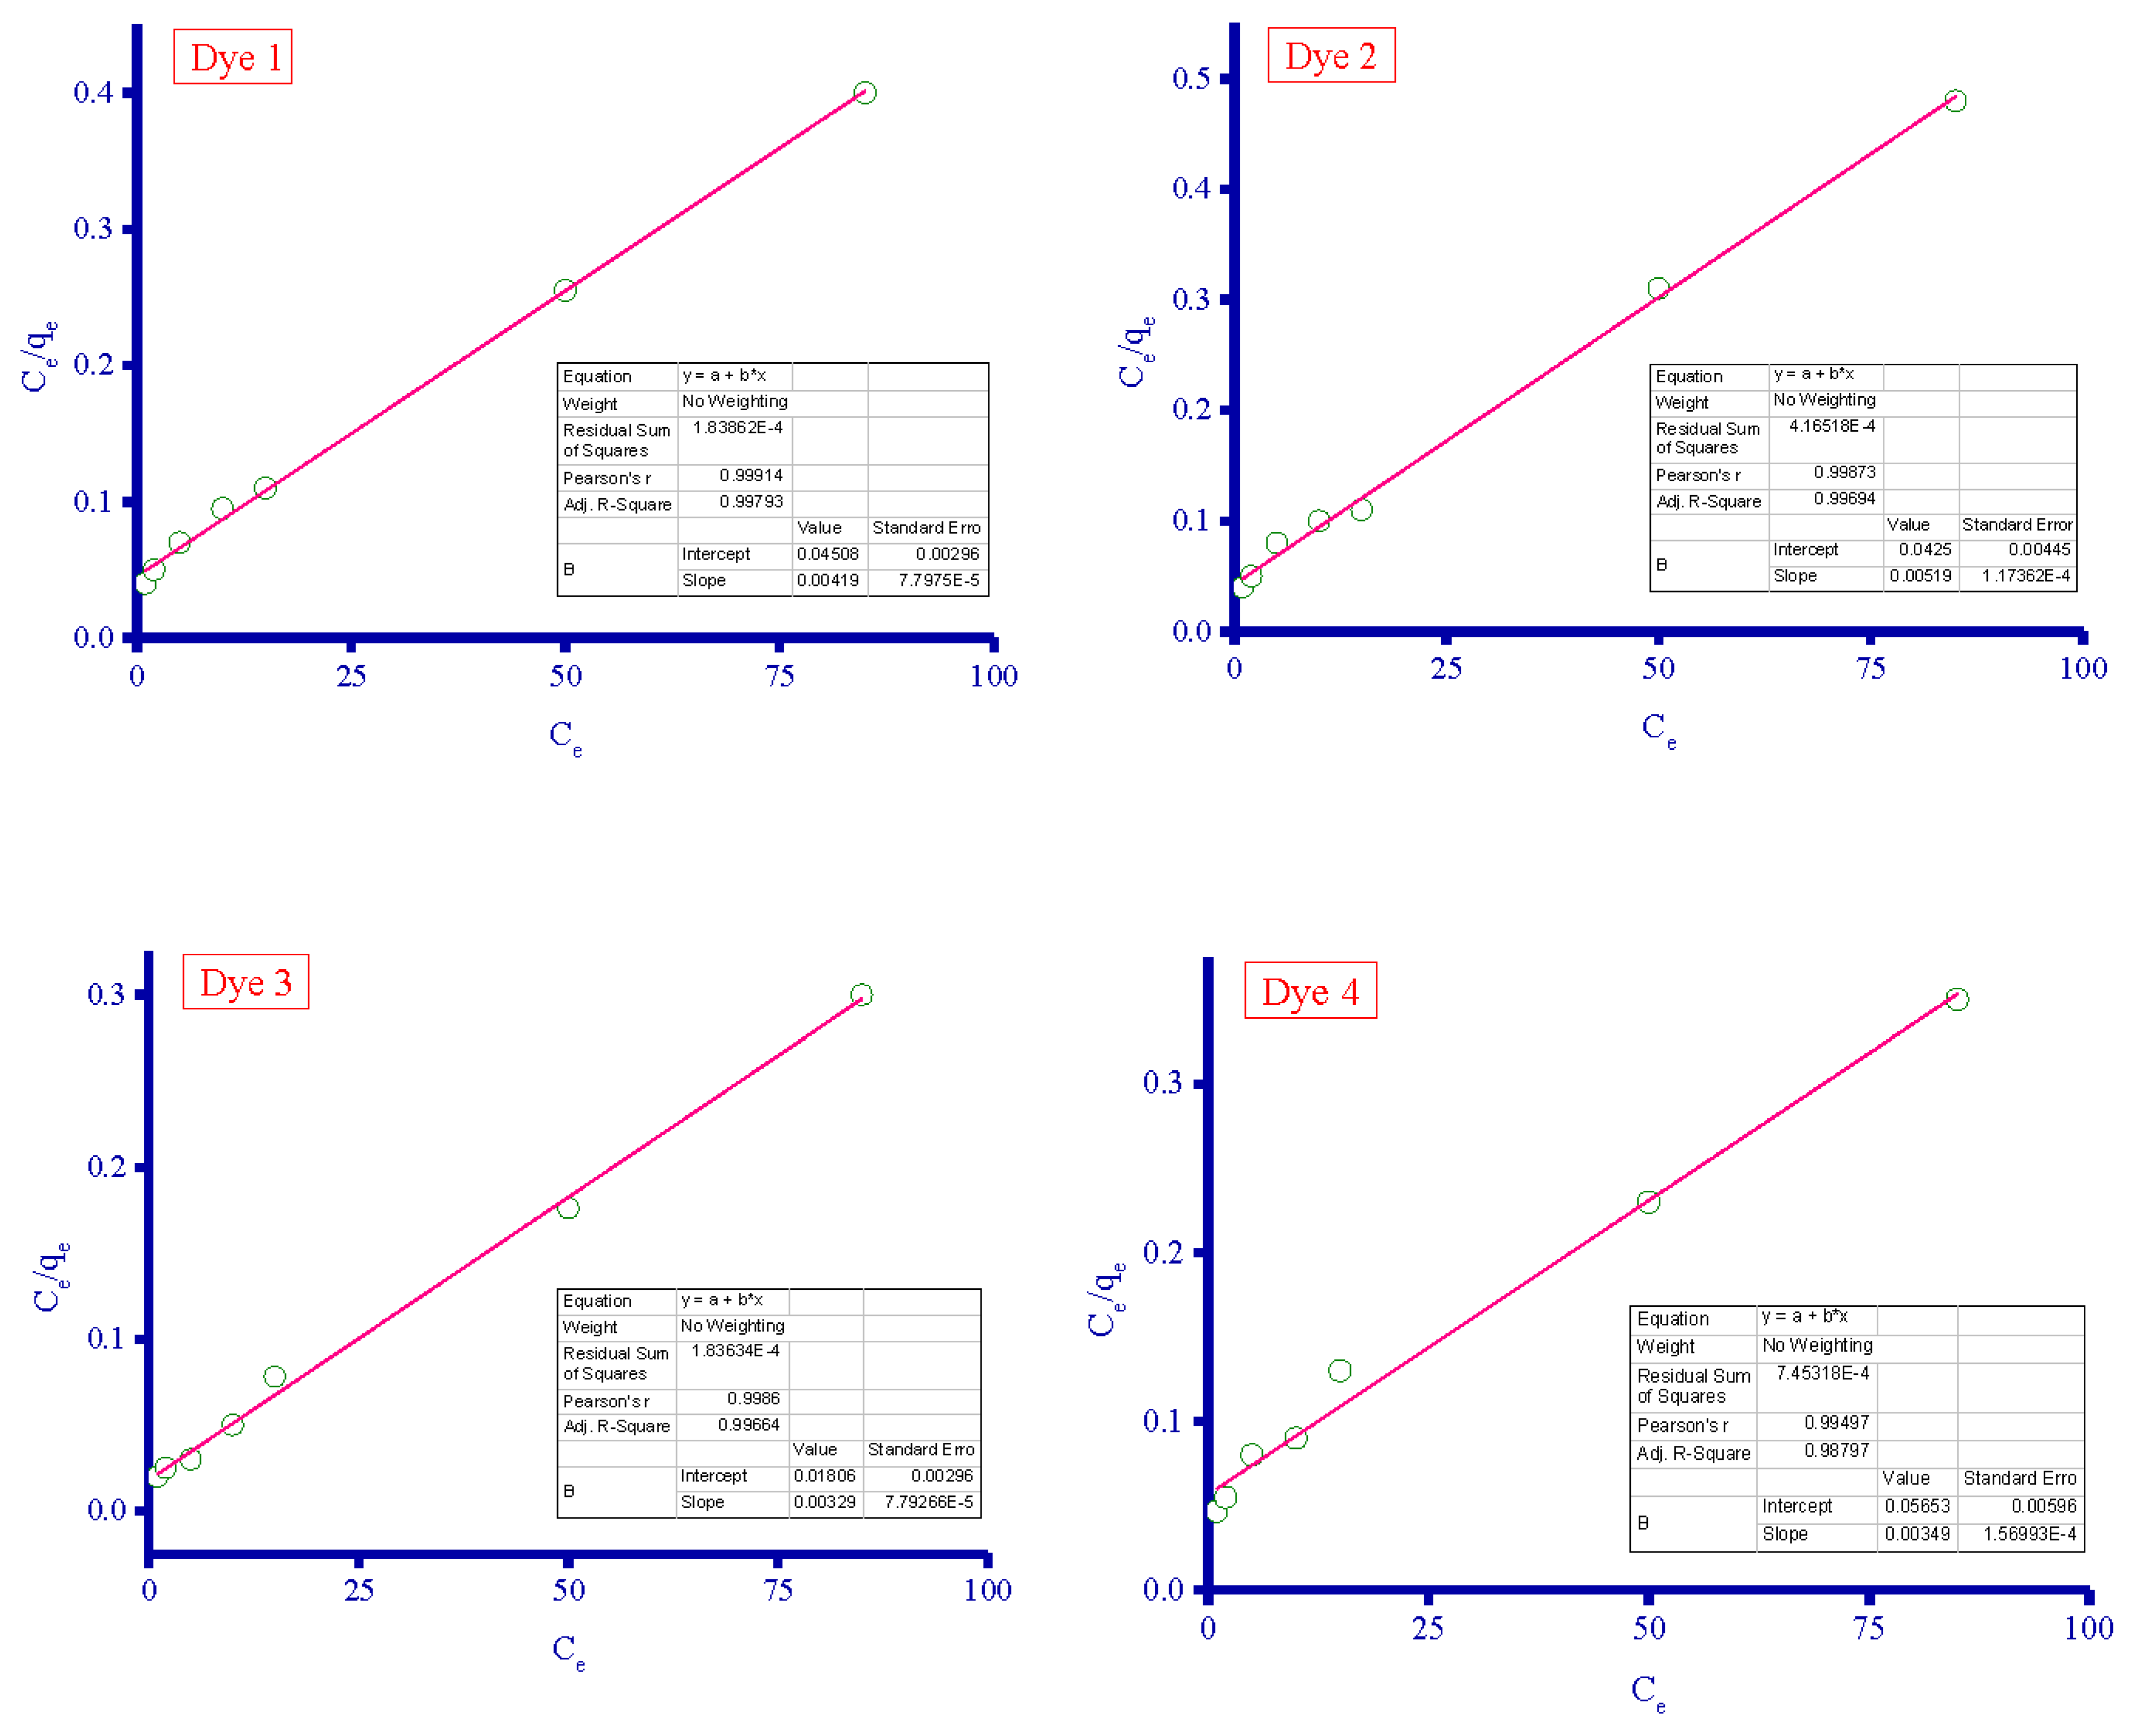
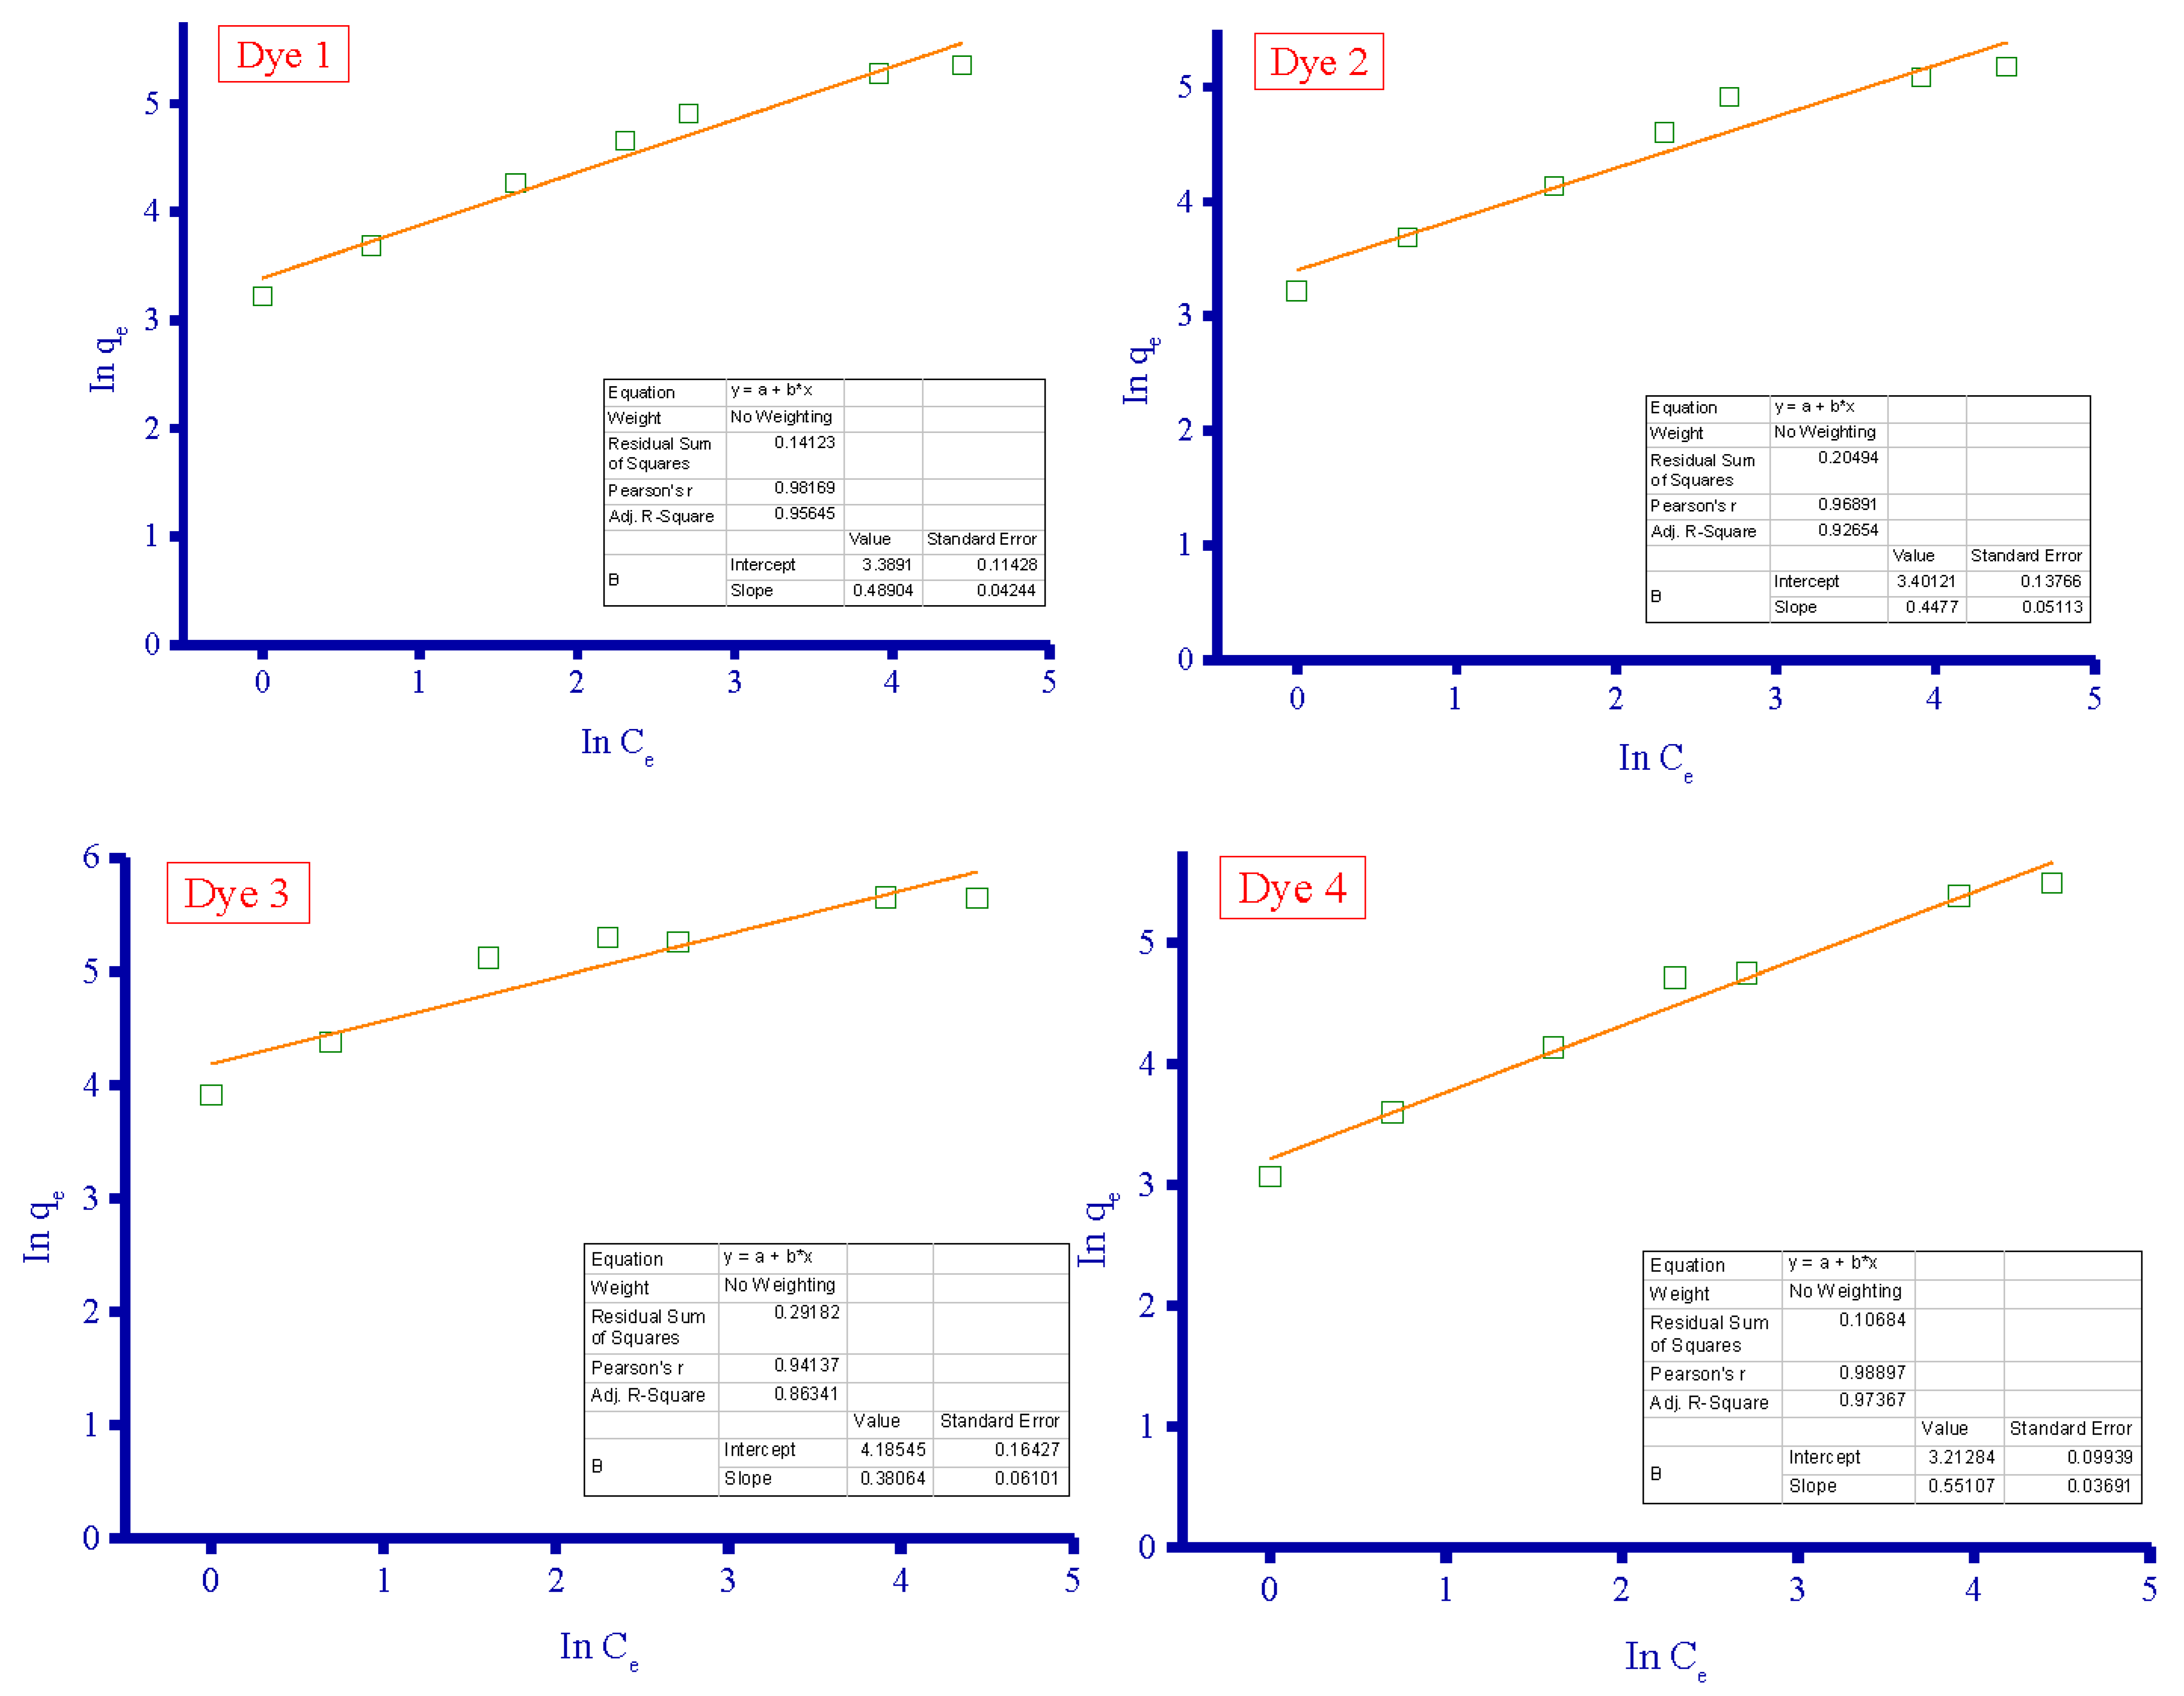
3.4. Adsorption Isotherms
3.5. Suggested Mechanism of Adsorption
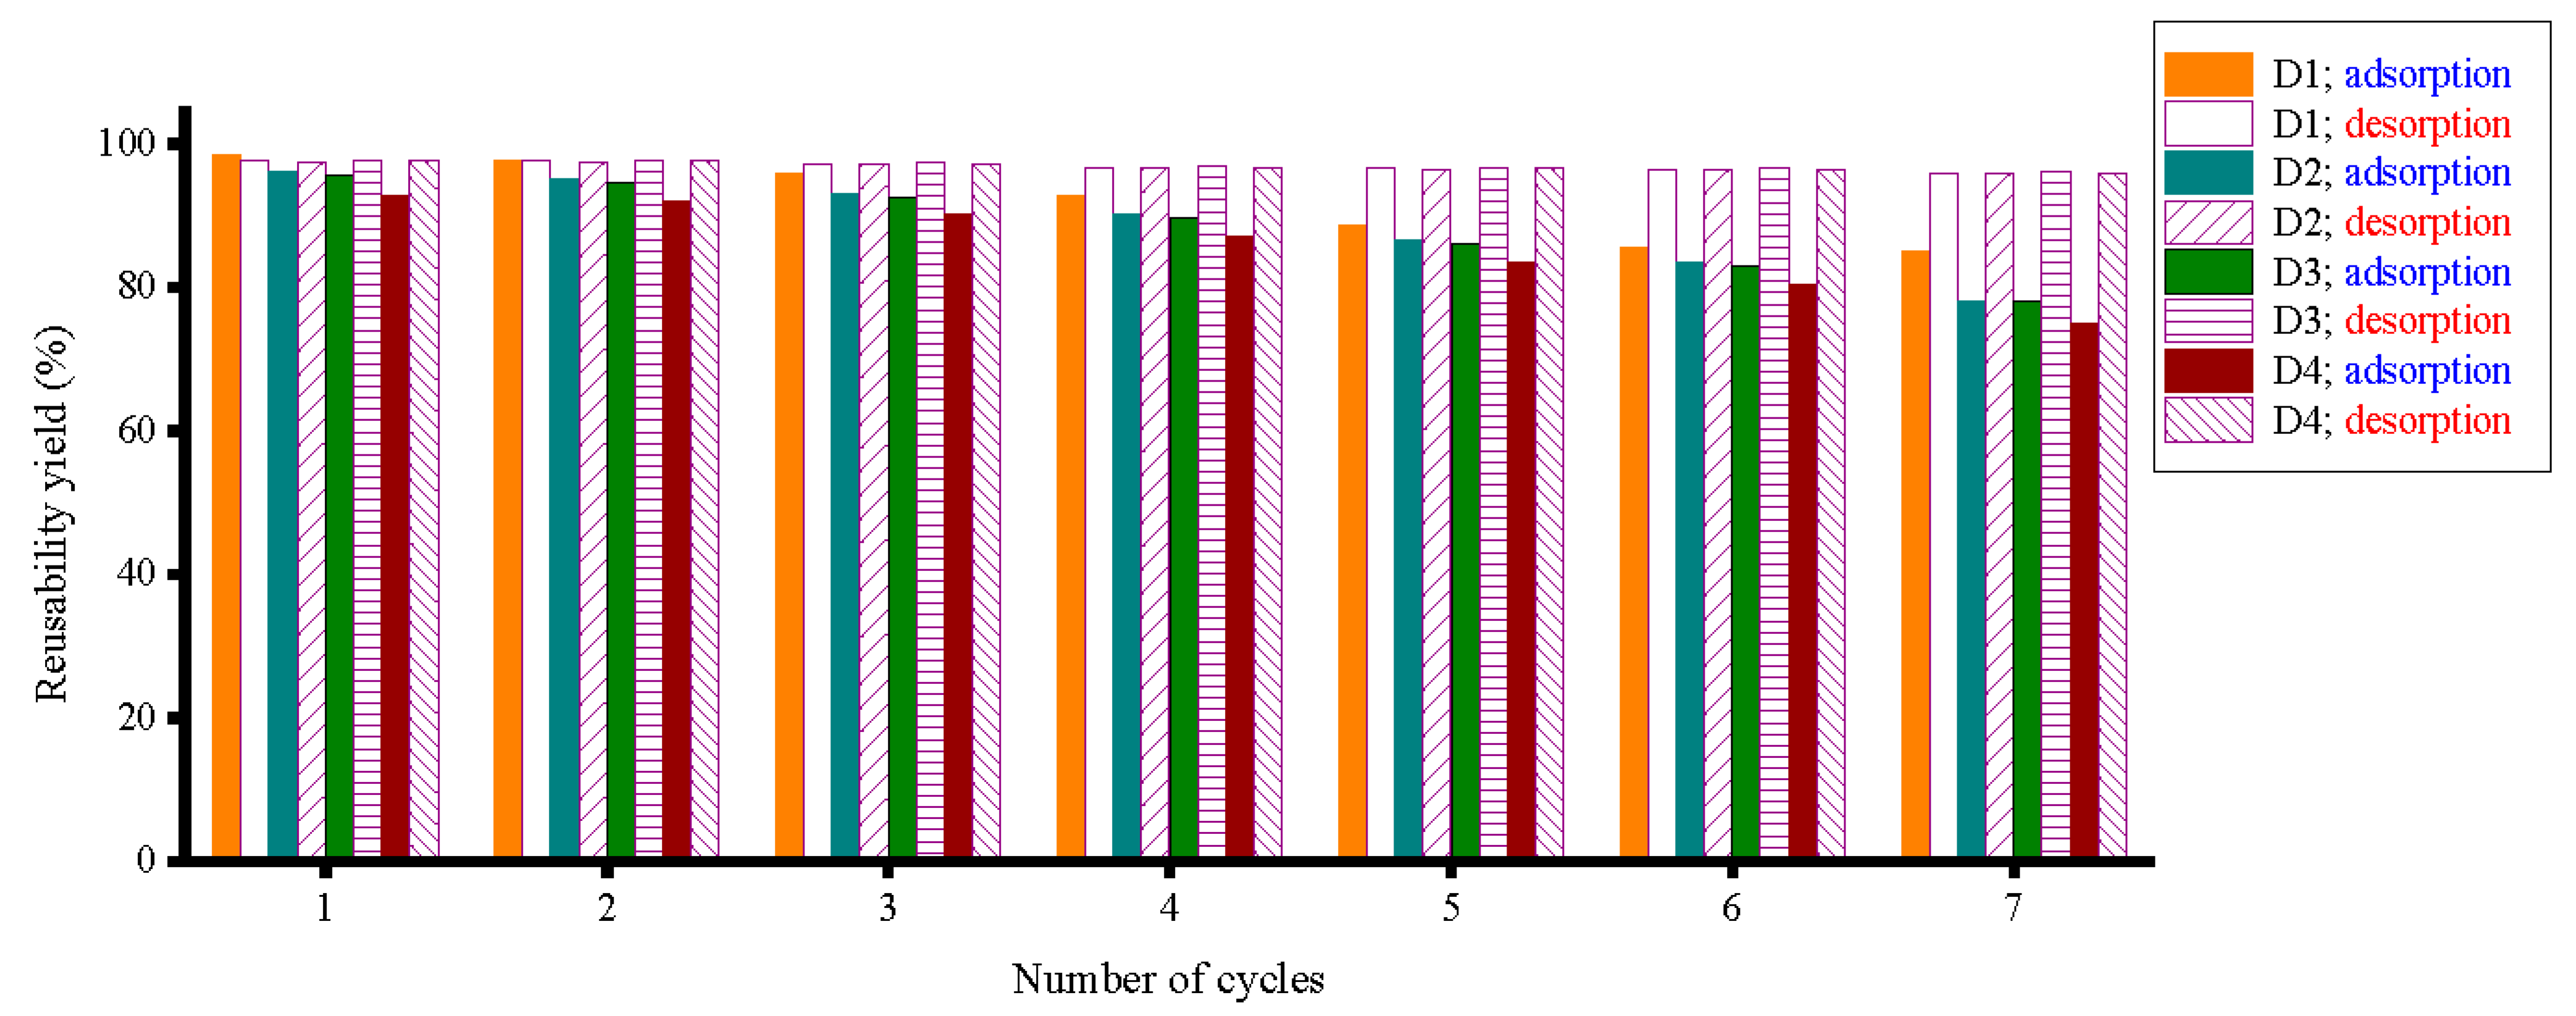
3.6. Regeneration and Reusability
4. Conclusions
Author Contributions
Funding
Data Availability Statement
Acknowledgments
Conflicts of Interest
References
- Nikovskiy, I.A.; Isakovskaya, K.L.; Nelyubina, Y.V. New Low-Dimensional Hybrid Perovskitoids Based on Lead Bromide with Organic Cations from Charge-Transfer Complexes. Crystals 2021, 11, 1424. [Google Scholar] [CrossRef]
- Mersal, G.A.M.; Ibrahim, M.M.; Amin, M.A.; Mezni, A.; Mostafa, N.Y.; Alharthi, S.; Boukherroub, R.; El-Sheshtawy, H.S. Facile Charge Transfer between Barbituric Acid and Chloranilic Acid over g-C3N4: Synthesis, Characterization and DFT Study. Crystals 2021, 11, 636. [Google Scholar] [CrossRef]
- Chen, R.; Gokus, M.K.; Pagola, S. Tetrathiafulvalene: A Gate to the Mechanochemical Mechanisms of Electron Transfer Reactions. Crystals 2020, 10, 482. [Google Scholar] [CrossRef]
- Naito, T. Organic Conductors. Crystals 2022, 12, 523. [Google Scholar] [CrossRef]
- Salzillo, T.; Venuti, R.G.D.E.; Brillante, A.; Kociok-Köhn, G.; di Nuzzo, D.; Masino, M.; Girlando, A. (Perylene)3-(TCNQF1)2: Yet Another Member in the Series of Perylene–TCNQFx Polymorphic Charge Transfer Crystals. Crystals 2020, 10, 177. [Google Scholar] [CrossRef]
- van Trang, N.; Dung, T.N.; Cuong, N.T.; Hai, L.H.; Escudero, D.; Nguyen, M.T.; Nguyen, H.M.T. Theoretical Study of a Class of Organic D-π-A Dyes for Polymer Solar Cells: Influence of Various π-Spacers. Crystals 2020, 10, 163. [Google Scholar] [CrossRef]
- Khan, I.M.; Alam, K.; Alam, M.J. Exploring charge transfer dynamics and photocatalytic behavior of designed donor-acceptor complex: Characterization, spectrophotometric and theoretical studies (DFT/TD-DFT). J. Mol. Liq. 2020, 310, 113213. [Google Scholar] [CrossRef]
- Al-Saif, F.A.; El-Habeeb, A.A.; Refat, M.S.; Eldaroti, H.H.; Adam, A.M.A.; Fetooh, H.; Saad, H.A. Chemical and physical properties of the charge transfer complexes of domperidone antiemetic agent with π-acceptors. J. Mol. Liq. 2019, 293, 111517. [Google Scholar] [CrossRef]
- Al-Saif, F.A.; El-Habeeb, A.A.; Refat, M.S.; Adam, A.M.A.; Saad, H.A.; El-Shenawy, A.I.; Fetooh, H. Characterization of charge transfer products obtained from the reaction of the sedative-hypnotic drug barbital with chloranilic acid, chloranil, TCNQ and DBQ organic acceptors. J. Mol. Liq. 2019, 287, 110981. [Google Scholar] [CrossRef]
- Miyan, L.; Zulkarnain, A. Ahmad, Spectroscopic and spectrophotometric studies on hydrogen bonded charge transfer complex of 2-amino-4-methylthiazole with chloranilic acid at different temperatures. J. Mol. Liq. 2018, 262, 514–526. [Google Scholar] [CrossRef]
- Khan, I.M.; Shakya, S.; Singh, N. Preparation, single-crystal investigation and spectrophotometric studies of proton transfer complex of 2,6-diaminopyridine with oxalic acid in various polar solvents. J. Mol. Liq. 2018, 250, 150–161. [Google Scholar] [CrossRef]
- Singh, N.; Khan, I.M.; Ahmad, A.; Javed, S. Synthesis, spectrophotometric and thermodynamic studies of charge transfer complex of 5,6-dimethylbenzimidazole with chloranilic acid at various temperatures in acetonitrile and methanol solvents. J. Mol. Liq. 2016, 221, 1111–1120. [Google Scholar] [CrossRef]
- Eldaroti, H.H.; Gadir, S.A.; Refat, M.S.; Adam, A.M.A. Spectroscopic investigations of the charge-transfer interaction between the drug reserpine and different acceptors: Towards understanding of drug–receptor mechanism. Spectrochim. Acta A 2013, 115, 309–323. [Google Scholar] [CrossRef] [PubMed]
- Eldaroti, H.H.; Gadir, S.A.; Refat, M.S.; Adam, A.M.A. Preparation, spectroscopic and thermal characterization of new charge-transfer complexes of ethidium bromide with π-acceptors. In vitro biological activity studies. Spectrochim. Acta A 2013, 109, 259–271. [Google Scholar] [CrossRef] [PubMed]
- Eldaroti, H.H.; Gadir, S.A.; Refat, M.S.; Adam, A.M.A. Charge transfer complexes of the donor acriflavine and the acceptors quinol, picric acid, TCNQ and DDQ: Synthesis, spectroscopic characterizations and antimicrobial studies. Int. J. Electrochem. Sci. 2013, 8, 5774–5800. [Google Scholar]
- Smith, S.C.; Rodrigues, D.F. Carbon-based nanomaterials for removal of chemical and biological contaminants from water: A review of mechanisms and applications. Carbon 2015, 91, 122–143. [Google Scholar] [CrossRef]
- Harahap, S.A.A.; Nazar, A.; Yunita, M.; Pasaribu, R.A.; Panjaitan, F.; Yanuar, F.; Misran, E. Isothermal approach to predict the removal efficiency of β-carotene adsorption from CPO using activated carbon produced from tea waste. IOP Conf. Ser. Mater. Sci. Eng. 2018, 309, 012120. [Google Scholar] [CrossRef]
- Nasuha, N.; Hameed, B.H.; Din, A.T.M. Rejected tea as a potential low-cost adsorbent for the removal of methylene blue. J. Hazard. Mater. 2010, 175, 126–132. [Google Scholar] [CrossRef]
- Adam, A.M.A.; Saad, H.A.; Atta, A.A.; Alsawat, M.; Hegab, M.S.; Altalhi, T.A.; Refat, M.S. Utilization of charge-transfer complexation to generate carbon-based nanomaterial for the adsorption of pollutants from contaminated water: Reaction between urea and vacant orbital acceptors. J. Mol. Liq. 2021, 341, 117416. [Google Scholar] [CrossRef]
- Adam, A.M.A.; Saad, H.A.; Atta, A.A.; Alsawat, M.; Hegab, M.S.; Refat, M.S.; Altalhi, T.A.; Alosaimi, E.H.; Younes, A.A.O. Usefulness of charge-transfer interaction between urea and vacant orbital acceptors to generate novel adsorbent material for the adsorption of pesticides from irrigation water. J. Mol. Liq. 2022, 349, 118188. [Google Scholar] [CrossRef]
- Adam, A.M.A.; Saad, H.A.; Atta, A.A.; Alsawat, M.; Hegab, M.S.; Altalhi, T.A.; Refat, M.S. An Environmentally Friendly Method for Removing Hg(II), Pb(II), Cd(II) and Sn(II) Heavy Metals from Wastewater Using Novel Metal–Carbon-Based Composites. Crystals 2021, 11, 882. [Google Scholar] [CrossRef]
- Adam, A.M.A.; Saad, H.A.; Atta, A.A.; Alsawat, M.; Hegab, M.S.; Refat, M.S.; Altalhi, T.A.; Alosaimi, E.H.; Younes, A.A.O. Preparation and Characterization of New CrFeO3-Carbon Composite Using Environmentally Friendly Methods to Remove Organic Dye Pollutants from Aqueous Solutions. Crystals 2021, 11, 960. [Google Scholar] [CrossRef]
- Dükkancı, M.; Gündüz, G.; Yılmaz, S.; Prihod’ko, R.V. Heterogeneous Fenton-like degradation of Rhodamine 6G in water using CuFeZSM-5 zeolite catalyst prepared by hydrothermal synthesis. J. Hazard. Mater. 2010, 181, 343–350. [Google Scholar] [CrossRef] [PubMed]
- Wang, G.; Wang, D.; Kuang, S.; Xing, W.; Zhuo, S. Hierarchical porous carbon derived from rice husk as a low-cost counter electrode of dye-sensitized solar cells. Renew. Energy 2014, 63, 708–714. [Google Scholar] [CrossRef]
- Xiao, N.; Zhang, X.; Liu, C.; Wang, Y.; Li, H.; Qiu, J. Coal-based carbon anodes for high-performance potassium-ion batteries. Carbon 2019, 147, 574–581. [Google Scholar] [CrossRef]
- Gao, X.; Zhang, Y.; Dai, Y.; Fu, F. High-performance magnetic carbon materials in dye removal from aqueous solutions. J. Solid State Chem. 2016, 239, 265–273. [Google Scholar] [CrossRef]
- Feng, H.; Hu, H.; Dong, H.; Xiao, Y.; Cai, Y.; Lei, B.; Liu, Y.; Zheng, M. Hierarchical structured carbon derived from bagasse wastes: A simple and efficient synthesis route and its improved electrochemical properties for high-performance supercapacitors. J. Power Sources 2016, 302, 164–173. [Google Scholar] [CrossRef]
- Kim, P.J.; Fontecha, H.D.; Kim, K.; Pol, V.G. Toward high-performance lithium-sulfur batteries: Upcycling of LDPE plastic into sulfonated carbon scaffold via microwave-promoted sulfonation. ACS Appl. Mater. Interfaces 2018, 10, 14827–14834. [Google Scholar] [CrossRef]
- Bohli, T.; Quederni, A. Improvement of oxygen-containing functional groups on olive stones activated carbon by ozone and nitric acid for heavy metals removal from aqueous phase. Environ. Sci. Pollut. Res. 2016, 23, 15852–15861. [Google Scholar] [CrossRef]
- Gu, W.; Sevilla, M.; Fuertes, A.M.A.B.; Yushin, G. Sulfur-containing activated carbons with greatly reducedcontent of bottle neck pores for double-layer capacitors: A case study for pseudocapacitance detection. Energy Environ. Sci. 2013, 6, 2465–2476. [Google Scholar] [CrossRef]
- Kim, I.; Rehman, M.S.U.; Han, J. Fermentable sugar recovery and adsorption potential of enzymatically hydrolyzed rice straw. J. Clean. Prod. 2014, 66, 555–561. [Google Scholar] [CrossRef]
- Wang, G.; Yang, L.; Jiang, L.; Shi, M.; Wei, Z.; Zhong, W.; Li, S.; Cui, J.; Wei, W. Simple combination of humic acid with biogenic hydroxyapatite achieved highly efficient removal of methylene blue from aqueous solution. RSC Adv. 2016, 6, 67888–67897. [Google Scholar] [CrossRef]


| Dye Name | Abbreviation | Chemical Formula | MW (g/mol) | Dye Content |
|---|---|---|---|---|
| Azocarmine G2 | Dye 1 | C28H21N3 | 399.48 | ≥75.0% |
| Methyl violet 2B | Dye 2 | C23H26N3Cl | 379.90 | ≥75.0% |
| Eosin B | Dye 3 | C20H8Br2N2O9 | 580.10 | 95.0% |
| Toluidine blue | Dye 4 | C15H16ClN3S·0.5ZnCl2 | 373.97 | 90.0% |
| Sample | Chemical Composition (%) | ||||||
|---|---|---|---|---|---|---|---|
| C | O | N | K | S | P | Fe | |
| Waste tea leaf | 74.44 | 22.56 | 1.96 | - | 0.56 | 0.48 | - |
| Biomass-derived-ACs | 43.97 | 52.59 | 1.11 | 2.33 | - | - | - |
| Composite | 43.91 | 47.20 | 1.69 | 1.95 | - | - | 5.25 |
| Sample | Surface Area (m2/g) | Pore Volume (cm3/g) | Pore Size (nm) |
|---|---|---|---|
| Biomass-derived-ACs | 630 | 0.2753 | 2.40 |
| Composite | 784 | 0.2939 | 2.64 |
| Adsorbent | Langmuir Isotherm | Freundlich Isotherm | ||||
|---|---|---|---|---|---|---|
| qm (mg/g) | KL (L/mg) | R2 | KF | n (L/mg) | R2 | |
| Dye 1 | 238.6 | 0.093 | 0.9991 | 29.64 | 2.05 | 0.9817 |
| Dye 2 | 192.7 | 0.122 | 0.9987 | 30.00 | 2.23 | 0.9689 |
| Dye 3 | 304.0 | 0.182 | 0.9986 | 65.72 | 2.63 | 0.9414 |
| Dye 4 | 286.5 | 0.062 | 0.9950 | 24.85 | 1.81 | 0.9890 |
Publisher’s Note: MDPI stays neutral with regard to jurisdictional claims in published maps and institutional affiliations. |
© 2022 by the authors. Licensee MDPI, Basel, Switzerland. This article is an open access article distributed under the terms and conditions of the Creative Commons Attribution (CC BY) license (https://creativecommons.org/licenses/by/4.0/).
Share and Cite
Al-Hazmi, G.H.; Saad, H.A.; Refat, M.S.; Adam, A.M.A. Fe3O4-Carbon-Based Composite Derived from the Charge-Transfer Reaction Using Waste Tea Leaves as the Carbon Precursor for Enhanced Removing of Azocarmine G2, Methyl Violet 2B, Eosin B, and Toluidine Blue from Aqueous Solution. Crystals 2022, 12, 1355. https://doi.org/10.3390/cryst12101355
Al-Hazmi GH, Saad HA, Refat MS, Adam AMA. Fe3O4-Carbon-Based Composite Derived from the Charge-Transfer Reaction Using Waste Tea Leaves as the Carbon Precursor for Enhanced Removing of Azocarmine G2, Methyl Violet 2B, Eosin B, and Toluidine Blue from Aqueous Solution. Crystals. 2022; 12(10):1355. https://doi.org/10.3390/cryst12101355
Chicago/Turabian StyleAl-Hazmi, Ghaferah H., Hosam A. Saad, Moamen S. Refat, and Abdel Majid A. Adam. 2022. "Fe3O4-Carbon-Based Composite Derived from the Charge-Transfer Reaction Using Waste Tea Leaves as the Carbon Precursor for Enhanced Removing of Azocarmine G2, Methyl Violet 2B, Eosin B, and Toluidine Blue from Aqueous Solution" Crystals 12, no. 10: 1355. https://doi.org/10.3390/cryst12101355