Article

Experimental and Modeling Study of Phase-Specific Flow Stress Distribution in Intercritically Annealed Quenching and Partitioning Steels

1
Collaborative Innovation Center of Steel Technology, University of Science and Technology Beijing, Beijing 100083, China
2
Beijing Engineering Technology Research Center of Special Steel for Traffic and Energy, Beijing 100083, China
3
Neutron Scattering Division, Oak Ridge National Laboratory, Oak Ridge, TN 37831, USA
*
Author to whom correspondence should be addressed.
Crystals 2022, 12(10), 1412; https://doi.org/10.3390/cryst12101412
Submission received: 5 September 2022 / Revised: 30 September 2022 / Accepted: 4 October 2022 / Published: 6 October 2022

Abstract

:
To meet the increasing demand and stringent requirements of automotive structural steels, intercritically annealed quenching and partitioning (QP) steels are attracting significant attention owing to their excellent strength–plasticity balance. However, to date, limited reports have focused on the correlation between the microstructure and strength of intercritically annealed QP. In this study, the mechanical behaviors of QP steels with different Si contents were investigated by developing a physical-based mechanical model based on microstructural characterizations. In situ neutron diffraction was used to analyze the evolution of the phase constitution. Si content influenced the phase transformation behavior of the test steel. In the early stages of deformation, Si-strengthened steel exhibited lower retained austenite (RA) stability and faster transformation kinetics. The variation in the RA volume fraction with the deformation was fitted using a segmented exponential function. Based on the microstructure and strengthening mechanisms, a mechanical model considering grain refinement during phase transformation was proposed. The model was validated using intercritically annealed QP steels with different Si contents. The transformation-induced plasticity effect, that is, the contribution of RA to the strength, was discussed from two perspectives. Deformation-induced martensite (DIM) exhibited a significant work-hardening rate owing to the high solid solution strengthening by carbon and the high dislocation density. The residual RA after the DIM transformation exhibited a non-negligible stress distribution. Particularly, the grain boundary density and dislocations increased with strain, strengthening the remaining RA.

1. Introduction

Quenching and partitioning (QP) processing was first proposed by Speer et al. over a decade ago [1,2]. Currently, QP steel, known as third-generation advanced high-strength steel (AHSS), is widely used in the automotive industry owing to its good combination of strength and ductility. As a lean alloy steel, it has also attracted significant attention owing to its low cost. Studies have shown that the mechanical properties of QP steels can be improved considerably by optimizing their composition and processes [3,4,5,6]. The QP process begins with quenching between the martensite start temperature (Ms) and martensite finish temperature (Mf), followed by the partitioning into austenite through isothermal holding. For the successful diffusion of C to austenite, carbide precipitation should be suppressed as a competing reaction. As a non-carbide-forming element, Si is an effective inhibitor of carburization [7]. Thus, the effect of Si on the microstructure and mechanical properties of QP steels has been analyzed in previous studies [8,9,10].
A quantitative relationship between the microstructure and mechanical properties should be established to elucidate the relationship between the composition, process, microstructure, and properties of QP steel. QP steel has a mixed structure, including a metastable austenite, that can realize the transformation-induced plasticity (TRIP) effect. However, quantitative modeling is considered challenging because it is used to characterize the mechanical behavior of each phase and to investigate the effects of deformation-induced martensite (DIM) transformation on the mechanical properties. Mecking et al. [11] proposed a phenomenological model that incorporated the rate of dynamic recovery into the flow kinetics. Bouaziz et al. [12] validated the applicability of the Kocks–Mecking model to show the relationship between the microstructure and mechanical properties of high-Mn steels. Seo et al. [13] developed a physical-based model of the mechanical behavior of QP steels with a predominantly martensitic phase, which considered the composition, domain size, phase fraction, and dislocation density evolution in each constituent of the microstructure. Gao et al. [14] built a generalized physical model to predict the yield strengths of as-quenched QP steels, which simplified the microstructure by homogenizing the initial martensite, secondary martensite, and bainitic ferrite. Hu et al. [15] constructed a model considering solid solution, grain boundary, and dislocation strengthening mechanisms, and elucidated the effect of Cu precipitation on the properties of QP steel.
Although the models of the mechanical behavior of QP steels have been investigated in earlier studies, most of them have been focused on the fully austenitized annealing QP process. Moreover, some models have simplified the phase constitution, and have not considered the DIM transformation. In this study, the microstructures of intercritically annealed QP steels were observed. The evolution of the phase constitution during tensile deformation was studied using in situ neutron diffraction. The kinetics of the strain-dependent martensitic transformation in QP steels with different Si contents were investigated. By analyzing the strengthening mechanism, a physical-based model of intercritically annealed QP steel considering grain refinement during phase transformation was built based on the iso-work theory and microstructure analyses. Finally, the relationship between the microstructure and strength was elucidated.

2. Materials and Methods

2.1. Materials

The chemical compositions of the investigated steels in weight percent (wt.%) were Fe–0.19C–1.72Si–2.59Mn and Fe–0.19C–2.53Si–2.53Mn. Si was added to suppress carbide precipitation during the QP steps. The steel was melted in a vacuum induction furnace and forged into 35 mm-thick ingots at 1200–950 °C. The forged ingots were homogenized at 1200 °C for 2 h and hot rolled to 3.5 mm-thick strips through six passes at 1200–900 °C. The hot-rolled sheets were cooled to 660 °C using a laminar flow system, followed by furnace cooling to room temperature (25 °C). The hot-rolled plates were pickled and cold-rolled to a thickness of 1.3 mm for the QP treatment. The critical temperatures of the investigated steels were measured by dilatometric analysis. The critical austenite transformation starting temperature ( A c 1 ) values of QP1.7Si and QP2.5Si were 670 °C and 675 °C, respectively. The critical austenite transformation finishing temperature ( A c 3 ) values of QP1.7Si and QP2.5Si were 890 °C and 920 °C, respectively [16]. The intercritically annealed QP treatment was simulated using a ULVAC continuous annealing simulator (CCT-AY-II) [16]. The samples were heated under vacuum and cooled with nitrogen at a cooling rate of 45 °C s−1. The isothermal, quenching termination, and partition temperatures were 800, 140, and 420 °C, respectively. The quenching temperature (140 °C) was calculated using the method described in Ref. [17]. The isothermal and partition durations were 120 and 60 s, respectively. The investigated intercritically annealed QP steels with Si content of 1.72 and 2.53 wt.% are hereafter termed as QP1.7Si and QP2.5Si, respectively.

2.2. Microstructural Characterizations

The microstructures were characterized by scanning electron microscopy (SEM, FEI Quanta 450FEG field emission SEM, 20 kV) (FEI, Hillsboro, OR, USA). The samples for the SEM observations were mechanically polished and etched with a nital solution (3 vol.% nitric acid and 97 vol.% ethanol) for 3 s.

2.3. In Situ Neutron Diffraction Measurements

Flat dog-bone-shaped tensile specimens with a gauge length and width of 15 and 2.6 mm, respectively, were machined along the rolling direction. The in situ neutron diffraction analyses of these specimens were conducted using a VULCAN diffractometer (USA) at the Spallation Neutron Source [18,19], Oak Ridge National Laboratory. The detailed neutron diffraction experimental setup was based on Refs. [16,19]. Sample loading was performed at a 45° angle from the incident neutron beam. Crystallographic changes in the loading direction were collected by the detector bank. An engineering strain of approximately 13% was applied to the samples. Neutron diffraction data were continuously collected and sliced every 300 s throughout the experiment. Single-peak fittings were performed using the VDRIVE software [20], and the volume fractions of each phase (face-centered cubic (FCC) and body-centered cubic (BCC)) were quantified by Rietveld refinement using the GSAS software [21].

3. Results

3.1. Microstructural Characterization

Figure 1 shows the microstructures of the intercritically annealed QP steels investigated herein, viz. QP1.7Si and QP2.5Si. Figure 1a,b show the initial microstructures prior to QP processing. The original microstructure of the investigated steels contained as-cold-rolled banded pearlite (P) and ferrite (F). Microstructures of the investigated steels after QP processing are shown in Figure 1c,d. The microstructure of QP1.7Si mainly comprised tempered martensite (TM) and retained austenite (RA), with a small amount of F. The RA volume fraction was obtained by analyzing the neutron diffraction patterns (Figure 2a,c). F can be distinguished from the other phases owing to its higher corrosion resistance to nital, as shown in Figure 1e. Moreover, the F volume fraction in QP2.5Si was higher than that in QP1.7Si. As a typical ferrite-forming element, Si increased the intercritical temperature of steel and reduced the γ-phase region, thereby increasing the ferrite fraction in the intercritical annealing stage [1]. During the QP process, Si inhibited cementite formation and allowed more carbon to diffuse into the austenite, thereby increasing the stability of the austenite. The volume fraction of F was quantitatively analyzed by SEM, the RA fraction was obtained by neutron diffraction, and the remaining fraction was TM. The phase volume fractions of the investigated steels without deformation are presented in Figure 1g,h.

3.2. Mechanical Properties and Evolution of the Phase Constitution

The yield strength, ultimate tensile strength, and total elongation of QP1.7Si were 1012 MPa, 1202 MPa, and 20.6%, respectively; the corresponding values for QP2.5Si were 818 MPa, 1330 MPa, and 21.5%. As a metastable transforming phase, RA transformed into DIM during the tensile process. The corresponding back stress effect of phase transformation dramatically increased the strength and plasticity of the sample, i.e., the TRIP effect [22,23] was realized. Figure 2a,c shows the evolution of the neutron diffraction patterns with strain. With increasing strain, the intensity of the FCC peaks ( γ ) decreased significantly, indicating the gradual consumption of RA. Using the Rietveld refinement, the evolution of the RA volume fraction with the true strain is plotted in Figure 2b,d.

4. Discussion

4.1. Phase Transformation Kinetics

Knijf et al. [24] proposed an exponential function to fit the variations in the RA fraction ( f γ ) with the strain ( ε ):
f γ = A exp ( - B ε )
where the pre-exponential parameter A is assigned as the initial RA fraction, and exponential parameter B is related to the features that influence the austenite stability. For QP1.7Si, the evolution of the phase constitution was well fitted by the exponential relationship, as shown in Figure 2b, where parameters A and B were 12.77 and 7.49, respectively. Meanwhile, RA in QP2.5Si underwent a significant two-stage phase transformation, as shown in Figure 2d. A segmented exponential function was used to fit the variations in the RA volume fraction. QP2.5Si exhibited a higher B value at the initial stage ( g 1 , B = 26.30) than QP1.7Si, indicating the lower mechanical stability of RA. After the knee, the B value of QP2.5Si decreased to a value comparable to that of QP1.7Si ( g 2 , B = 5.32). The relationship between the RA volume fraction and strain began to deviate upwards from the fitting curve g 1 when the true strain was increased to ~0.01 (stress = 700 MPa).
According to our previous study [16], the FCC phase of QP2.5Si yielded at 700 MPa. Based on the parent phase yields before martensite formation, some studies [25,26] further categorized the DIM transformation into stress-assisted and strain-induced transformations. The martensite formed after the parent phase has yielded is called strain-induced martensite; otherwise, it is called stress-assisted martensite. For QP2.5Si, the critical strain for strain-induced martensite and stress-assisted martensite were 0.002 and 0.007, respectively. Approximately 29 vol.% DIM belonged to stress-assisted martensite, which occurred through the heterogeneous nucleation on the same nucleation sites [27]. Consequently, 71 vol.% DIM was ascribed to strain-induced transformation, which took place in plastically deformed austenite on new nucleation sites generated by plastic deformation [28]. The excellent mechanical properties of TRIP-aided steels are mainly ascribed to the deformation-induced transformation, which are depicted as the dissipation of strain energy accumulated during deformation [29]. The investigated steels underwent DIM phase transformation over a wide stress span, which led to continuous strengthening and the TRIP effect.
In the exponential model, all the factors contributing to the mechanical stability of RA are grouped under the exponential factor B . However, this is detrimental to understanding the essential distinctions in microscopic mechanisms [30]. To further describe the kinetics of the strain-dependent martensitic transformation, the Olson–Cohen (O–C) model [31] was utilized, as shown in Equation (2):
f DIM = f RA , 0 { 1   -   exp [ - β ( 1   -   exp ( - α ε ) ) n ] }
where f DIM is the volume fraction of DIM, f RA , 0 is the volume fraction of RA without deformation, ε is the true strain, while α , β , and n are the parameters related to austenite stability. The O–C fitting curves for the two investigated steels are shown in Figure 3. Parameter n is a fixed exponent related to the orientation distribution of the shear bands. When n = 2 , the shear bands are randomly oriented [31]. Parameter β is proportional (the geometrical factors are considered insensitive to temperature) to the probability that an intersection will form an embryo. According to the fitting results, no significant difference was observed in the transformation driving force between QP1.7Si and QP2.5Si. Parameter α , which defines the course of shear-band formation with strain, is temperature-sensitive because of its dependence on the stacking-fault energy. From the O–C fitting results, the α value of QP2.5Si was significantly higher than that of QP1.7Si. The higher Si concentration in QP2.5Si reduces the stacking-fault energy and increases the martensite nucleation rate.

4.2. Iso-Work Constitutive Relationship

To analyze the strengthening mechanism of the intercritically annealed QP steels with different Si contents, we constructed an iso-work constitutive model [32,33] based on the microstructure characteristics and evolution of the phase constitution. The relationship between the flow stress and strain can be expressed as the sum of the product of the flow stress and volume fraction of each phase:
σ ( ε ) = f j ( ε j ) × σ j ( ε j )
where σ ( ε ) is flow stress, j represents a specific phase ( F ,   RA ,   TM ,   DIM ), σ j ( ε j ) is the flow stress in each phase, and f j ( ε j ) is the volume fraction of each phase. In this work, the evolution of the phase constitution caused by the DIM transformation is considered and calculated based on the O–C relationship fitted by the neutron diffraction experimental data.
The strengthening mechanism of the investigated steel can be decomposed into the combined effect of the solid solution, grain boundary, and dislocation strengthening mechanisms. Because no micro-alloying elements, such as Nb and Ti, were added to the lean alloy steels QP1.7Si and QP2.5Si, the C depletion due to the precipitates was not considered. Moreover, the contribution of precipitation strengthening to the flow stresses in the material was ignored.
For RA and F, the flow stress was decomposed into the combined effects of solid solution strengthening ( σ j ss ) ,   grain boundary strengthening ( σ j gb ), and dislocation strengthening ( σ j dis ), as follows [13]:
σ F   = σ F ss   + σ F gb + σ F dis
σ RA = σ RA ss + σ RA gb + σ RA dis
As the microstructural characteristics of martensite are different from those of F and RA, the concept of grain boundaries was not applicable. Meanwhile, the solid solution strengthening of martensite was mainly related to C. Thus, when calculating the constitutive relationship of TM and DIM, we considered the influence of solid solution strengthening ( Δ σ j C ), Peierls stress ( σ j p ), and dislocation strengthening ( σ j dis ):
σ TM = Δ σ TM C + σ TM p + σ TM dis
σ DIM = Δ σ DIM C + σ DIM p + σ DIM dis

4.3. Alloy Concentrations and Solid Solution Strengthening

Solid solution strengthening is the hindering effect of lattice distortions on dislocations caused by solute atoms. It is related to the type and mass fraction of solute atoms. The alloy concentrations of each phase are listed in Table 1. The Si and Mn contents in each phase, and C content in F, were determined by simulating the equilibrium state at 800 °C using Thermo-Calc software with the TCFE10 database (Figure 4). The average C content in RA was estimated from the lattice parameter a γ measured from the FCC-(220) neutron diffraction pattern, according to Equation (8) [34]:
a γ = 3 . 556 + 0 . 0453 w C + 0 . 00095 w Mn
where w C and w Mn are the C and Mn contents in wt.%, respectively. The C content in the TM was calculated based on the C content of the alloy, volume fraction, and C content of each phase. The alloy composition in DIM is considered the same as that in the parent phase RA because of the low diffusion coefficient at room temperature.
The solid solution strengthening of RA and F was calculated using Equations (9) and (10), respectively [35].
σ F ss = 54 + 32 w [ Mn ] F + 83 w [ Si ] F   -   31 w [ Cr ] F + 11 w [ Mo ] F + 39 w [ Cu ] F + 678 w [ P ] F + 5544 w [ S ] F
σ RA ss = 598 w [ C ] RA   -   1 . 4 w [ Mn ] RA + 23 w [ Si ] RA   -   0 . 1 w [ Cr ] RA + 5 . 1 w [ Mo ] RA + 118 w [ Ti ] RA + 877 w [ N ] RA + 5 . 7 w [ Ni ] RA   -   17 . 5 w [ Cu ] RA
The solid solution strengthening stresses of RA in QP1.7Si and QP2.5Si were 638 and 618 MPa, respectively, whereas those of F were 261 and 336 MPa, respectively. These results suggest that Si significantly improves the strength of F, which is consistent with the results of previous studies [8,9]. When the Si content was increased from 1.7 wt.% to 2.5 wt.%, the contribution of solid solution strengthening in F increased by 28.7%.
For martensite (TM and DIM), solid solution strengthening ( Δ σ j C ) and Peierls stress ( σ j p ) are functions of the composition. Δ σ j C was calculated using the method adopted from the one reported by Rodriguez et al. [36]:
Δ σ TM C = 3065 w [ C ] TM 161
Δ σ DIM C = 3065 w [ C ] DIM 161
σ j p was calculated based on Ref. [37]:
σ TM p = 77 + 750 w [ P ] TM + 60 w [ Si ] TM + 80 w [ Cu ] TM + 45 w [ Ni ]   TM + 60 w [ Cr ] TM + 80 w [ Mn ] TM + 11 w [ Mo ] TM + 50 w [ N ] TM
σ DIM p = 77 + 750 w [ P ] DIM + 60 w [ Si ] DIM + 80 w [ Cu ] DIM + 45 w [ Ni ] DIM + 60 w [ Cr ] DIM + 80 w [ Mn ] DIM + 11 w [ Mo ] DIM + 50 w [ N ] DIM
The C contents of TM and DIM were different. As shown in Table 1, the C content of DIM was significantly higher than that of TM, corresponding to a higher solid solution strengthening.

4.4. Grain Boundary Strengthening

During the deformation of polycrystalline materials, continuity causes the deformation of the adjacent grains to restrain each other. A higher total area of the grain boundary provides greater deformation resistance, thereby improving the strength of the materials. For RA and F, the contribution of grain boundary strengthening ( σ j gb ) was calculated using the Hall–Petch relationship [38]:
σ j gb = K j d j 1 / 2
where K j is the Hall–Petch parameter (Table 2), and d j is the average grain size of each phase. Based on the quasi in situ electron backscatter diffraction (EBSD) analyses in our previous study [16], the average grain size of RA was a function of the strain. In this study, linear fitting was used to represent the variations in the grain size with stress, as shown in Figure 5. The initial grain sizes ( d j , 0 ) of QP1.7Si and QP2.5Si are presented in Table 2.

4.5. Dislocation Strengthening

The dislocation strengthening of each phase can be obtained using the Taylor’s relationship (Equation (16)) [39], based on the iterative calculation method adopted from the one reported by Seo et al. [13]:
σ j dis = α j M j G j b j ( ρ j ) 2
where α j is a constant, M j is the Taylor factor, G j is the shear modulus, b j is the magnitude of the Burgers vector, and ρ j is the dislocation density. The change in ρ j with strain can be calculated as follows:
d ρ j = M j [ 1 / b j Λ j + k j 1 ( ρ j ) 2 / b j   k j 2 ρ j ] d ε j
where k j 1 and k j 2 are the parameters related to the dislocation storage and dynamic recovery, respectively, which are obtained by fitting, and Λ j is the mean free path of the dislocation. For martensite, the values of Λ TM , 0 and Λ DIM , 0 were defined as the widths of the martensite lath obtained by the TEM experiment [16,17,40]. For ferrite, the Λ F , 0 value can be set equal to the average grain size ( d F ). For RA, the initial value of Λ RA , 0 was set equal to the initial grain size of RA ( d RA , 0 ). The effect of RA grain size reduction (Figure 5) on dislocation strengthening was also considered. The model construction parameters used in this study are presented in Table 2.

4.6. Stress–Strain Response

Quantitative phase-specific stresses can be obtained by in situ neutron diffraction data based on Hooke’s law [21,41]. The phase-specific stress–strain behaviors of QP1.7Si and QP2.5Si are shown in Figure 6. The BCC phase comprised F, TM, and DIM and the FCC phase stood for RA. A partitioning of the load was observed between the FCC and BCC phases, with the FCC phase bearing a greater stress. The F yielded at lower stresses, which reduced the lattice strain in the BCC phase and resulted in the FCC carrying additional stress. In QP2.5Si, the F volume fraction was larger, which caused a lower BCC stress than that in QP1.7Si.
Since the diffraction peaks of the F, TM, and DIM were highly overlapped, the error in separating their stress contributions cannot be accepted. The flow stress distribution of F, TM, DIM, and RA was further discussed with respect to a mechanical model. Based on Equation (3), the fitting phase-specific flow stress distribution of QP1.7Si and QP2.5Si are shown in Figure 7. The true stress–true strain curves are also shown in Figure 7. The model calculations and experimental data are excellently matched, except for the elastic strain stage, since the model considers some non-strain functions, such as solid solution strengthening. The initial value of the model is the yield strength of the specimen.
The contribution of each phase to the flow stress increased with increasing strain because of the positive correlation between dislocation strengthening and strain, as shown in Figure 7. Compared with QP1.7Si, F contributed more to the strength of QP2.5Si, as shown by the green marks ( f F · σ F ) in Figure 7, due to QP2.5Si’s higher Si content. Si increased the volume fraction of F during intercritical annealing, and had higher solubility in F, which played a role in solid solution strengthening.
Martensite had the highest contribution to the strength of the samples (yellow area in Figure 7). When the true strain was increased to 0.11, the strength contributed by martensite in QP1.7Si and QP2.5Si reached 972 and 809 MPa, respectively, accounting for 74.8% and 59.3% of the flow stress, respectively. Martensite strengthening mainly relies on solid solution strengthening. The contribution of the DIM per unit volume fraction to strength is more significant than that of TM. For example, the volume fraction of DIM in QP2.5Si was 6.3% when the strain reached 0.11, and the contribution to strength was 276 MPa, about 20.2% of total stress. This can be related to the higher C content of DIM.
As DIM transformation continuously occurs during deformation, the contribution of initial RA to the strength can be considered as the sum of f RA · σ RA and f DIM · σ DIM (shaded area in Figure 7). The higher Si content of QP2.5Si increased the volume fraction of RA and the possibility of DIM transformation [16]. When the true strain was increased to 0.11, the initial RA’s contribution in QP2.5Si was 502 MPa, which was higher than that in QP1.7Si (358 MPa).
The FCC contribution in Figure 7 is the product of the FCC stress and volume fraction obtained by neutron diffraction. The experimental results showed that as the strain increased, the volume fraction of RA decreased due to DIM phase transformation, while the stresses borne by the remaining RA did not decrease. In agreement with the experimental results, the f RA · σ RA from the mechanical model did not significantly decrease. The maintained strength in RA is related to the enhancement of the grain boundary and dislocation strengthening with strain.
The model intuitively reflects the difference in the distribution of the corresponding forces caused by Si; however, some aspects that may introduce errors cannot be ignored. First, the model was built based on the iso-work constitutive relationship, which only considered the average size of each phase and did not take into account the multiphase feature and phase interface. According to our previous studies, the interphase deformation accommodation mechanism changes at different stages of deformation, which is not reflected in the model. Second, the diffusion of C was described using the experimental analysis, whereas the contents of the other alloying elements were simplified by equilibrium simulations. Third, we used the initial dislocation density parameters adopted from those reported in Ref. [13]. Different alloy components and QP processes may cause differences in the internal stress, which affects the evaluation of the dislocation density. Finally, uncertainties from various experiments were used to study the variation in the RA volume fraction with strain. In particular, compared with the quasi in situ EBSD, in situ neutron diffraction is a bulk measurement technique used to measure large quantities of grains to provide better averaged information to match macroscopic behaviors. Finally, a physical-based mechanical model was proposed and validated, to some extent, by neutron diffraction data. The results indicate that the elevated stress in the remaining RA, due to the interaction between grain refinement and dislocation multiplication, merits further study to clarify the contribution of the TRIP effect to the mechanical properties of AHSS.

5. Conclusions

Based on the analysis of the microstructure and strengthening mechanisms, a physical-based mechanical model considering grain refinement during phase transformation was proposed. This model describes the influence of the main microstructural and phase transformation mechanisms on the strength and strain hardening of intercritically annealed QP steels. The model was validated using intercritically annealed QP steels with different Si contents. The potential of adding Si to tune the microstructural characteristics and strengthening mechanisms was explored. The conclusions are as follows.
(1)
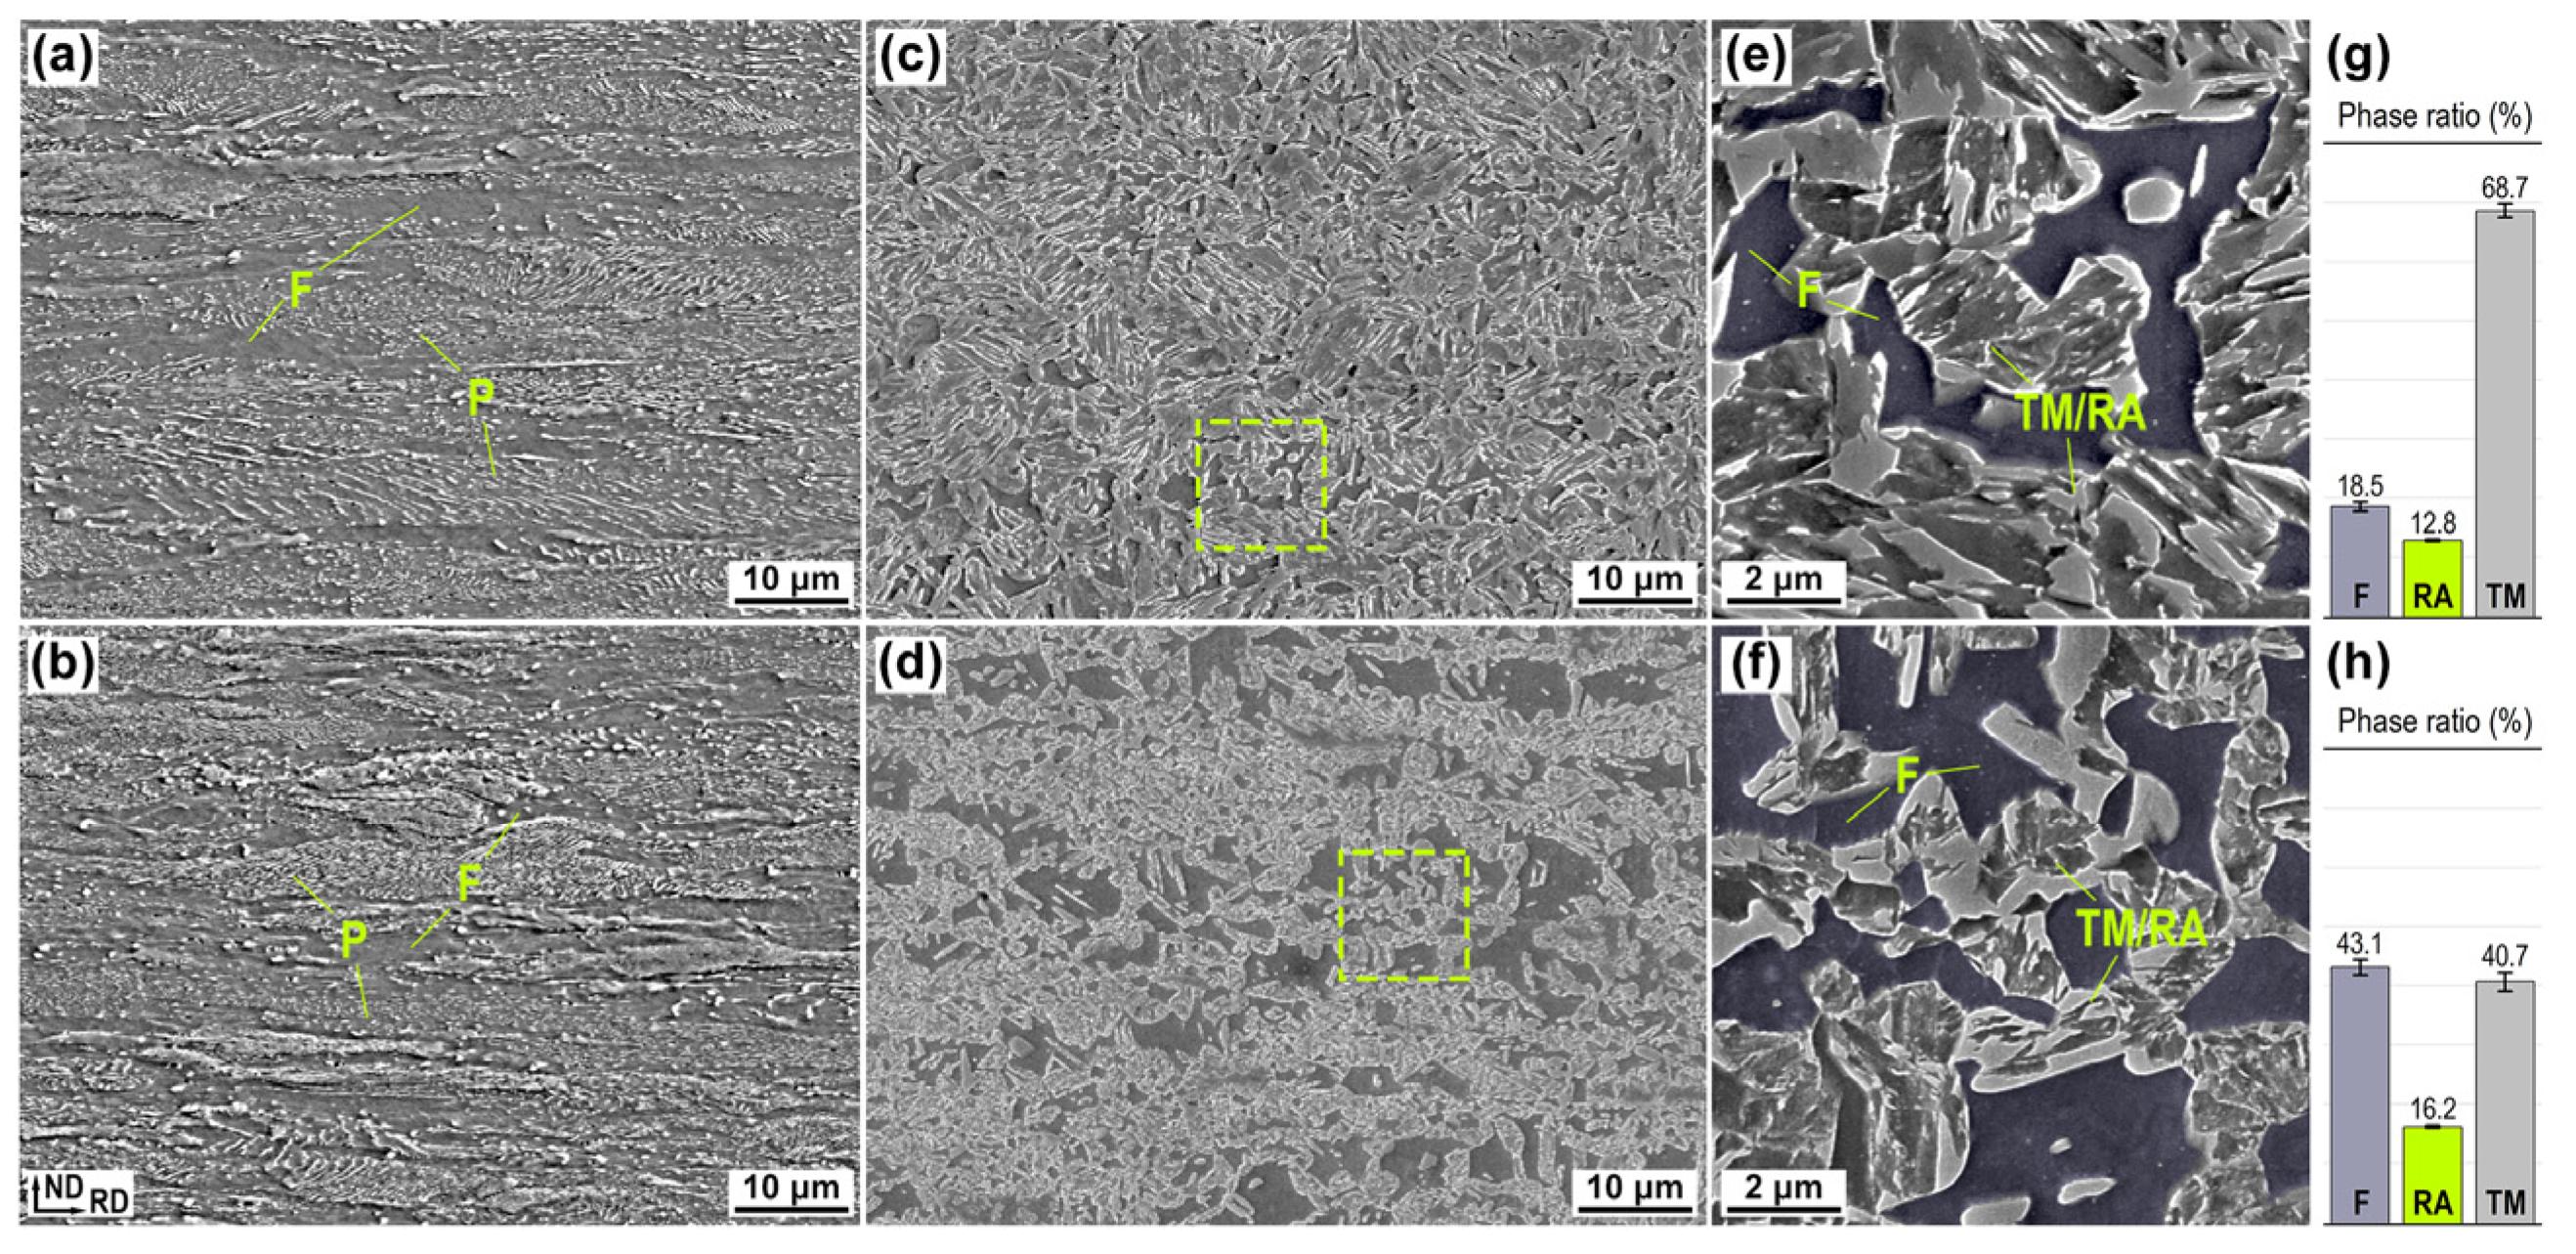
A mixed structure of F, martensite, and RA was observed in the intercritically annealed QP steel. As increasing Si content increases the intercritical temperature range, the ferrite volume fraction of QP2.5Si was significantly higher than that of QP1.7Si. Moreover, the volume fraction of RA in the Si-strengthened QP steel was higher (16.2%).
(2)
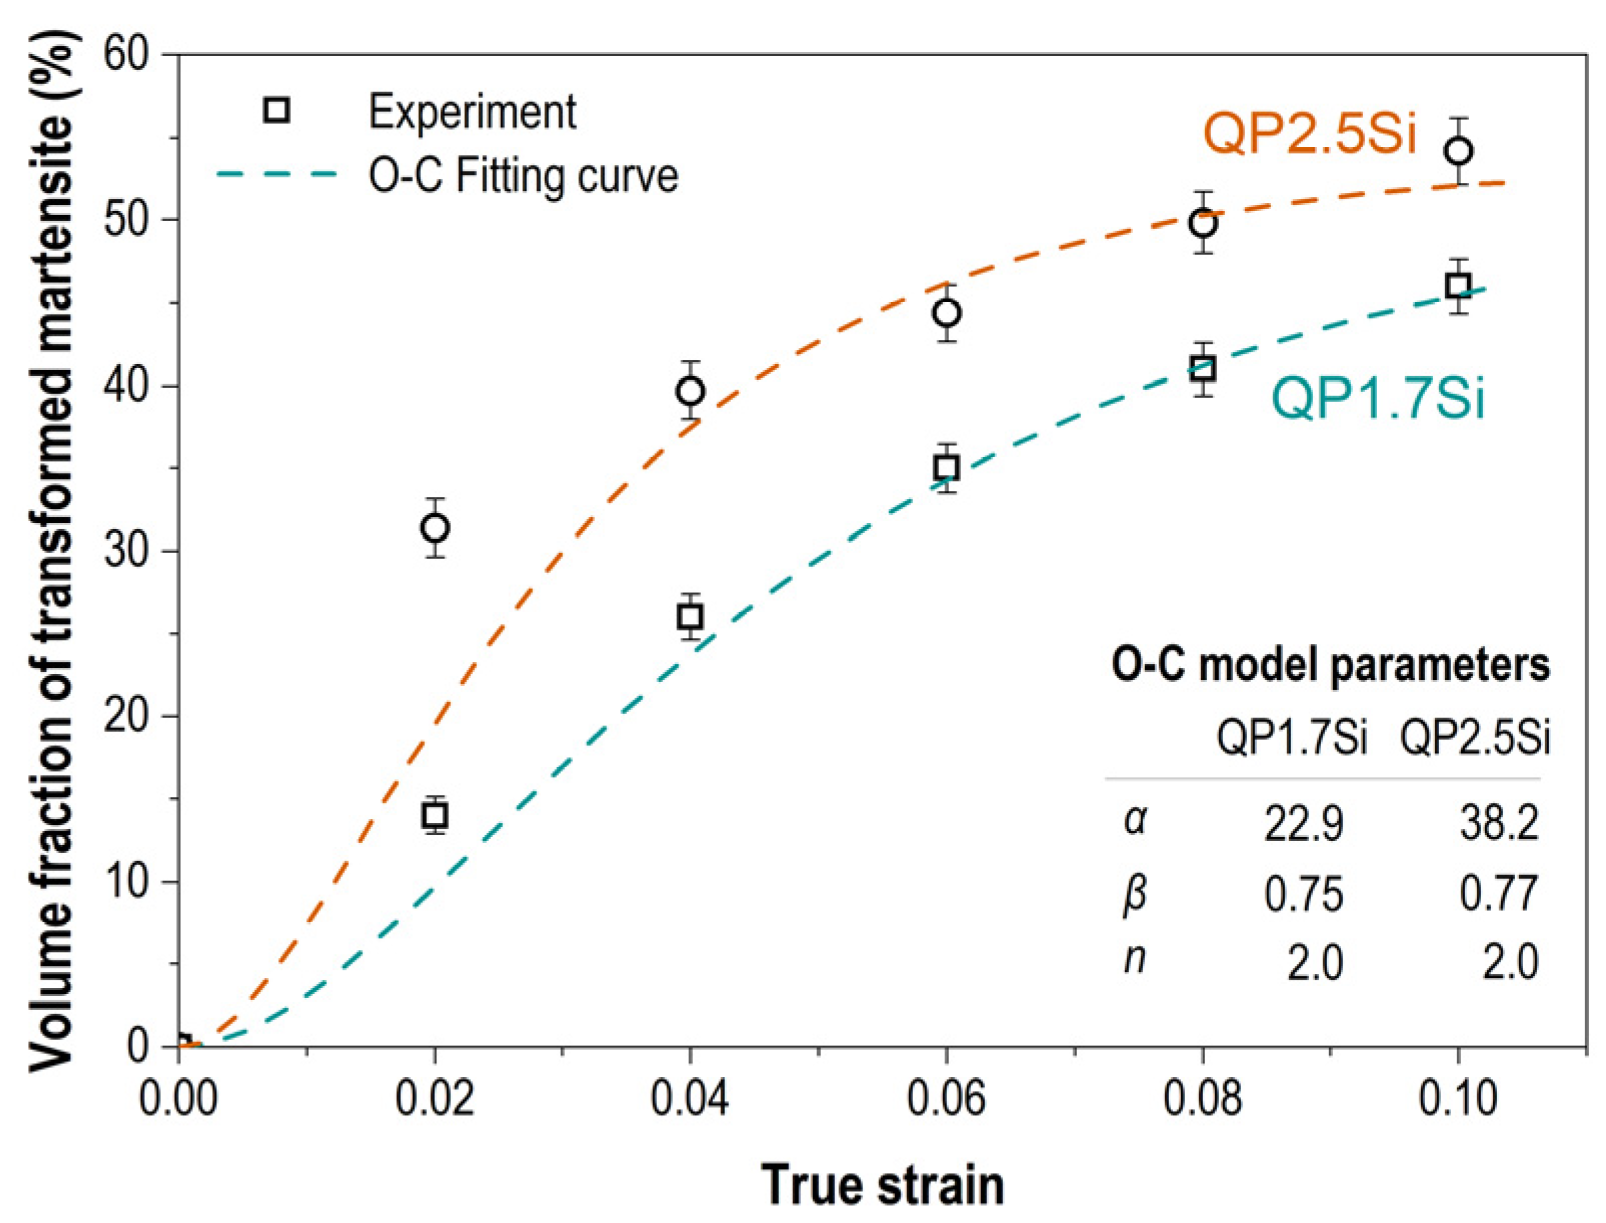
During the deformation process, QP2.5Si successively underwent stress-assisted and strain-induced DIM transformations. In the early stages of deformation, QP2.5Si exhibited lower RA stability and faster transformation kinetics. Consequently, a higher initial work-hardening rate was attained. The variations in the RA volume fraction with the deformation were fitted using a segmented exponential function.
(3)
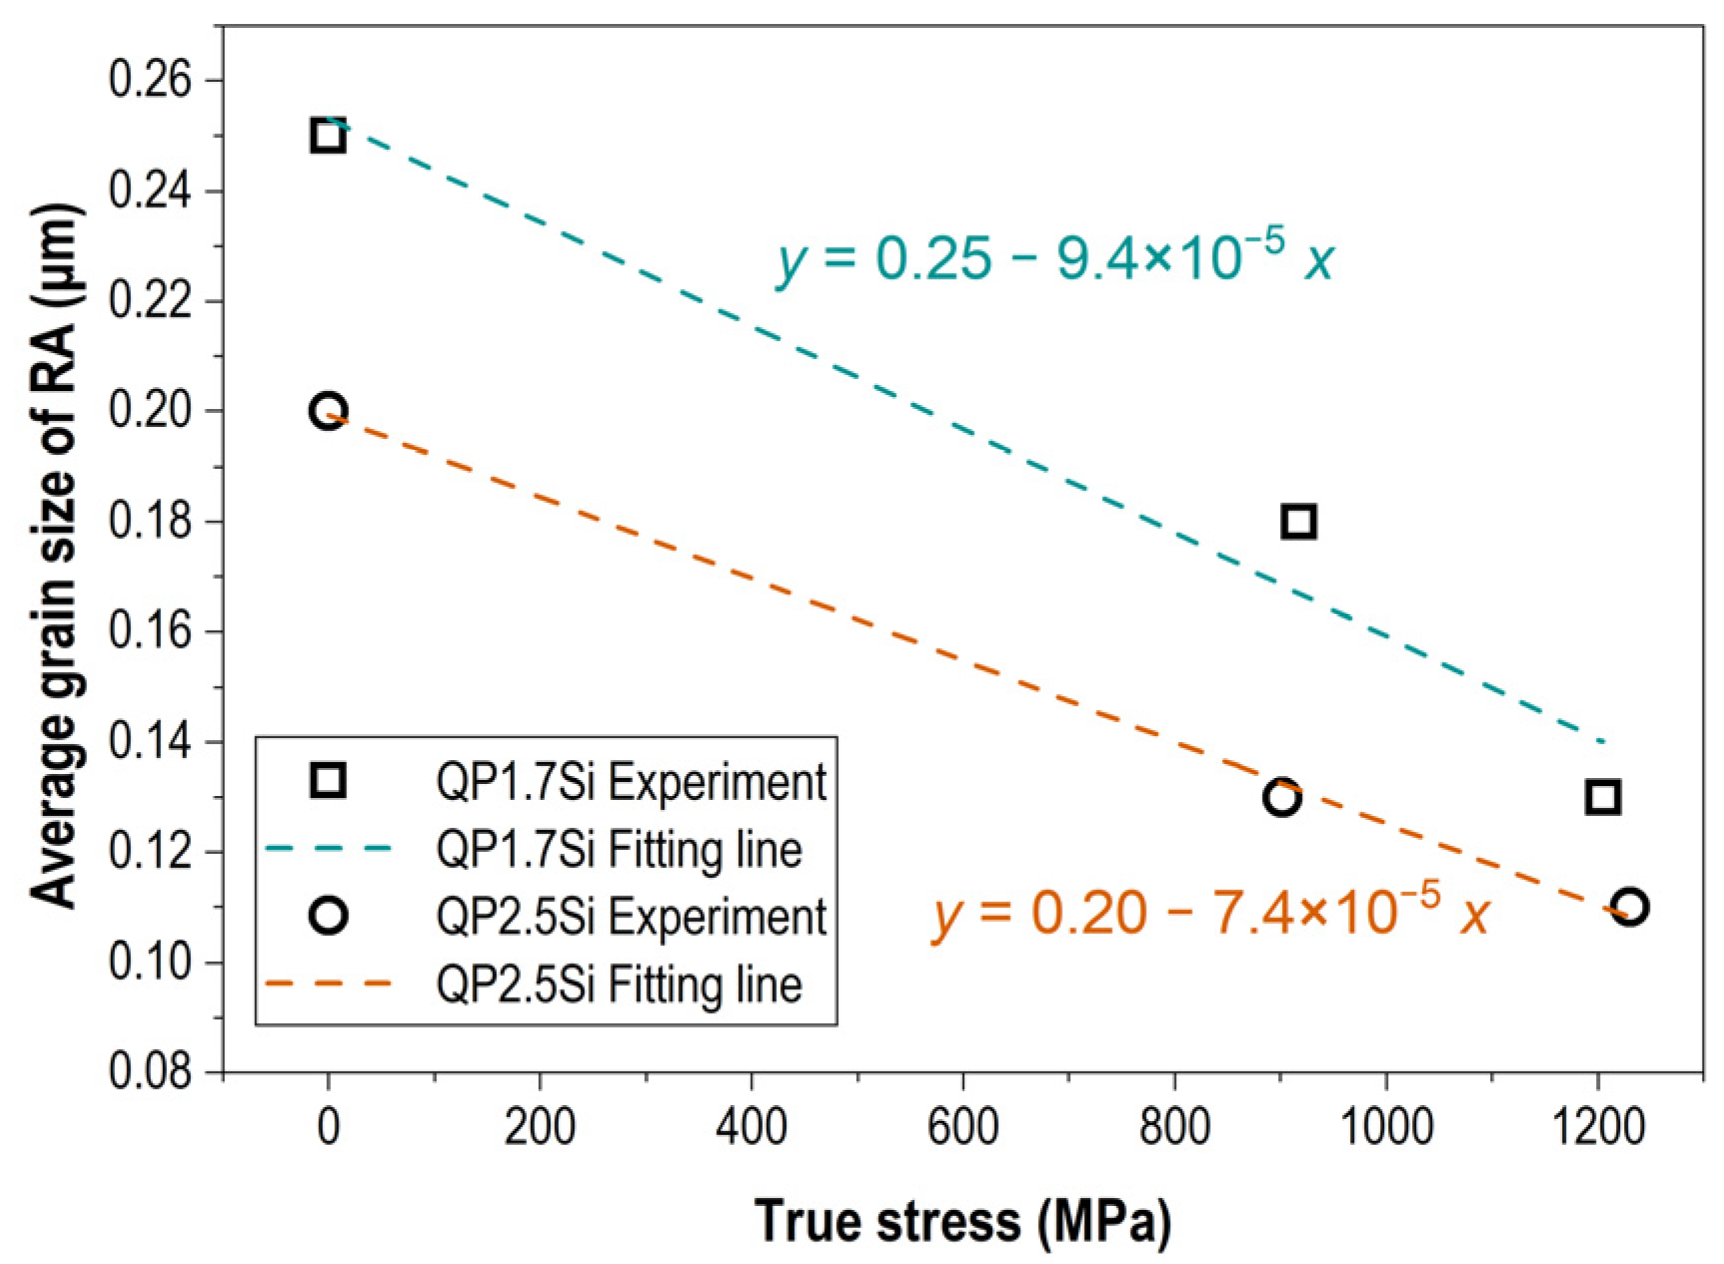
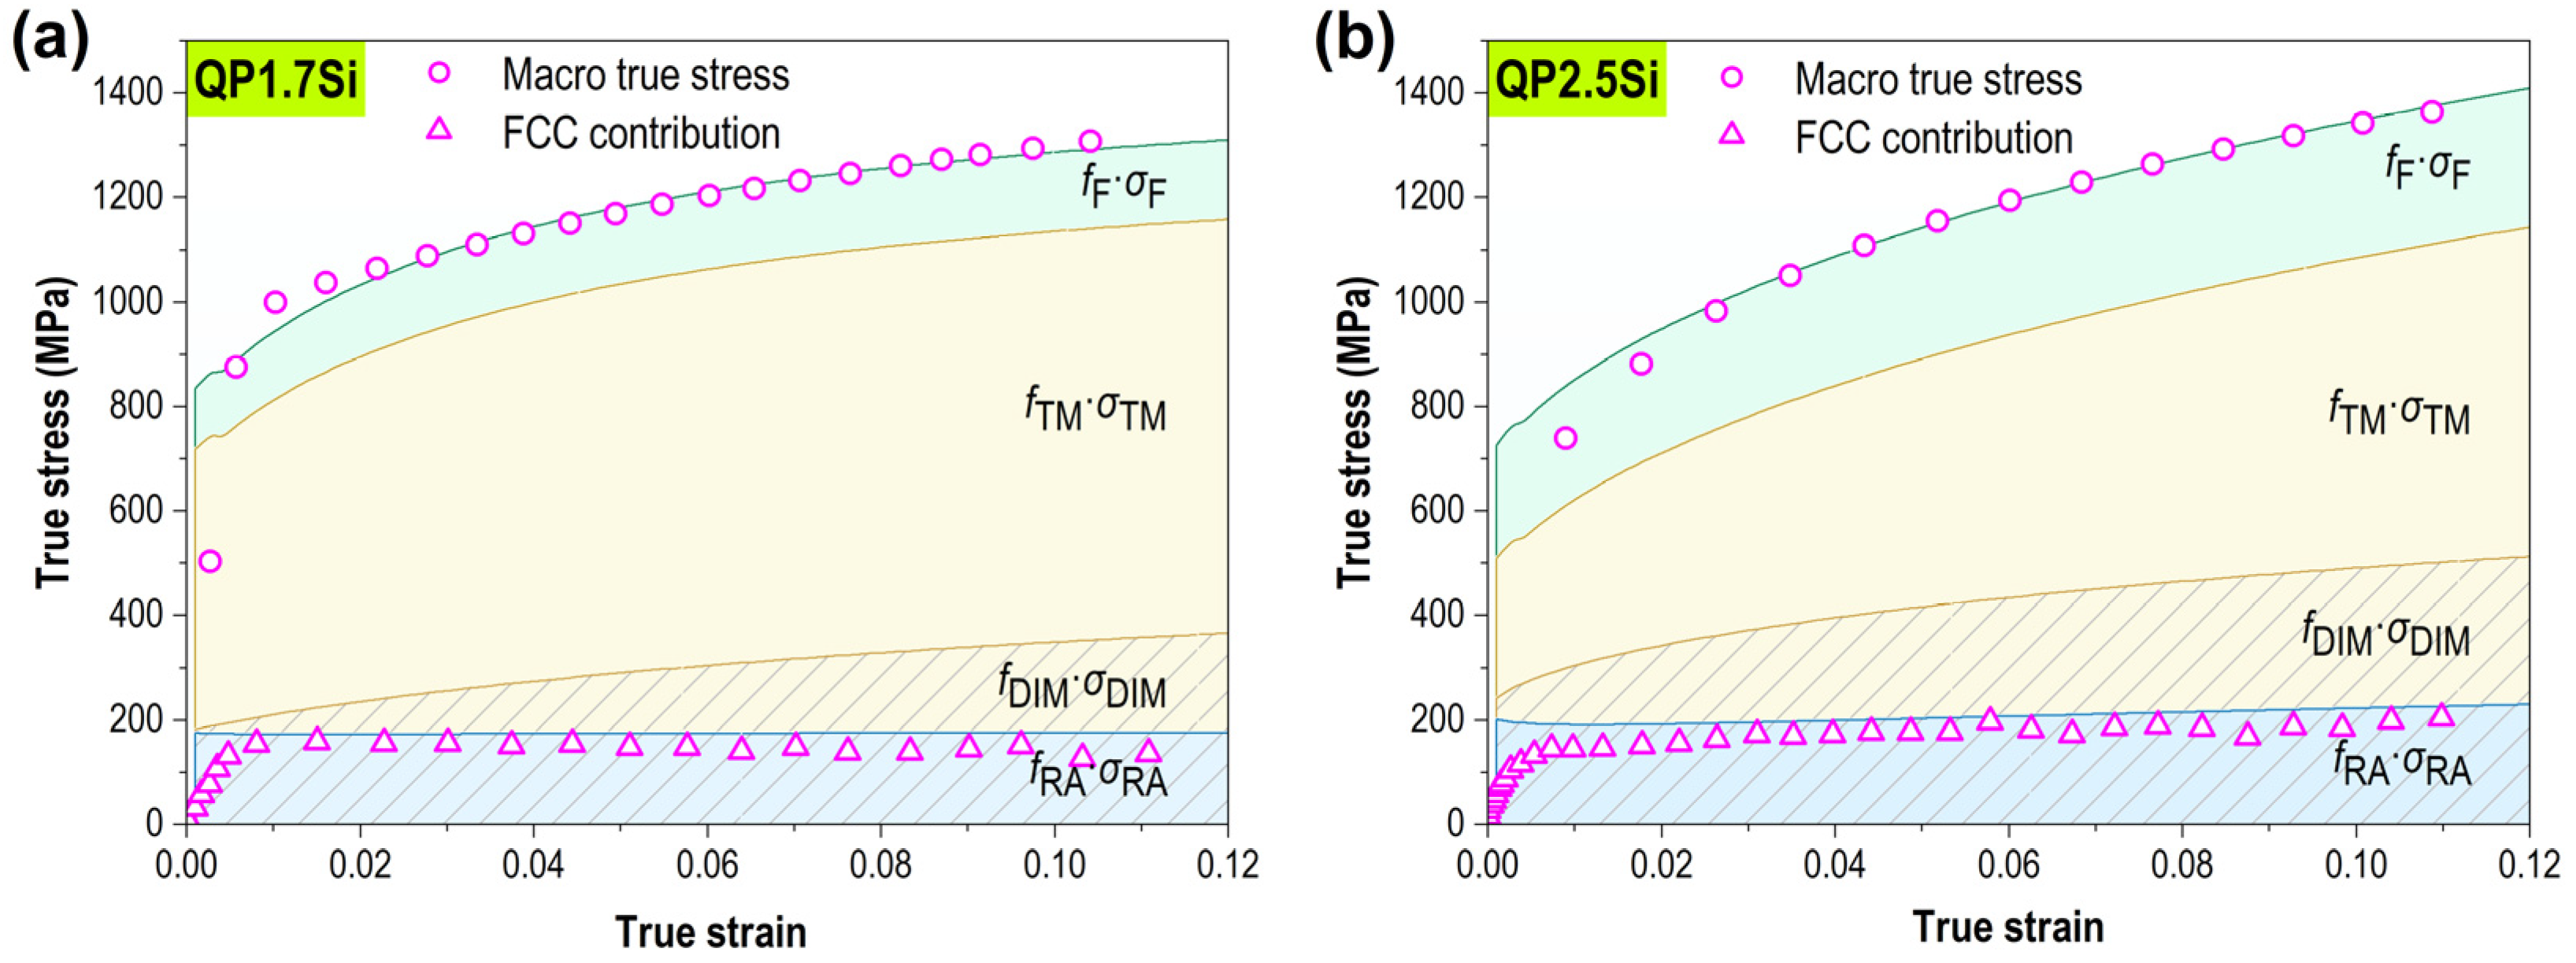
The tensile behavior of the intercritically annealed QP steels was interpreted using a microstructure-based model considering grain refinement during phase transformation. The model indicated that Si enhances the strengthening effect of the F phase. The contribution of RA to the strength was characterized by the sum of f DIM · σ DIM and f RA · σ RA . DIM exhibited a high work-hardening rate owing to the high solid-solution strengthening by C and the high dislocation density. Owing to an increase in the grain boundary and dislocation strengthening with strain, the residual RA after DIM transformation exhibited a non-negligible stress distribution.

Author Contributions

Conceptualization, P.G. and Z.Z.; data curation, F.L.; formal analysis, P.G. and F.L.; methodology, P.G., F.L., K.A. and Z.Z.; resources, K.A. and Z.Z.; software, P.G., F.L. and K.A.; supervision, K.A. and Z.Z.; validation, P.G. and F.L.; writing—original draft, P.G.; writing—review and editing, F.L., K.A. and Z.Z. All authors have read and agreed to the published version of the manuscript.

Funding

This research was funded by the fellowship of China Postdoctoral Science Foundation, grant number 2021M690347, and the Key Research and Development Plan of Shandong Province, grant number 2019TSLH0103.

Data Availability Statement

Not applicable.

Acknowledgments

This research used resource at Spallation Neutron Source, a DOE Office of Science User Facility operated by the Oak Ridge National Laboratory.

Conflicts of Interest

The authors declare no conflict of interest.

References

  1. Speer, J.; Matlock, D.K.; De Cooman, B.C.; Schroth, J.G. Carbon partitioning into austenite after martensite transformation. Acta Mater. 2003, 51, 2611–2622. [Google Scholar] [CrossRef]
  2. Speer, J.; Edmonds, D.V.; Rizzo, F.C.; Matlock, D.K. Partitioning of carbon from supersaturated plates of ferrite, with application to steel processing and fundamentals of the bainite transformation. Curr. Opin. Solid State Mater. Sci. 2004, 8, 219–237. [Google Scholar] [CrossRef]
  3. Bai, S.B.; Xiao, W.T.; Wang, Y.D.; Li, D.Z.; Zhuang, Z.H.; Zhang, W.G.; Liang, W. New observations of the twinning effect and austenite stability in intercritical quenched and tempered steel with high strength. J. Mater. Sci. 2021, 56, 13801–13813. [Google Scholar] [CrossRef]
  4. Lin, G.; Lan, H.; Du, L. Modelling and experimental validation of austenite growth from As-quenched martensite during intercritical annealing of a medium-Mn steel. J. Mater. Sci. 2021, 56, 19165–19179. [Google Scholar] [CrossRef]
  5. Gao, P.F.; Chen, W.J.; Li, F.; Ning, B.J.; Zhao, Z.Z. Quasi-situ characterization of deformation in low-carbon steel with equiaxed and lamellar microstructure treated by the quenching and partitioning process. Acta Metall. Sin. (Engl. Lett.) 2020, 33, 1657–1665. [Google Scholar] [CrossRef]
  6. Gao, P.F.; Chen, W.J.; Li, F.; Ning, B.J.; Zhao, Z.Z. New crystallography insights of retained austenite transformation in an intercritical annealed quenching and partitioning steel. Mater. Lett. 2020, 273, 127955. [Google Scholar] [CrossRef]
  7. Jafari, R.; Kheirandish, S.; Mirdamadi, S. Effects of partitioning parameters in quenching and partitioning on microstructure and mechanical properties of an ultra-high strength low-alloy steel. Materialwiss. Werkstofftech. 2018, 49, 1381–1391. [Google Scholar] [CrossRef]
  8. Zhu, K.Y.; Mager, C.; Huang, M.X. Effect of substitution of Si by Al on the microstructure and mechanical properties of bainitic transformation-induced plasticity steels. J. Mater. Sci. Technol. 2017, 33, 1475–1486. [Google Scholar] [CrossRef]
  9. Nayak, S.S.; Anumolu, R.; Misra, R.D.K.; Kim, K.H.; Lee, D.L. Microstructure–hardness relationship in quenched and partitioned medium-carbon and high-carbon steels containing silicon. Mater. Sci. Eng. A 2008, 498, 442–456. [Google Scholar] [CrossRef]
  10. Kozeschnik, E.; Bhadeshia, H.K.D.H. Influence of silicon on cementite precipitation in steels. Mater. Sci. Technol. 2008, 24, 343–347. [Google Scholar] [CrossRef]
  11. Mecking, H.; Kocks, U.F. Kinetics of flow and strain-hardening. Acta Metall. 1981, 29, 1865–1875. [Google Scholar] [CrossRef]
  12. Bouaziz, O.; Guelton, N. Modelling of TWIP effect on work-hardening. Mater. Sci. Eng. A 2001, 319–321, 246–249. [Google Scholar] [CrossRef]
  13. Seo, E.J.; Cho, L.; Estrin, Y.; De Cooman, B.C. Microstructure-mechanical properties relationships for quenching and partitioning (Q&P) processed steel. Acta Mater. 2016, 113, 124–139. [Google Scholar] [CrossRef]
  14. Gao, G.H.; Gao, B.; Gui, X.L.; Hu, J.; He, J.Z.; Tan, Z.L.; Bai, B.Z. Correlation between microstructure and yield strength of as-quenched and Q&P steels with different carbon content (0.06–0.42 wt%C). Mater. Sci. Eng. A 2019, 753, 1–10. [Google Scholar] [CrossRef]
  15. Hu, B.; Rong, X.Q.; Tian, C.; Yu, Y.S.; Guo, H.; Misra, R.D.K.; Shang, C.J. Nanoscale precipitation and ultrafine retained austenite induced high strength-ductility combination in a newly designed low carbon Cu-bearing medium-Mn steel. Mater. Sci. Eng. A 2021, 822, 141685. [Google Scholar] [CrossRef]
  16. Gao, P.F.; Li, F.; An, K.; Zhao, Z.Z.; Chu, X.H.; Cui, H. Microstructure and deformation mechanism of Si-strengthened intercritically annealed quenching and partitioning steels. Mater. Charact. 2022, 191, 112145. [Google Scholar] [CrossRef]
  17. Gao, P.F.; Liang, J.H.; Chen, W.J.; Li, F.; Zhao, Z.Z. Prediction and evaluation of optimum quenching temperature and microstructure in a 1300 MPa ultra-high-strength Q&P steel. J. Iron Steel Res. Int. 2021, 29, 307–315. [Google Scholar] [CrossRef]
  18. An, K.; Skorpenske, H.D.; Stoica, A.D.; Ma, D.; Wang, X.L.; Cakmak, E. First in situ lattice strains measurements under load at VULCAN. Metall. Mater. Trans. A 2011, 42, 95–99. [Google Scholar] [CrossRef]
  19. An, K.; Chen, Y.; Stoica, A.D. VULCAN: A “hammer” for high-temperature materials research. MRS Bull. 2019, 44, 878–885. [Google Scholar] [CrossRef]
  20. An, K. VDRIVE- Data Reduction and Interactive Visualization Software for Event Mode Neutron Diffraction; Oak Ridge National Laboratory: Tennessee, TN, USA, 2012; pp. 11–23.
  21. Yu, D.; Huang, L.; Chen, Y.; Komolwit, P.; An, K. Real-time in situ neutron diffraction investigation of phase-specific load sharing in a cold-rolled trip sheet steel. JOM 2018, 70, 1576–1586. [Google Scholar] [CrossRef]
  22. Muránsky, O.; Šittner, P.; Zrník, J.; Oliver, E.C. In situ neutron diffraction investigation of the collaborative deformation–transformation mechanism in TRIP-assisted steels at room and elevated temperatures. Acta Mater. 2008, 56, 3367–3379. [Google Scholar] [CrossRef]
  23. Wu, Y.; Ma, D.; Li, Q.K.; Stoica, A.D.; Song, W.L.; Wang, H.; Liu, X.J.; Stoica, G.M.; Wang, G.Y.; An, K.; et al. Transformation-induced plasticity in bulk metallic glass composites evidenced by in-situ neutron diffraction. Acta Mater. 2017, 124, 478–488. [Google Scholar] [CrossRef] [Green Version]
  24. De Knijf, D.; Petrov, R.; Föjer, C.; Kestens, L.A.I. Effect of fresh martensite on the stability of retained austenite in quenching and partitioning steel. Mater. Sci. Eng. A 2014, 615, 107–115. [Google Scholar] [CrossRef]
  25. Olson, G.B.; Cohen, M. A mechanism for the strain-induced nucleation of martensitic transformations. J. Less-Common Met. 1972, 28, 107–118. [Google Scholar] [CrossRef]
  26. Maxwell, P.C.; Goldberg, A.; Shyne, J.C. Stress-assisted and strain-induced martensites in Fe-Ni-C alloys. Metall. Mater. Trans. B 1974, 5, 1305–1318. [Google Scholar] [CrossRef]
  27. Olson, G.B.; Azrin, M. Transformation behavior of TRIP steels. Metall. Trans. A 1978, 9, 713–721. [Google Scholar] [CrossRef]
  28. Bolling, G.F.; Richman, R.H. The plastic deformation-transformation of paramagnetic f.c.c. Fe–Ni–C alloys. Acta Metall. 1970, 18, 673–681. [Google Scholar] [CrossRef]
  29. Shin, H.C.; Ha, T.K.; Chang, Y.W. Kinetics of deformation-induced martensitic transformation in a 304 stainless steel. Scr. Mater. 2001, 45, 823–829. [Google Scholar] [CrossRef]
  30. Yan, S.; Liu, X.; Liang, T.; Zhao, Y. The effects of the initial microstructure on microstructural evolution, mechanical properties and reversed austenite stability of intercritically annealed Fe-6.1 Mn-1.5 Si-0.12 C steel. Mater. Sci. Eng. A 2018, 712, 332–340. [Google Scholar] [CrossRef]
  31. Olson, G.B.; Cohen, M. Kinetics of nucleation strain-induced martensitic. Metall. Mater. Trans. A 1975, 6, 791–795. [Google Scholar] [CrossRef]
  32. Bouaziz, O.; Buessler, P. Iso-work increment assumption for heterogeneous material behaviour modelling. Adv. Eng. Mater. 2004, 6, 79–83. [Google Scholar] [CrossRef]
  33. Bouaziz, O.; Buessler, P. Mechanical behavior of multiphase materials: An intermediate mixture law without fitting parameter. Metall. Res. Technol. 2002, 99, 71–77. [Google Scholar] [CrossRef]
  34. Van Dijk, N.H.; Butt, A.M.; Zhao, L.; Sietsma, J.; Offerman, S.E.; Wright, J.P.; Van der Zwaag, S. Thermal stability of retained austenite in TRIP steels studied by synchrotron X-ray diffraction during cooling. Acta Mater. 2005, 53, 5439–5447. [Google Scholar] [CrossRef]
  35. Eliasson, J.; Sandström, R. Proof strength values for austenitic stainless steels at elevated temperatures. Steel Res. 2000, 71, 249–254. [Google Scholar] [CrossRef]
  36. Rodriguez, R.; Gutiérrez, I. Unified formulation to predict the tensile curves of steels with different microstructures. Mater. Sci. Forum 2003, 426, 4525–4530. [Google Scholar] [CrossRef]
  37. Rodriguez, F.J.; Boccardo, A.D.; Dardati, P.M.; Celentano, D.J.; Godoy, L.A. Thermal expansion of a spheroidal graphite iron: A micromechanical approach. Finite. Elem. Anal. Des. 2018, 141, 26–36. [Google Scholar] [CrossRef]
  38. Hall, E.O. The deformation and ageing of mild steel: III Discussion of results. Proc. Phys. Soc. London Sect. B 1951, 64, 747–753. [Google Scholar] [CrossRef]
  39. Bailey, J.E.; Hirsch, P.B. The dislocation distribution, flow stress, and stored energy in cold-worked polycrystalline silver. Philos. Mag. 1960, 53, 485–497. [Google Scholar] [CrossRef]
  40. Lee, S.J.; Lee, S.; De Cooman, B.C. Martensite transformation of sub-micron retained austenite in ultra-fine grained manganese transformation-induced plasticity steel. Int. J. Mater. Res. 2013, 104, 423–429. [Google Scholar] [CrossRef]
  41. Li, F.; Gao, P.F.; Chen, Y.; Li, C.; Shang, X.L.; Wan, P.; Chen, W.J.; Kang, T.; Zhao, Z.Z.; An, K. In-situ neutron diffraction investigation of two-stage martensitic transformation in a 13%Mn steel with serrated deformation. Mater. Sci. Eng. A 2022, 840, 142955. [Google Scholar] [CrossRef]
Figure 1. Microstructure and phase ratio of the investigated steels. The initial microstructures prior to QP processing of (a) QP1.7Si and (b) QP2.5Si. Microstructures after QP processing of (c) QP1.7Si and (d) QP2.5Si; (e,f) show the microstructure details within the dashed box in (c,d), respectively. Phase ratio of (g) QP1.7Si and (h) QP2.5Si. F, P, TM, and RA denote ferrite, pearlite, tempered martensite, and retained austenite, respectively. Ferrite grains are superimposed in purple. ND and RD denote the normal direction and rolling direction, respectively.
Crystals 12 01412 g001
Figure 2. Variations in the RA volume fraction with deformation. (a,c) Neutron diffraction patterns of QP1.7Si and QP2.5Si at specific strains during the in situ loading. (b,d) Volume fraction of RA as a function of the true strain in QP1.7Si and QP2.5Si.
Crystals 12 01412 g002
Figure 3. Deformation-induced martensite transformation kinetics fitted using the Olson–Cohen model.
Crystals 12 01412 g003
Figure 4. Calculated temperature dependence of the C, Si, and Mn content in FCC and BCC from Thermo-Calc software. (a) QP1.7Si; (b) QP2.5Si.
Crystals 12 01412 g004
Figure 5. Relationship between the average grain size of RA with the true stress.
Crystals 12 01412 g005
Figure 6. Phase-specific stress–strain behaviors obtained using in situ neutron diffraction. (a) QP1.7Si; (b) QP2.5Si.
Crystals 12 01412 g006
Figure 7. Stress distribution in each constituent phase obtained by neutron diffraction and model fitting. (a) QP1.7Si; (b) QP2.5Si. The FCC contribution is the product of the FCC stress and volume fraction obtained by neutron diffraction. RA, F, TM, and DIM denote the retained austenite, ferrite, tempered martensite, and deformation-induced martensite, respectively.
Crystals 12 01412 g007
Table 1. Alloy concentrations in each phase (wt.%).
QP1.7Si QP2.5Si
CSiMnCSiMn
F0.011.941.430.012.781.59
TM0.101.672.880.102.373.12
RA1.011.672.880.952.373.12
DIM1.011.672.880.952.373.12
Table 2. Parameters for constructing constitutive relationships.
Sample j K j
( MPa mm 1 / 2 )
d j , 0
(μm)
Λ j , 0
(μm)
α j M j G j
(GPa)
b j
(nm)
QP1.7SiRA9.490.250.250.353.06720.25
F152.212.210.382.75660.248
TM--0.300.382.7581.60.248
DIM--0.300.382.7581.60.248
QP2.5SiRA9.490.200.200.353.06720.25
F152.392.390.382.75660.248
TM--0.300.382.7581.60.248
DIM--0.300.382.7581.60.248
Publisher’s Note: MDPI stays neutral with regard to jurisdictional claims in published maps and institutional affiliations.

