Article

Detail Analysis for Energy Transfer and Pigment Assembling in C−Phycocyanin through Time−Resolved Spectroscopy and AlphaFold2

School of Physics, State Key Laboratory of Optoelectronic Materials and Technologies, Sun Yat-sen University, Guangzhou 510275, China
*
Authors to whom correspondence should be addressed.
These authors contributed equally to this work.
Crystals 2022, 12(11), 1595; https://doi.org/10.3390/cryst12111595
Submission received: 4 October 2022 / Revised: 4 November 2022 / Accepted: 7 November 2022 / Published: 9 November 2022

Abstract

:
The time-resolved fluorescence spectroscopy of the C−phycocyanin (C−PC) complex from the cyanobacterium Spirulina platensis (S. platensis) hexamer with the sub-picosecond resolution was detected, and the energy transfer pathways and related transfer rates were identified through the multiexponential analysis based on Monte-Carlo method. With the purpose to construct the relationship between the functions and the structure in vivo, the three−dimension (3D) protein structure was predicted via AlphaFold2, and the arrangement of chromophores treated as the energy transfer nodes were obtained. The experiment results have been matched well with the structure prediction. This work suggests a new way to investigate structure prediction in vivo and the corresponding functions.

1. Introduction

As the most important chemical reaction on earth, photosynthesis allows photosynthetic organisms including plants, algae, cyanobacteria and photosynthetic bacteria to capture and transfer the light’s energy into chemical energy [1]. Among these photosynthetic organisms, algae represent is regarded as the intermediate stage in the evolution from photosynthetic bacteria in the ocean to green plants on the land. In algae, the function of light harvesting is fulfilled by the pigment−protein complex called phycobiliproteins (PBPs), including phycocyanin (PC), phycoerythrin (PE) and allophycocyanin (APC) [2,3]. Experimental results show that different PBPs may contain different kinds of chromophores and the chromophores are classified by structure as phycoerythrobilin (PEB), phycocyanobilin (PCB), phycoviolobilin (PVB) and phycourobilin (PUB) [4,5].
In the antenna system, it was clear that energy is transferred in and between the phycobiliproteins at an extremely fast speed, which occurs with a remarkably high conversion efficiency of 90% or higher. The efficient energy transfer process is closely related to the unique structure of PBPs. The early results from the absorption and emission spectra of PBPs indicate that the direction of excitation energy transfer is usually from the short−wavelength band to the long-wavelength band in the antenna system [6]. Corresponding to the structure, energy is transferred from the phycoerythrin, to the phycocyanin, the allophycocyanin, and reaches the reaction centre in sequence [7,8,9,10,11]. However, if one ever wants to mimic the natural process of light−harvesting in an artificial system, it is not enough to know the general direction of energy transfer, the key elements of the process should be fully understood in the view of physics, chemistry and biology. It is also necessary to understand the precise structure to identify the specific path of energy transfer. Commonly, the assignment of energy transfer paths relies on hyperfine protein structures obtained by X−ray crystallography or Cryo−EM and time-domain sequential fluorescence events obtained by time-resolved spectroscopy [12,13]. Techniques such as Cryo−EM and crystallization have accumulated enough key structural information for protein structure. In addition, with the development of computation-based protein structure prediction technology, using more rapid and informative means to efficiently predict protein in vivo may provide more detailed and realistic information for the study of the efficient energy transfer mechanism.
Recent advances in deep learning, combined with the availability of genomic data for inferring co−evolutionary patterns enlightening a new way for protein structure determination to complete the longstanding physics−based approaches. The outstanding performance of AlphaFold2 demonstrates the remarkable power of deep learning in protein structure prediction, which can provide a structural basis for understanding the energy transfer dynamics in PBPs [14]. C−PC is a typical phycobiliprotein in cyanobacteria that thrives around hot springs, with three PCB chromophores attached through thioester linkages at the α84, β84 and β155 positions. Previous research has discovered the energy transfer dynamics among the three PCB chromophores in C−phycocyanin, via theory calculation based on the Förster resonance mechanism and experimental measurement using ultra−fast spectroscopy technology [15,16,17,18,19,20,21,22]. To explore the accuracy and applicability of the AlphaFold2 calculation results in the energy transfer process, we selected the C−PC as the experimental sample.
In order to achieve our research, we first selected a C−PC hexamer from S. platensis to investigate the structure-based energy transfer mechanism. Secondly, AlphaFold2 was applied to simulate the 3D protein structure of the C−PC complex for predicting the plausible structure basis energy transfer routes among the chromophores. Thirdly, sub-picosecond time-resolved fluorescence spectra were detected for obtaining the overall direct experimental evidence for energy transfer routes in the C−PC hexamer. Finally, the energy transfer kinetics between different chromophores were analysed by comparing the structural prediction results and deconvolution of time-resolved fluorescence spectra. Therefore, we obtained the meaningful energy transfer kinetics between different chromophores in C−phycocyanin in the view of the microscopic mechanism of the original process of photosynthesis and found that it may be instructive to design and construct the semi-artificial and artificial solar-energy systems modelled on the photosynthetic processes utilized by photosynthetic organisms at nearly 100−percent efficiency of light harvesting.

2. Materials and Methods

2.1. Growth of Red Algae and Isolation of PBSs

Spirulina platensis was selected as the experiment material and cultured at 30 °C under constant low light illumination (40 W white fluorescent tubes, 16 h light and 8 h dark as the ideal photoperiod) in Zarrouk medium. Contamination of the medium was inhibited by high-pressure steam sterilization and the air supply with 0.22 μm paper filters. Spirulina platensis was harvested by centrifugation after 2 weeks.
C-PC hexamer from S. platensis was prepared according to the methods described in our previous studies [23,24]. The harvested algae were added to pH 7.0, 0.002 mol/L phosphate buffer (containing 0.004 mol/L sodium azide) at a ratio of 1:15, stirred well, put into liquid nitrogen to completely frozen, then thawed at 4°, repeated 3 times, centrifuged at 20,000 r/min, 4° for 10 min, and the supernatant was taken out. To the upper (NH4)2SO4, a final concentration of 1.25 mo/L was added to the upper layer of the clear solution, mixed well, left to stand at 4° for 12 h, centrifuged and the upper layer of the clear solution was taken. The supernatant is the crude extract of PC. The Macro−Prep Methyl hydrophobic column was equilibrated with the above phosphate buffer, and then the crude extract was loaded onto the column and eluted with a gradient of 1.25, 0.9, 0.5, and 0.2 mol of (NH4)2SO4 phosphate buffer, respectively, and the eluate with a purity (A620/A230) greater than 4.0 was collected and concentrated by desalting with a 30 kD ultrafiltration tube and then stored at 4 °C.

2.2. Determination and Analysis of Time-Resolved Spectra

Time-resolved fluorescence spectra (TRFS) were measured at 77 K by a synchroscan streak camera (Hamamatsu C6860, time−resolution 700 fs) coupled to a polychromator. The silica cuvette containing samples was placed in liquid nitrogen and frozen in the dark. The applied Ti: sapphire laser was selected as the excitation at the wavelength was 570 nm. Spectral data were extracted with a 0.2 nm interval, and TRFS were reconstructed afterwards. Fluorescence delay-associated spectra (FDAS) were calculated based on a global optimization method [25]. The overall time resolution was less than 2 ps. All the decays were re−analysed using the same lifetime parameters. The amplitudes of these exponential components as a function of emission wavelength provided FDAS [26]. In the process of deconvolving the fluorescence spectrum detected by the streak camera, the detected fluorescence intensity F e x p can be described as follows:
F e x p t = f p u m p F t h e o = f p u m p t F t h e o t t d t
where f p u m p represents the pump laser pulse. Here we considered the theoretical fluorescence intensity F t h e o as a sum of multi-exponential form:
F t h e o t = ε i e x p t τ i
We applied a deconvolution procedure based on the global optimization method described as follows to fit the isotropic fluorescence. Letter A denotes the amplitude of the fluorescence isotropic decay constant of ε i .
I n λ , t = i = 1 n A i λ i e x p t τ i

2.3. Protein Structure Prediction of C−PC Complex Based on AlphaFold2

Two different subunits form the monomer of C−PC, which serves as the basic unit for the PBP assembly. The amino acid sequence of the two types of C−PC subunits from S. platensis has been obtained (Protein Data Bank in Europe No. p72509 and p72508, Protein ID: 1gh0). The structure of the C−PC complex was predicted with the latest 2.1 version of AlphaFold2. AlphaFold2 runs on the supercomputing cluster provided by the Beikun cloud supercomputing platform with hardware support of 8 vCPUs, 64G of memory and two V100 graphics cards. In addition, since the model does not contain phycobilin pigments, it is necessary to use the molecular docking software, Autodock, to attach the pigments to the protein model [27,28]. MD analysis and NumPy Python packages were applied for the calculation of the mean pLDDT value of each residue extracted from the B-factor column of AlphaFold2 structure files. Molecular visualization and RMSD calculation were performed using PyMOL(The PyMol Molecular Graphics System, Version 2.4.0, Schrödinger Inc, New York, USA) [29].

3. Results

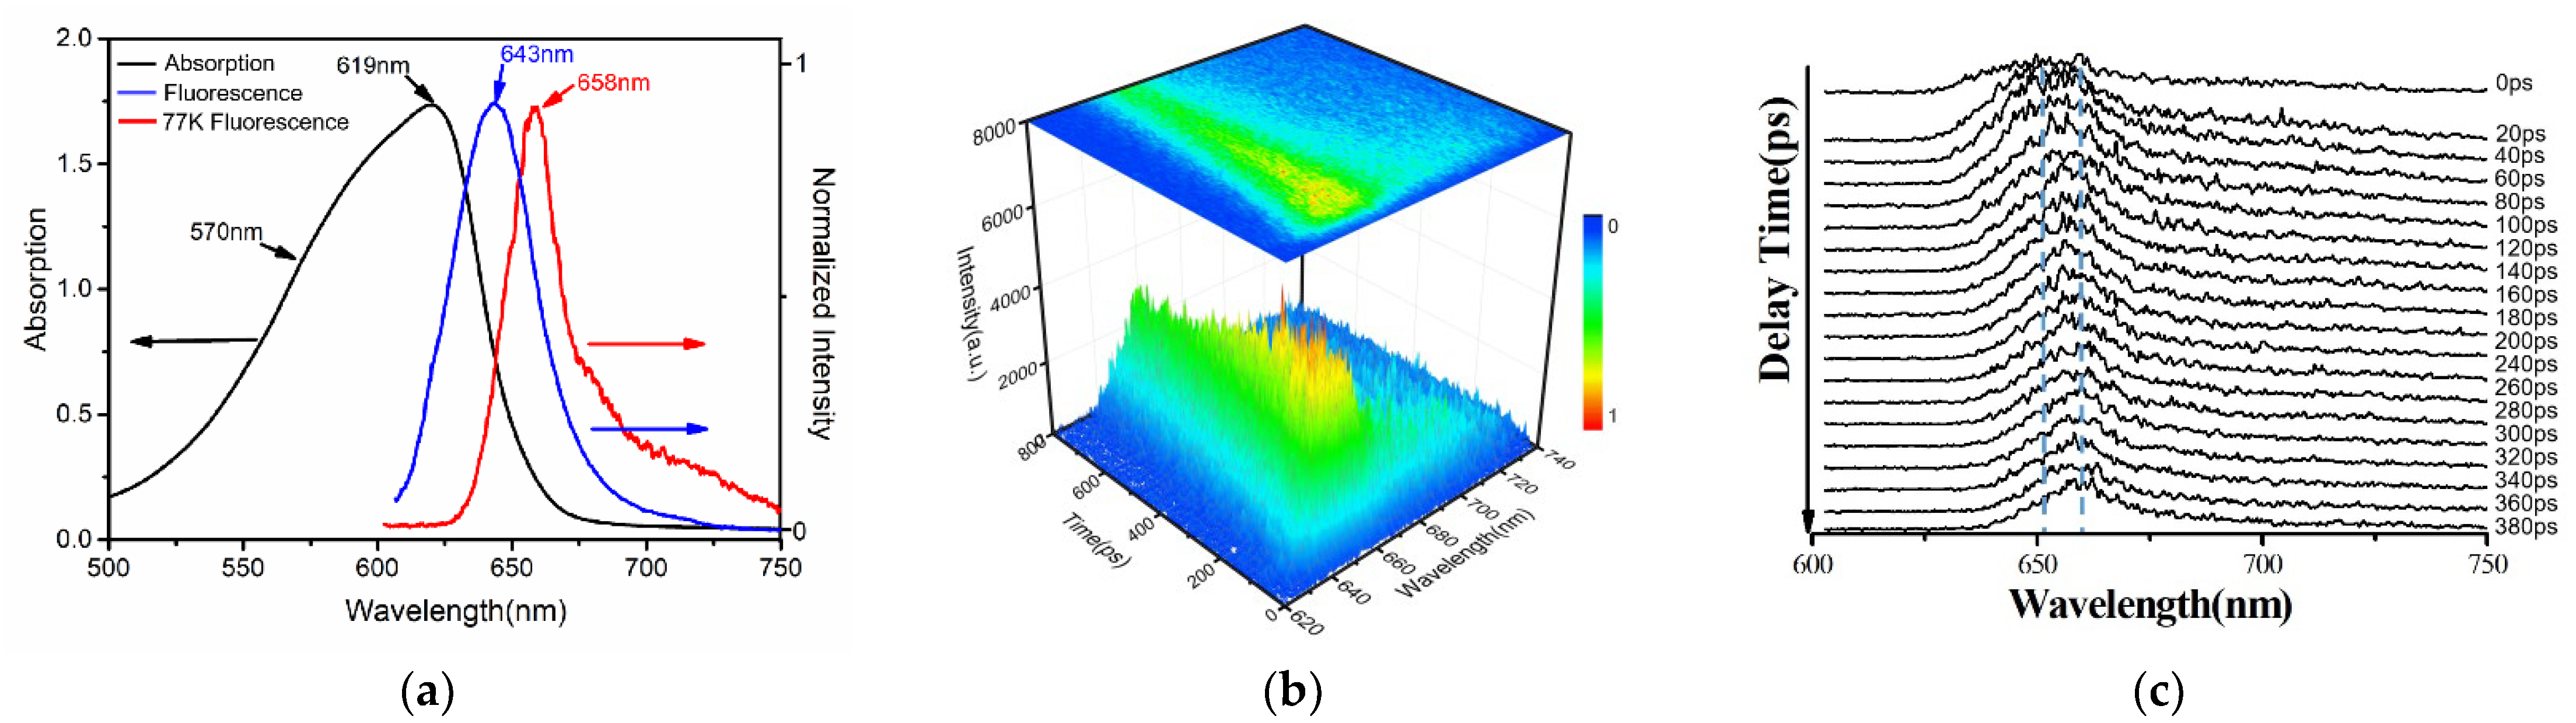
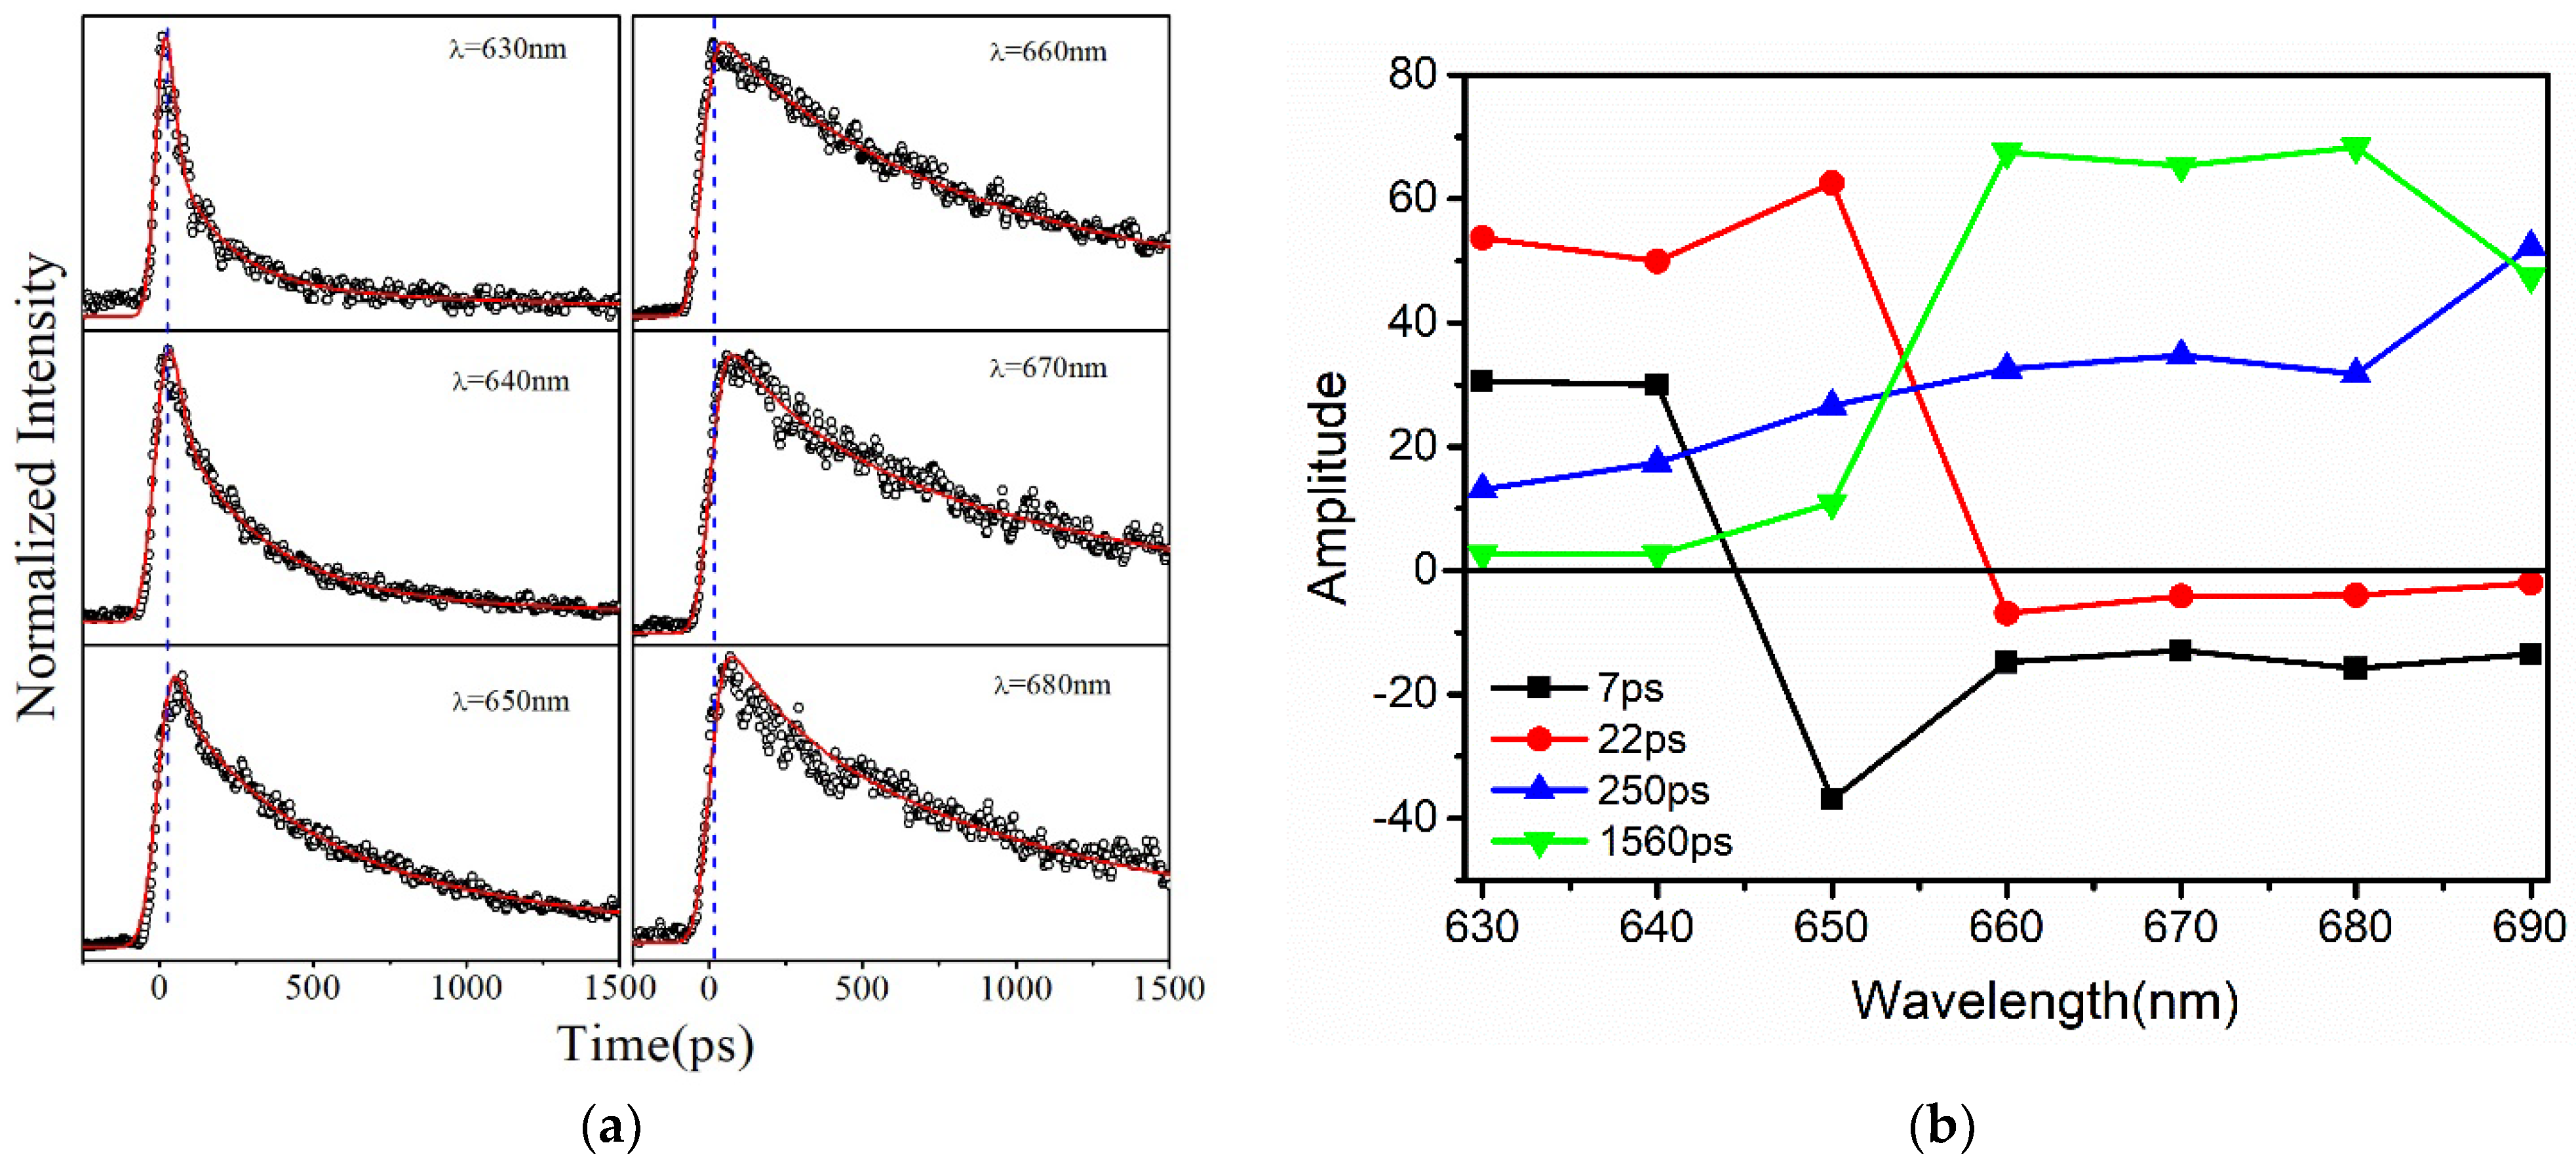
3.1. Steady State and Time−Resolved Spectroscopy Results

The steady-state spectra of the C−PC hexamer were measured at room temperature and 77 K, respectively. The results are shown in Figure 1a. The black line represents the absorption spectra of C−PC hexamer at room temperature, which exhibited a peak at 619 nm and a shoulder at 570 nm, with a large half-width owing to the absorption of PCB chromophores. At room temperature, the maximum fluorescence peak occurred at 643 nm, as shown in the blue curve in Figure 1a. It is inferred that the C−PC hexamer was a completely independent unit both in structure and function. The steady-state spectra at room temperature are consistent with the result from Zhao et al. [19].
The fluorescence spectra of the C−PC hexamer measured at the temperature of 77 K upon excitation at 570 nm are also shown as the red line in Figure 1a, which exhibits a narrower spectra band and 15 nm peak red-shift compared with the steady-state fluorescence at room temperature. This is due to the low temperature at 77 K that can lead to the re−conformation of phycobiliprotein, resulting in the change of the electronic state of the chromophore group [30]. The emission at the wavelength region longer than 700 nm might relate to the vibrational bands.
Fluorescence spectra in a steady state are a combination of emissions from fluorescence components. Energy transfer among them shall be described on the basis of individual kinetics. Thus, the time-resolved fluorescence spectra of C−PC were analysed in detail, as shown in Figure 1b. The time-resolved fluorescence spectrum was conducted at 77 K, at which the molecular vibration effect and solvent effect that affect the precise reflection of the energy transfer process could be neglected, allowing large signal-to-noise ratios to guarantee that the time-resolved fluorescence spectrum is close to the necessary assumption of the energy transfer in theoretical models.
Figure 1c shows the reconstructed three-dimensional time-resolved fluorescence spectra of C−PC from S. platensis at 77 K, represented in colour gradation. The colour profiles represent the fluorescence intensity recorded at various delay times after excitation. Such representation helps us to understand the energy flow more conceptually. On excitation at 570 nm that preferentially excited PCB chromophores, the time-resolved fluorescence spectra showed an initial spike of the PC fluorescence band around 650 nm, followed by the red shift of the fluorescence band. At 280 ps after excitation, the time-resolved fluorescence spectra showed the maximum intensity at the wavelength of around 560 nm, indicating the energy has been transferred from the PC fluorescence chromophore of 550 nm to the chromophore of 560 nm.

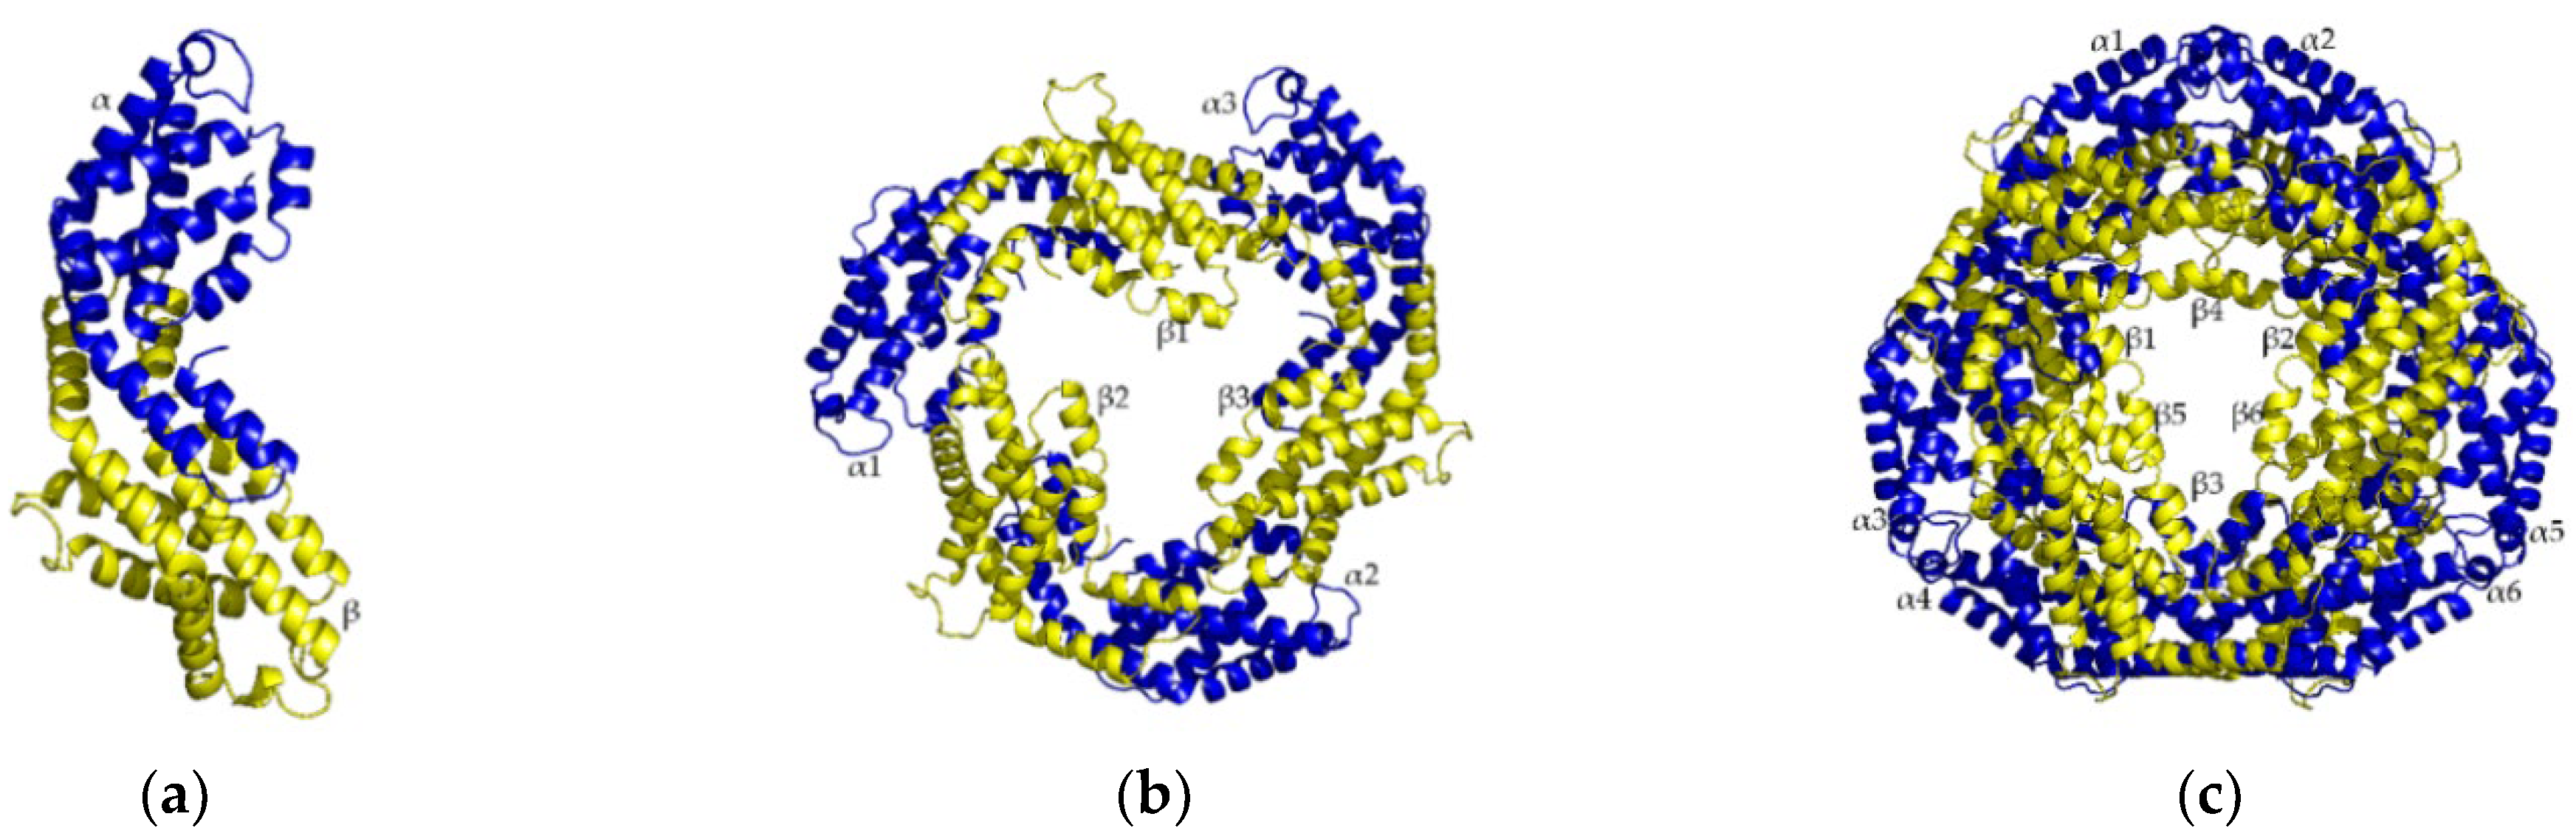
3.2. Protein Structure Prediction Results

In the study of photosynthesis, the resonance energy transfer theory is usually used to describe the energy transfer between phycobilin pigments. Förster theory gives the relationship between energy transfer efficiency and orientation factor, the distance of pigment-pigment and spectral overlap integral. In addition, the reciprocal of the sixth power of the distance between the pigments has a linear relationship with the energy transfer efficiency. Distance strongly affects energy transfer efficiency. As a novel neural network architecture, AlphaFold2 has greatly improved in the field of the accuracy of structure prediction. Here, its structure prediction has been treated as the model for the energy transfer function of C−PC from S. platensis. Predicting protein structure using Alphafold2 requires the amino acid sequence of the protein. Therefore, the FASTA file with amino acid information was proved, which contains monomers, trimers and hexamers of C−PC. Alphafold2 will build protein models from those FASTA files and reorders the sequence numbers of these predicted structures with the confidence of the model. Typically, the model with the highest ordinal number corresponds to the highest confidence. As shown in Figure 2, two different subunits (α and β subunits) form the αβ monomer, which serves as the basic unit for the PBP assembly. Three αβ monomers further assemble into a ring−shaped (αβ)3 trimer, and two trimers then stack to make a rodlike (αβ)6 hexamer. The α−chain is 162 residues long and the β−chain is 172 residues long, as shown in Figure S1 which has been added in Supplementary Materials.
Although a C−PC hexamer model was obtained by AlphaFold2, the confidence of the model requires further characterisation. With regards to this, the output file of AlphaFold2 was processed, the b−factor of the model was extracted, and the pLDDT curve of the model was drawn. The average confidence for the monomer was 0.9642, while the averages for the trimer and hexamer were 0.9705 and 0.9401. Subsequently, the AlphaFold2 model was aligned with the crystallographic model, and the RMSD values of the two models were calculated by the PyMol script (RMSD = 0.963), as shown in Supplementary Materials Figure S2a. The two results indicated that the computational model of AlphaFold2 has a high match with the crystallographic model. However, it can be seen from the value of the b-factor for the single amino acid site that the AlphaFold2 model has a small structure with low confidence, as shown in Supplementary Materials Figure S2b. Any variation in protein structure may lead to significant changes in the distance between pigments, which in turn alters the efficiency of energy transfer. For this reason, the cysteines of the dangling pigment on the crystallographic model were aligned with the cysteines at the same position on AlphaFold2. From the comparison results, the lower confidence amino acid site was not near the cysteine. It was found that its position was farther from the cysteine bound to phycocyanin, as shown in Supplementary Materials Figure S2c.

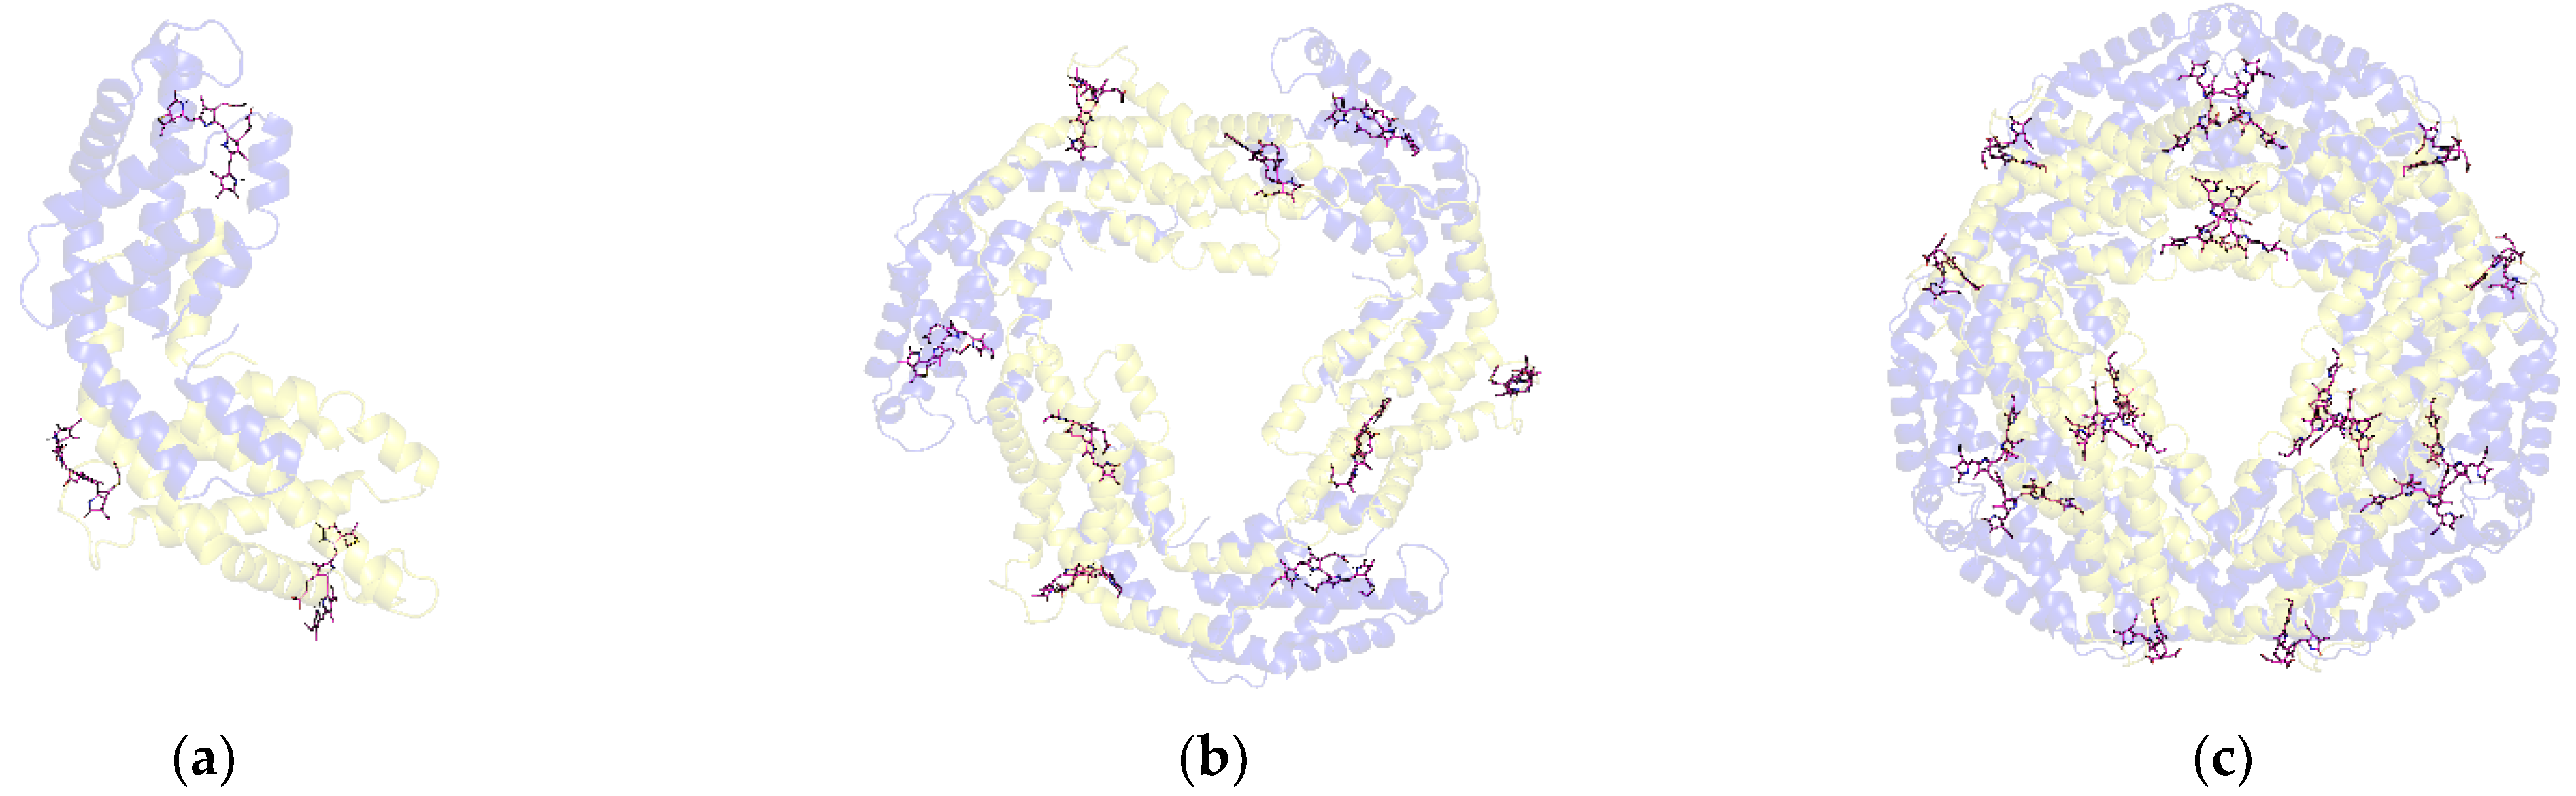
3.3. Chromophore Arrangement Results

As described above, the possible energy transfer routes could be predicted from the distances among the chromophores and the energy transfer efficiency is inversely related to the distance between the chromophores. However, since phycobilin pigments are not included in the model, it is necessary to perform molecular docking on the model. Normally, phycobilisomes hang from proteins in the form of thioether bonds, and the monomers that make up the C−PC have three hanging sites. Figure 3 shows the PCB chromophores arrangement in C−PC. Three PCB chromophores α84, β84 and β155 are covalently attached to cysteine residues by thioester bonds in the αβ monomer. α84−PCB is associated with Cys84 in the α-chain, while the β84−PCB and β155−PCB are linked to Cys82 and Cys153 in the β−chain, respectively, as shown in Figure 3a. The PCB chromophores arrangement in the (αβ)3 trimer was also shown in Figure 3b. Since the C−PC hexamer is assembled from two trimers in a face−to−face manner, there is some overlap in the positions of the pigments, as shown in Figure 3c.
According to the AlphaFold2 predicted protein structure and the further covalent bond docking, eighteen phycocyanins were suspended at various active sites of C−PC. The distances between different pigments can be read out by the molecular visualization software, PyMol. Table 1 shows the information on the distance distribution between different pigments read out by PyMol. The results show that the distance distribution between pigments is less than 40 Å, whether in the monomer, trimer or hexamer of C−PC. In addition, the distance between β84 and β155 is about 35 Å in the αβ monomer. However, compared to the monomer, the α84 and β84 in the trimer have a much shorter distance between adjacent monomers and the shortest distance of about 20 Å. The distance between β–84 pairs in the adjacent monomer is about 35 Å, and the α84 and β155 in the adjacent monomer are about 39 Å. Similarly, in the (αβ)6 hexamer, the distance distribution between α84 pairs, β84 pairs and β155 pairs in two face−to−face trimers are 26 Å, 35 Å, and 28 Å, respectively. The distance between α84–β84 pairs and α84–β155 pairs are 35 Å and 37 Å, respectively.

4. Discussion

To determine the constants of fluorescence decay of C−PC, deconvolution was conducted in a global optimization method. The time-resolved fluorescence decay at different detected wavelengths was resolved by multi-exponential deconvolution and the Monte−Carlo method was adopted to process the experimental data, as shown in Figure 4a. The fluorescence decay of C−PC was well fitted with four exponentials of 7, 22, 250 and 1560 ps, and the amplitudes of each time component are listed in Supplementary Materials (Table S1). All the time constants, except for the longest one of the terminal fluorescent emissions, can be considered as a function of the time constant of energy transfer. The component (A%) with a negative amplitude corresponds to the uprising stage of fluorescence, indicative of an energy acceptor, and the component with a positive pre−exponential corresponds to the downturn stage of fluorescence, indicative of an energy donor.
Based on the results of the deconvolution procedure, we can obtain the fluorescence decay-associated spectra (FDAS), which reveal the energy transfer dynamics of the decay constants. Figure 4b shows the FDAS of the C−PC hexamer. The negative and positive bands indicate the rise and decay kinetics in populations in the excited state, respectively. The coupling of negative and positive bands is a clear indication of energy transfer from the chromophore giving the positive band to those giving the negative band.
According to the previous report, the energy transfer process in the monomer and trimer is different due to the change in the C−PC structure. In the αβ monomer, the fluorescence decay constant with the shortest lifetime is 52 ps and was assigned to the energy transfer progress from β155 to β84 [15]. Moreover, from the structural information, the distance between the two chromophores was 35 Å. While in trimers, two new energy transfer paths emerged due to the complexity of the spatial structure: 1 ps decay constant from the α84 to β84 and 40 ps decay constant between identical chromophore pairs. In the adjacent monomer (α1–84 and β2–84), the α84 and β84 have the shortest distance of about 20Å, and the energy transfer time between α1–84 and β2–84 has been identified as less than 1 ps [16]. However, the energy transfer progress which has the fluorescence decay constant of about less than 1 ps cannot be deconvoluted definitely. Moreover, the energy transfer progress between identical chromophore β−84 pairs (β1–84 and β2–84) around the trimer ring has an energy transfer time of 46 ps, with a distance of 35 Å.
Therefore, the fluorescence decay constant of 7, 22, 250, and 1560 ps can be identified by combining the data on the distance between the chromophores and the FDAS results. It is reasonable to assign the decay time of 7ps to the energy transfer time between the identical chromophore α-84 pairs (α1–84 to α4–84 and α2–84 to α5–84 and α3–84 to α6–84) of the two trimers in (αβ)6 hexamer, with the chromophore distance of 26 Å. The fluorescence decay constant of 22 ps might be assigned to the energy transfer time between the identical chromophore β-155 pairs (β1–155 to β5–155 and β2–155 to β6–155 and β3–155 to β4–155) of the two trimers in (αβ)6 hexamer, with the chromophore distance of 28 Å. Furthermore, the predominant energy transfer pathways in the C−PC hexamer were likely from β−155(or α−84) in the top trimer to β−155(or α−84) in the adjacent bottom trimer, rather than from β-84 in the top trimer to β-84 in adjacent bottom trimer [31], with the chromophore distance of 35 Å. According to the FDAS results, the fluorescence decay constant of 250 ps might be assigned to the emission of α84 and β84 chromophores, because the two chromophores of α84−PCB and β84−PCB have similar fluorescence spectra, and the energy transfer path between α84-PCB and β84−PCB are approximately reversible [32]. The fluorescence decay constant of 1560 ps might reflect the final emission of the anchor polypeptide in the C−PC hexamer.
Accurate identification of the energy transfer process requires precise protein structure and high-time-resolution spectral information. However, the acquisition of both is challenging work. To this end, we used computational methods to assign fluorescence decay constant reasonably between high-resolution protein structures and existing time-resolved fluorescence spectra, and also verified the applicability of AI-based protein structure calculation for the energy transfer process.

5. Conclusions

The functions of proteins are determined mainly by structures. Therefore, resolving energy transfer processes in light-harvesting complexes relies on accurate structural information. In addition to the traditional methods of experimentally resolving protein structures by nuclear magnetic resonance (NMR), cryo−electron microscopy (cryo−EM) and X−ray crystallography, artificial intelligence (AI) is a new attempt at protein prediction, among which AlphaFold2 currently has more than 96% confidence in monomers. The AlphaFold2 method provides atomic-scale high-precision protein structural information, it also reduces the dependence on expensive equipment such as synchrotron radiation and cryo−EM. High-precision protein structure information is essential to identify the energy transfer process in light-harvesting complexes. Therefore, we conducted the relevant work and verified the possibility of AlphaFold2 for the energy transfer process. According to the structure information, two energy transfer paths are identified. This computing-based structure prediction method opens up a new avenue for understanding the energy transfer process in photosynthesis.
For the energy transfer process, AlphaFold2 is an exciting and promising technology and also showed satisfactory results from the overall effect. However, AlphaFold2 can be further improved in detail, when more precise energy transfer paths need to be considered. Moreover, the energy transfer process with a time constant of less than 1 ps, cannot be directly observed using the exiting technique. However, with the rapid development of the protein structure prediction technology and the ultrafast technology improvement (streak camera with time revolution of 100 fs or pump-probe method with time resolution less than 10 fs), future research on the physical mechanism of energy transfer in the initial photosynthesis process can dig more deeply into the energy localization kinetics of the coherence state of the excited states, which may bring us a more detailed understanding of the energy transfer pathways and rates.
The functions of proteins result from structures. Until now, nearly all the protein structures were determined through experimental methods such as crystallography, NMR and cryo−EM [11,33,34]. As a supplementary theoretical method, the AlphaFold model with high-quality predictions has great potential in protein structure determination which can be further used as the structural basis for energy transfer study in the light-harvesting complex. With the application of AlphaFold2, we may conduct more environmentally dependent analyses enriching the biological information library based on the cryo−electron microscopy

Supplementary Materials

The following are available online at https://www.mdpi.com/article/10.3390/cryst12111595/s1, Figure S1: Alignment of the C−PC amino−acid sequences of the α−subunit and β−subunit from S. platensis., Table S1: The deconvolution results of C−PC hexamer.

Author Contributions

Supervised the project, M.X. and F.Z.; prepared the samples, C.X.; AlphaFold2 simulations, N.G.; stead-state microscopy data collection and analysis, M.X.; time-resolved spectroscopy measurement, M.X.; the spectroscopy results analysis, M.X. and Z.L.; writing—original draft preparation, C.X. and N.G.; writing—review and editing, F.Z.; funding acquisition, F.Z. and M.X. All authors have read and agreed to the published version of the manuscript.

Funding

This research was funded by the Government of Guangdong Province for NST (grant number 2016B090918099).

Institutional Review Board Statement

No applicable.

Informed Consent Statement

No applicable.

Data Availability Statement

Experimental data are available upon reasonable request to the authors.

Acknowledgments

We thank the staff at the School of Physics and State Key Laboratory of Optoelectronic Materials and Technologies, Sun Yat-sen University for technical support on the femtosecond laser system and streak camera performances.

Conflicts of Interest

The authors declare no conflict of interest.

References

  1. Blankenship, R.E. Molecular Mechanisms of Photosynthesis, 2nd ed.; Wiley-Blackwell: Hoboken, NJ, USA, 2014. [Google Scholar]
  2. Wiltbank, L.B.; Kehoe, D.M. Diverse light response of cyanobacteria mediated by phytochrome superfamily photoreceptors. Nat. Rev. Microbiol. 2019, 17, 37–50. [Google Scholar] [CrossRef] [PubMed]
  3. Scholes, G.D.; Fleming, G.R.; Olaya-Castro, A.; van Grondelle, R. Lessons from nature about solar light harvesting. Nat. Chem. 2011, 3, 763–774. [Google Scholar] [CrossRef] [PubMed]
  4. Bryant, D.A. The Photosynthetic Apparatus: Molecular Biology and Operation. In Cell Culture and Somatic Cell Genetics of Plants, 1st ed.; Bogorad, L., Vasil, I.K., Eds.; Academic Press: New York, NY, USA, 1991; pp. 255–298. [Google Scholar]
  5. Glazer, A.N. Light harvesting by phycobilisomes. Annu. Rev. Biophys. Biophys. Chem. 1985, 14, 47–77. [Google Scholar] [PubMed]
  6. van Grondelle, R. Excitation energy transfer, trapping and annihilation in photosynthetic systems. Biochim. Et Biophys-Ica Acta (BBA)—Rev. Bioenerg. 1985, 811, 147–195. [Google Scholar] [CrossRef]
  7. Gao, X.; Wei, T.-D.; Zhang, N.; Xie, B.-B.; Su, H.-N.; Zhang, X.-Y.; Chen, X.-L.; Zhou, B.-C.; Wang, Z.-X.; Wu, J.-W.; et al. Molecular insights into the terminal energy acceptor in cyanobacterial phycobilisome. Mol. Microbiol. 2012, 85, 907–915. [Google Scholar] [CrossRef]
  8. Watanabe, M.; Ikeuchi, M. Phycobilisome: Architecture of a light-harvesting supercomplex. Photosynth. Res. 2013, 116, 265–276. [Google Scholar] [CrossRef]
  9. Peng, P.-P.; Dong, L.-L.; Sun, Y.-F.; Zeng, X.-L.; Ding, W.-L.; Scheer, H.; Yang, X.; Zhao, K.-H. The structure of allophycocyanin B fromSynechocystisPCC 6803 reveals the structural basis for the extreme redshift of the terminal emitter in phycobilisomes. Acta Crystallogr. Sect. D Biol. Crystallogr. 2014, 70, 2558–2569. [Google Scholar] [CrossRef]
  10. Kuzminov, F.; Bolychevtseva, Y.; Elanskaya, I.; Karapetyan, N. Effect of APCD and APCF subunits depletion on phycobilisome fluorescence of the cyanobacterium Synechocystis PCC 6803. J. Photochem. Photobiol. B Biol. 2014, 133, 153–160. [Google Scholar] [CrossRef]
  11. Chang, L.; Liu, X.; Li, Y.; Liu, C.-C.; Yang, F.; Zhao, J.; Sui, S.-F. Structural organization of an intact phycobilisome and its association with photosystem II. Cell Res. 2015, 25, 726–737. [Google Scholar] [CrossRef] [Green Version]
  12. Wang, X.; Li, L.; Chang, W.; Zhang, J.; Gui, L.; Guo, B.; Liang, D. Structure of C-phycocyanin from Spirulina platensis at 2.2 A resolution: A novel monoclinic crystal form for phycobiliproteins in phycobilisomes. Acta Cryst. 2001, D57, 784–792. [Google Scholar]
  13. Padyana, A.; Bhat, V.; Madyastha, K.; Rajashankar, K.; Ramakumar, S. Crystal Structure of a Light-Harvesting Protein C-Phycocyanin from Spirulina platensis. Biochem. Biophys. Res. Commun. 2001, 282, 893–898. [Google Scholar] [CrossRef] [PubMed]
  14. Jumper, J.; Evans, R.; Pritzel, A.; Green, T.; Figurnov, M.; Ronneberger, O.; Tunyasuvunakool, K.; Bates, R.; Žídek, A.; Potapenko, A.; et al. Highly accurate protein structure prediction with AlphaFold. Nature 2021, 596, 583–589. [Google Scholar] [CrossRef] [PubMed]
  15. Debreczeny, M.P.; Sauer, K. Comparison of Calculated and Experimentally Resolved Rate Constants for Excitation Energy Transfer in C-Phycocyanin. 1. Monomers. J. Phys. Chem. 1995, 99, 8412–8419. [Google Scholar] [CrossRef]
  16. Debreczeny, M.P.; Sauer, K.; Zhou, J.; Bryant, D.A. Comparison of Calculated and Experimentally Resolved Rate Constants for Excitation Energy Transfer in C-Phycocyanin. 2. Trimers. J. Phys. Chem. 1994, 99, 8420–8431. [Google Scholar] [CrossRef]
  17. Zhao, J.; Zhu, J.; Jiang, L. Computer simulation on kinetics of primary process in photosynthesis of algae (V)—Excitation energy transfer in phycoerythrocyanins. China Ser. B-Chem. 1996, 5, 73–80. [Google Scholar]
  18. Zhao, J.; Zhu, J.; Jiang, L. Computer simulation on kinetics of primary process in photosynthesis (III). Energy transfer in the trimers and hexamers of C-Phycocyanins. China Ser. B-Chem. 1994, 7, 35–42. [Google Scholar]
  19. Zhao, J.; Zhu, J.; Jiang, L. Study on the energy transfer processes in phycobilisomes from blue-green algae by the use of stochastic simulation approach. BBA—Bioenerg. 1995, 1229, 39–48. [Google Scholar] [CrossRef] [Green Version]
  20. Zhao, J.; Zhu, J.; Jiang, L. Computer Simulation on Kinetics of Primary Processes in Photosynthesis I-Mechanism of Exciton Annihilation of Excited State Decay in Phycobiliproteins. S China Ser. B-Chem. 1993, 36, 1186–1197. [Google Scholar]
  21. Matamala, A.R.; Almonacid, D.E.; Figueroa, M.F.; Martínez-Oyanedel, J.; Bunster, M.C. A semiempirical approach to the intraphycocyanin and inter-phycocyanin fluorescence resonance energy-transfer. J. Comput Chem. 2007, 28, 1200–1207. [Google Scholar] [CrossRef] [Green Version]
  22. Schneider, S.; Geiselhart, P.; Siebzehnrübl, S. Energy transfer within trimers of Mastigocladus laminosus studied by picosecond time-resolved transient absorption spectroscopy. Z. Nat. C 2014, 43, 55–62. [Google Scholar] [CrossRef]
  23. Xie, M.; Li, W.; Lin, H.; Wang, X.; Dong, J.; Qin, S.; Zhao, F. Difference in light use strategy in red alga between Griffithsia pacifica and Porphyridium purpureum. Sci. Rep. 2021, 11, 14367. [Google Scholar] [CrossRef] [PubMed]
  24. Xie, M.; Li, W.; Xiao, C.; Zhen, Z.; Ma, J.; Lin, H.; Qin, S.; Zhao, F. Time-Resolved Fluorescence Spectroscopy Study of Energy Transfer Dynamics in Phycobilisomes from Cyanobacteria Thermosynechococcus vulcanus NIES 2134 and Synechocystis sp. PCC 6803. Crystals 2021, 11, 1233. [Google Scholar] [CrossRef]
  25. Wang, H.; Zhao, J.; Jiang, L. Energy transfer processes in phycobilisome model complex at 77 K. China Ser. B-Chem. 2000, 43, 233–239. [Google Scholar] [CrossRef]
  26. Zhao, F.; Zheng, X.; Zhang, J.; Wang, H.; Yu, Z.; Zhao, J.; Jiang, L. Energy transfer in allophycocyanin hexamer from Anabaena variabilis by time-resolved spectroscopy. J. Photochem. Photobiol. B 1998, 45, 144–149. [Google Scholar] [CrossRef]
  27. Bianco, G.; Forli, S.; Goodsell, D.S.; Olson, A.J. Covalent docking using autodock: Two-point attractor and flexible side chain methods. Protein Sci. 2015, 25, 295–301. [Google Scholar] [CrossRef] [Green Version]
  28. Forli, S.; Huey, R.; Pique, M.; Sanner, M.; Goodsell, D.; Olson, A. Computational protein–ligand docking and virtual drug screening with the AutoDock suite. Nat. Protoc. 2016, 11, 905–919. [Google Scholar] [CrossRef] [Green Version]
  29. Seeliger, D.; de-Groot, B. Ligand docking and binding site analysis with PyMOL and Autodock/Vina. J. Comput. Aided. Mol. Des. 2010, 24, 417–422. [Google Scholar] [CrossRef] [Green Version]
  30. Xia, A.D.; Zhang, X.Y.; Hong, Q.A.; Meng, J.; Hou, S.J.; Sudha, M.; Maruthi Sai, P.S.; Jha, I.B. Spectroscopic Characteristics and Energy-Transfer Processes in C-phycocyanin from Cyanobacterium Westiellopsis-Prolifica. Sci. China-Chem. 1992, 35, 811–821. [Google Scholar]
  31. Ren, Y.; Chi, B.; Melhem, O.; Wei, K.; Feng, L.; Li, Y.; Han, X.; Li, D.; Zhang, Y.; Wan, J.; et al. Understanding the electronic energy transfer pathways in the trimeric and hexameric aggregation state of cyanobacteria phycocyanin within the framework of Förster theory. J. Comput. Chem. 2013, 34, 1005–1012. [Google Scholar] [CrossRef]
  32. Zhang, J.; Zhao, F.; Zheng, X.; Wang, H.Z.; Yang, T.-S.; Hayashi, M.; Lin, S. Excitation energy-transfer processes between two trimers in C-phycocyanin hexamer from the cyanobacterium Anabaena variabilis. Investigation by group theory and time-resolved fluorescence spectroscopy. J. Photochem. Photobiol. B-Biol. 1999, 53, 128–135. [Google Scholar] [CrossRef]
  33. Rajesh, S.; Overduin, M.; Bonev, B.B. NMR of membrane proteins: Beyond crystals. Adv. Exp. Med. Biol. 2016, 922, 29–42. [Google Scholar] [PubMed]
  34. Ma, J.; You, X.; Sun, S.; Wang, X.; Qin, S.; Sui, S. Structural basis of energy transfer in Porphyridium purpureum phycobili-some. Nature 2020, 579, 146–151. [Google Scholar] [CrossRef] [PubMed]
Figure 1. Spectral detection results: (a) Steady-State Spectroscopy. The black line represents the absorption spectra of C−PC at room temperature. The Blue line represents the fluorescence spectra of C−PC at room temperature. The Red line represents the fluorescence spectra of C−PC at 77 K; (b) Time-resolved fluorescence spectra of C−PC hexamer at 77 K with excitation at 570 nm. (c) Normalized time-resolved fluorescence spectra of C−PC at 77 K. Each spectrum is shown after normalization to the maximum intensity. The numbers in the figure show the time in picoseconds after excitation.
Crystals 12 01595 g001
Figure 2. AlphaFold2 structure predictions of C−PC complex from S. platensis.; (a) C−PC monomer, (b) C−PC trimer, (c) C−PC hexamer. α subunits were marked in blue and β subunits were marked in yellow.
Crystals 12 01595 g002
Figure 3. Distribution of chromophore arrangement in C−PC from S. platensis: (a) chromophores arrangement in αβ monomer, (b) chromophores arrangement in (αβ)3 trimer, (c) chromophores arrangement in (αβ)6 hexamer.
Crystals 12 01595 g003
Figure 4. Time−resolved spectra results: (a) Fluorescence intensity decay curves and fitting results of C−PC hexamer at 77 K. Excitation was done at 570 nm (b) The fluorescence decay-associated spectra of C−PC hexamer.
Crystals 12 01595 g004
Table 1. Distances (<40 Å) between chromophores within the C-PC complex.
C-PC ComplexEnergy Transfer PairsDistance (Å)
αβ monomerβ1–84 to β1–15535
β2–84 to β2–155
β3–84 to β3–155
β4–84 to β4–155
β5–84 to β5–155
β6–84 to β6–155
(αβ)3 trimerα1–84 to β2–8420
α2–84 to β3–84
α3–84 to β1–84
α4–84 to β5–84
α5–84 to β6–84
α6–84 to β4–84
β1–84 to β2–8436
β2–84 to β3–84
β3–84 to β1–84
β4–84 to β5–84
β5–84 to β6–84
β6–84 to β4–84
α1–84 to β3–15539
α2–84 to β1–155
α3–84 to β2–155
α4–84 to β5–155
α5–84 to β6–155
α6–84 to β4–155
(αβ)6 hexamerα1–84 to α4–8426
α2–84 to α5–84
α3–84 to α6–84
β1–155 to β5–15528
β2–155 to β6–155
β3–155 to β4–155
β1–84 to β6–8435
β2–84 to β4–84
β3–84 to β5–84
α1–84 to β5–8435
α2–84 to β6–84
α3–84 to β4–84
α4–84 to β3–84
α5–84 to β1–84
α6–84 to β2–84
α1–84 to β5–15537
α2–84 to β6–155
α3–84 to β4–155
α4–84 to β3–155
α5–84 to β1–155
α6–84 to β2–155
Publisher’s Note: MDPI stays neutral with regard to jurisdictional claims in published maps and institutional affiliations.

