Article

Effects of Gradient Hot Rolled Deformation on Texture Evolution and Properties of 1561 Aluminum Alloy

1
Key Lab of Electromagnetic Processing of Materials, Ministry of Education, Northeastern University, Shenyang 110819, China
2
Advanced Manufacturing Technology and Engineering Research Centers, Northeastern University, Shenyang 110819, China
*
Author to whom correspondence should be addressed.
Crystals 2022, 12(2), 229; https://doi.org/10.3390/cryst12020229
Submission received: 5 January 2022 / Revised: 28 January 2022 / Accepted: 3 February 2022 / Published: 7 February 2022
(This article belongs to the Special Issue Preparation and Properties of Aluminum Alloy Materials)

Abstract

:
Through gradient hot rolling, a transition zone from the initial undeformed to 30% deformed microstructure was obtained in the 6 mm thick 1561 aluminum alloy hot rolled plate. The effect of gradient deformation on the evolution process of structure and texture characteristics to 1561 aluminum alloy were systematically investigated by X-ray diffractometer (XRD), optical microscope (OM), and electron back-scattered diffraction (EBSD) in this paper. The results showed that after gradient hot rolling, the grains were elongated along the rolled direction, and the average grain size decreased from 18.95 μm to 1.19 μm. After annealing, the average grain size decreased from 28.34 μm to 10.69 μm. The fraction of dynamic recrystallization is low in all cases. With the increase in gradient deformation, the fraction of the deformed texture (110) <100> Goss, (110) <112 > Brass and fiber texture increased under the action of shear strain, the hardness value of annealed 1561 aluminum alloy ranged from 83.8 HV up to as high as 104 HV, and the electrical conductivity (EC) value increased from 23.5% IACS to 24.3% IACS. Significantly, with the increment of the deformation, the dislocation density increases 2.4 × 10¹³ m−2 of the annealed hot rolled plates, which should be responsible for the hardness increase. While the structure of the alloy becomes more orderly, the EC increases. Work hardening, fine-grain strengthening and texture all influence the mechanical properties of the gradient hot rolled 1561 aluminum alloy plate.

1. Introduction

Due to the increasing energy crisis and greenhouse effect, lightweight alloys, such as aluminum alloys, are attracting more and more attention for various applications in aerospace, automobile, ship, and chemical industries [1,2,3]. In general, Al–Mg alloys can be further strengthened by solution and precipitation hardening, still, often at the expense of ductility. Adding alloying elements is the most commonly used method to improve the properties of alloys [4,5]. Magnesium additions to aluminum alloys cause a considerable lattice distortion, because of the atomic size difference leading to substantial solution strengthening and a high work-hardening exponent [6]. Li et al. [7] reported that the grains of Al–Mg–Mn alloy could be refined by adding minor Sc and Nd, which can also improve the strength and recrystallization temperature. Ning et al. [8] proved that adding the element Zr can significantly enhance the strength of the alloy by strengthening the substructure and self-precipitation.
To date, researchers on aluminum alloy materials primarily focus on the relationship between microstructure, heat treatment, deformation, and mechanical properties [9,10]. Most of the relevant work reported that deformation strengthening is mainly to increase the strength of the alloy through cold rolling, but the larger cold deformation causes a large number of dislocations in the alloy, which makes the mechanical properties of the alloy more sensitive to temperature [11,12]. In industrial production, hot rolling is often the previous step to cold rolling. Therefore, it is of great significance to explore the influence of hot rolling deformation on the structure and properties of aluminum alloy [13,14,15]. Robert et al. [16] investigated the deformation texture evolution during hot rolling of aluminum alloy on the large plastic strains stage and presented a simple and general new approach to predicting deformation texture evolution during large plastic strains. She et al. [17] studied microstructure and fracture characteristics of 1561 aluminum alloy through hot rolling which indicated that the second phase distribution is inhomogeneous along the thickness direction, resulting in a U shape change of elongation. Choi et al. [18] studied the texture evolution during hot rolling deformation of Al–5 wt% Mg alloy. The experimental investigation reveals that the evolution of texture and microstructure is strongly dependent on the distance from the center of the Al–5 wt% Mg alloy sheet. Since the 1950s, XRD linear analysis has been widely used to test the dislocation density inside metallic materials [19,20,21]. Williamson and Hall proposed a diffraction peak broadening model caused by grain size and microscopic distortion to calculate the dislocation density in metallic materials [22]. Takashi Shintani et al. [23] studied the change of dislocation with strain and calculated the dislocation characteristic parameters of cold-rolled 304 steel which showed that the strengthening mechanism in cold-rolled Type 304 steel changes with differences in the dislocation density between the γ and the α′ phase. Inspired by the gradient structures of biological materials, researchers have explored compositional and structural gradients as an approach to enhance the properties of metal materials [24,25]. Wang et al. [26] studied the microstructures and properties of 6016 aluminum alloy with gradient compositions. The results indicate that as Mg and Si contents increase, the grain size decreases, improving the cube texture with recrystallization and weakening the S texture. Although the structural gradients achieved easier and attracted more and more attentions to researchers in recent years, there are still few reports about the structure and properties of metal alloys through gradient hot rolling [27,28]. These emerging gradient materials often exhibit unprecedented mechanical properties, such as strength-ductility synergy, which have not been found in materials with homogeneous or random microstructures [29,30].
In casting production, it is well known that a certain deformation can lead to a significant change in the structure of the alloys. Deformation modifies changes in the properties of the alloys and even the preferred orientation. The main objective of this paper is to explore the texture evolutions of the alloys that were investigated with metallurgical microscope, XRD analysis and EBSD measurement to uncover the structure and properties under different deformations. The results will be helpful for provided new opportunities to understand gradient deformation related mechanical behavior.

2. Experimental

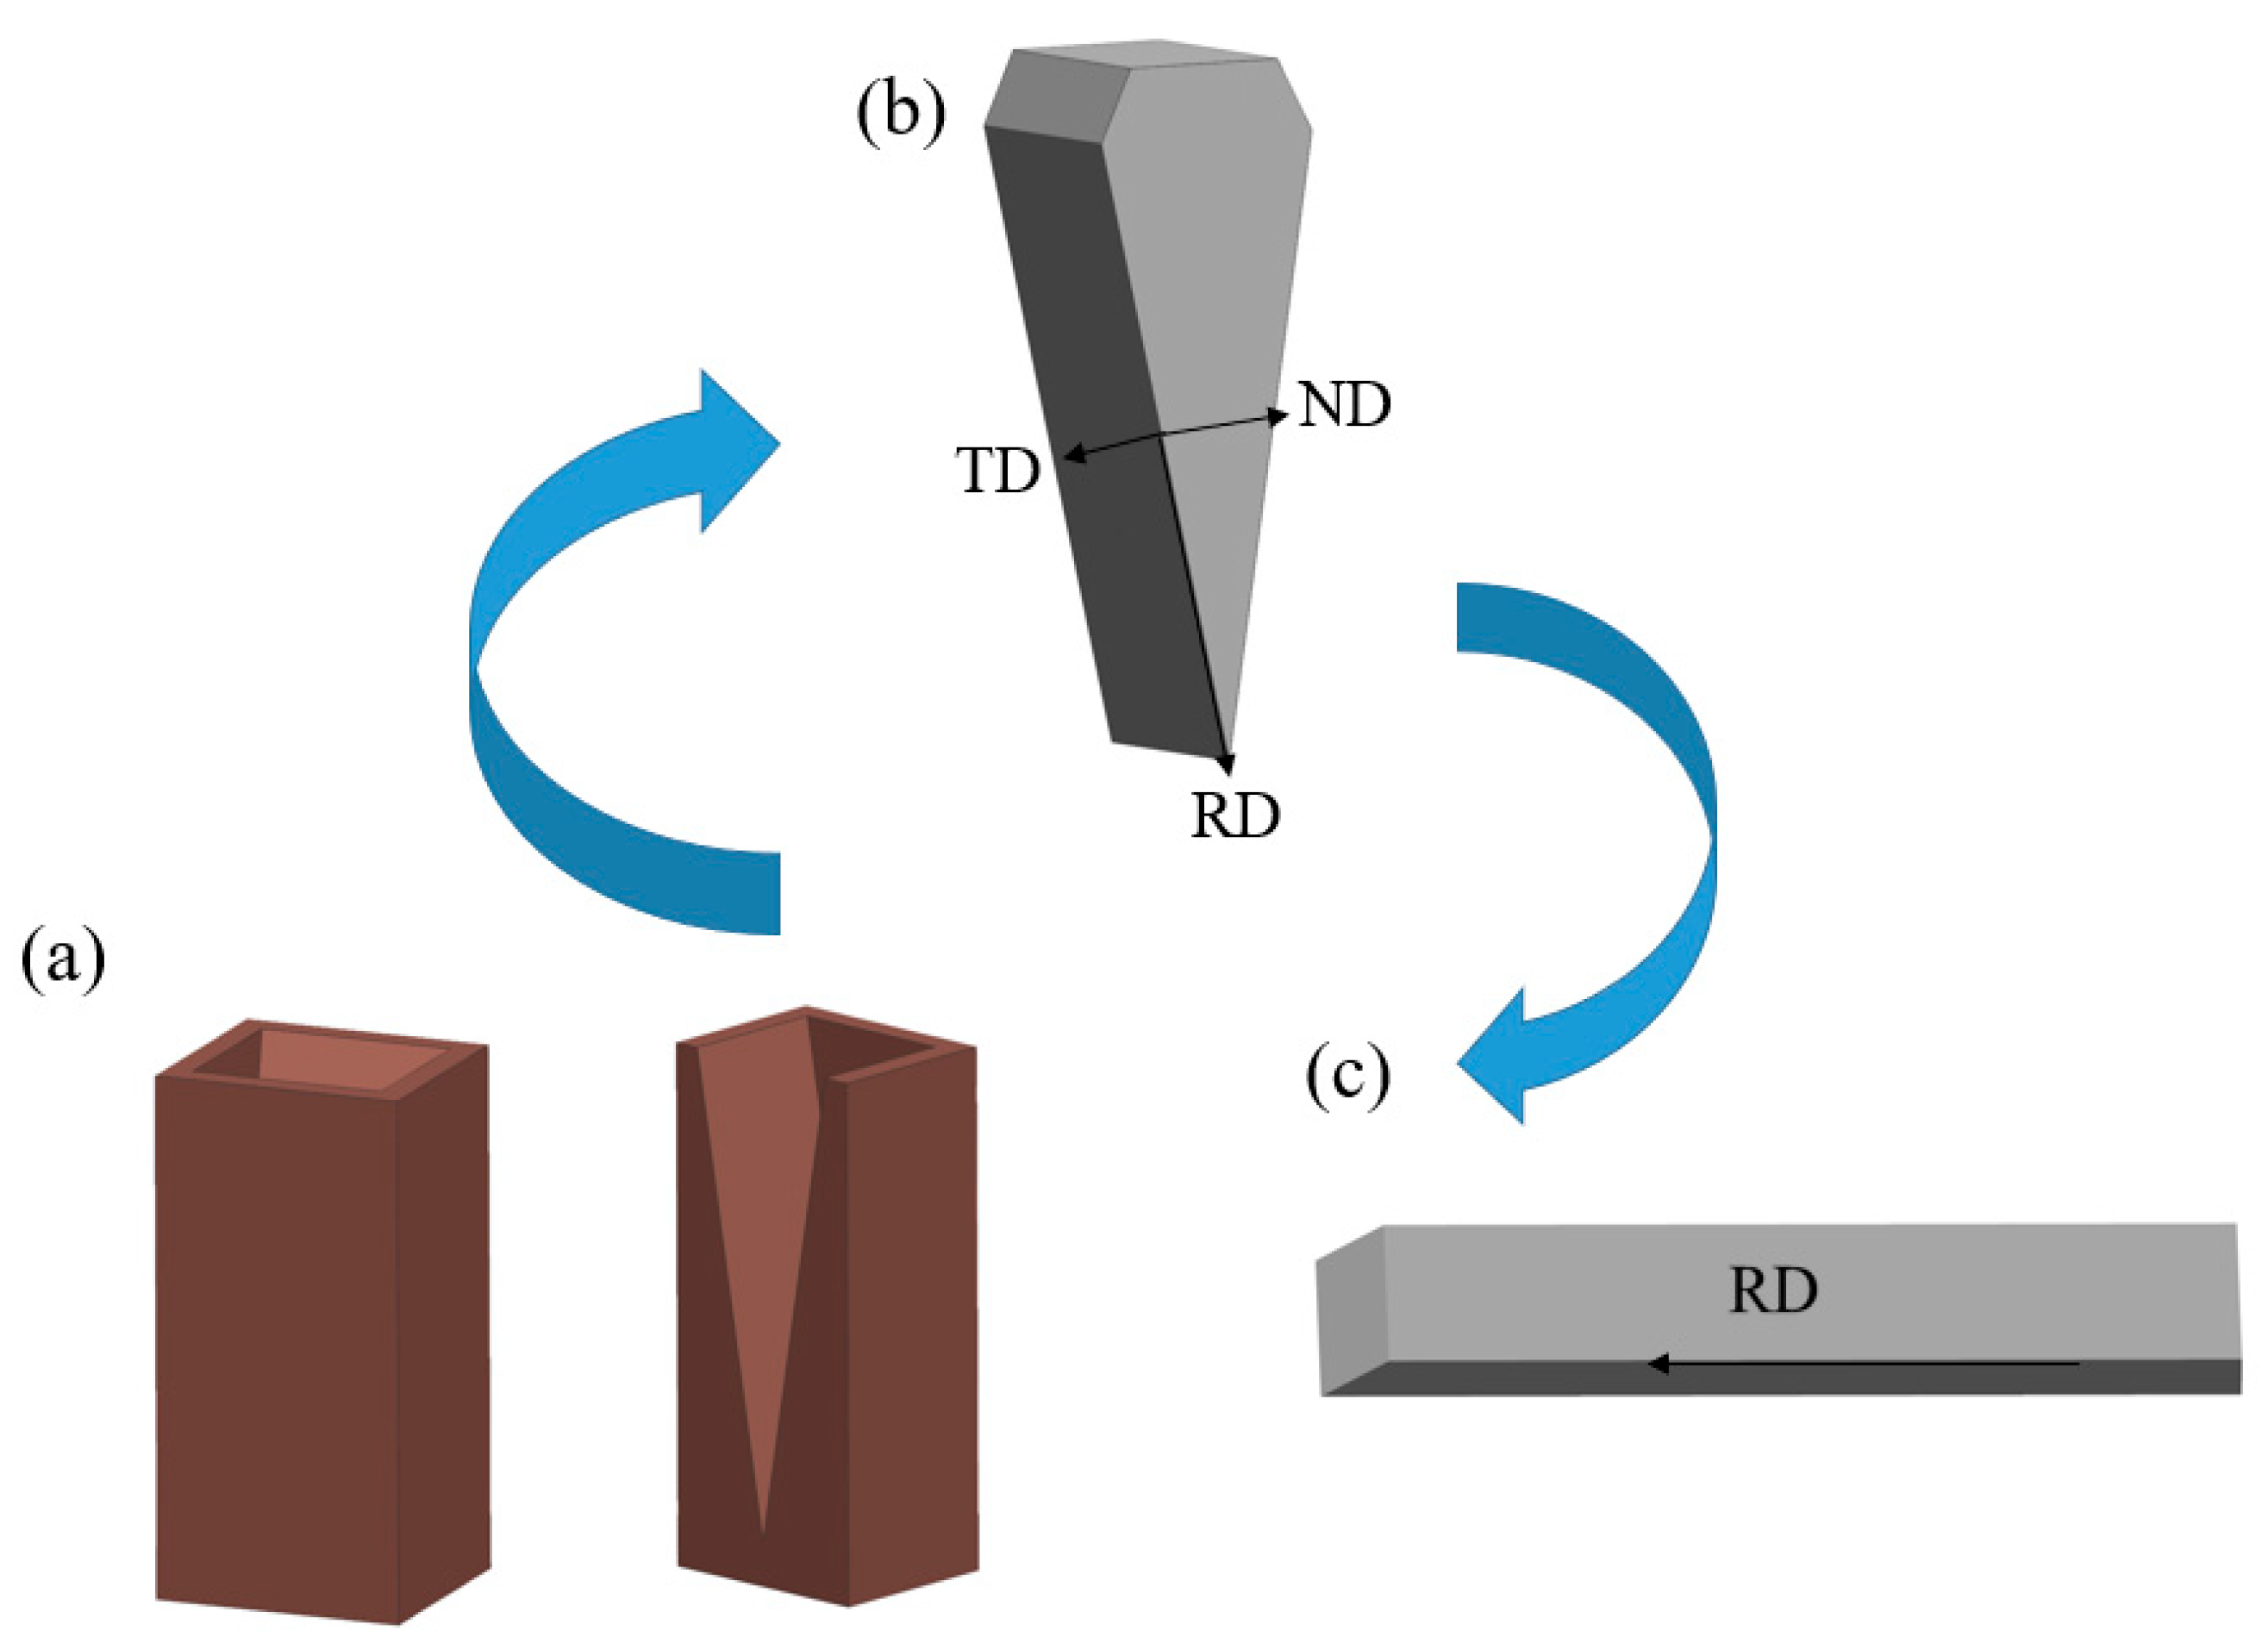
2.1. Material and Processing

In the study, the 1561 aluminum alloy was produced by the Al ingots (99.9 wt.%), Mg ingots (99.9 wt.%) and Al–10Mn, Al–5Zr master alloys in a crucible resistance furnace and prepared by the wedge-shaped copper mode casting (The Key Lab of Electromagnetic Processing of Materials, Ministry of Education, Northeastern University, Shenyang, China). The chemical composition of the alloy is analyzed by spectroscopy as shown in Table 1. Firstly, the aluminum was heated and melted in a medium frequency induction furnace, then, the Al–10Mn, Al–5Zr master alloy was added to the melt. Finally, pure industrial Mg was added to the alloy melt at 730 °C, then they smelted in a graphite crucible under the protection of mixed powder (C2Cl6), and alumina was added to degas, and the slag was removed. After the molten metal temperature in the furnace reached 740 °C, it was maintained for 10 minutes, and the melts were poured into a wedge-shaped copper mold with an inside diameter of 65 × 50 mm and a height of 120 mm. The wedge copper mold casting experimental equipment and obtained materials are shown in Figure 1. The ingot was preserved at 450 °C for 3 h, multi-pass rolling carried out, and the deformation of each pass is controlled at 5–15%. During the rolling process, the maximum deformation of the rolling is controlled to be 30%. This is followed by hot rolling into a 6 mm plate, and subsequent annealing at 200 °C for 15 min.

2.2. Characterizations and Testing

The rolling direction (RD), the transverse direction (TD) and normal direction (ND) were shown in Figure 1. The samples for microstructure observation were taken from the states along the TD and ND. The grain structure of metallographic specimens was etched by the Sulfuric Phosphoric acid solution (H2SO4: H3PO4: H2O = 38: 43: 19) and were observed by a LeitzMM-6 OM. The XRD analysis was undertaken on a Pw3040/60 X-ray diffractometer (PANalytical B.V., The Netherlands) at 40 kV with Cu–Kα radiation (wavelength λ = 0.15406 nm) measuring the lattice constant and the dislocation density. The length step, the scanning speed, and the diffraction angle (2θ) range of XRD were 0.02°, 1°/min and 10–90°, respectively. The EBSD tests were performed over the rolling direction of the specimens by Zeiss crossbeam 550 microscopies with a step length of 0.223 μm. The acquired result was analyzed with the orientation imaging microscopy software HKL-Channel 5 and the measured pole figures {111}. The specimens for EBSD analyses were first ground by SiC paper to #5000 and then Argon ion polishing was applied to eliminate residual stress. Specimens were cut from different positions of 1561 aluminum alloy plates designed with a deformation gradient for the hardness and conductivity test. The hardness was measured with a contact load of 200 gf to assess the softening degree of deformation. The electrical conductivity was measured using a Sigmascope EX 8 instrument at room temperature (25 °C) to examine the precipitation behavior. The average hardness and EC were obtained through five measurements completed in the RD for the different deformation samples.
The chemical compositions of the ingot obtained by optical emission are listed in Table 1. The material used in this experiment is a 950 mm × 6 mm (width × thickness) 1561 aluminum alloy hot rolled plate prepared by State Key Laboratory of Rolling and Automation (RAL) of Northeastern University. The metallographic structure was cut from 1561 aluminum alloy ingot which corresponds to the hot rolled plate and labeled the A1 and A2 plates. The plates were cut from the hot rolled plate and labeled the H1 and H2 plates, which indicated the 3% and 30% deformed regions, respectively. The annealed rolled plates were named the N1 and N2 plates.

3. Results and Discussion

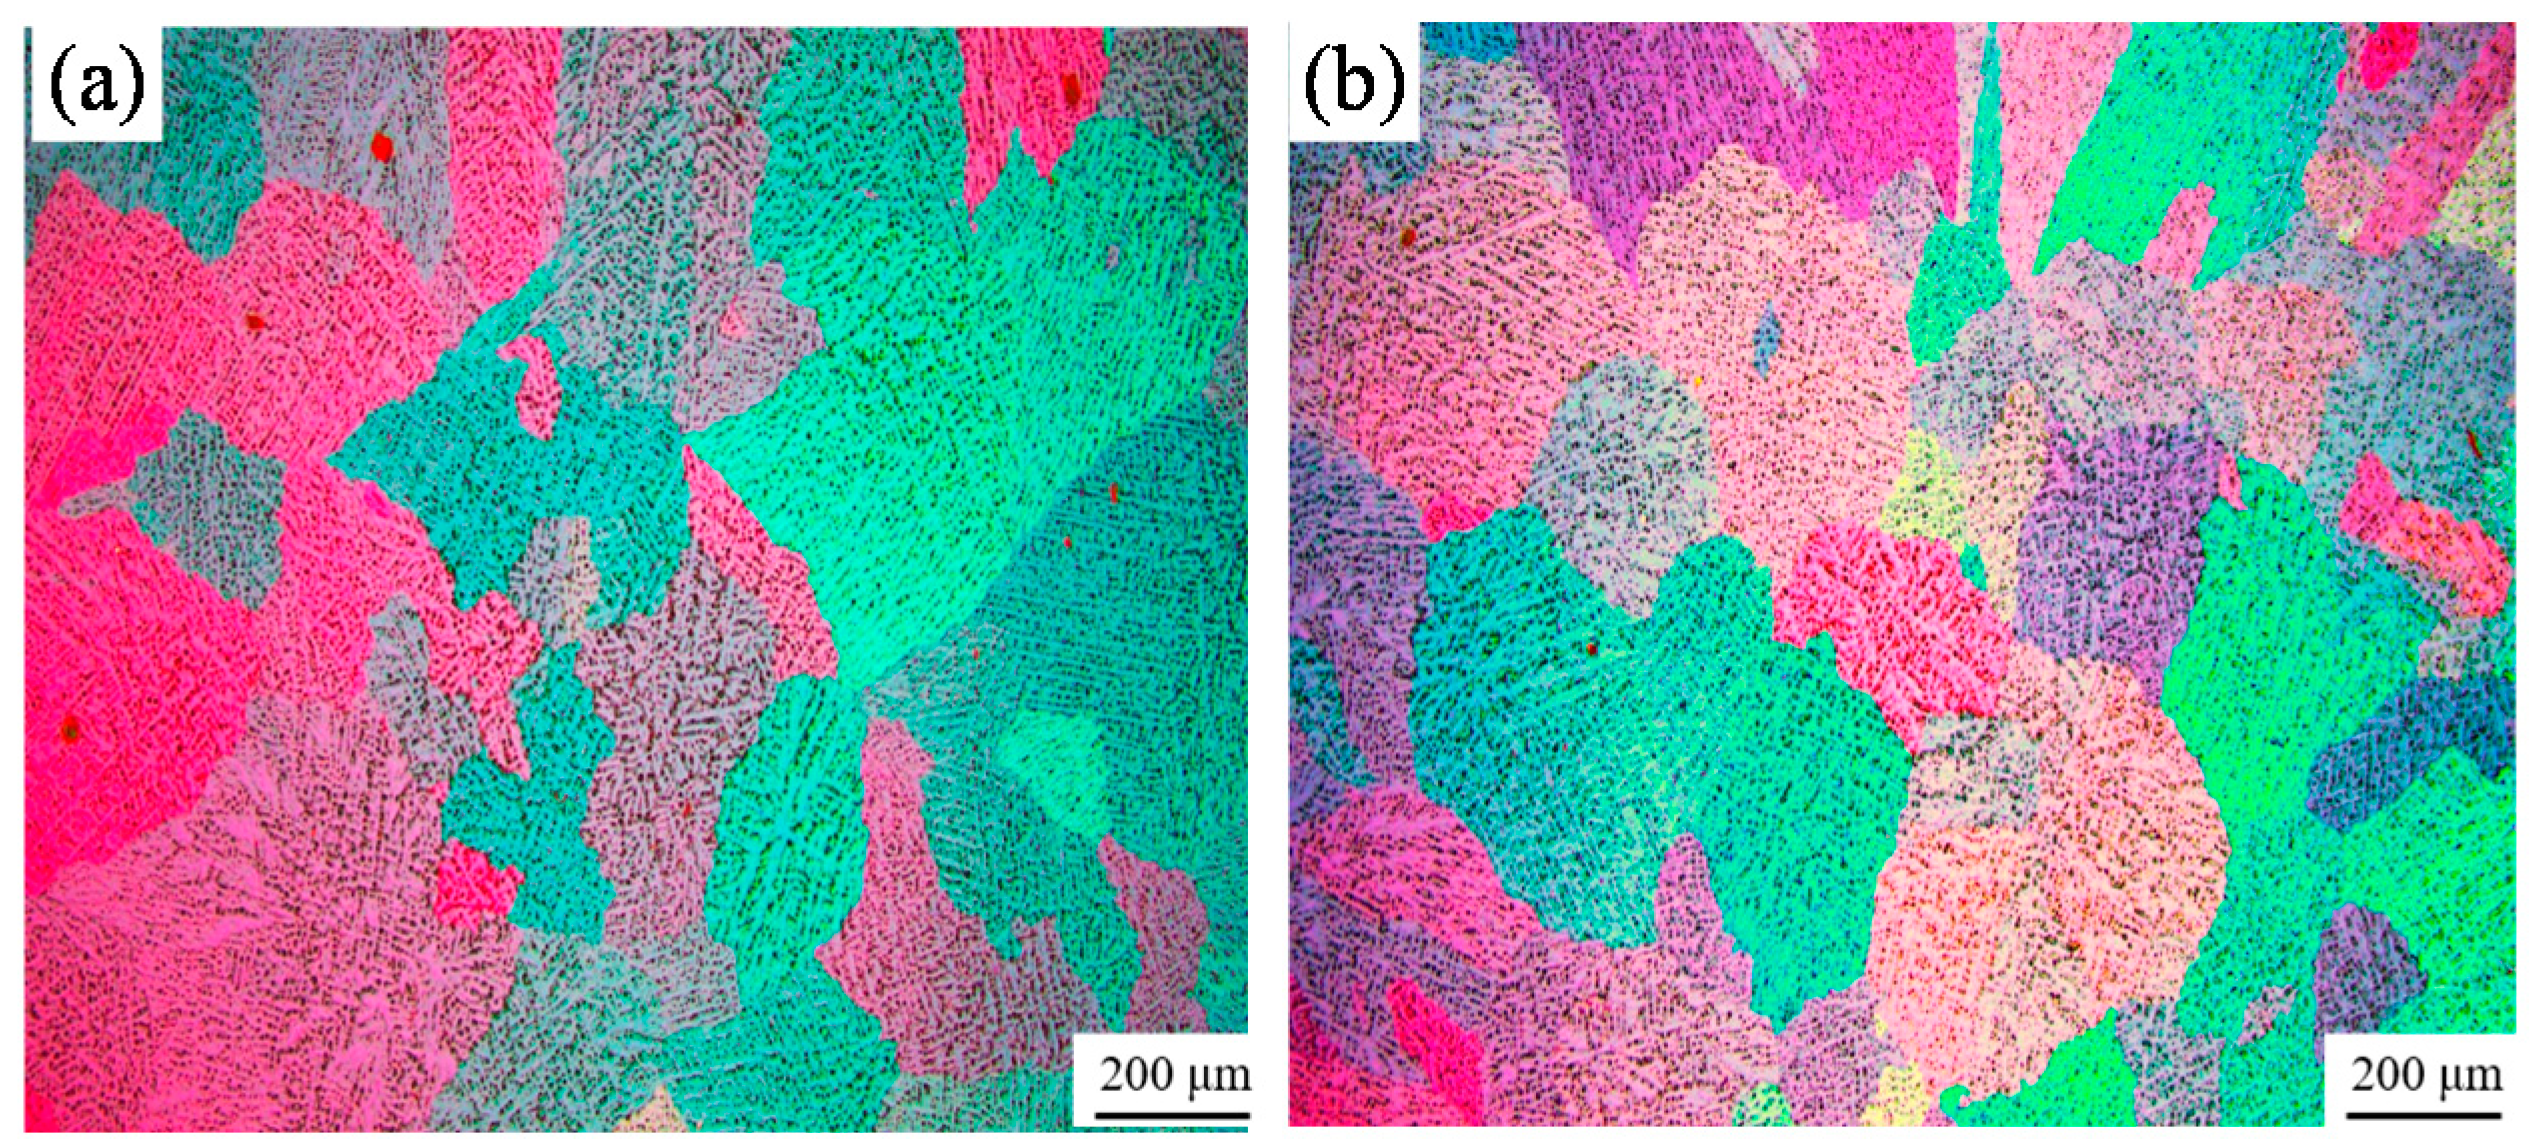
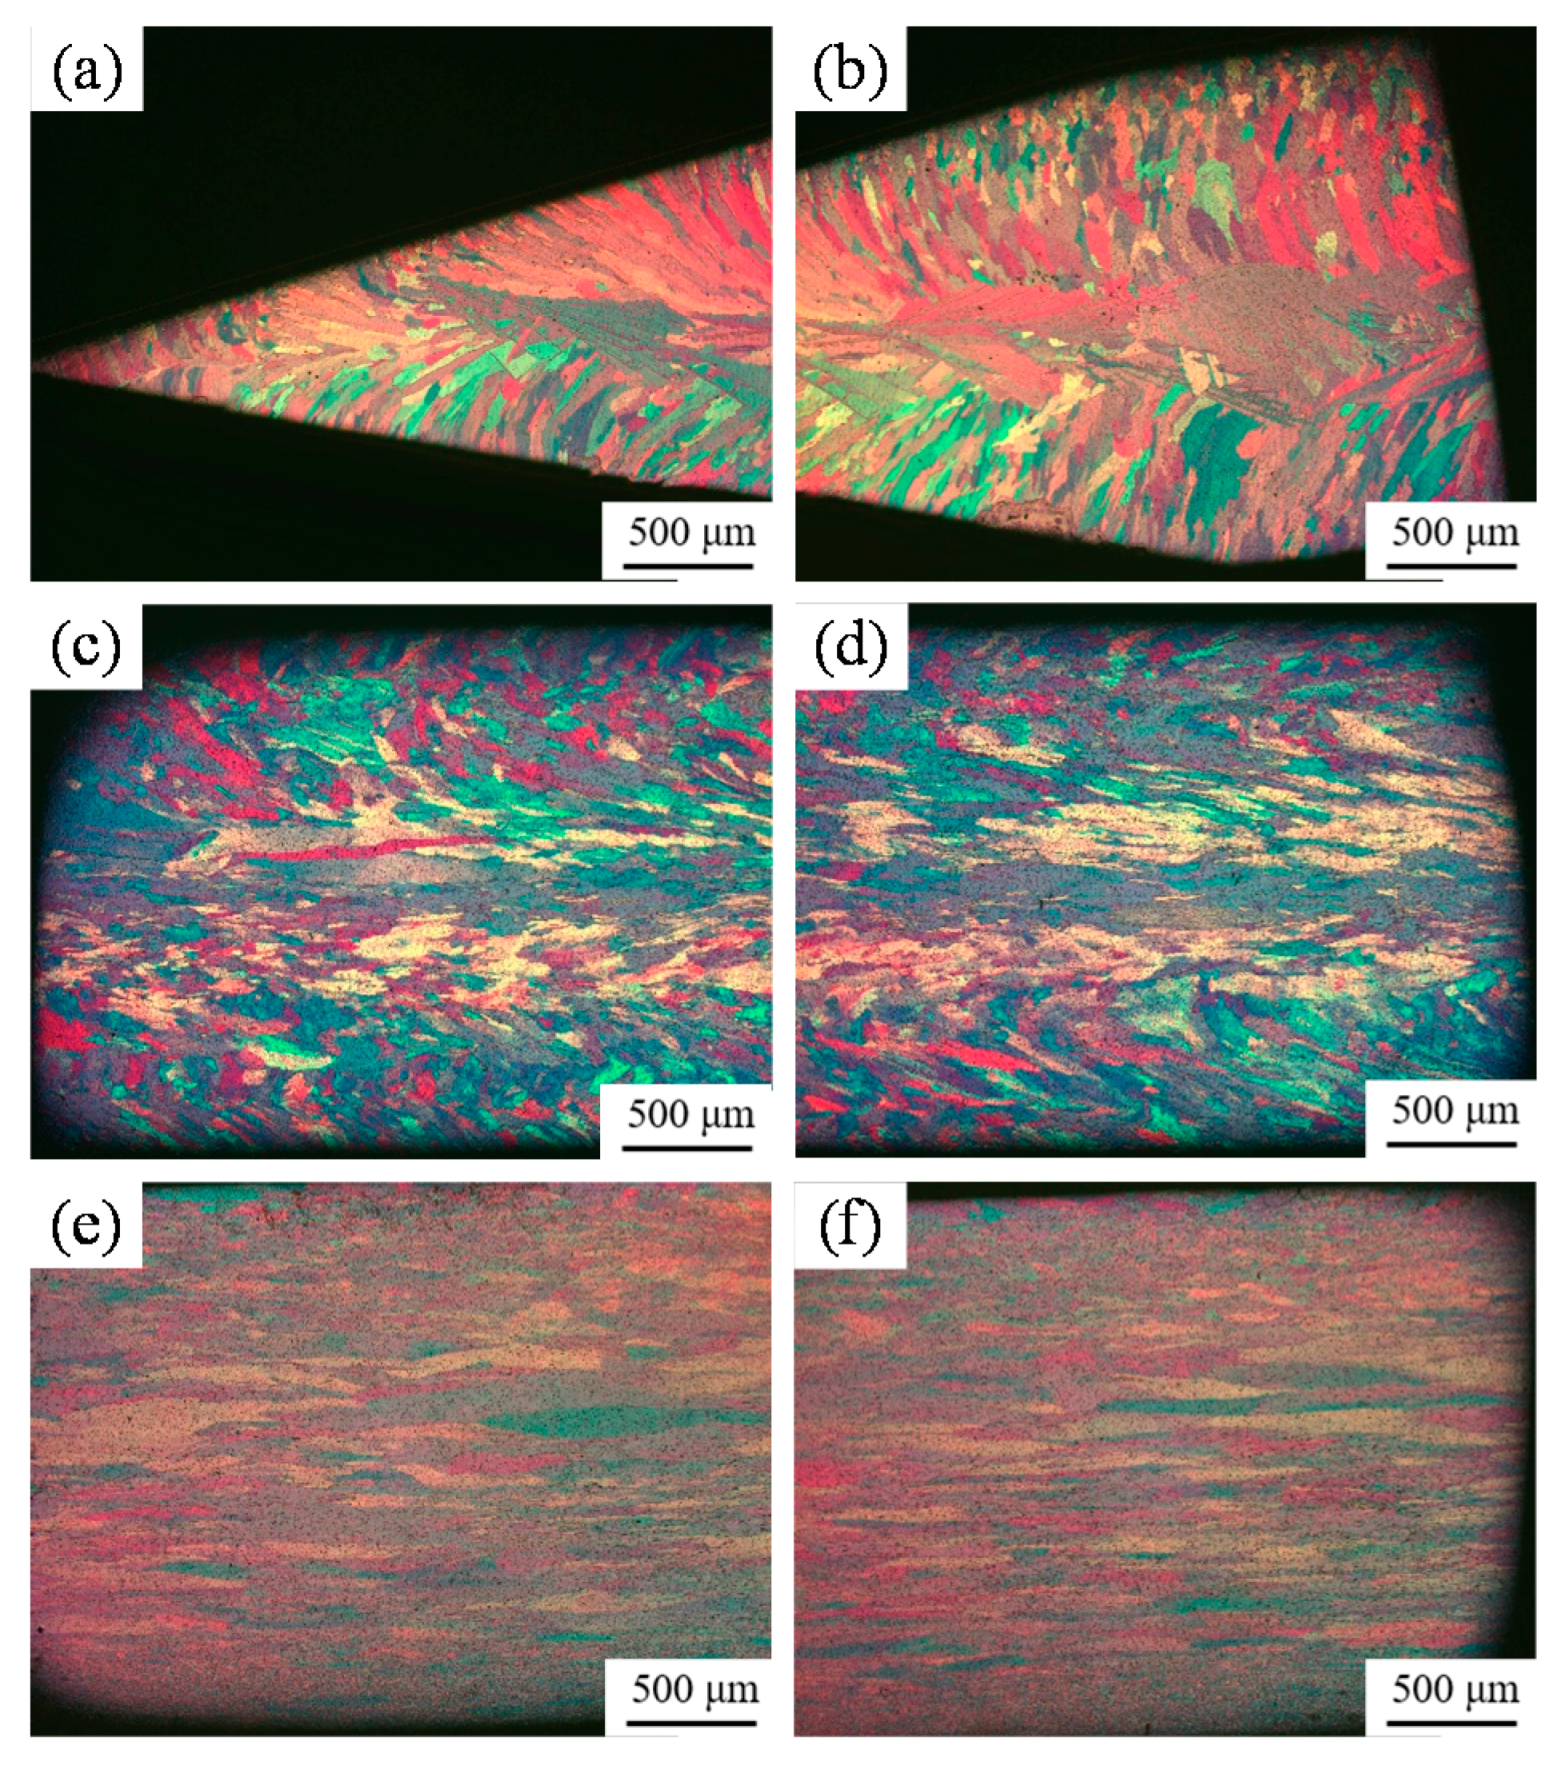
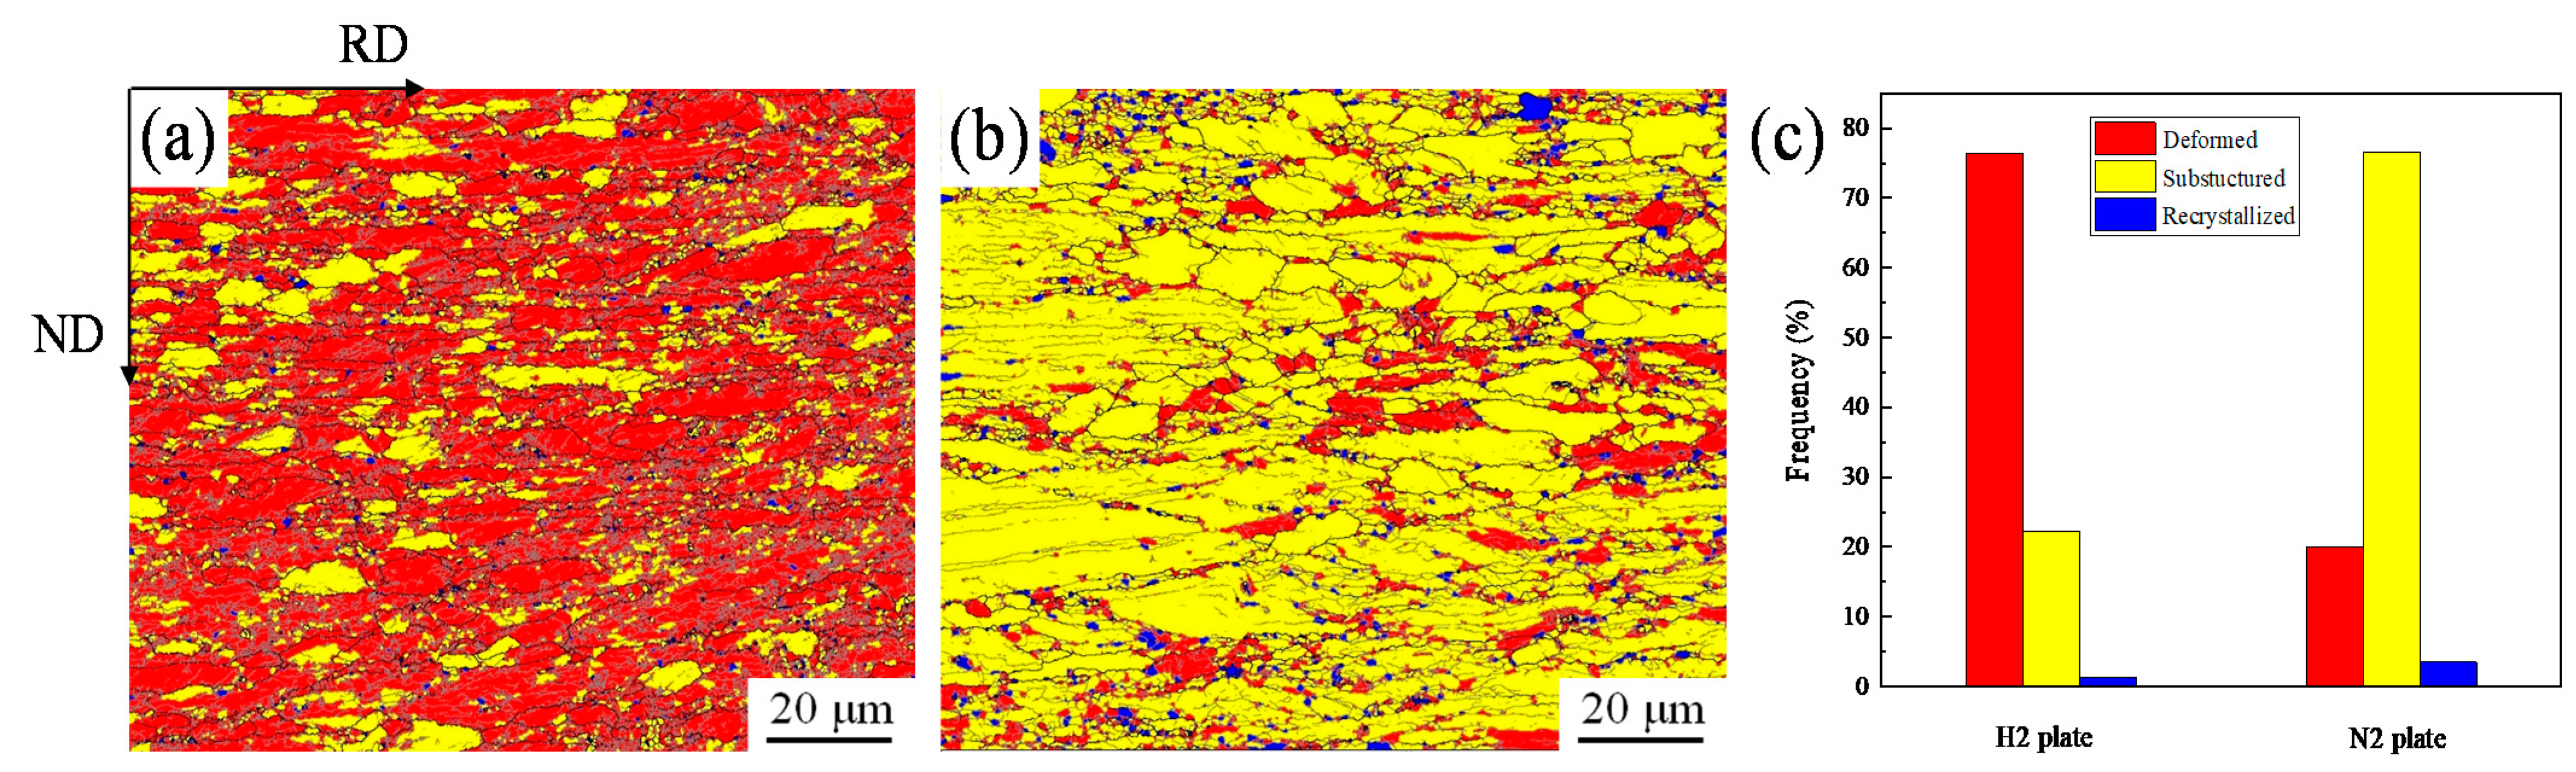
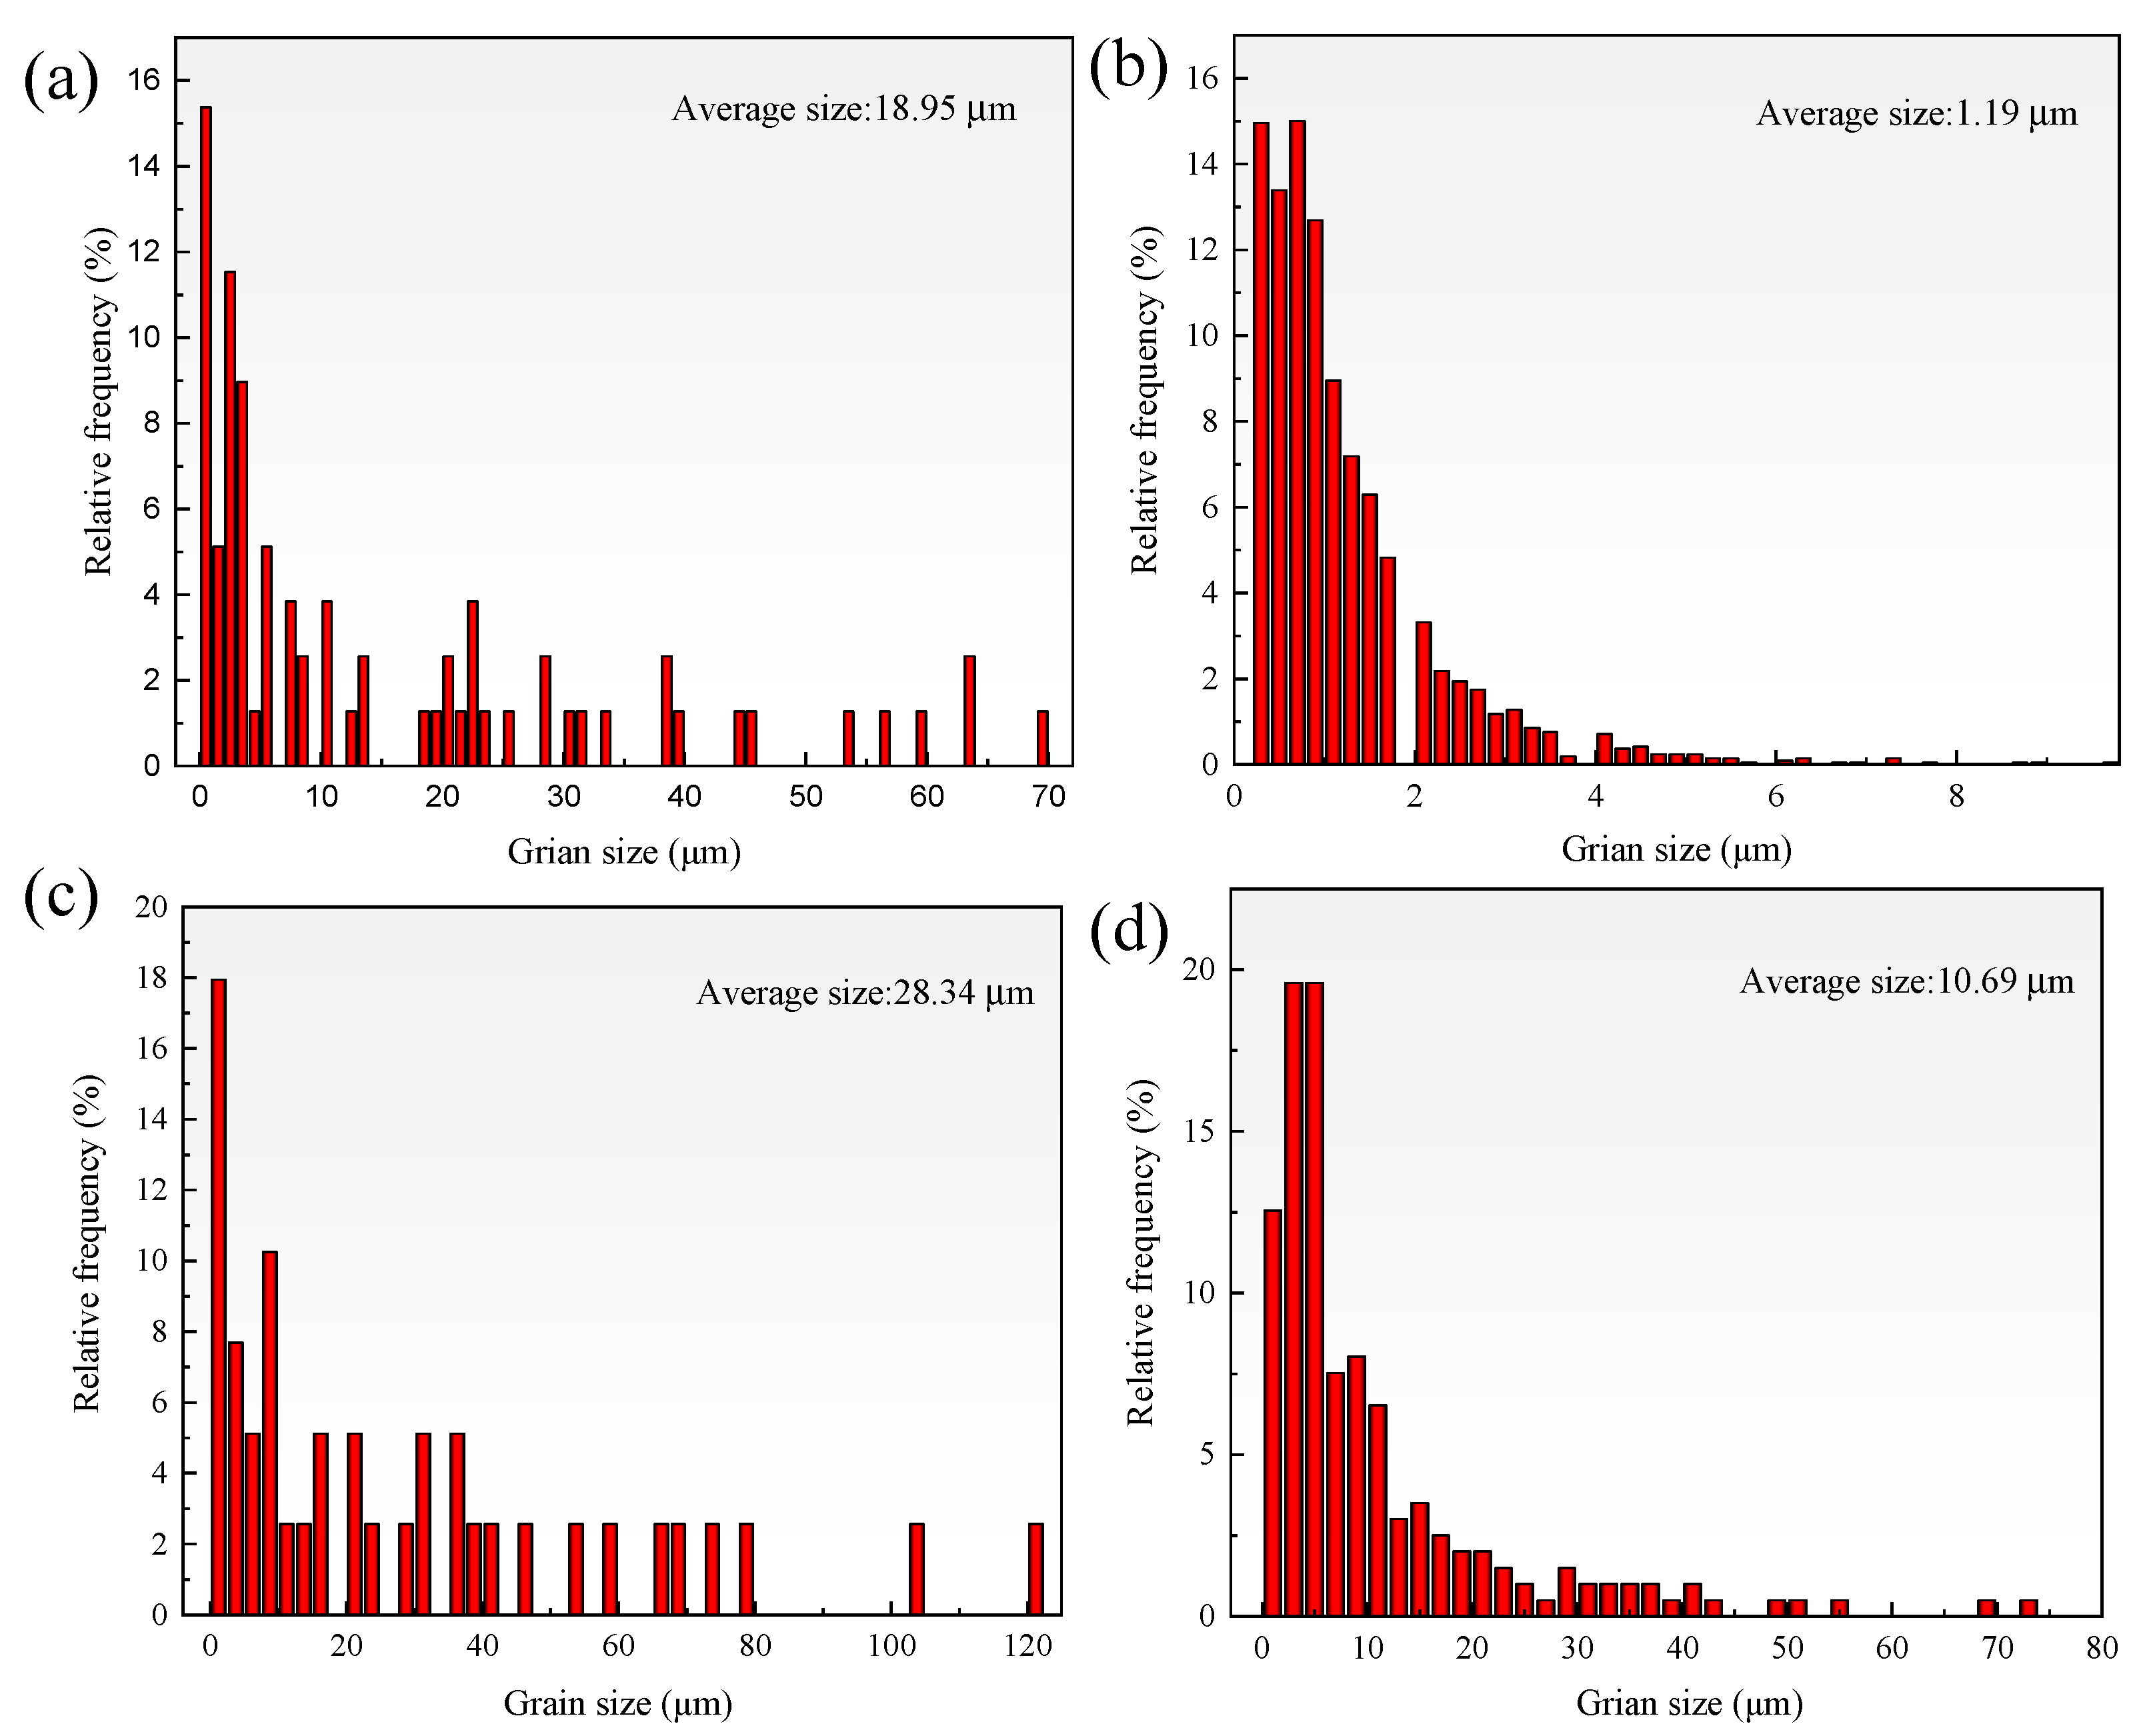
3.1. Grain Morphology and Grain Size
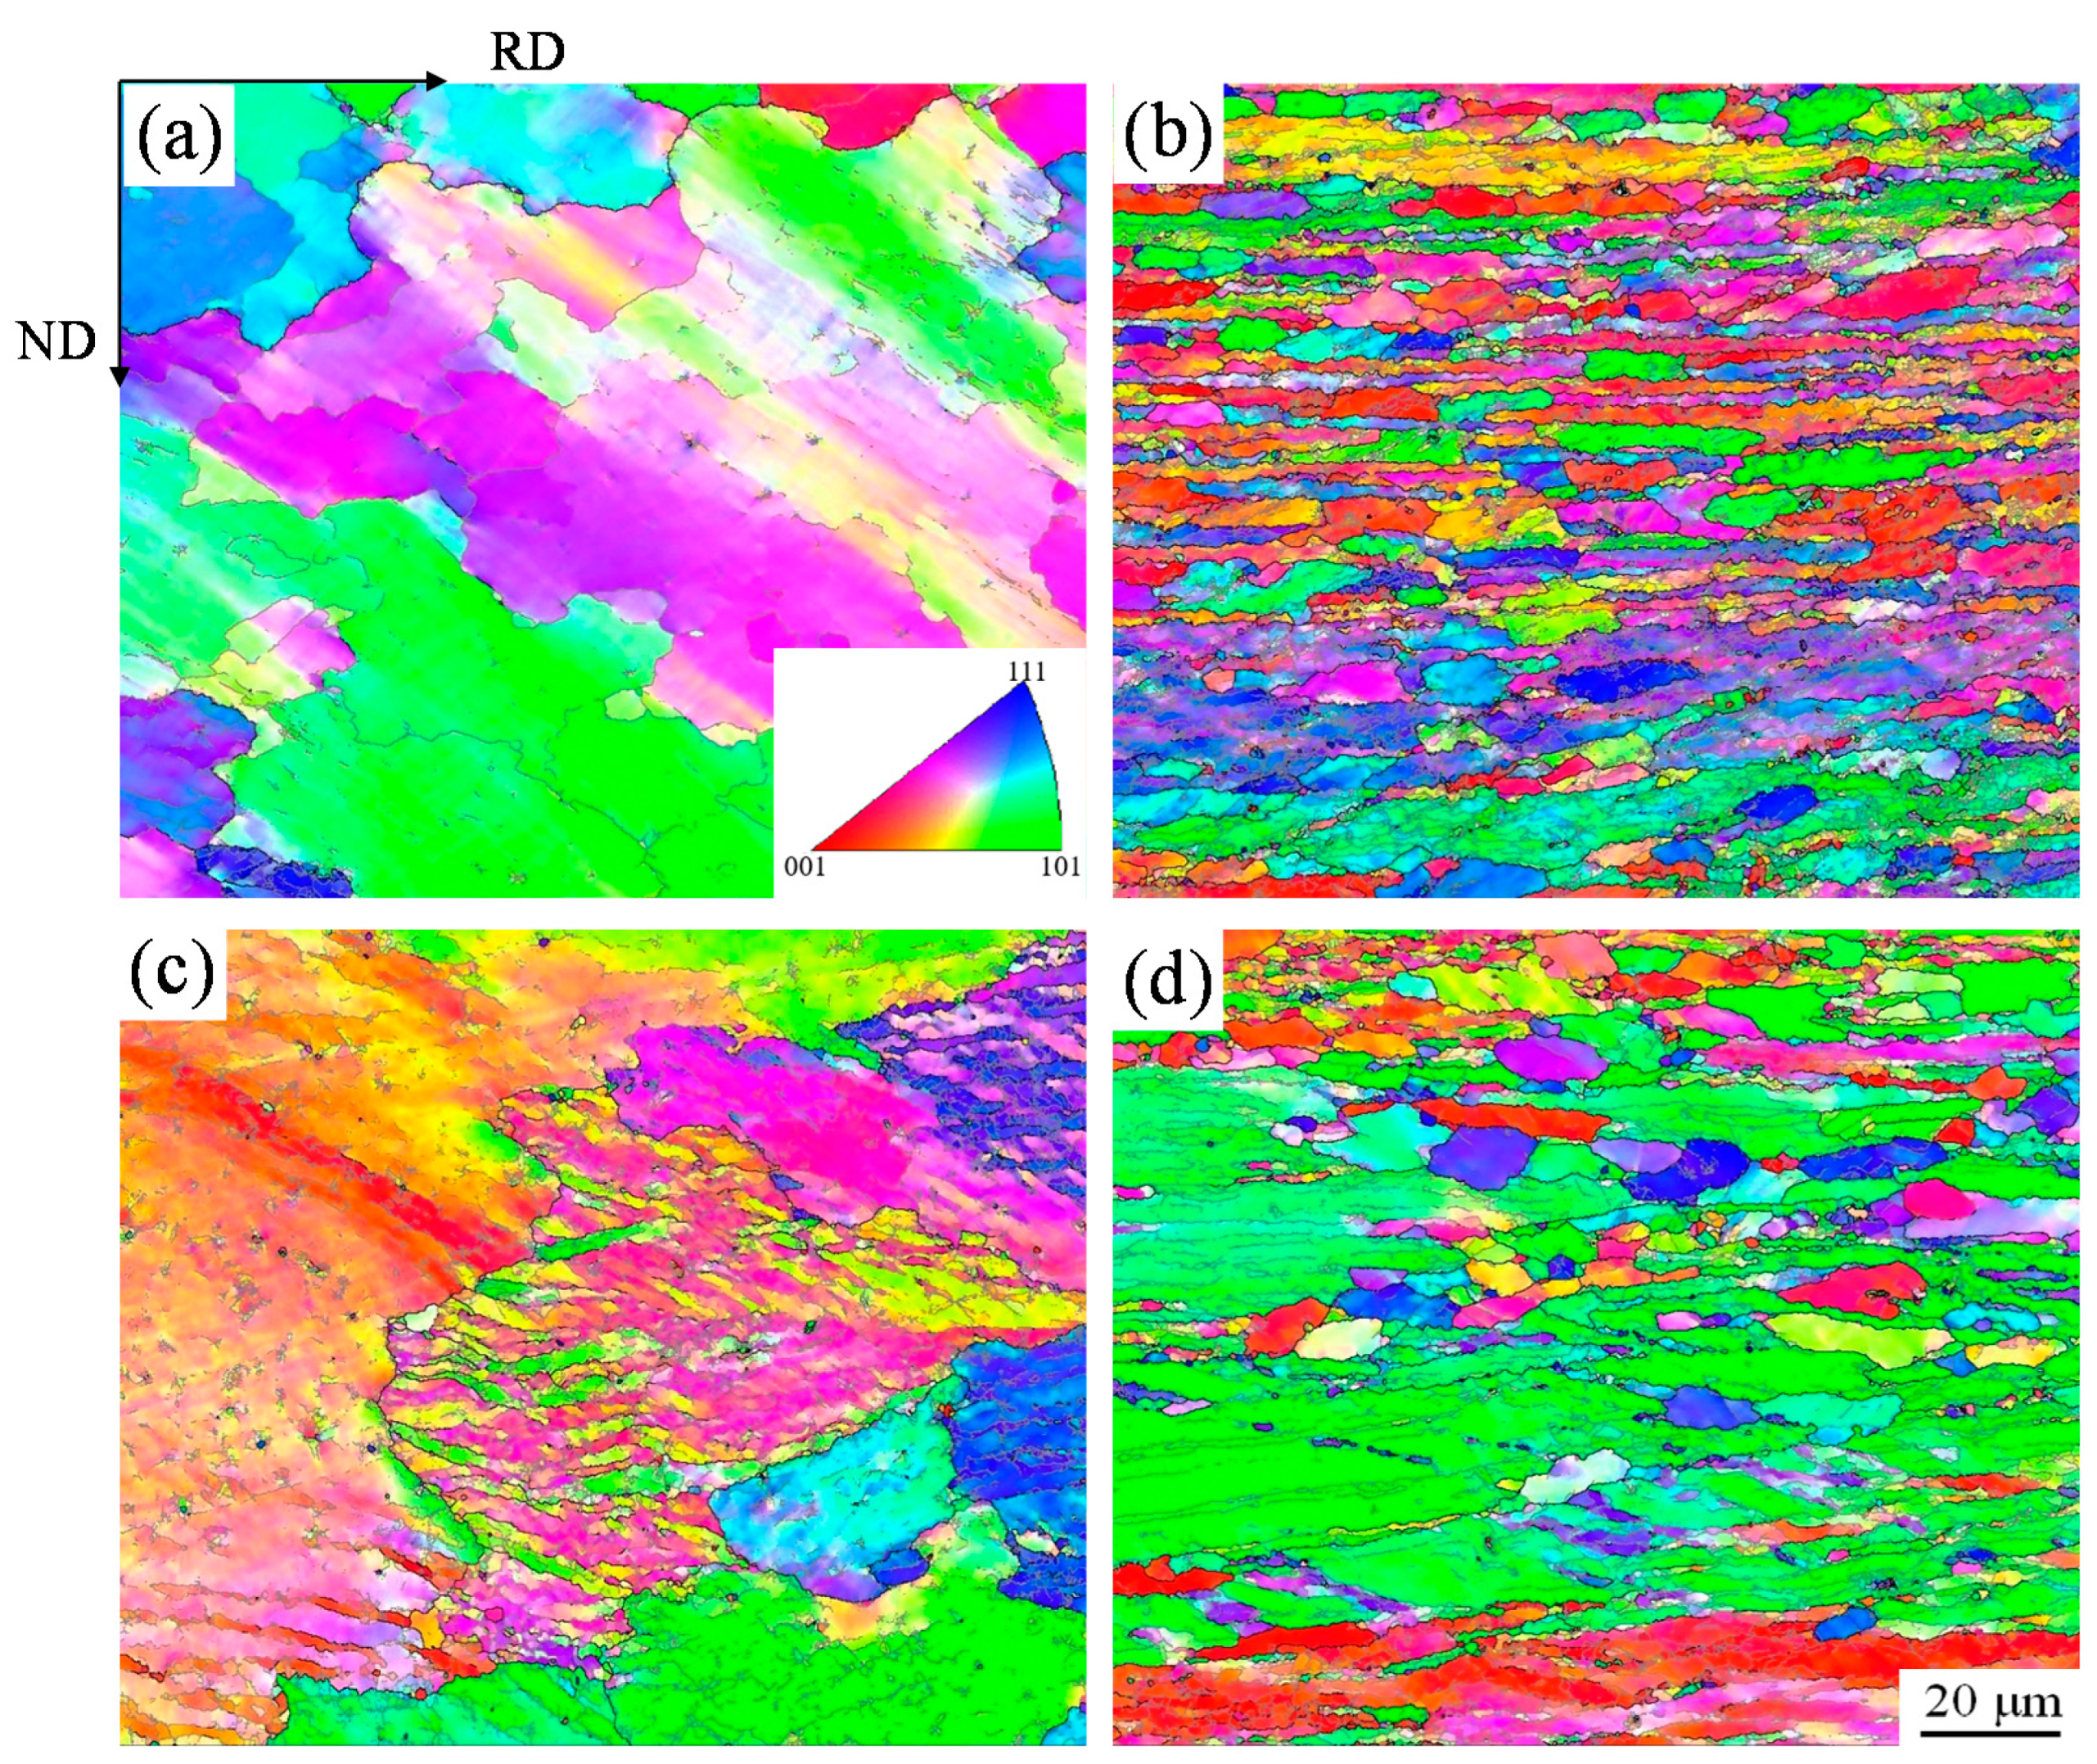
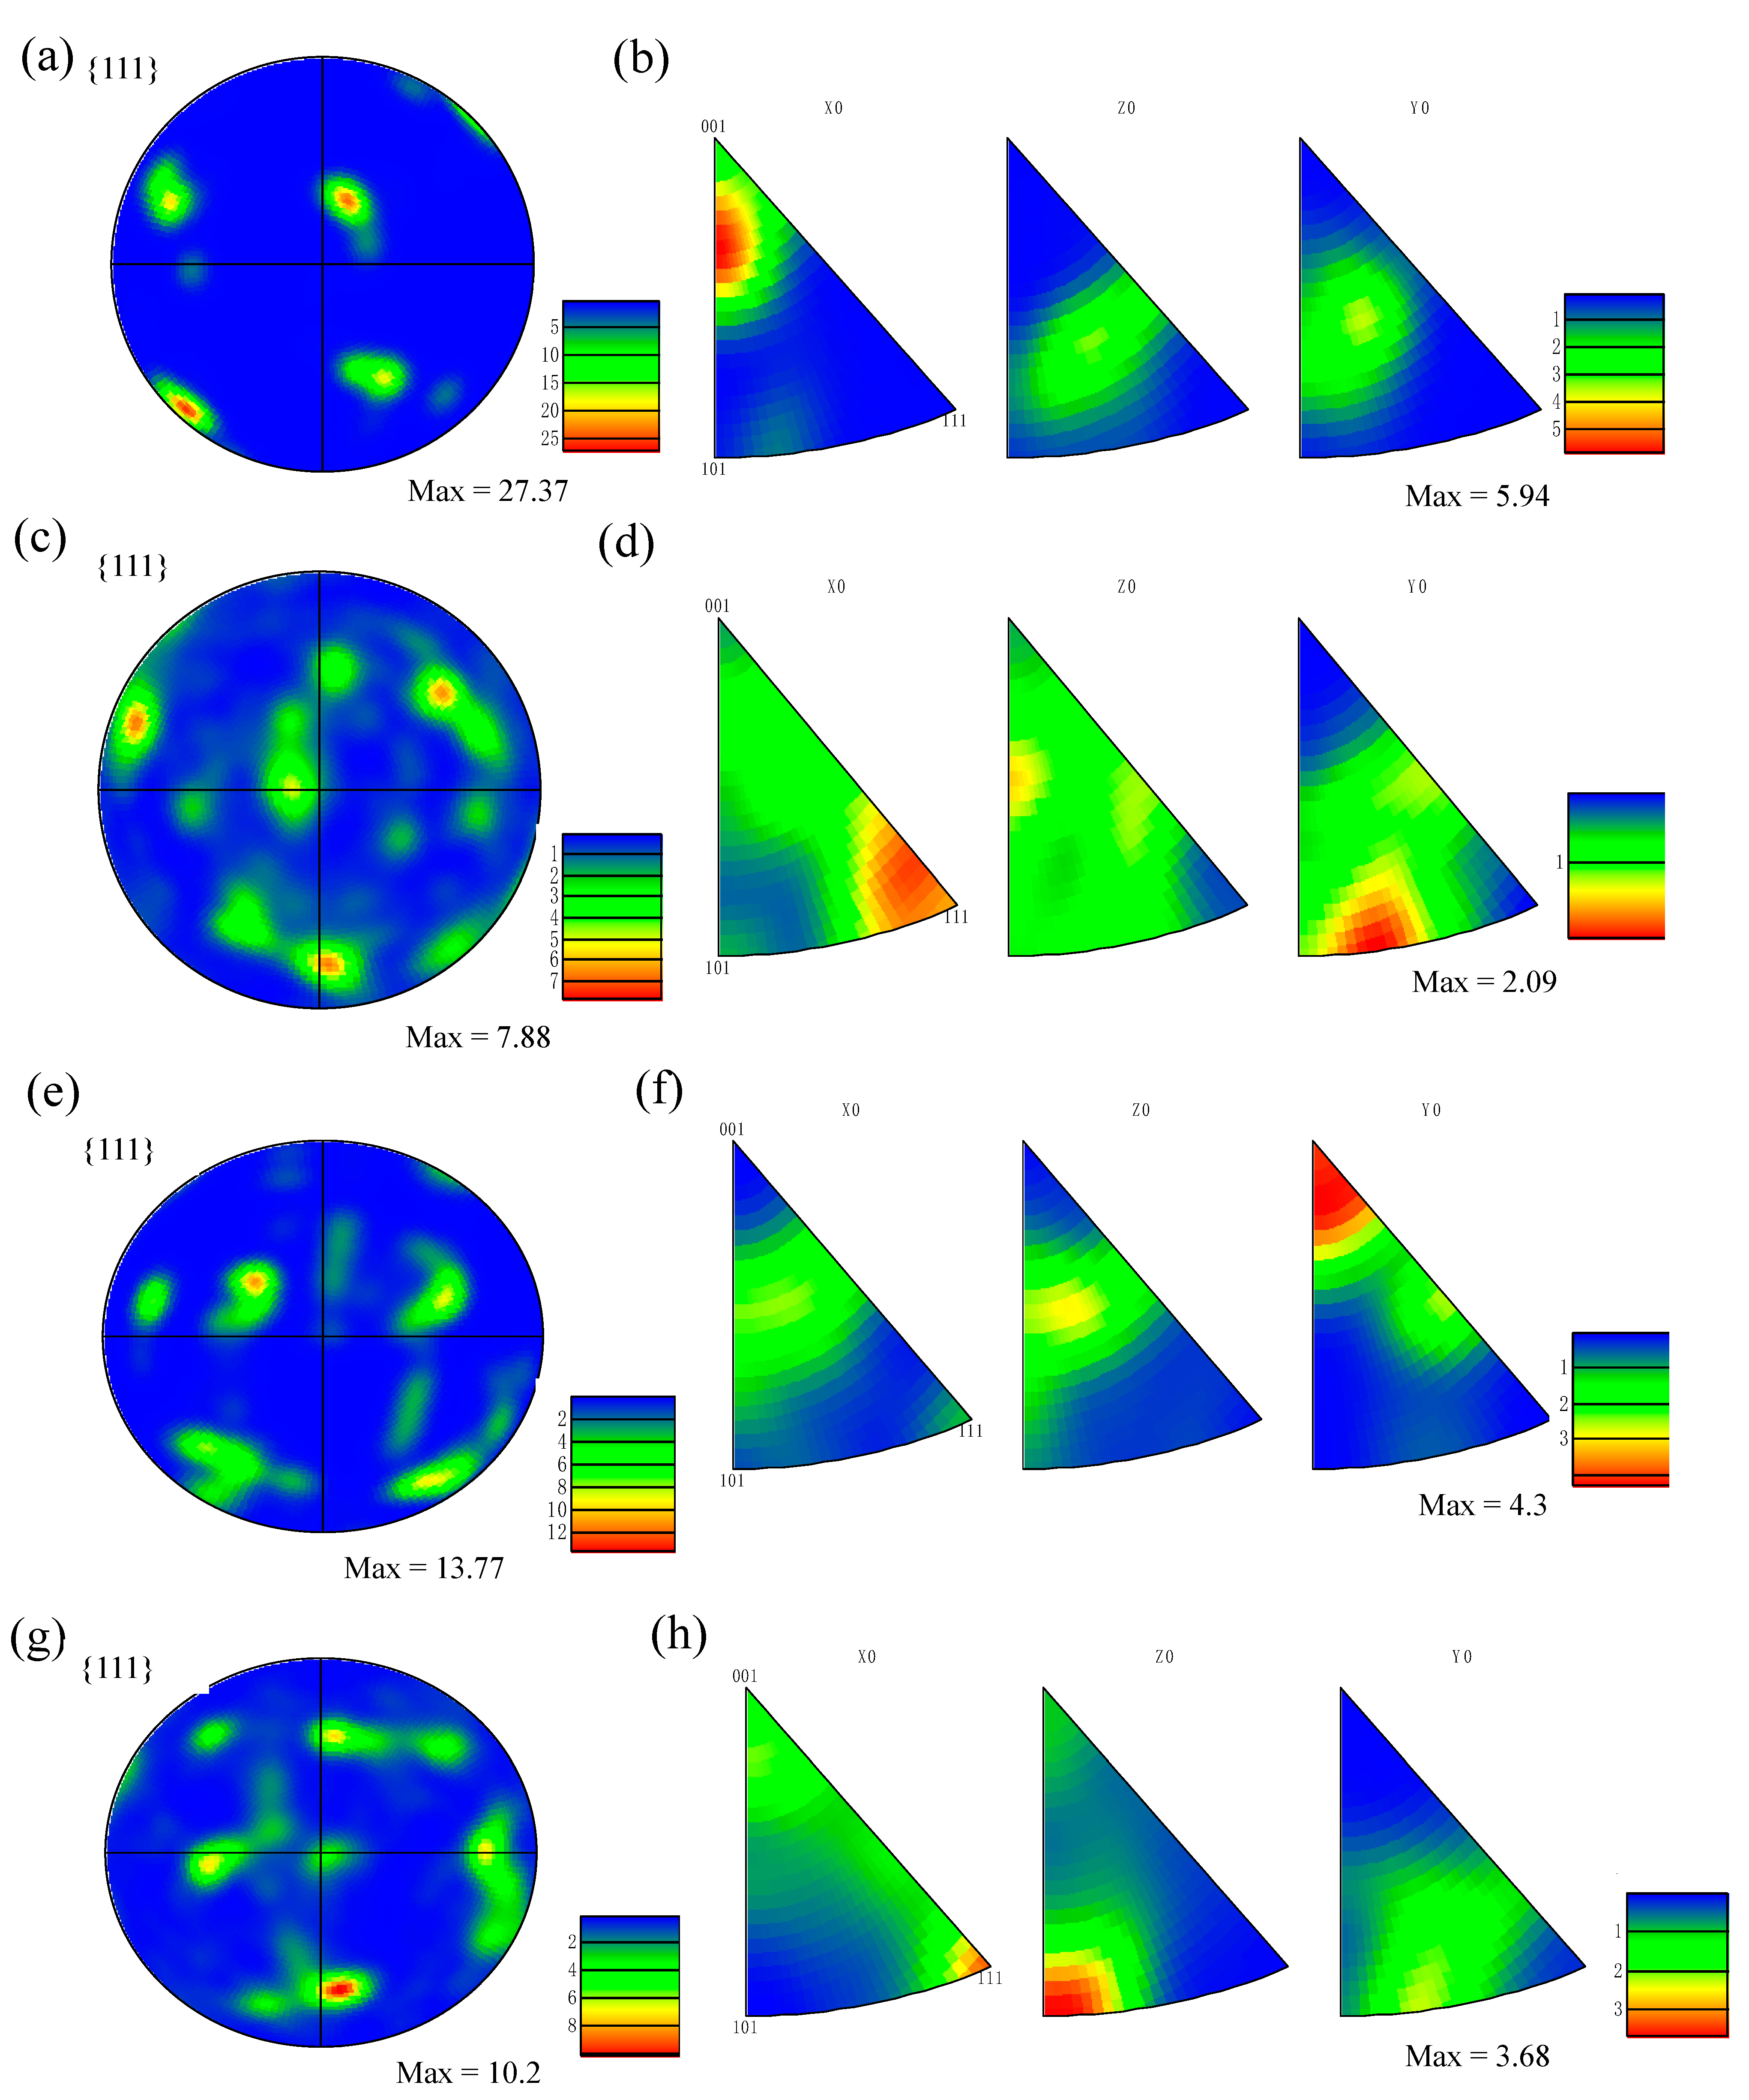
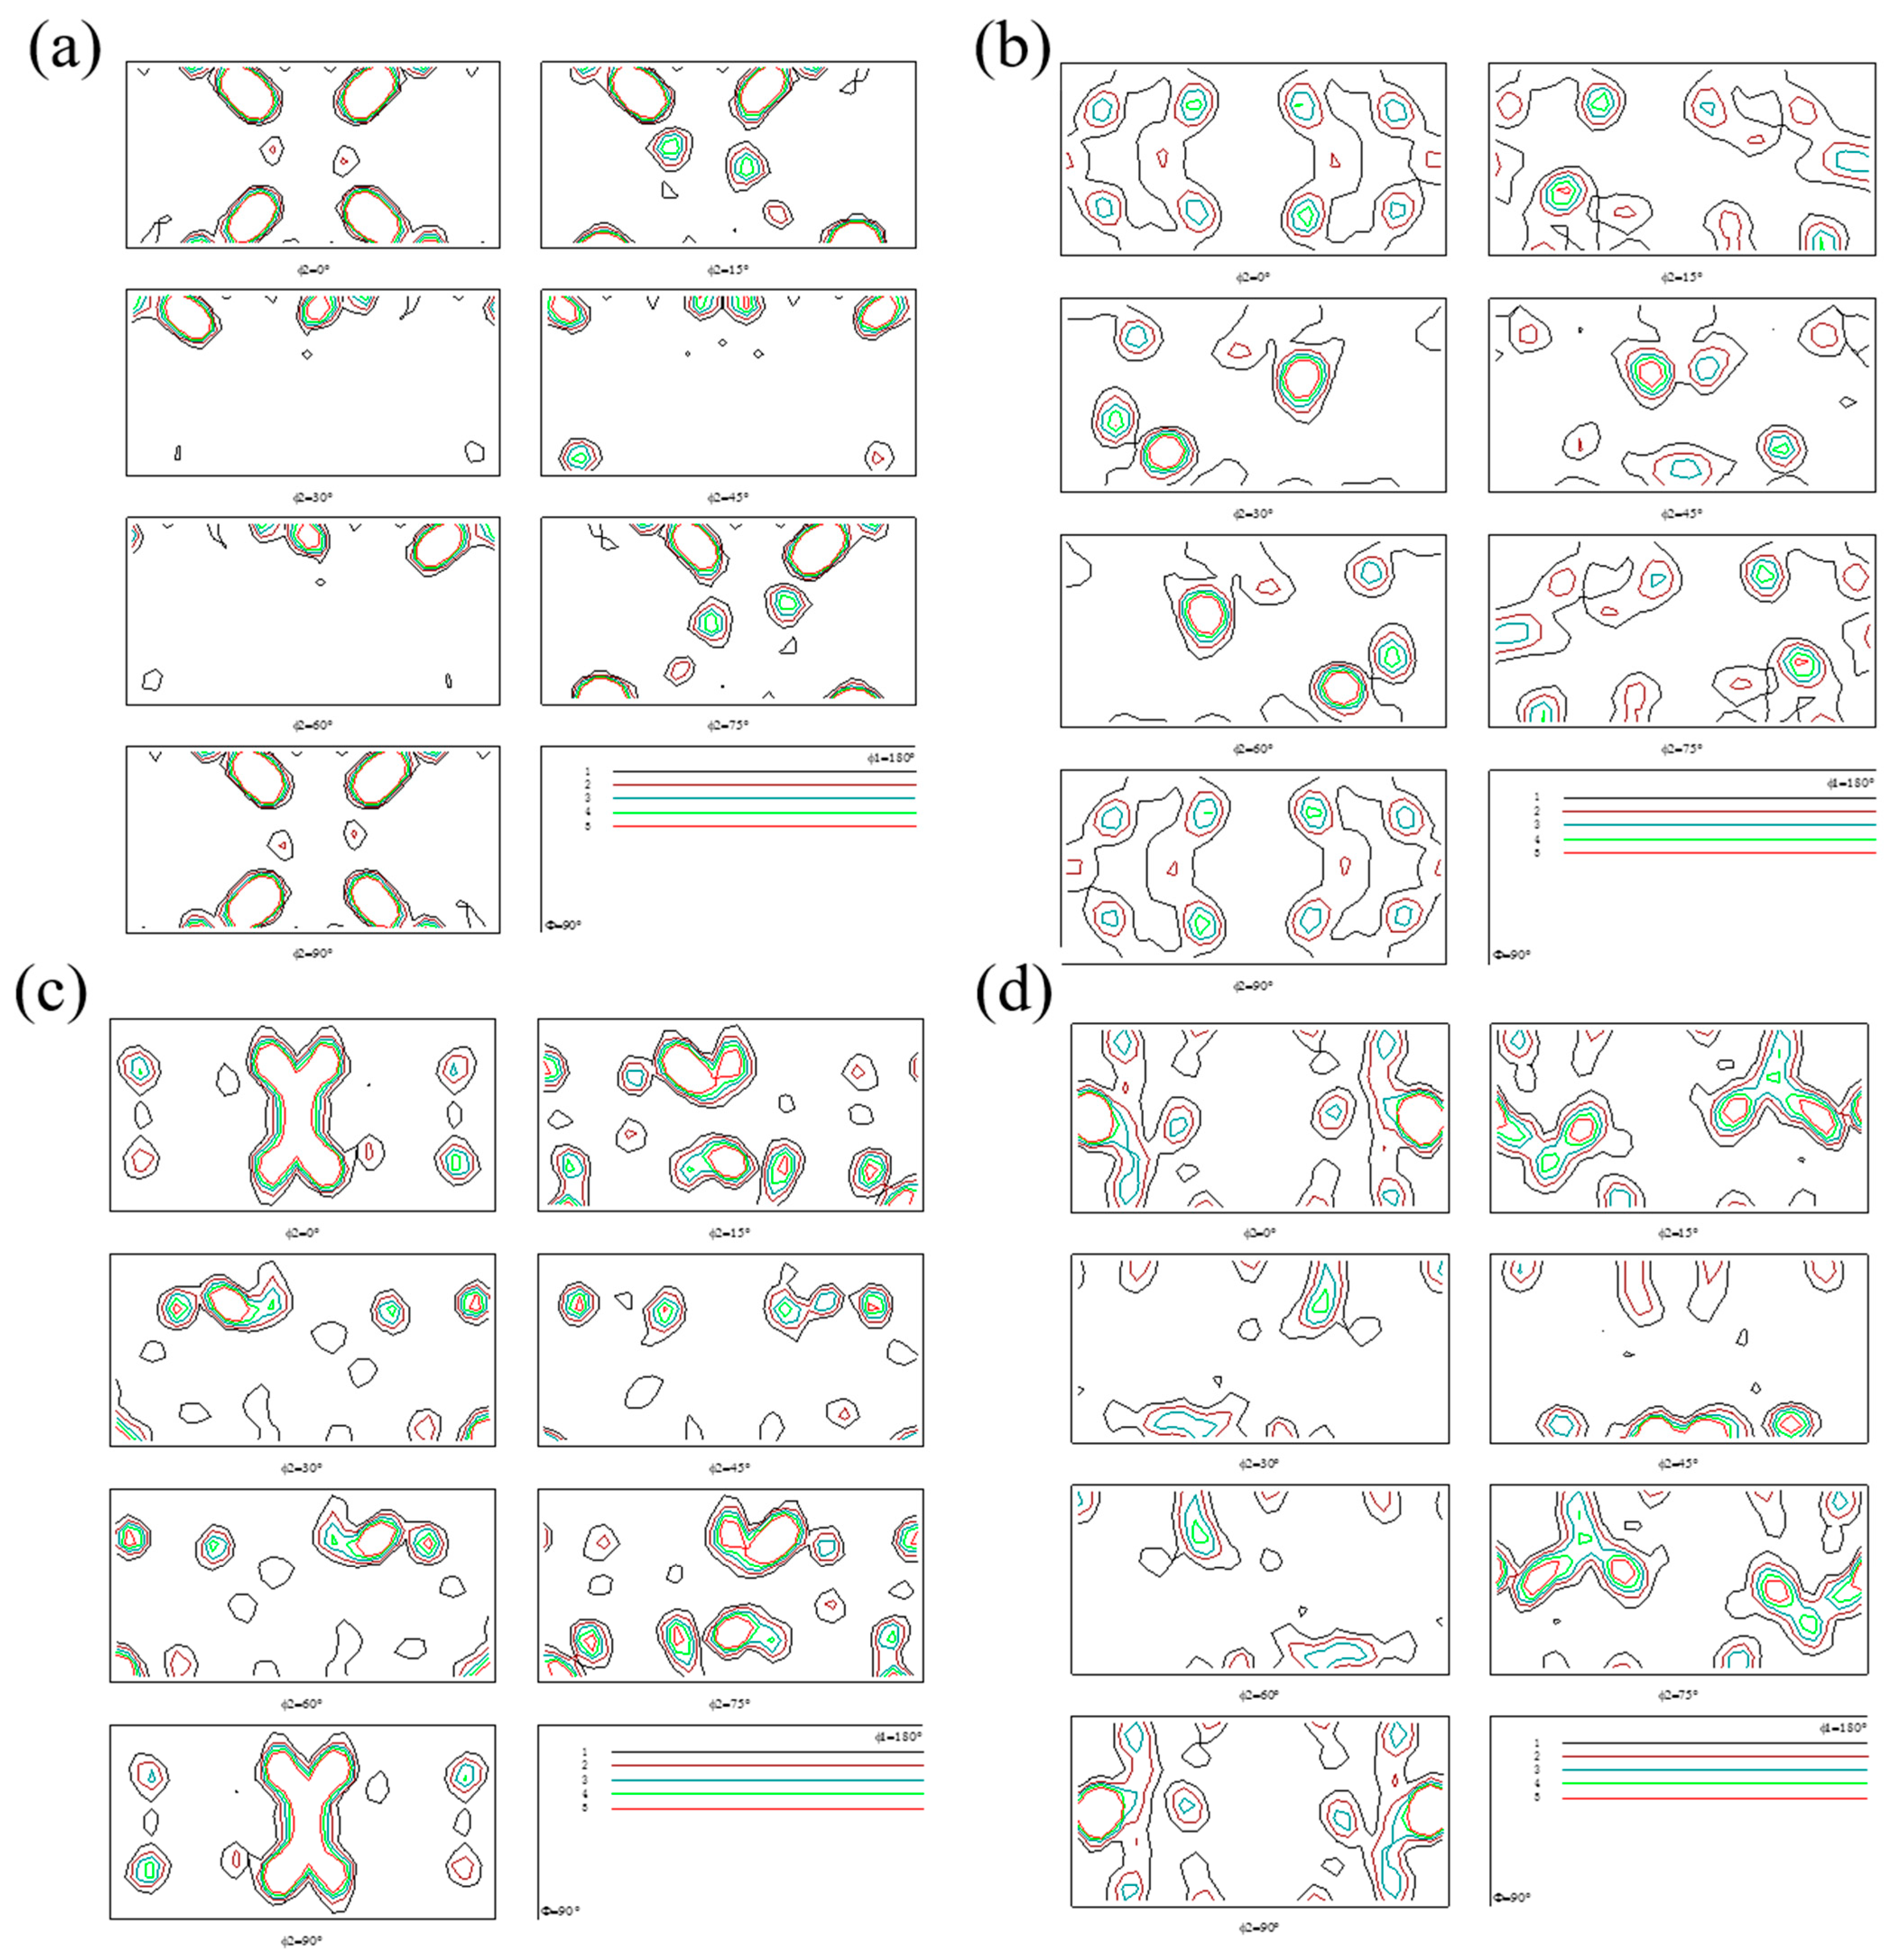
The as-cast metallographic structure of 1561 aluminum alloys is shown in Figure 2. It is observed that the grains on the surface of the 1561 aluminum alloy are approximately equiaxed, and the size distribution is uneven. The as-cast structure has a typical dendritic morphology, because the surface of the ingot has a fast-cooling rate, and there is not enough time and space for the grains to grow after nucleation; the preferential growth of the nucleated grains is caused by uneven distribution of surface temperature.
Further observation shows that compared with the microstructure before rolling (Figure 2), the sample is deformed by rolling, the grains are irregular in shape and size along the rolling direction, and the grains were elongated (Figure 3a–d). With the increase in rolling deformation, the grains are elongated more significantly. It can be found from Figure 3e–f that the grains of the H2 plate have a more delicate and slender fibrous structure than the H1 plate in Figure 3c–d with the increment of deformations. However, there is still a sizeable dendritic structure where there is no deformation at the tip of the rolled state in Figure 3a,b.

3.2. Micro-Texture

The inverse pole figure (IPF) of rolling direction by EBSD was shown in Figure 4, respectively. It is apparent at first glance that the microstructures and grain orientation of 1561 aluminum alloys have a noticeable difference between Figure 4a,c and Figure 4b,d with the increment of deformations. From the statistical results in the microscale, the grain size of the A2 plate is much smaller than the A1 plate. The EBSD maps the 1561 aluminum alloys, where the grey lines indicate low angle grain boundaries (LAGBs) with the misorientation angle lower than 2°, and the black lines indicate high angle grain boundaries (HAGBs) with the misorientation higher than 15°. It can be seen in Figure 4d with the 30% deformations after annealing, the grain orientation changes to a certain extent, and the grain orientation of the plate core is more evenly distributed in the <101> direction.
Quantitative analysis of deformed, substructured and recrystallized structures was obtained, as shown in Figure 5. The red, blue and yellow colors represent deformed structures, recrystallized structures and substructures, respectively. The deformed structure of the hot rolled 1561 aluminum alloy accounts for about 74.6%, the substructured structure is about 22.3%, while 76.6% of substructured structure was noticed in the microstructure of the annealed 1561 alloy. After annealing, the recrystallized structure fraction increased from 1.3% to 3.5%. It illustrated that work hardening plays a main role in the hot rolling processing. Only a slight recrystallization occurred in the hot rolling process, deformed structure and substructure have LAGBs. During the hot rolling process, due to the increase in deformation dislocations, the grains are coordinated with each other, and the slip system starts from different regions inside the grains to make them split to form various blocks, and the dislocations have a spontaneous direction. The trend of low-energy state combination gradually forms the sharp cell masses at the boundary, and the sub-grain boundary gradually forms. During the annealing process, the migration and disappearance of vacancies during the recovery process will not affect the microstructure, as long as the dislocation migration is involved. The changes in the microstructure caused by the migration and rearrangement of dislocations are mainly polygonal and sub-crystal formation and growth.
Figure 6 shows the variation of grain size calculated by the EBSD maps, and it shows that the average grain size of the H1 plate is 18.95 μm, while that of the H2 plate is 1.19 μm, respectively. After annealing, the average grain size of the N1 plate is 28.34 μm, while that of the N2 plate is 10.69 μm. The smaller grain size of the N2 plate is partially because of the existence of more deformations, which exist due to the energy of refinement grains and hinder the movement of grain boundaries. Additionally, it is noted from Figure 3e–f that there are many fiber textures in the ingot core of the H2 plate. Orientation imaging shows that there are many small-angle grain boundaries after deformation. They are all potential recrystallization nucleation sites. The grain size distribution is uneven, and individual grains grow abnormally.
Figure 7 shows the distribution of grain boundary misorientation of 1561 aluminum alloys plates at different states. It can be seen that all of the plates have LAGBs, and the ratio of LAGBs is increasing with the deformation increment. This is due to the large amount of deformation of the plate during the hot rolling process, causing some of the grains to crack, resulting in more LAGBs. The misorientation angles are mainly concentrated in the LAGBs with a proportion of 33–37%, while the proportion of HAGBs is increased from 4% to 15%. This reveals that there are a lot of dislocations in the alloy after hot rolling deformation. This result in Figure 7 is consistent with the result in Figure 5.
The accumulated deformation of the material influences the grain orientation and micro texture, which significantly affect the mechanical properties of the hot rolled alloys. It is well established that <001> and <111> are the two stable texture orientations in FCC materials deformed under tension [31]. Generally speaking, for face-centered cubic metals, the <101> and <111> orientations of the rolled plate are parallel to the rolling direction of the plate, and the aluminum alloy has a slip system in the direction of {111}<110>. The {111} pole figures of the rolling 1561 aluminum alloys were shown in Figure 8. The maximum value of texture intensity reached 27.37 mud at the 3% deformation plate. However, after annealing, the maximum value of texture intensity deceased for all plates. As seen, texture created by the hot rolling process is mainly distributed in rolling and transverse directions. When increasing the deformations, the maximum texture intensity of 2.09 mud occurred in the 〈111〉 crystal orientation in rolling direction. After annealing, the maximum texture intensity of 2.09 mud occurred in the 〈101〉 crystal orientation in the rolling direction. Strong (111) orientation texture of the H1 plate can be found. Compared with the hot rolling plate, the texture distribution of the annealed plate is less centralized, and the strength is lower. It is also noted that the deformation textures of the face-centered cubic crystals are mainly transformed from <001> to <101> and <111> orientations.
For further analysis, orientation distribution functions sections (ODFs) of φ = 0, 15°, 30°, 45°, 60°, 75° and 90° of the four samples were plotted in Figure 9. As seen, the main texture components of plates are (123) <634> S, (110) <100> Goss, (110) <112 > Brass and Fiber texture. However, the cube texture intensity of the N1 plate is more remarkable than that of the N2 plate. At the same time, some weak copper textures can be found in Figure 9. The differences in texture distributions between these two kinds of the plate are attributed to the deformations and annealing time [32]. With the increasing of deformations, the texture components become more and more concentrated.
Figure 10 shows the volume fraction of the main texture components of annealed 1561 aluminum alloys. It is illustrated that the most prevalent textures are different in the four plates: the most prevalent textures in the H1 plate are <110> Cubic, <111> Cubic, R-Goss, Copper textures, accounting for 48.8 vol.%, 9.1 vol.%, 4.32 vol.% and 9.1 vol.%, respectively, with the increasing deformation of 1561 aluminum alloys, the Goss and Brass deformation textures appeared and the copper and S textures increased, after annealed, the most prevalent textures in the N1 plate are <110> Cubic and (110) <110> R-Goss textures, accounting for 11.8 vol.% and 7.23 vol.%, respectively, the most prevalent textures in the N2 plate are <111> Cubic, <100> Cubic, (110) <100> Goss, (110) <112> Brass, (123) <634> S textures, accounting for 18.9 vol.%, 17.9 vol.%, 15 vol.%, 5.64 vol.% and 9.85 vol.%, respectively, the accumulated deformation results in the difference as mentioned above in the 1 and 2 plate. Moreover, the fraction of fiber component is higher than that of other components in all plates. A fairly high amount of (110) <100> Goss texture (15%) indicates the presence of the α-fiber running from Brass to Goss orientation. As a result, the central part of the plate has undergone a gradient deformation following the normal plane strain mode typical of the FCC crystal [33,34]. It was reported that the Brass texture component is stable during rolling but becomes unstable due to other deformation [35]. Thus, in this study, the variation of the fraction of Cubic, S, Brass and the Goss texture components reflect that the increased deformation. Gradient hot rolling further provides shear strain, resulting in different proportions of deformation textures (brass and R-Goss) in the rolled plate. The gradient hot rolling increases the fiber texture orientation grains due to plane strain.

3.3. Mechanical Properties of Annealed 1561 Aluminum Alloy

Figure 11 shows the hardness variation with gradient deformation of the whole plate after annealed. With the increment of deformation, both the hardness and EC increases. The hardness value increased from 83.8 HV up to as high as 104 HV, and the electrical conductivity value increased from 23.5 %IACS to 24.3 %IACS. Obviously, during the rolling process, gradient deformation of 1561 aluminum alloy not only refined the grains, but produced complete fiber structure in the core of the ingot, it can be seen from the foregoing that the structure of the alloy becomes more orderly, and the electrical conductivity increases. During the annealing process, the migration and disappearance of vacancies during the recovery process will not affect the microstructure, as long as the dislocation migration is involved. Recovery reduces the crystal defects of the 1561 aluminum alloy, especially the concentration of point defects, so that the unevenness of the lattice electric field is reduced, and the electrical conductivity of the aluminum alloy is increased.

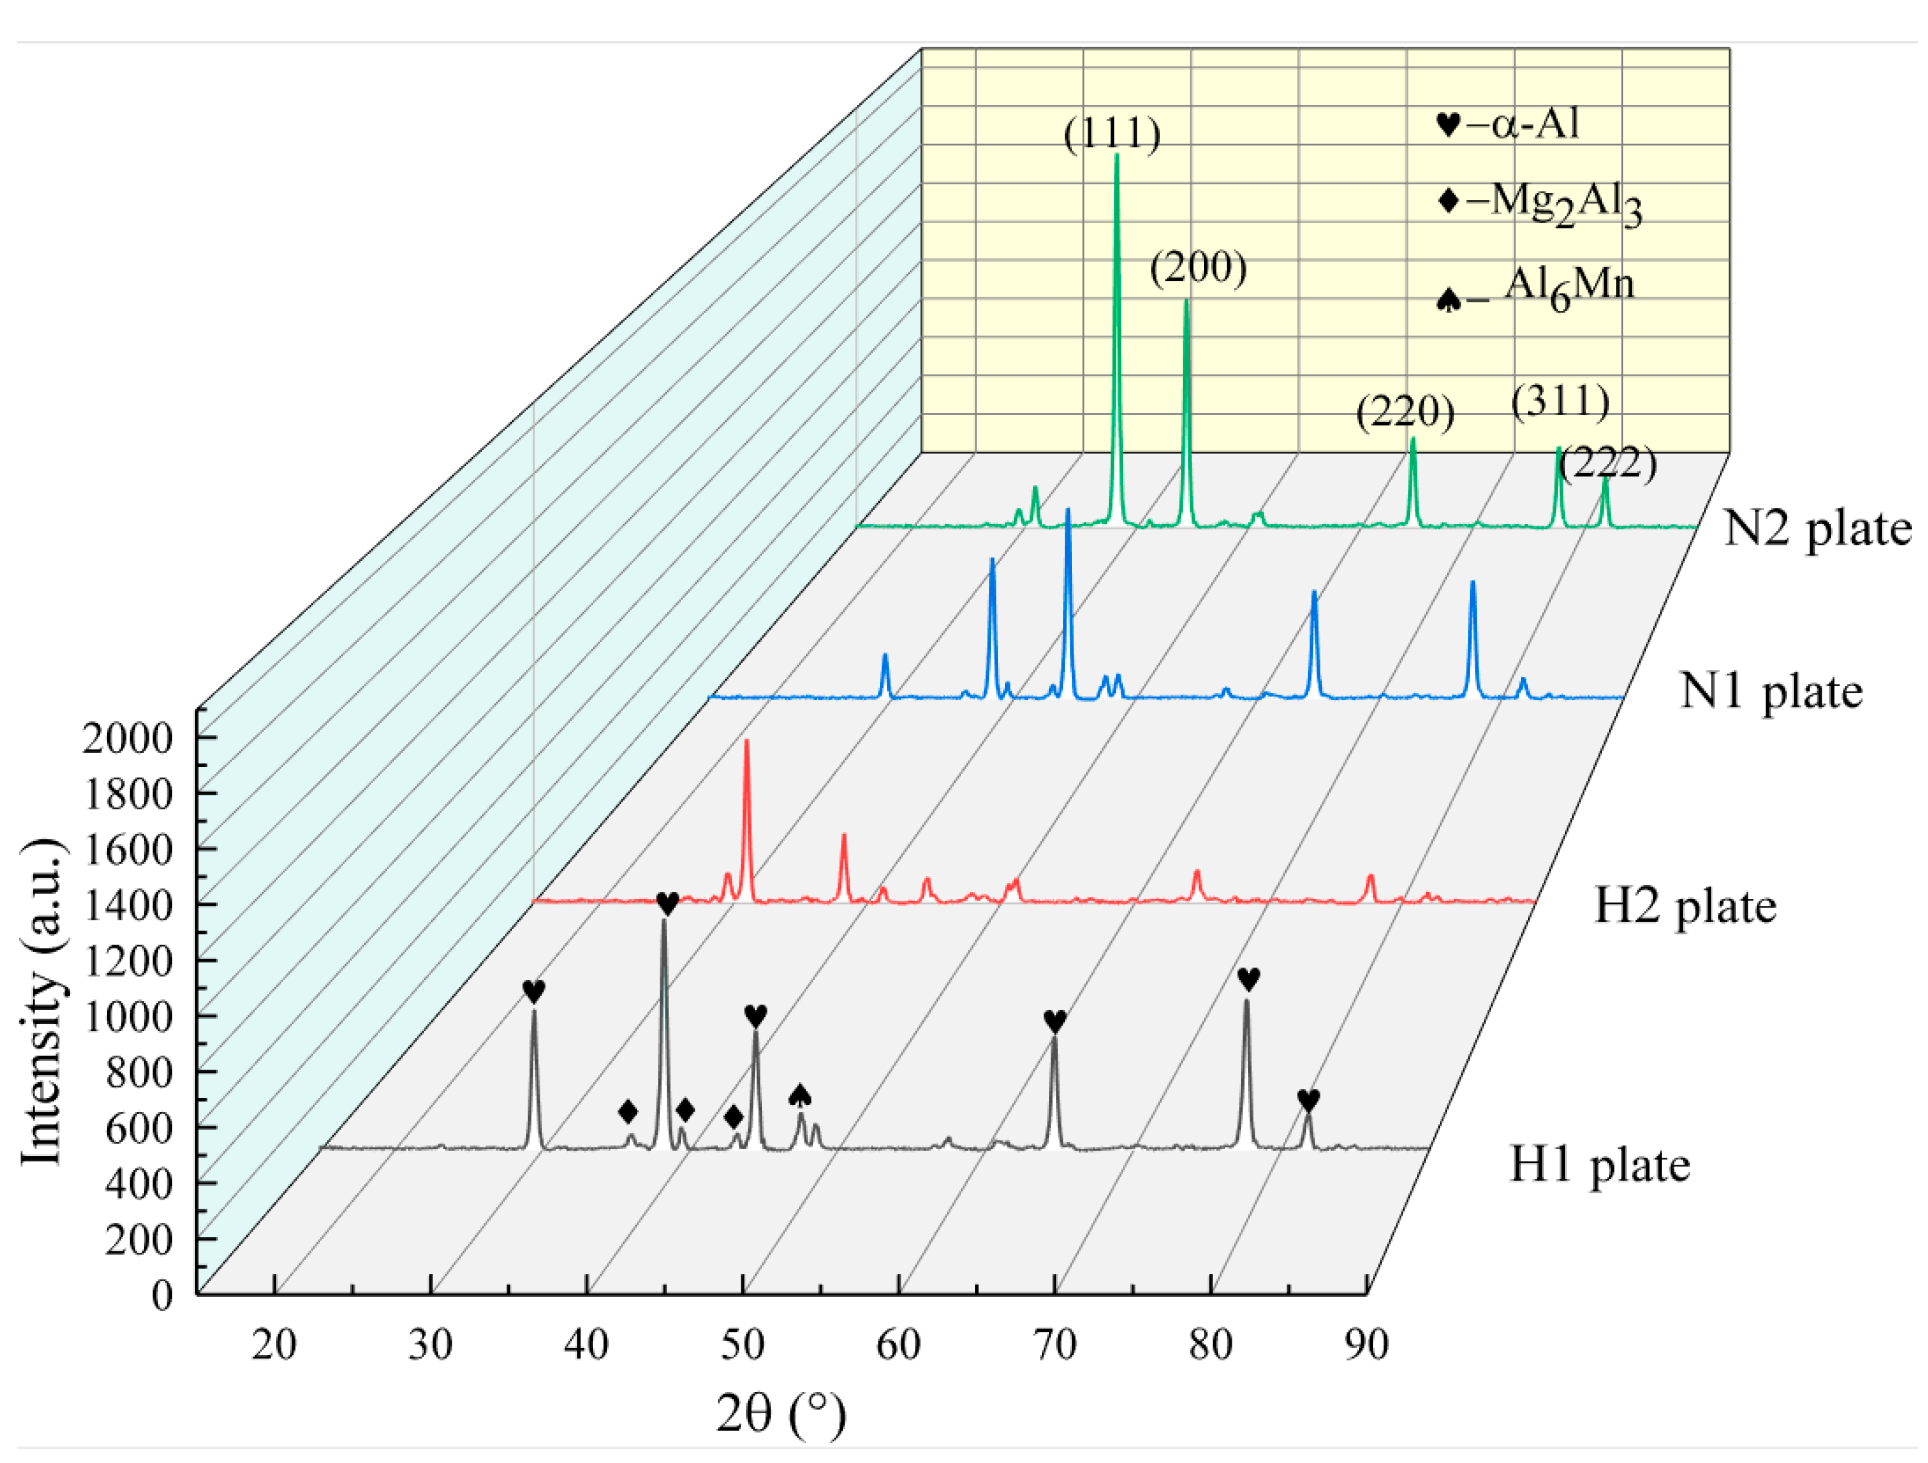
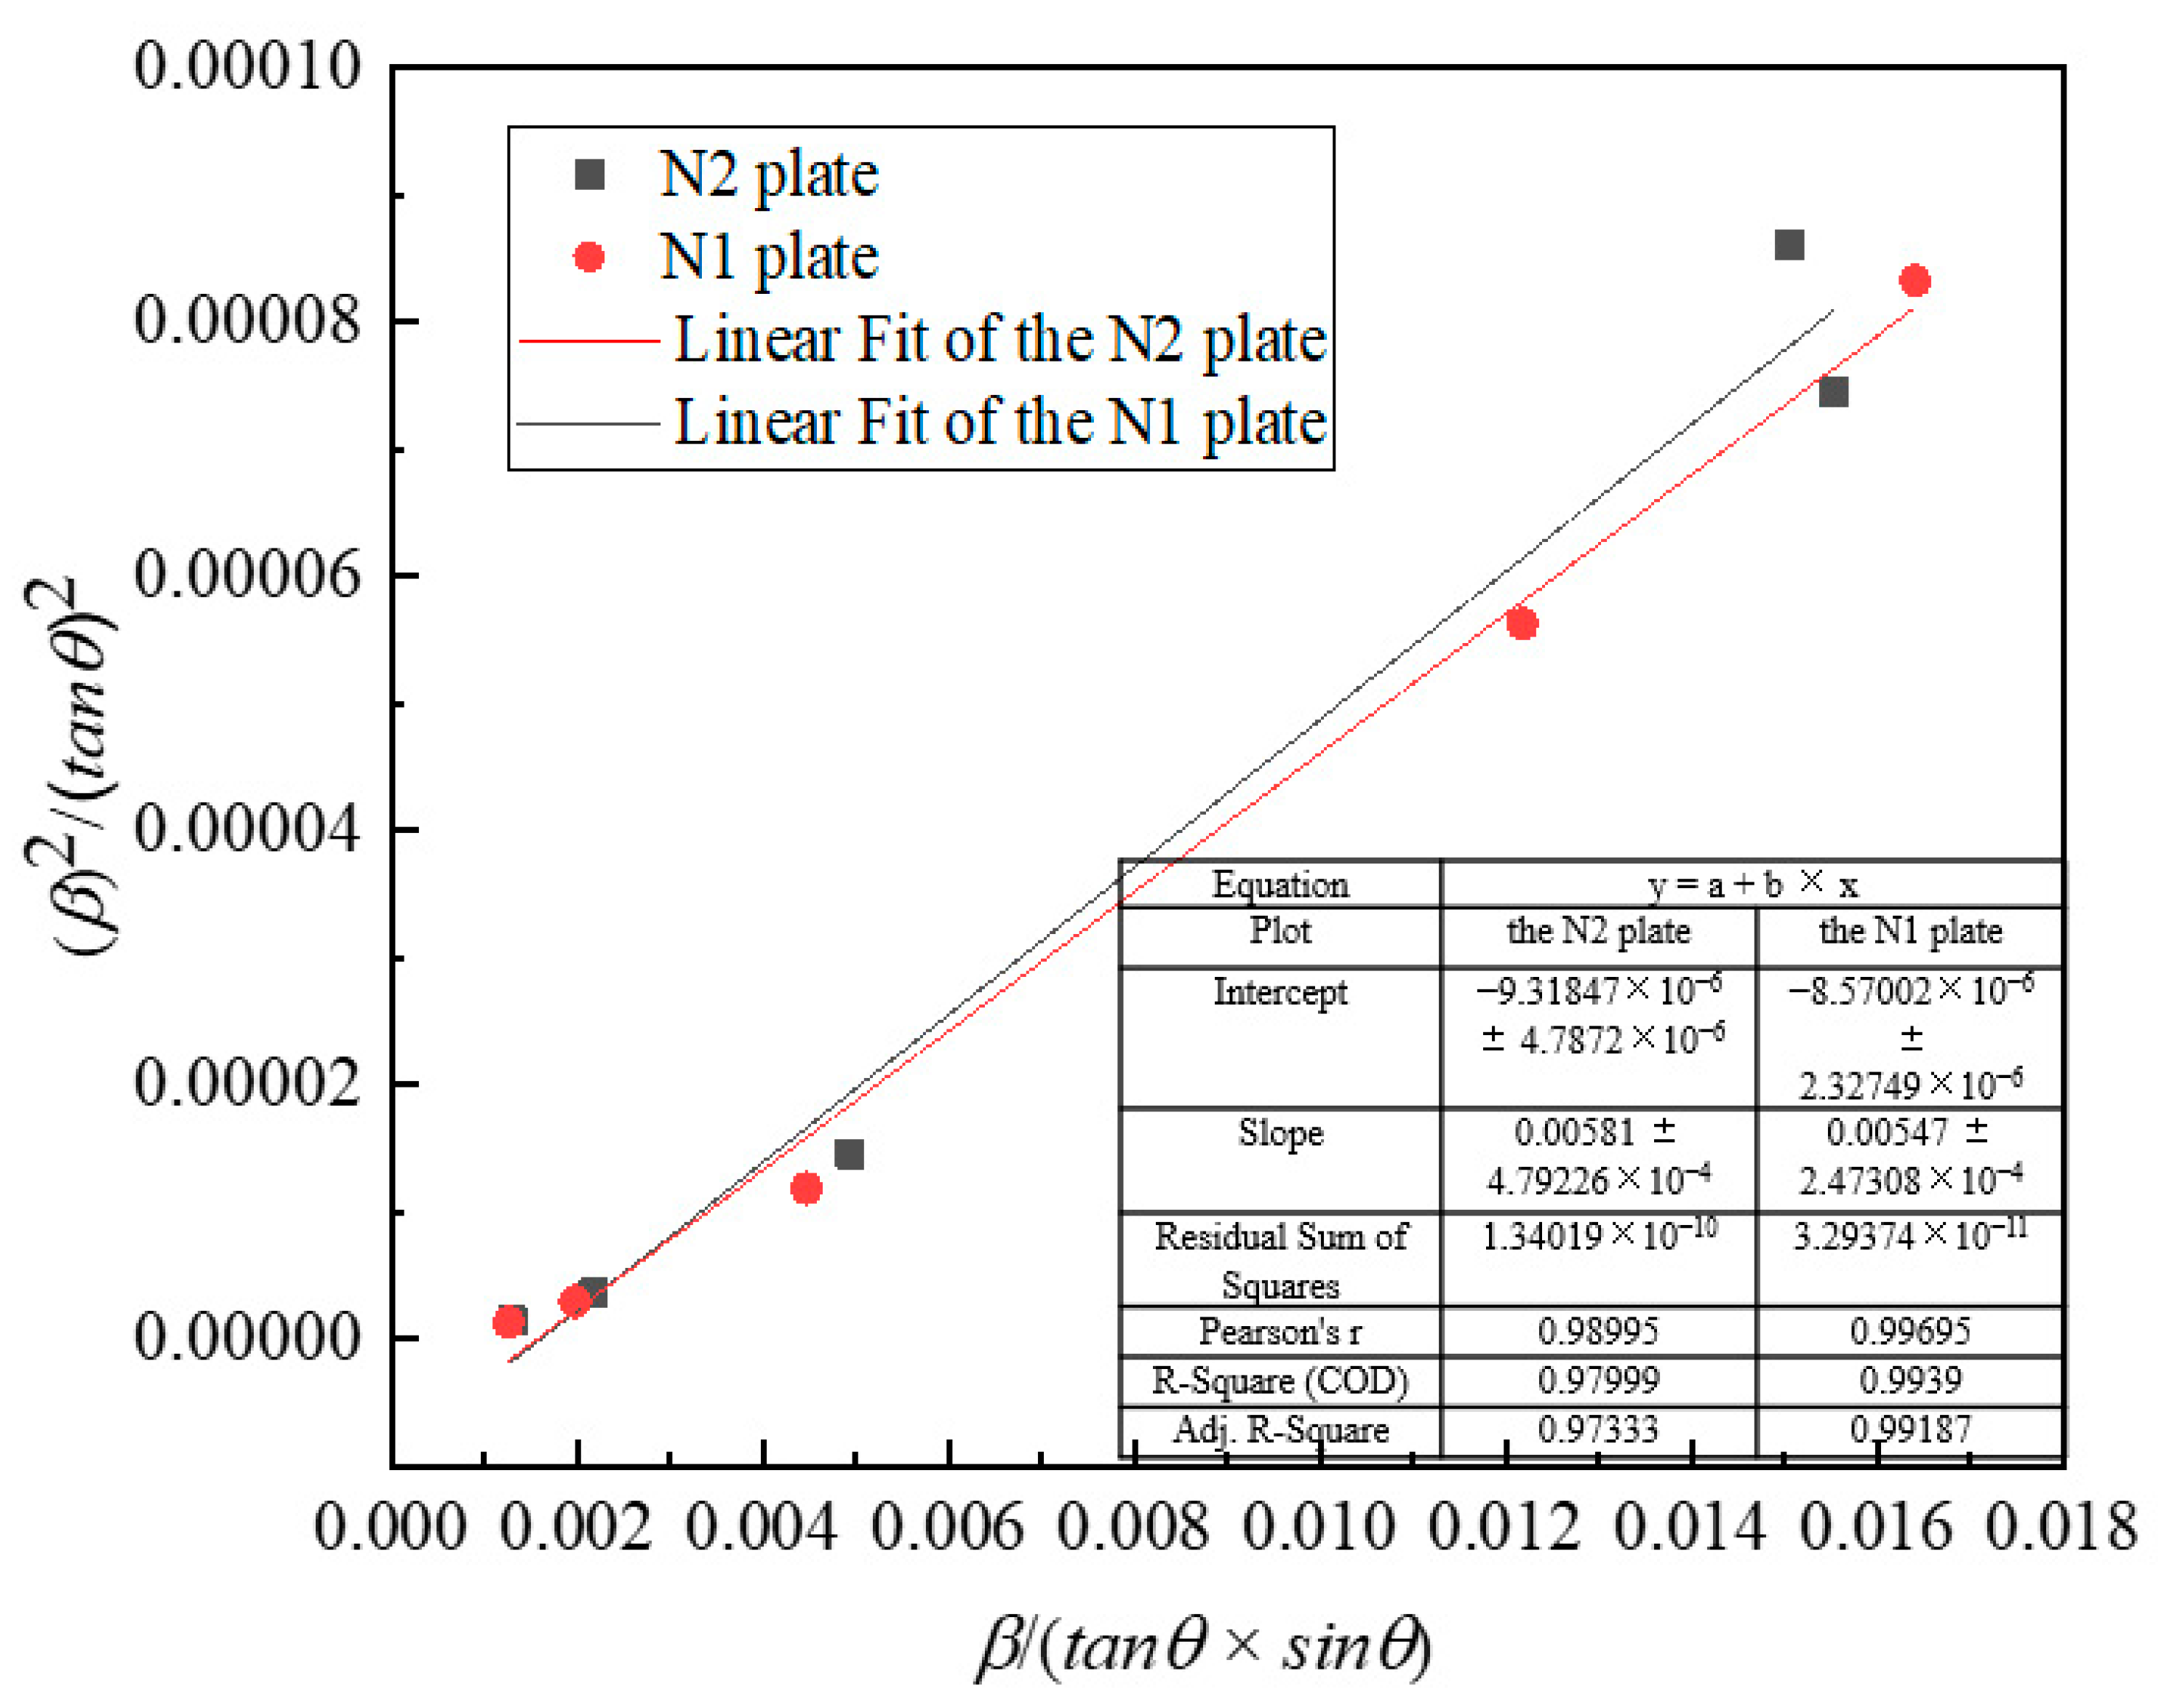
3.4. The Dislocation Density of Annealed 1561 Aluminum Alloy

Figure 12 show the XRD patterns of 1561 aluminum alloy at different states. It can be found that regardless of whether it is annealed or not, the prominent diffraction peaks observed in the sample are α-Al diffraction peaks and some weaker diffraction peaks such as Al6Mn and Mg2Al3. As the experimental materials have undergone severe rolling deformation at a high temperature, the diffraction peaks of phases obtained via the test will more or less shift at a slight angle. It is necessary to rely on other testing equipment and the related literature to determine the type of phases. It can be observed that the peak heights of α-Al obviously change in a different state of the plate, which was manifested in that the peak heights of α-Al decrease gradually by increasing the deformation. At the same time, comparing the two states, it is found that the corresponding diffraction peak intensity of the H2 plate is low, and the width is large, which indicates that after hot rolling, the grains of the alloy were refined, and the lattice distortion increased. For the N2 plate, the full width at half maximum of the α-Al peak becomes smaller, indicating that the crystal grains have grown to a certain extent after annealed. This result is consistent with the result in Figure 6.
Diffraction peak correlation parameters of annealed 1561 aluminum alloy under different deformation conditions are shown in Table 2. The evolution of the dislocation density inside the organization during the plastic deformation process often causes the change of the crystal structure. On the one hand, a large number of dislocations and vacancies produced by deformation make some atoms in the crystal lattice deviate from their equilibrium positions, forming microscopic strains in the crystal grains; on the other hand, the source of dislocations is caused by shear strain. When many dislocations move along the slip surface, they will encounter various obstacles that hinder the movement of the dislocations, such as grain boundaries, second-phase particles, etc.
When grain refinement and microscopic strain coexist, the average grain size d and microscopic strain e satisfy the following Cauchy–Gaussian (CG) Equation (1) [36]. At this time, the relationship between the diffraction peak width, and the crystallite size expressed by the Scherrer formula:
( β ) 2 ( t a n θ ) 2 = K λ d ( β t a n θ s i n θ )   +   25 e 2
where β is the integral width, θ is the Bragg diffraction angle, λ is the X-ray wavelength of copper palladium, in this experiment, λ = 0.15406 nm, K is the crystallite size which is a constant, usually taken as 1, and e is the lattice distortion.
According to the slope and intercept of the fitted straight line in Figure 13, the slope of the fitted straight line and the size of the crystallites, the ordinate intercept and the microscopic strain have the following relationships, the crystallite size and microscopic strain can be further calculated by Equation (2).
{ L = λ c β 1 2 = a 5
where L is the crystallite size, c and a represent the slope and intercept obtained by CG fitting a straight line, respectively.
Williamson and Smallman [37] pointed out that when only considering the lattice distortion caused by the change of the dislocation density within the material, the dislocation density ρ and the micro strain e have the following relationship according to the Equation (3) [38]:
ρ = 2 3 β b L
where ρ is the dislocation density, the value of the Burgers vector b is 0.286 nm. The dislocation density of the N1 plate is 2.62 × 10¹⁴ m−2. With the increase in the deformation pass, the dislocation density reaches 2.86 × 10¹⁴ m−2. This explains that the gradient hot rolling not only produces compressive stress, but also has shear stress. When the amount of deformation increases, the shear stress increases, a large number of dislocations multiply and interact, and the dislocation density increases rapidly.

4. Conclusions

In this work, the effect of gradient hot rolled deformations on microstructure and mechanical properties mechanism of 1561 aluminum alloy was investigated. The following conclusions can be obtained:
(1)
After gradient hot rolling, the microstructure of the hot rolled 1561 aluminum alloy consists of elongated grains and equiaxed grains, and the average grain size is 18.95 μm at the 3% deformation plate, while the average grain size of 30% deformation plate is 1.19 μm. Respectively, after annealing, the average grain size decreased from 28.34 μm to 10.69 μm in the hot rolling process. Work hardening, fine-grain strengthening and texture influence the mechanical properties of the hot rolled 1561 aluminum alloy together.
(2)
The most prevalent textures in the 1 plate are <110> Cubic and (110) <110> R-Goss textures, accounting for 11.8 vol.% and 7.23 vol.%, respectively. The most prevalent textures in the 2 plate are <111> Cubic, <100> Cubic, (110) <100> Goss, (110) <112> Brass, (123) <634> S textures, accounting for 18.9 vol.%, 17.9 vol.%, 15 vol.%, 5.64 vol.%, and 9.85 vol.%. Respectively, the accumulated deformation results in the above-mentioned difference in the 1 and 2 plates. Moreover, the fraction of fiber component is higher than that of other components in all plates. Texture produced by gradient deformation has a synergistic effect on the mechanical properties of the annealed hot rolled 1561 aluminum alloy.
(3)
With the increment of deformation, the hardness value increased from 83.8 HV up to as high as 104 HV, and the electrical conductivity value increased from 23.5 %IACS to 24.3 %IACS. The dislocation density up 2.62 × 10¹⁴ m−2 to 2.86 × 10¹⁴ m−2 with the growth of deformation. After gradient hot rolling at 450 °C, the number of deformations increases, the shear stress increases, a large number of dislocations multiply and interact, and the dislocation density increases rapidly.

Author Contributions

Conceptualization, J.C. and X.W.; methodology, X.W.; validation, X.W.; formal analysis, X.W.; investigation, L.Y.; resources, J.C. and X.W.; data curation, L.Y.; writing—original draft preparation, L.Y.; writing—review and editing, F.Y., W.S., L.L. and X.W.; visualization, X.W.; supervision, X.W.; project administration, J.C.; funding acquisition, J.C. and X.W. All authors have read and agreed to the published version of the manuscript.

Funding

This research was funded by the Fundamental Research Funds for the National Natural Science Foundation of China (U1708251); the Key Research and Development Program of Liaoning (2020JH2/10700003); Liaoning Revitalization Talents Program, China (XLYC1807027); the Fundamental Research Funds for the Central Universities (No. N2109004).

Institutional Review Board Statement

The study was conducted according to the guidelines of the Northeastern University, and approved by the School of Material Science and Engineering.

Informed Consent Statement

Informed Consent was obtained from all subjects involved in the study.

Data Availability Statement

The data presented in this study are available upon request.

Conflicts of Interest

The authors declare no conflict of interest.

References

  1. Toros, S.; Ozturk, F.; Kacar, I. Review of warm forming of aluminum–magnesium alloys. J. Mater. Process. Technol. 2008, 207, 1–12. [Google Scholar] [CrossRef]
  2. Polmear, I.J. Recent Developments in Light Alloys. Mater. Trans. JIM 1996, 37, 12–31. [Google Scholar] [CrossRef] [Green Version]
  3. Heinz, A.; Haszler, A.; Keidel, C.; Moldenhauer, S.; Benedictus, R.; Miller, W.S. Recent development in aluminium alloys for aerospace applications. Mater. Sci. Eng. A 2000, 280, 102–107. [Google Scholar] [CrossRef]
  4. Guo, M.X.; Zhang, X.K.; Zhang, J.S.; Zhuang, L.Z. Effect of Zn addition on the precipitation behaviors of Al–Mg–Si–Cu alloys for automotive applications. J. Mater. Sci. 2017, 52, 1390–1404. [Google Scholar] [CrossRef]
  5. Dongxia, Y.; Xiaoyan, L.; Dingyong, H.; Hui, H. Effect of minor Er and Zr on microstructure and mechanical properties of Al–Mg–Mn alloy (5083) welded joints. Mater. Sci. Eng. A 2013, 561, 226–231. [Google Scholar] [CrossRef]
  6. McShane, H.B.; Lee, C.P.; Sheppard, T. Structure, anisotropy, and properties of hot rolled AA 5083 alloy. Mater. Sci. Technol. 1990, 6, 428–440. [Google Scholar] [CrossRef]
  7. Li, H.; Wang, H.; Liang, X.; Wang, Y.; Liu, H. Effect of Sc and Nd on the Microstructure and Mechanical Properties of Al-Mg-Mn Alloy. J. Mater. Eng. Perform. 2010, 21, 83–88. [Google Scholar] [CrossRef]
  8. Ning, J.L.; Jiang, D.M. Influence of Zr addition on the microstructure evolution and thermal stability of Al–Mg–Mn alloy processed by ECAP at elevated temperature. Mater. Sci. Eng. A 2007, 452–453, 552–557. [Google Scholar] [CrossRef]
  9. She, X.W.; Jiang, X.Q.; Wang, P.Q.; Tang, B.B.; Chen, K.; Liu, Y.J.; Cao, W.N. Relationship between microstructure and mechanical properties of 5083 aluminum alloy thick plate. Trans. Nonferrous Met. Soc. China 2020, 30, 1780–1789. [Google Scholar] [CrossRef]
  10. Ebenberger, P.; Uggowitzer, P.J.; Gerold, B.; Pogatscher, S. Effect of Compositional and Processing Variations in New 5182-Type AlMgMn Alloys on Mechanical Properties and Deformation Surface Quality. Materials 2019, 12, 1645. [Google Scholar] [CrossRef] [Green Version]
  11. Vlach, M.; Stulikova, I.; Smola, B.; Piesova, J.; Cisarova, H.; Danis, S.; Plasek, J.; Gemma, R.; Tanprayoon, D.; Neubert, V. Effect of cold rolling on precipitation processes in Al–Mn–Sc–Zr alloy. Mater. Sci. Eng. A 2012, 548, 27–32. [Google Scholar] [CrossRef]
  12. Gras, C.; Meredith, M.; Hunt, J. Microstructure and texture evolution after twin roll casting and subsequent cold rolling of Al–Mg–Mn aluminium alloys. J. Mater. Process. Technol. 2005, 169, 156–163. [Google Scholar] [CrossRef]
  13. Kim, B.H.; Lee, J.Y.; Yoon, Y.O.; Kim, S.K. Effects of Mg and Mn Contents on Hot-Rolling Temperature and Resultant Tensile Properties of Al-Mg-Mn Alloys. Mater. Sci. Forum 2016, 877, 334–339. [Google Scholar] [CrossRef]
  14. Li, X.; Xia, W.; Yan, H.; Chen, J.; Su, B.; Song, M.; Li, Z.; Lu, Y. High strength and large ductility of a fine-grained Al–Mg alloy processed by high strain rate hot rolling and cold rolling. Mater. Sci. Eng. A 2020, 787, 139481. [Google Scholar] [CrossRef]
  15. Jin, Z.-Z.; Cheng, X.-M.; Zha, M.; Rong, J.; Zhang, H.; Wang, J.-G.; Wang, C.; Li, Z.-G.; Wang, H.-Y. Effects of Mg17Al12 second phase particles on twinning-induced recrystallization behavior in Mg-Al-Zn alloys during gradient hot rolling. J. Mater. Sci. Technol. 2019, 35, 2017–2026. [Google Scholar] [CrossRef]
  16. Robert, W.; Piot, D.; Driver, J. A rapid deformation texture model incorporating grain interactions. Scr. Mater. 2004, 50, 1215–1219. [Google Scholar] [CrossRef]
  17. She, X.; Jiang, X.; Zhang, R.; Wang, P.; Tang, B.; Du, W. Study on microstructure and fracture characteristics of 5083 aluminum alloy thick plate. J. Alloy. Compd. 2020, 825, 153960. [Google Scholar] [CrossRef]
  18. Choi, S.H.; Song, Y.; Kim, J.K.; Kim, H.W.; Kang, S.B. Texture Evolution during Hot Rolling Deformation in Al-5wt%Mg Alloy. Key Eng. Mater. 2007, 89–92. [Google Scholar] [CrossRef]
  19. Takebayashi, S.; Kunieda, T.; Yoshinaga, N.; Ushioda, K.; Ogata, S. Comparison of the Dislocation Density in Martensitic Steels Evaluated by Some X-ray Diffraction Methods. ISIJ Int. 2010, 50, 875–882. [Google Scholar] [CrossRef] [Green Version]
  20. Aufrecht, J.; Leineweber, A.; Foct, J.; Mittemeijer, E. The structure of nitrogen-supersaturated ferrite produced by ball milling. Philos. Mag. 2008, 88, 1835–1855. [Google Scholar] [CrossRef] [Green Version]
  21. Stokes, A.R. A Numerical Fourier-analysis Method for the Correction of Widths and Shapes of Lines on X-ray Powder Photographs. Proc. Phys. Soc. 1948, 61, 382–391. [Google Scholar] [CrossRef]
  22. Williamson, G.K.; Hall, W.H. X-ray line broadening from filed aluminium and wolfram. Acta Metall. 1953, 1, 22–31. [Google Scholar] [CrossRef]
  23. Shintani, T.; Murata, Y. Evaluation of the dislocation density and dislocation character in cold rolled Type 304 steel determined by profile analysis of X-ray diffraction. Acta Mater. 2011, 59, 4314–4322. [Google Scholar] [CrossRef]
  24. Su, Y.; Chen, B.; Tan, C.; Song, X.; Feng, J. Influence of composition gradient variation on the microstructure and mechanical properties of 316 L/Inconel718 functionally graded material fabricated by laser additive manufacturing. J. Mater. Process. Technol. 2020, 283, 116702. [Google Scholar] [CrossRef]
  25. Liang, Y.; Xiang, S.; Li, T.; Zhang, X. Ultrafast fabrication of high-density Al–12Si compacts with gradient structure by electro-discharge sintering. J. Manuf. Process. 2020, 54, 301–308. [Google Scholar] [CrossRef]
  26. Wang, X.J.; Sun, W.; Chen, J.F.; Wang, F.Y.; Li, L.; Cui, J.Z. Microstructures and properties of 6016 aluminum alloy with gradient composition. Rare Met. 2021, 40, 2154–2159. [Google Scholar] [CrossRef]
  27. Liu, Z.; Meyers, M.A.; Zhang, Z.; Ritchie, R.O. Functional gradients and heterogeneities in biological materials: Design principles, functions, and bioinspired applications. Prog. Mater. Sci. 2017, 88, 467–498. [Google Scholar] [CrossRef]
  28. Boldetti, C.; Pinna, C.; Howard, I.C.; Gutierrez, G. Measurement of deformation gradients in hot rolling of AA3004. Exp. Mech. 2005, 45, 517–525. [Google Scholar] [CrossRef]
  29. Li, X.; Lu, L.; Li, J.; Zhang, X.; Gao, H. Mechanical properties and deformation mechanisms of gradient nanostructured metals and alloys. Nat. Rev. Mater. 2020, 5. [Google Scholar] [CrossRef]
  30. Chen, L.; Yuan, F.; Jiang, P.; Xie, J.; Wu, X. Mechanical properties and deformation mechanism of Mg-Al-Zn alloy with gradient microstructure in grain size and orientation. Mater. Sci. Eng. A 2017, 694, 98–109. [Google Scholar] [CrossRef] [Green Version]
  31. Lebensohn, R.A.; Brenner, R.; Castelnau, O.; Rollett, A.D. Orientation image-based micromechanical modelling of subgrain texture evolution in polycrystalline copper. Acta Mater. 2008, 56, 3914–3926. [Google Scholar] [CrossRef]
  32. Fan, X.; Tang, D.; Fang, W.; Li, D.; Peng, Y. Microstructure development and texture evolution of aluminum multi-port extrusion tube during the porthole die extrusion. Mater. Charact. 2016, 118, 468–480. [Google Scholar] [CrossRef]
  33. Hirsch, J.; Lücke, K. Overview no. 76: Mechanism of deformation and development of rolling textures in polycrystalline f.c.c. metals—I. Description of rolling texture development in homogeneous CuZn alloys. Acta Met. 1988, 36, 2863–2882. [Google Scholar] [CrossRef]
  34. Lücke, K.; Engler, O. Effects of particles on development of microstructure and texture during rolling and recrystallisation in fcc alloys. Mater. Sci. Technol. 1990, 6, 1113–1130. [Google Scholar] [CrossRef]
  35. Liu, W.; Man, C.-S.; Morris, J. Lattice rotation of the cube orientation to the β fiber during cold rolling of AA 5052 aluminum alloy. Scr. Mater. 2001, 45, 807–814. [Google Scholar] [CrossRef]
  36. Zhang, Z.; Zhou, F.; Lavernia, E.J. On the analysis of grain size in bulk nanocrystalline materials via x-ray diffraction. Met. Mater. Trans. A 2003, 34, 1349–1355. [Google Scholar] [CrossRef]
  37. Williamson, G.K.; Smallman, R.E., III. Dislocation densities in some annealed and cold-worked metals from measurements on the X-ray debye-scherrer spectrum. Philos. Mag. 1956, 1, 34–46. [Google Scholar] [CrossRef]
  38. Zhao, Y.; Liao, X.; Jin, Z.; Valiev, R.; Zhu, Y. Microstructures and mechanical properties of ultrafine grained 7075 Al alloy processed by ECAP and their evolutions during annealing. Acta Mater. 2004, 52, 4589–4599. [Google Scholar] [CrossRef]
Figure 1. The wedge copper mold casting experimental equipment and obtained materials (a) Wedge-shaped copper mold; (b) 1561 aluminum alloy ingot; (c) 1561 aluminum alloy hot rolled plate.
Crystals 12 00229 g001
Figure 2. The metallographic structure of 1561 aluminum alloys. (a) the A1 plate; (b) the A2 plate.
Crystals 12 00229 g002
Figure 3. Grain structure of 1561 aluminum alloys after the hot rolling. (a,b) initial undeformed region; (c,d) the H1 plate; (e,f) the H2 plate.
Crystals 12 00229 g003
Figure 4. EBSD IPF maps of annealed 1561 aluminum alloys at different deformation stages in the central region. (a) the H1 plate; (b) the H2 plate; (c) the N1 plate; (d) the N2 plate.
Crystals 12 00229 g004
Figure 5. Recrystallized, substructured and deformed microstructures of the 1561 aluminum alloy with different states. (a) the H2 plate (b) the N2 plate (c) Statistical distribution histogram.
Crystals 12 00229 g005
Figure 6. Relative frequency of grains size of annealed 1561 aluminum alloys. (a) the H1 plate; (b) the H2 plate; (c) the N1 plate; (d) the N2 plate.
Crystals 12 00229 g006
Figure 7. Misorientation angle distribution (MAD) histogram of 1561 aluminum hot rolled plate. (a) the H1 plate; (b) the H2 plate; (c) the N1 plate; (d) the N2 plate.
Crystals 12 00229 g007
Figure 8. Pole figure IPF maps of annealed 1561 aluminum alloys at different deformation stages. (a,b) the H1 plate; (c,d) the H2 plate; (e,f) the N1 plate; (g,h) the N2 plate.
Crystals 12 00229 g008
Figure 9. ODF sections of annealed 1561 aluminum alloys: (a) the H1 plate;(b) the H2 plate; (c) the N1 plate; (d) the N2 plate.
Crystals 12 00229 g009
Figure 10. Volume fraction of the main texture components of annealed 1561 aluminum alloys in the central region.
Crystals 12 00229 g010
Figure 11. Hardness and electrical conductivity change with different deformation of the plate after annealed.
Crystals 12 00229 g011
Figure 12. XRD patterns with a different state of 1561 aluminum alloy.
Crystals 12 00229 g012
Figure 13. Linear fitting of Equation (2) of hot rolled 1561 aluminum alloy.
Crystals 12 00229 g013
Table 1. Chemical composition of 1561 aluminum alloy plates (by wt.%).
CompositionSiFeMnMgZnTiZrAl
wt.%0.01670.02290.93185.63740.00230.00840.1175Bal.
Table 2. Diffraction peak correlation parameters of annealed 1561 aluminum alloy under different deformation conditions.
HKLN1 PlateN2 Plate
2θdI%FWHM2θdI%FWHM
(111)38.2212.35281000.41238.2402.35161000.390
(200)44.4412.036952.50.42244.4812.035121.10.521
(220)64.6221.441148.70.41764.6811.439922.60.460
(311)77.6421.228770.50.45177.7011.227922.80.495
(222)81.8421.176017.30.46381.9221.17507.20.471
Publisher’s Note: MDPI stays neutral with regard to jurisdictional claims in published maps and institutional affiliations.

