Article

Tinaksite and Tokkoite: X-ray Powder Diffraction, Optical, and Vibrational Properties

Vinogradov Institute of Geochemistry, Siberian Branch of the Russian Academy of Sciences, 664033 Irkutsk, Russia
*
Author to whom correspondence should be addressed.
Crystals 2022, 12(3), 377; https://doi.org/10.3390/cryst12030377
Submission received: 18 February 2022 / Revised: 7 March 2022 / Accepted: 8 March 2022 / Published: 10 March 2022

Abstract

:
In this study, natural tinaksite (K2Ca2NaTi[Si7O18OH]O) and tokkoite (K2Ca4[Si7O18OH](OH,F)) collected in charoite rocks of the Murun alkaline massif (Siberia, Russia) were examined by X-ray diffraction and optical and vibrational spectroscopic methods. A comparative analysis of the experimental diffraction patterns with respect to the calculated X-ray powder diffraction patterns was carried out for tinaksite and tokkoite powders. The shift in the diffraction peaks of tinaksite is explained by the smaller values of the unit cell parameters a and b as compared with those of tokkoite. A similar shift of the peaks is also observed in the Raman and infrared absorption spectra; however, this feature is explained by the difference in the chemical composition of the minerals. The shoulder in the absorption spectra at about 800 nm in tinaksite and 700 nm in tokkoite corresponds to the presence of Mn2+ and Fe3+ absorption bands, the presence of which determines the color of tinaksite and tokkoite. The luminescence band with a maximum at about 540–550 nm in the photoluminescence spectra is related to Mn2+ centers, while an additional band at about 610 nm can be associated with Ti3+ centers in tinaksite. The intensity of the Fe3+ ESR signal increases in both samples after heating, while the intensities of the bands associated with OH groups decrease in tinaksite and tokkoite. This characteristic is the result of iron oxidation and dehydrogenation reaction.

1. Introduction

Tinaksite and tokkoite both were discovered for the first time in the Murun massif in rocks called charoitites [1,2]. Subsequently, tinaksite has been reported from the complex pegmatites of the Rasvumchorr deposit, Khibiny massif (Kola Peninsula, Russia) [3,4] and tokkoite has been found at the massif of Patyn Mt., Tashtagolskiy District (Southern Siberia, Russia) [5]. Tinaksite and tokkoite belong to the group of rare alkaline Ca-(K)-(Na) silicates, which also includes such minerals as agrellite ([6] and therein), miserite ([7] and therein), frankamenite ([8] and therein), fluorcarletonite [9], fedorite ([10] and therein), fluorapophyllite-(K) [11], pectolite ([12] and therein), denisovite [13], and charoite ([14,15,16] and therein).
According to the Liebau (2012) classification [17], tinaksite and tokkoite are hybrid multiple chain silicates. The silicate anion found in their crystal structures is constructed by linking an unbranched dreier single chain with a loop-branched dreier single chain. Until now, the number of known minerals having this hybrid silicate anion has been low. This group encloses the isostructural tinaksite (K2Ca2NaTi[Si7O18OH]O), tokkoite (K2Ca4[Si7O18OH](OH,F)), and senkevichite (KCsCa2NaTi[Si7O18OH]O), having similar unit cell parameters (a, 10 Å; b, 12 Å; c, 7 Å; α, 91°; β, 99°; and γ, 93°), the same space group P 1 ¯ , and silicate radical [Si7O18(OH)]9−.
Adjacent vlasovite-type (Si4O11) and wollastonite-type (Si3O9) chains are linked through common tetrahedral vertices along the c-axis, forming four- and eight-membered rings inside and between the chains. The silicate units are connected with polyhedra layers also extending along the direction of the c-axis. In tokkoite, Ca atoms are located in the center of such polyhedra, while in tinaksite, Ca, Na, or Ti ions occupy the central position. Finally, large K cations are positioned in structural cavities formed by the heterogeneous framework. Note that in senkevichite, one K atom is replaced by Cs, and the tetrahedral-octahedral framework corresponds to tinaksite. The crystal structure of the tinaksite is illustrated in Figure 1. Detailed crystal chemical descriptions of these minerals can be found in [18,19]. However, the optical and vibrational properties of tinaksite and tokkoite have not yet been studied.
Recently, chain silicates have become the subject of many investigations due to their glass-forming capacity and ability to devitrify at low pressure. Naturally occurring aggregates of chain silicate crystals and their synthesized analogs are well known in the production of bioactive ceramics for their strength and fracture resistance. The structural features of the minerals of this group of rare alkaline Ca-(K)-(Na) silicates make these materials promising for ion exchange, since, as noted in [6,7,8,9,10,11,12,13,14,15,16,18,19], the crystal structures contain several cationic positions suitable for doping with transition metals and lanthanides. Finally, materials activated with transition and rare earth elements are widely used in various fields of photonics.
In this paper, we report the results of the infrared spectroscopy, diffuse-light absorption spectroscopy in the ultraviolet (UV), visible (Vis), and near-infrared (NIR) spectral region investigations, and electron spin resonance study of tinaksite and tokkoite. Additional X-ray powder diffraction studies were carried out for a more detailed characterization of their diffraction pattern peculiarities.

2. Materials and Methods

We used the same tinaksite and tokkoite samples characterized by [18] using electron microprobe analysis (EMPA), single-crystal structure refinement (SCXRD), and Mössbauer spectroscopy.
The host rock is charoitite from the Malyy Murun alkaline complex (northwestern part of the Aldan Shield, Siberia, Russia). Associated minerals include charoite, frankamenite, potassic feldspar, and quartz for tinaksite [1], and charoite, miserite, aegirine, and potassic feldspar for tokkoite [2].
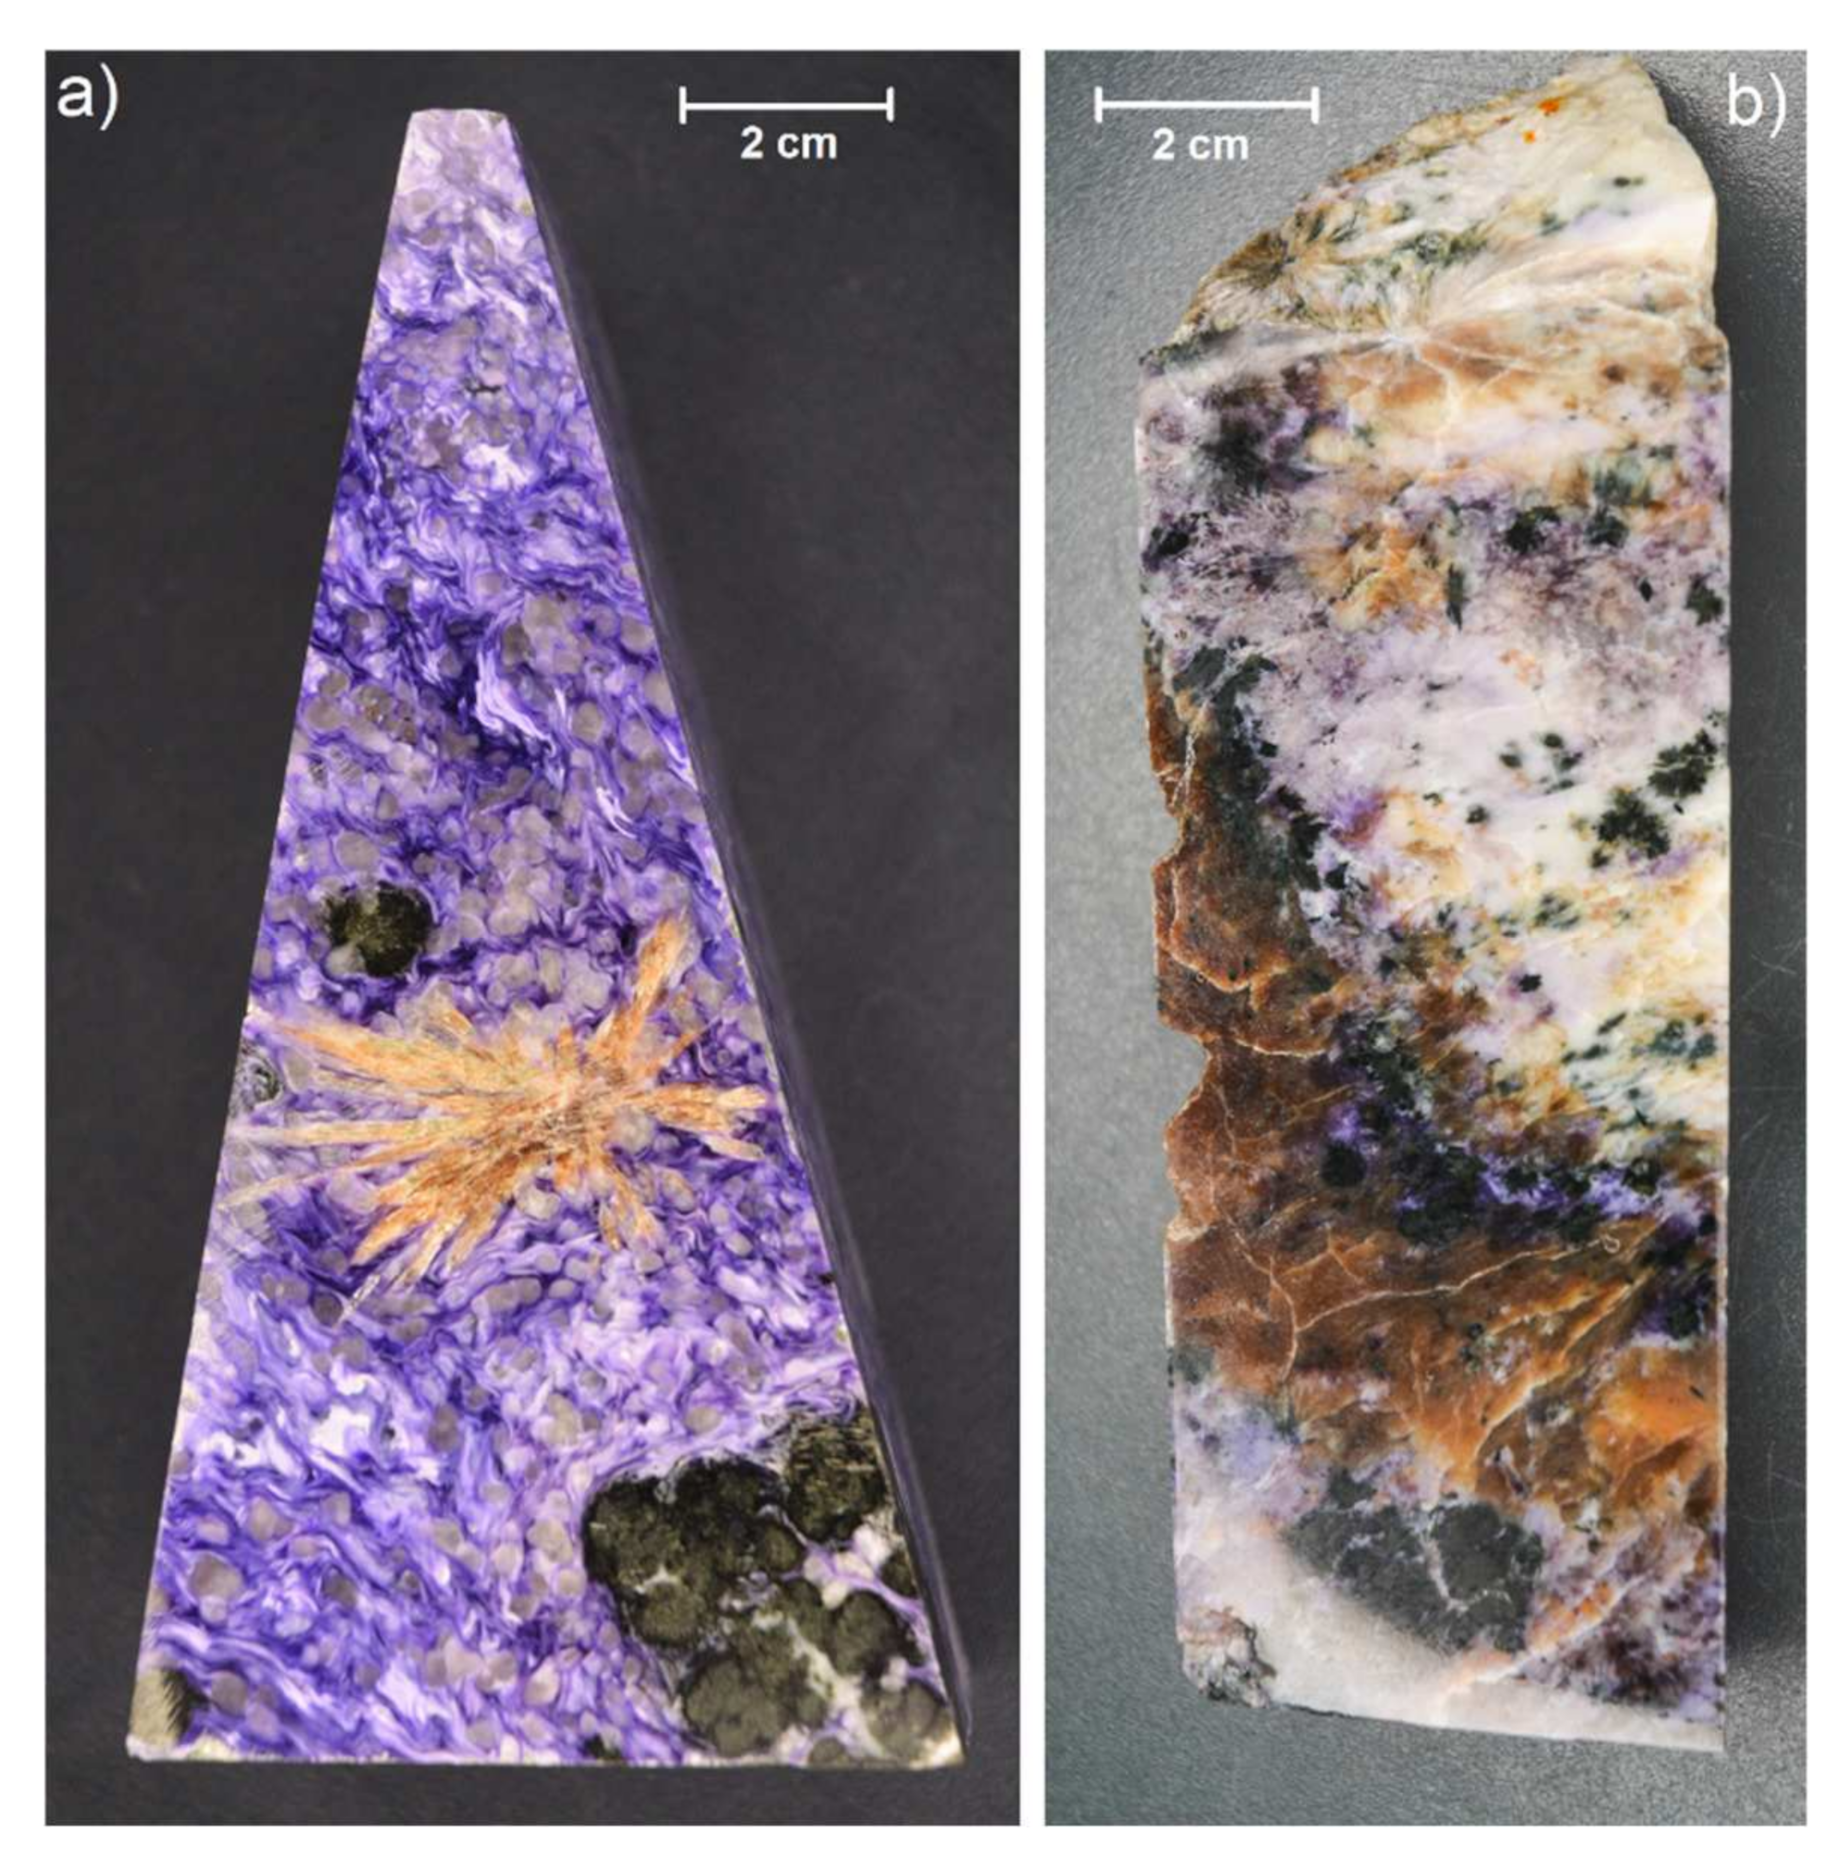
Minerals are very similar to each other. Tinaksite (Figure 2a) has light yellow to light brown color, and it is transparent to translucent. Tinaksite crystals are grouped into radially radiant aggregates. The cleavage of the mineral is perfect on {010} and imperfect on {110}, and there is a strong vitreous luster on the cleavage planes [1]. The color of tokkoite is light brown to brown (Figure 2b). It has a vitreous luster. Columnar or radially radiant aggregates of tokkoite have two cleavage systems: very perfect on {010} and perfect on {110} [2].
The X-ray powder diffraction data of the studied samples were collected at room temperature with a Bruker D8 ADVANCE (Bruker AXS, Berlin, Germany) powder diffractometer (Cu Kα radiation, 40 kV, 40 Ma) and linear VANTEC detector. The samples for measurement were prepared by packing and leveling the powder in a special cuvette. Profiles were obtained between 3° and 120° 2θ. The step size of 2θ was 0.02°, and the counting time was 4 s per step. The measured patterns were used without any corrections or other processing. Diffraction patterns were analyzed using the EVA V4.2.1 software suite [22] (Bruker AXS, Madison, WI, USA). To establish the features of powder diffraction patterns and compare them with those previously obtained, the Powder Diffraction File (PDF-2, Release 2007) database, maintained and updated by the International Center for Diffraction Data [23,24], was used. In this study, the VESTA (version 4.3.0) software [20] was used to simulate the X-ray diffraction patterns of tinaksite and tokkoite using the crystal structure models of [18,21]. The unit cell parameters of the studied samples were determined by the Rietveld method using TOPAS 4.2 (Bruker AXS, Berlin, Germany) [25]. Refinements were stable and gave relatively low R-factors (4.7 and 5.1% for tinaksite and tokkoite, respectively). Pseudo-Voigt line shapes were used for the peaks. A three-parameter 2nd order polynomial function was used for the background. The measured patterns were used without any corrections or other processing; Lorentz polarization, absorption, and sample displacement corrections were applied to the calculated patterns.
Lacalamita et al. (2017) reported the following crystal chemical formulas: K1.95(Ti0.94Mn0.04Fe3+0.01)(Na0.98Ca0.02)(Ca0.96Mg0.04)(Ca0.72Fe2+0.11Mn0.08Fe3+0.02Dy0.02)(O0.56OH0.44)[Si7O18(OH)] for tinaksite (tin_2 sample, which structural data was used to simulate the X-ray diffraction pattern) and K1.95(Ca0.39Ti0.22Mg0.17Fe2+0.11Fe3+0.10)(Ca0.77Na0.23)(Ca0.96Fe2+0.04)(Ca0.94Mn0.06)(F0.72O0.24(OH)0.04)[Si7O18(OH)] for tokkoite (tok_2 sample, which structural data was used to simulate the X-ray diffraction pattern), respectively [18].
Fourier transform infrared (IR) absorption spectra of tinaksite and tokkoite powdered samples were mixed with anhydrous KBr, pelletized, and analyzed using an FT-801 spectrometer (Simex, Novosibirsk, Russia) at a resolution of 1 cm−1. A total of 32 scans were collected for each spectrum. The IR spectrum of an analogous pellet of pure KBr was used as a reference.
The powdered samples mixed with anhydrous KBr were annealed at different temperatures with an effective heating rate equal to 5 °C/min. This process is described in detail in [26,27].
Reflection spectra (Figure S1 of Supplementary Materials) were measured using a Micran-3 IR microscope (Simex, Novosibirsk, Russia) with 2 cm−1 resolution and 128 scans.
Raman spectra of randomly oriented tinaksite and tokkoite grains were obtained using a WITec alpha300R confocal Raman spectroscopic system (WITec GmbH, Ulm, Germany) coupled with a 15 mW Nd:YAG laser (λ = 532 nm). The spectra were recorded in the range from 150 to 1200 cm–1 with diffraction grating (1800 g mm−1) and spectral resolution of about 3 cm−1.
Optical absorption spectra were measured at room temperature on thin single-crystal plates with thicknesses of about 0.6–1 mm by a Lambda 950 spectrophotometer (Perkin Elmer, Shelton, CT, USA) in the 200–1700 nm spectral range. The spectral resolution and measurement step were 1 nm with 1 s integration time for each point.
Electron spin resonance spectra (ESR) were registered by a RE-1306 X-band spectrometer (KBST, Smolensk, Russia) with a frequency of 9.380 GHz. Small grains of tinaksite or tokkoite were placed in a spectrometer and measured at room temperature.
Photoluminescence spectra were measured using a spectrofluorimeter based on MDR2 monochromator (LOMO, Saint-Petersburg, Russia) equipped with a diffraction grating (600 g mm) and a Hamamatsu H6780-04 photomodule (185–850 nm) (Hamamatsu, Tokyo, Japan). Excitation was performed using diode lasers with 405 and 532 nm wavelengths. The spectral width of slits was 0.2 nm.

3. Results and Discussion

3.1. X-ray Powder Diffraction

Powder X-ray diffraction data for the studied samples are represented in Figure 3 and Tables S1 and S2 of Supplementary Materials. Peak positions are expressed as d-spacing in Å. Intensities are given in relative percentages. It is noted that the reflections and their intensities, obtained experimentally, were in agreement with the results of the powder pattern simulation on the basis of the structural model determined by [18] using single-crystal X-ray diffraction. The unit cell parameters derived from the X-ray powder diffraction data for tinaksite and tokkoite powders were consistent with the data obtained for single crystals by [18] (see Table 1).
A comparative analysis of the experimental diffraction patterns with respect to the calculated diffraction patterns was carried out and the samples were found to be single phases.
The PDF-2 database contains several files with tinaksite and tokkoite diffraction data, obtained experimentally or calculated using published structural data. All the profiles we have found are summarized in Tables S1 and S2 of the Supplementary Materials for comparison purposes and to assist us in indexing our samples.
The first diffraction pattern file (PDF 00-018-1382, Cr Kα radiation) of tinaksite sample was published in the paper by Rogov et al. (1965) [1]. In addition, an experimental diffraction pattern (PDF 00-054-0646) was recorded by O. Karimova (IGEM RAS, Moscow, Russia, ICDD Grant-in-Aid, 2002) using a sample from the Khibiny massif. The other two diffraction patterns of tinaksite (PDF 01-072-1823 and PDF 01-071-1758) were calculated, in 2004, using POWD-12++. For calculations of these patterns, the crystal structure refinement data, published in the works of Petrunina et al. (1971) [28] and Bissert (1980) [29], were used. In both references, the tinaksite from the Murun massif was investigated.
For tokkoite, there are two files in the database (see Table 1 and Tables S1 and S2 in the Supplementary Materials), one of which contains the calculated powder pattern (PDF 01-079-1981) according to single-crystal data obtained by Rozhdestvenskaya et al. (1989) [30]. The second, PDF 00-040-0517 (experimental data from the paper of Lazebnik et al. (1986) [2]) is not suitable for indexing tokkoite due to the fact that an incorrect space group and a double value of the unit cell parameter b were used to process the diffraction pattern (see Table 1 and Tables S1 and S2 in the Supplementary Materials).
Considering the features of the tinaksite and tokkoite powder diffraction, we noted several significant details.
Firstly, it should be noted that the maximum reflection (intensity = 100% relative percent) in the experimental diffraction pattern of tinaksite and tokkoite does not correspond to those in the calculated diffraction patterns (d/nexp = 3.043 and 3.117 Å vs. d/ncalc = 10.223 and 10.261 Å for tinaksite and tokkoite, respectively). The position of the more intense peak of our samples is doubtless enhanced by the superimposition of reflections located in the interval 3.12–3.02 Å (according to the calculated diffraction pattern). The same results were obtained earlier for experiments with tinaksite from the Murun [1] and the Khibiny massifs (PDF-00-054-0646, Karimova, O.) and tokkoite ([2], PDF 00-040-0517) (see Table 1 and Tables S1 and S2 in the Supplementary Materials).
Secondly, for tinaksite and tokkoite, the reflections with indices hk0 and h k ¯ 0 are stronger than the intensity values calculated for them.
Thirdly, in both samples, a decrease in the intensity of reflections with indices h0l, h ¯ 0l, or h0 l ¯ as compared with the values calculated for them, is noted.
Finally, several reflections with indices of the 0k0 type also show overestimated intensities. This behavior of the reflections is explained by the ability of tinaksite crystals to split with cleavage in two directions, i.e., {110} and {010}. Thus, a preferred orientation arises. Figure 1 shows the crystal structure of tinaksite as seen along {110} (Figure 1a) and {010} (Figure 1b). It should be noted that the tetrahedral hybrid chains and octahedral layers extend along the c-axis, affecting the diffraction features of the studied minerals.
Comparing the diffraction patterns of tinaksite and tokkoite with each other (Figure 3), it is easy to note that some reflections of tinaksite are shifted towards larger values of the 2θ angle. These peaks are reflections with indices hk0 (Tables S1 and S2 in the Supplementary Materials). The shift is explained by the smaller values of the unit cell parameters a and b of tinaksite as compared with those of tokkoite (Table 1).

3.2. Spectroscopic Data

Raman spectra of tinaksite and tokkoite are given in Figure 4. The region with higher wavenumbers after 1200 cm−1 is not given due to a strong luminescence signal. Spectra are both dominated by intense bands, 1118 cm−1 in tinaksite and 1113 cm−1 in tokkoite, assigned to the stretching vibrations of Si–O [32,33]. The most intense bands in tinaksite and tokkoite are located in the region 600–700 cm−1. The bands at 676 and 644 cm−1 in tinaksite and 667 and 644 cm−1 in tokkoite are attributed to Si–O bending or Si–O bridging oxygen mode vibrations [32]. The bands in the region 400–500 cm−1 in the samples correspond to M2(Ca)–O stretching vibrations. The intensities of other bands in the Raman spectrum of tokkoite are much lower than in tinaksite. The bands below 400 cm−1 are due to Si–O–Si bending as well as Ca–O, Na–O, and K–O vibrations.
The tinaksite sample contains Ti4+ cations in M1 positions. Strong peaks in Raman spectrum of tinaksite at 907, 924, 995 cm−1 confirm that SiO4 units connect to TiO6 forming O3Si–O–Ti units where the Si–O bond is short [34]. This linkage perturbs other Si–O vibration modes.
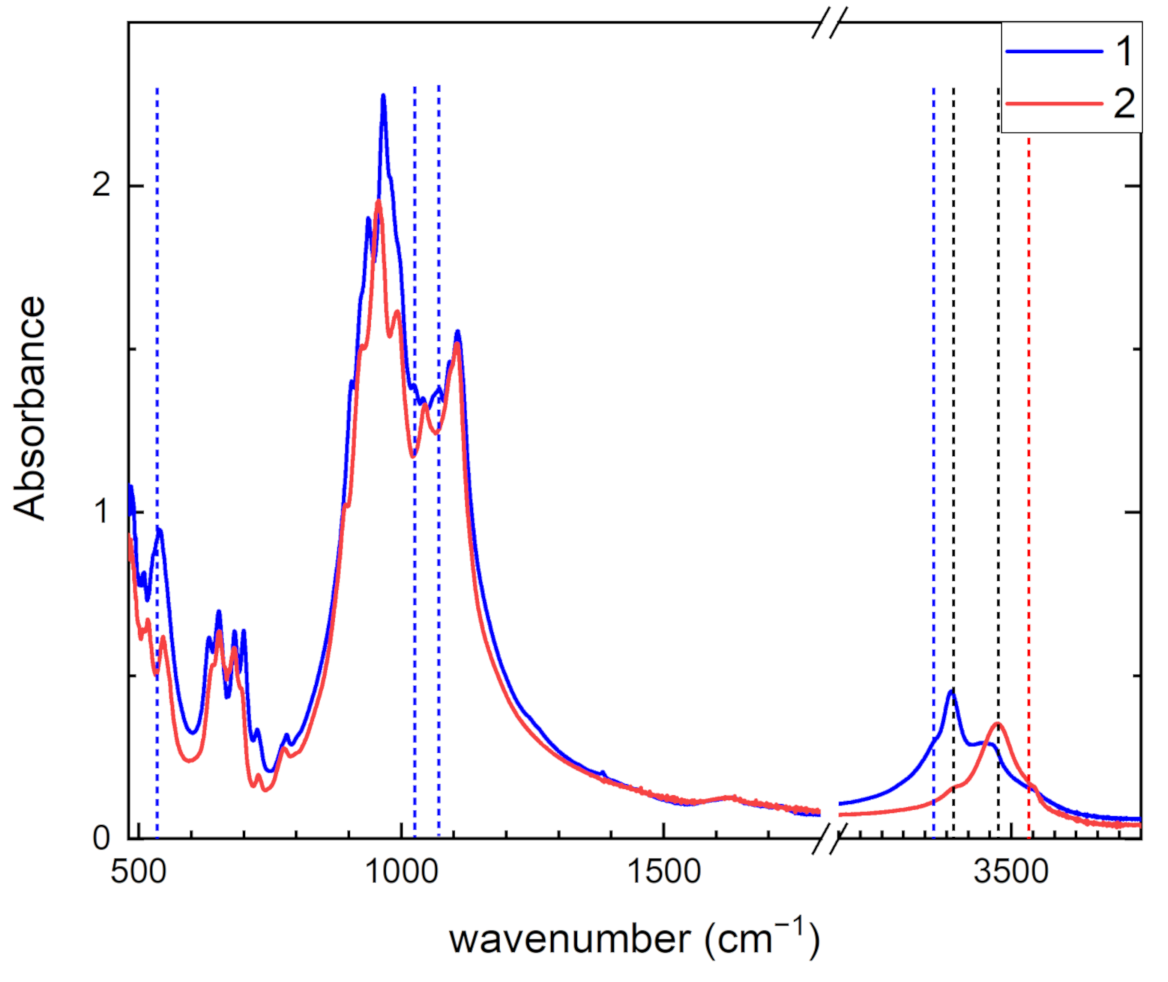
The infrared absorption spectra of tinaksite and tokkoite are given in Figure 5. These spectra are slightly different from each other despite the minerals being isostructural. The most obvious differences appear in the reflection spectra in the spectral region from 650 to 1200 cm−1 (Figure S1 in the Supplementary Materials). The peak positions and their suggested assignments are given in Table 2. The absorption bands, in the 480–520 cm−1 region, are attributed to the lattice modes involving Si–O–Si bending and M2–O stretching. In the 540–700 cm−1 region, bending O–Si–O vibration modes are located. The vibrational modes attributed to tetrahedral rings are found in the 720–930 cm−1 region. Stretching of apical Si–O bonds are located in the 950–1000 cm−1 region [5]. In the 1040–1110 cm−1 region, stretching modes of Si–O framework are found [26,35].
In tinaksite, the peaks at 527, 538, and 702 cm−1 are due to stretching vibrations of TiO6 [36,37]. In [38], a correlation between structural and IR spectroscopic data was found for Ti−O stretching frequency in the labuntsovite mineral group: ν Ti O = 667 + 27.02 x + 18.32 y + 8.60 z for (Fe, Mg, Mn, Zn)xCayNaz. Using this estimation in the case of tinaksite, ν Ti O 700 cm−1 is close to the experimental stretching frequency 702 cm−1. In tinaksite, peaks at 937, 1025, 1067, and 1077 cm−1, which are not found in tokkoite, correspond to Si–O–Ti stretching modes [39]. Therefore, the positions of the peaks in Raman and infrared absorption and reflection spectra of tinaksite attributed to lattice modes are shifted relative to tokkoite once due to Ti perturbation of the Si–O framework.
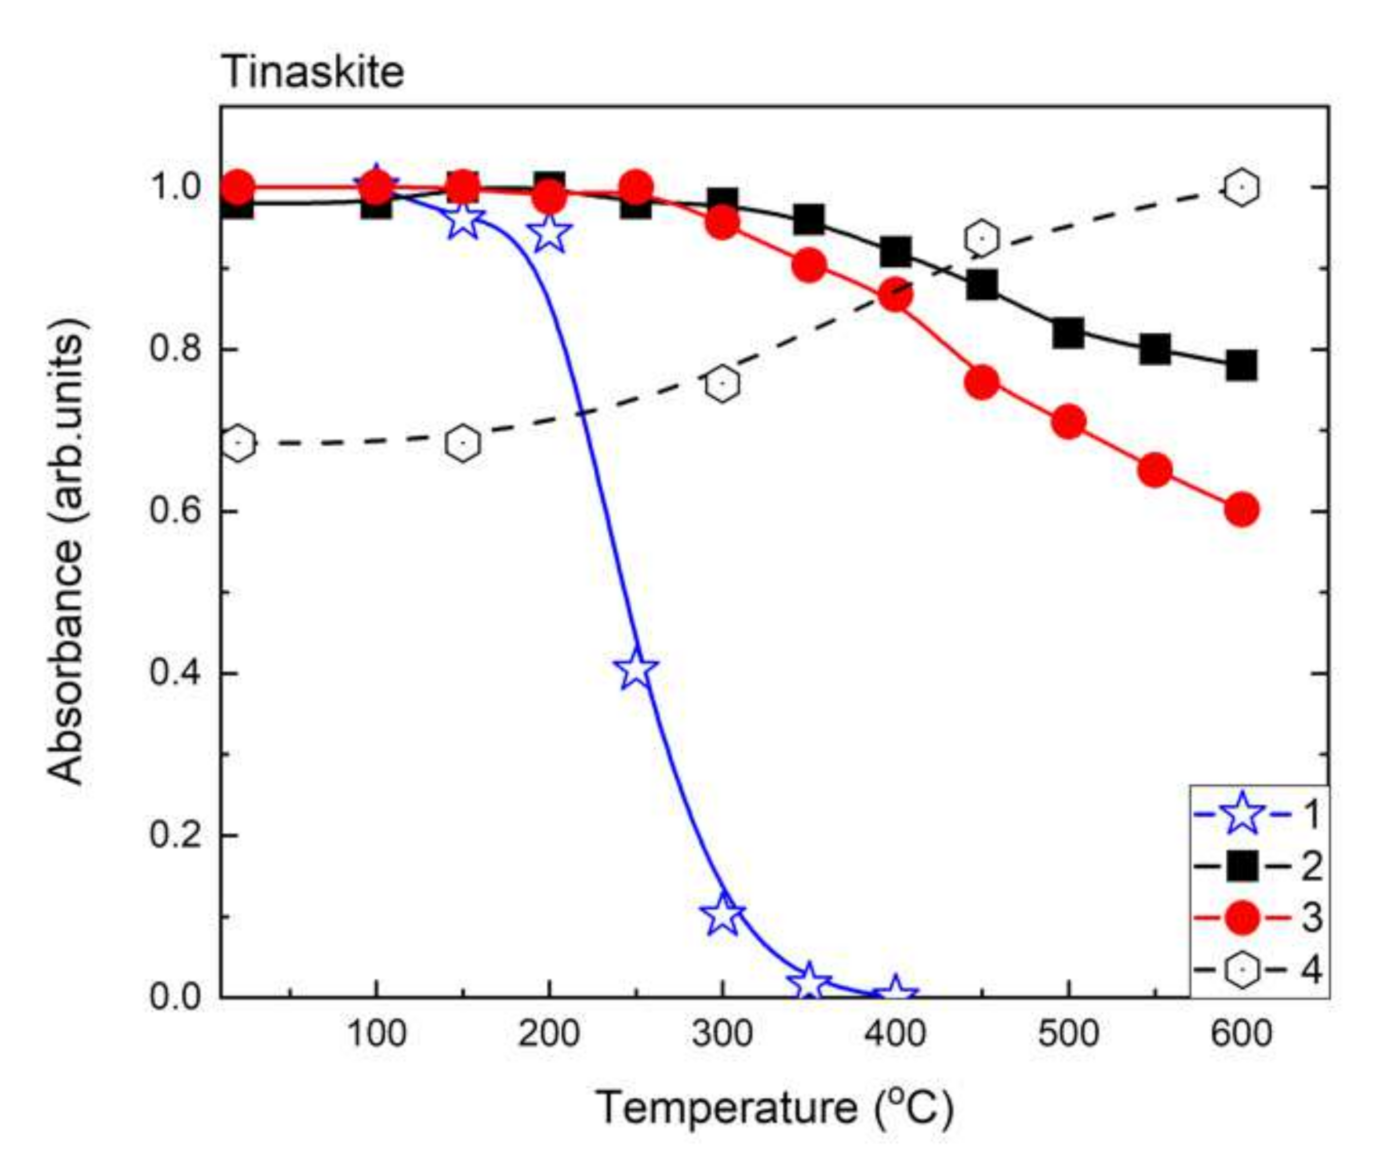
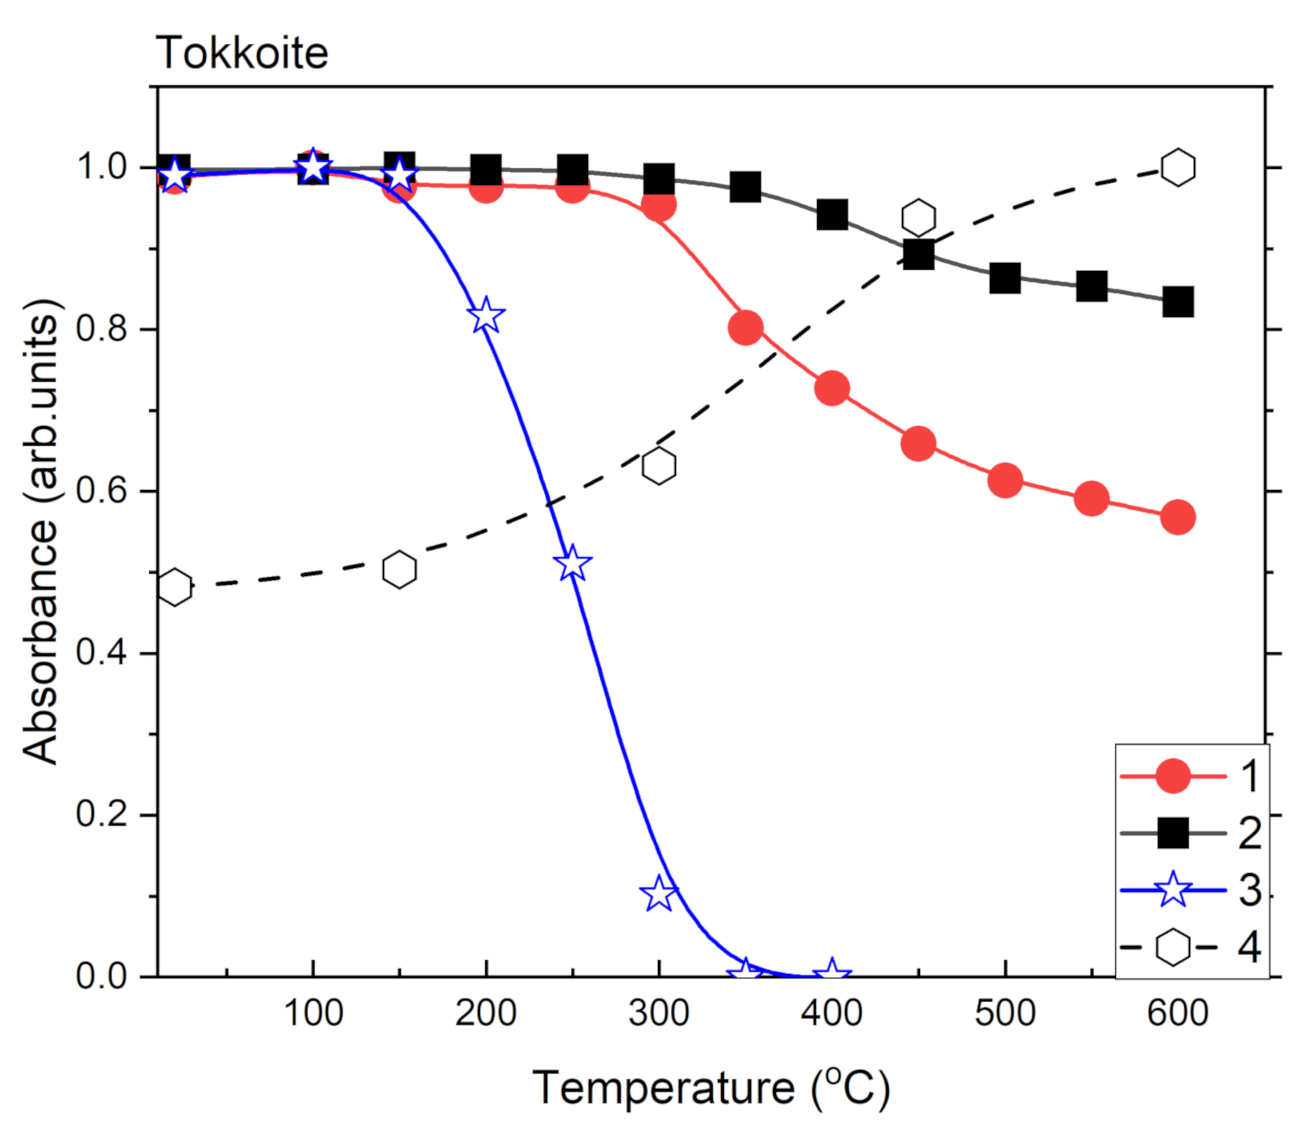
In the region of stretching O–H vibrations in tinaksite weak band at 3320 cm−1, a strong band at 3366 cm−1 and a moderate band at 3470 cm−1 are observed. In tokkoite, a weak band at 3366 cm−1, a strong band at 3470, and a weak band at 3540 cm−1 are found. The thermal treatment of tinaksite and tokkoite leads to a decrease in the intensity of these bands. The temperature dependences of these bands are given in Figure 6 for tinaksite and Figure 7 for tokkoite. The bands at 3320 cm−1 in tinaksite and 3540 cm−1 in tokkoite disappear completely at temperatures higher than 300 °C. Therefore, these bands are related to adsorbed water in the samples. The 3366 and 3470 cm−1 bands are slightly decreased during annealing at 600 °C. They are assigned to OH anions located in two different positions (O18 and O20, Figure 1a) in tinaksite and tokkoite crystal structures (see [18]).
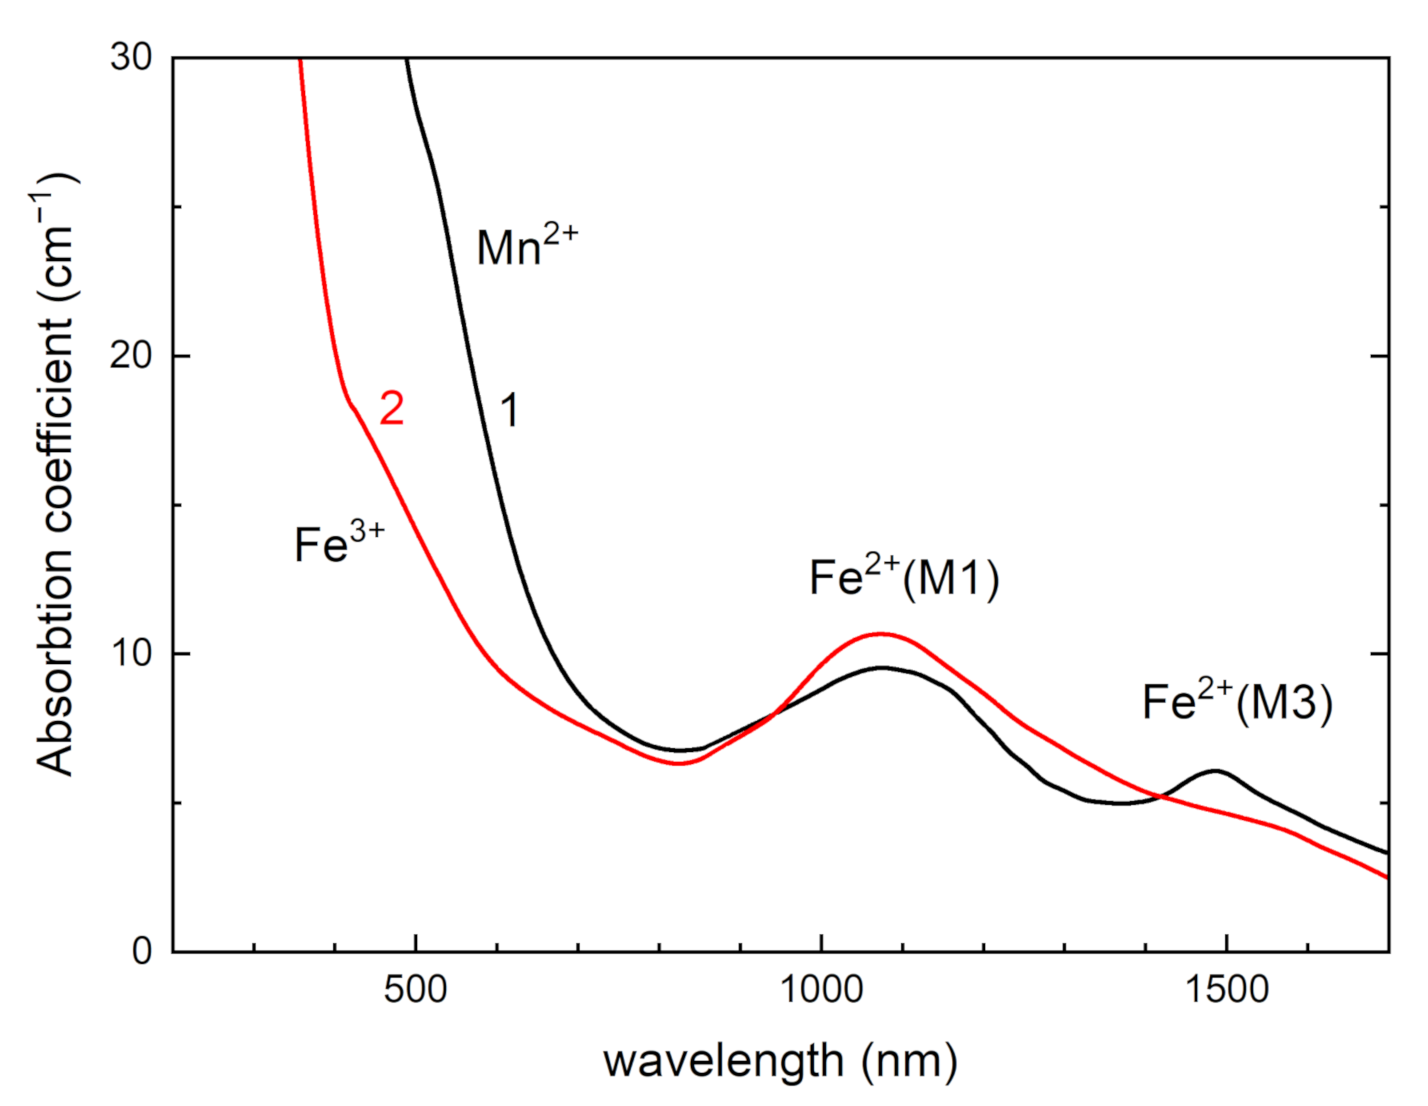
Optical absorption spectra of tinaksite and tokkoite in UV-Vis spectral region are given in Figure 8. The wide band at about 1070 nm is attributed to spin-allowed dd transitions in Fe2+ ions in position M1. The band at about 1500 nm is due to dd transitions in Fe2+ in position M3 (Figure 1a) [40,41]. The shoulder in absorption spectra at about 800 nm in tinaksite and 700 nm in tokkoite corresponds to the presence of Mn2+ and Fe3+ absorption bands [6,10,41]. The coloration of tinaksite and tokkoite is due to the presence of this shoulder. The shade of color depends on the relationship between Fe3+ and Mn2+ concentrations in tinaksite or tokkoite.
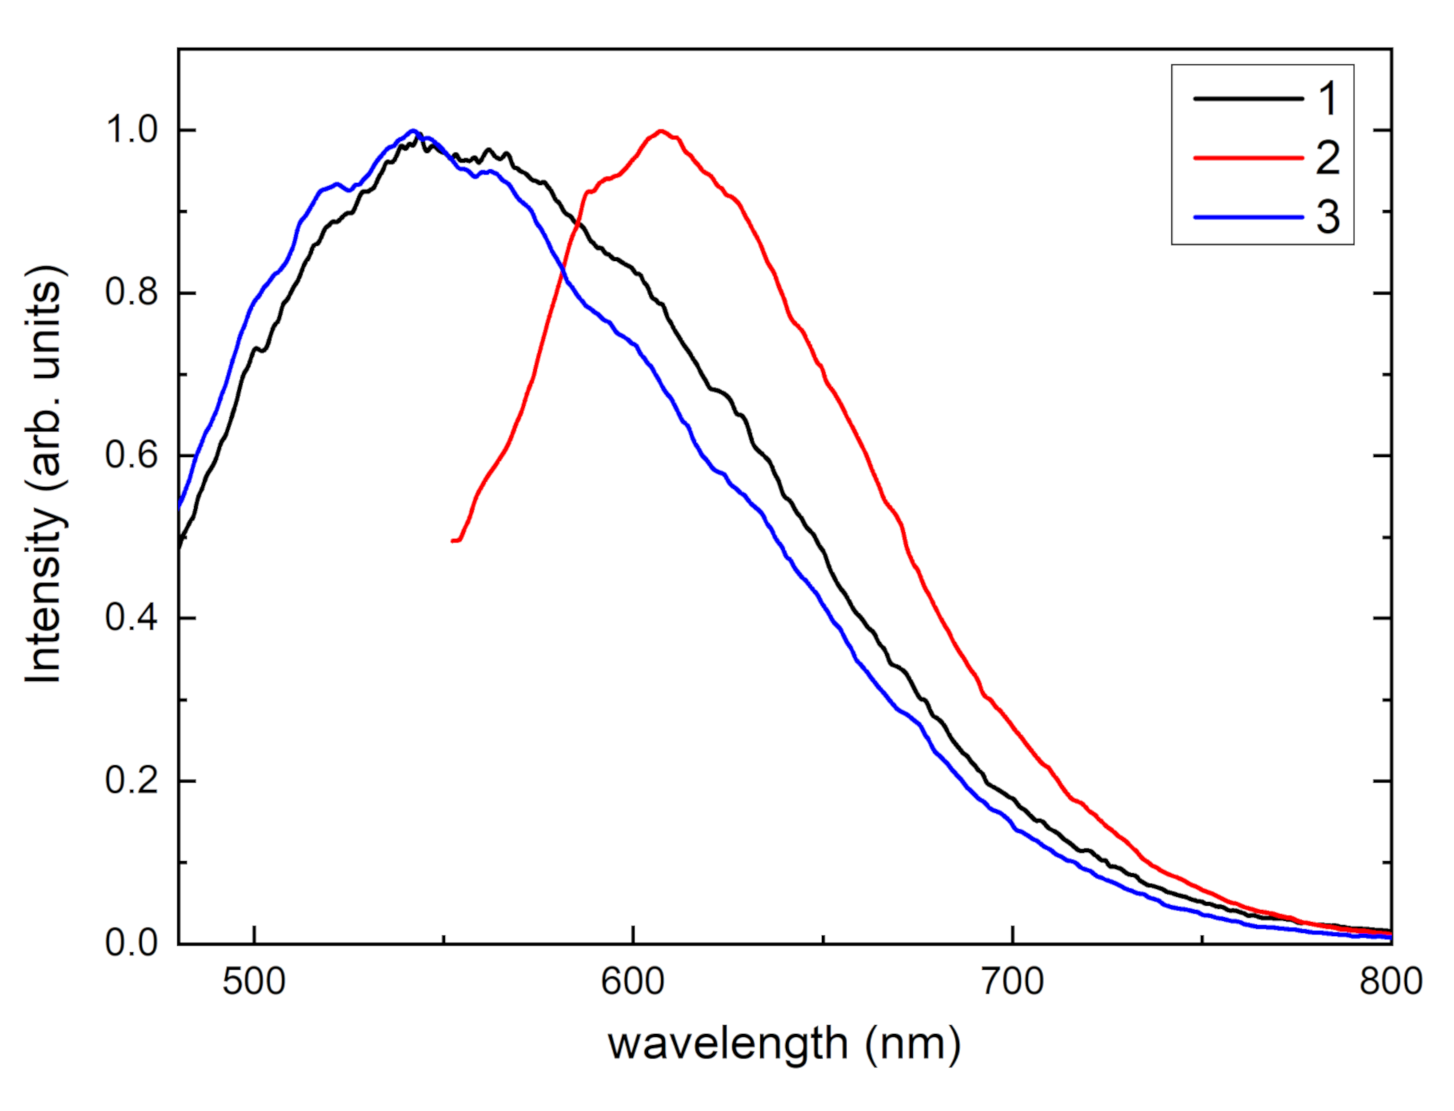
Luminescence spectra of tinaksite and tokkoite samples under 405 nm and 532 nm laser excitations are given in Figure 9. In the tinaksite sample, a wide luminescence band that peaks at about 560 nm is found under 405 nm excitation. The intensity of this luminescence slightly increases during cooling down to 77 K. At 77 K, strong luminescence band peaks at about 610 nm appear under 532 nm excitation. In tokkoite, there is no excited luminescence under 532 nm. However, a broad luminescence band with a maximum at about 545 nm is found. The intensity of observed luminescence in tinaksite and tokkoite is not decreased during heating and it remains intense at room temperature.
The luminescence band peaks at about 540–550 nm, which is attributed to Mn2+ centers [10,42,43]. However, luminescence at about 610 nm could be due to the presence of Ti3+ centers in the tinaksite [44]. The luminescence band of Mn2+ center is wide and located in the green spectral region and it is excited at 405 nm. Therefore, compounds based on tinaksite or tokkoite doped with Mn2+ ions will be promising materials for lanthanide-free luminophores for white LED. Mn2+ ions are located in several nonequivalent positions in the lattice. In the future, this may open wide possibilities for the creation of efficient phosphors.
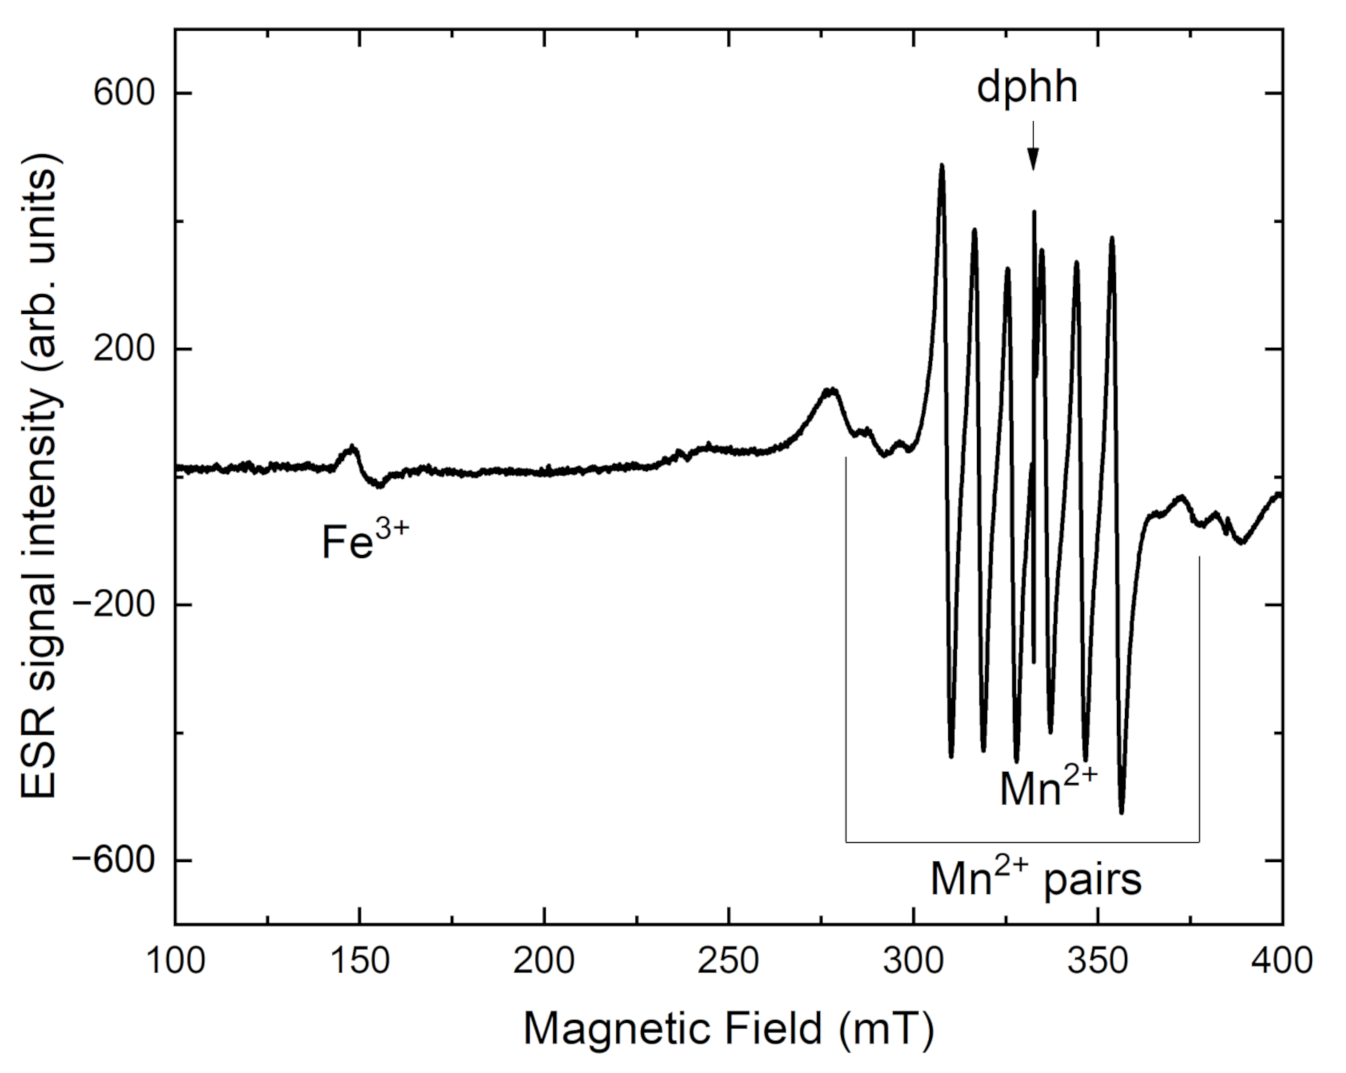
From Figure 10, the ESR parameters for the Mn2+ center in tinaksite are obtained as g = 2.005 and the hyperfine constant A = 90 G. On both sides of the spectrum, a broad ESR signal appears due to Mn2+–Mn2+ coupled pairs. It is confirmed by structural data, that Mn2+ has nonequivalent positions in the tinaksite [6,10,18]. In the tinaksite sample, the signal with g = 4.4 is attributed to Fe3+ ions located in a highly distorted octahedral field in the tinaksite [45].
In Figure 10, the ESR spectrum of tokkoite is shown. The Mn2+ center in tokkoite has g = 2.003 and hyperfine constant A = 93 G. The wide ESR signal with g = 2.001 is attributed to Fe3+ ions in the octahedral field. This signal is wide due to exchange interaction in Fe3+ pairs [46]. It is confirmed by crystal chemical data [18], that Fe-ions have two nonequivalent octahedral positions (M1 and M3, Figure 1a).
After heating intensity of the Fe3+ ESR signal is increased in both samples (Figure 10 and Figure 11). At the same time, the intensity of OH-group related band is decreased in tinaksite and tokkoite (Figure 6 and Figure 7). The OH is lost through an oxidation–dehydrogenation reaction as described in [41]. Therefore, the oxidation process leads to an increase in Fe3+ in the M1 position (Figure 1a), where the Fe2+ cations were located before the heating.

4. Conclusions

Tinaksite and tokkoite are not easy objects for research of any kind. The shapes of crystals in the form of radially radiant aggregates and thin needles of these superficially very similar minerals, due to structural features, may impose restrictions on research methods. This study showed that reliable results can be obtained using powder X-ray diffraction, which makes it possible to obtain a good resolution of reflections, determine trustworthy values of unit cell parameters (comparable to those obtained by single-crystal X-ray diffraction), and carry out reliable identification of structurally extremely similar minerals. The emergent preferred orientation of the powder particles due to mineral cleavage is not a critical limitation. Using the diffraction data presented in this paper, tinaksite and tokkoite can be distinguished without chemical investigation.
The results of spectroscopic studies of isostructural tinaksite and tokkoite emphasize their differences in optical properties. Most of all, this is highlighted by the Raman and IR spectroscopy data obtained, here, for the first time for the minerals.
Moreover, the study of the optical properties of tinaksite and tokkoite has not been carried out before now; in particular, studies on the origin of the color of the minerals have not been previously reported. The color of tinaksite and tokkoite is due to the presence of Fe3+ and Mn2+ in the crystal structure. Luminescence in the green spectral region registered in tinaksite and tokkoite correspond to dd transitions in Mn2+ ions.
In conclusion, the combination of X-ray diffraction and various spectroscopic methods provides a reliable way to identify differences and features in materials having similar crystal structures and chemical compositions.

Supplementary Materials

The following supporting information can be downloaded at https://www.mdpi.com/article/10.3390/cryst12030377/s1, Figure S1: Reflection spectra of tinaksite and tokkoite, Table S1: Experimental and calculated powder diffraction data of the studied tinaksite in comparison with PDF-2 database files, Table S2: Experimental and calculated powder diffraction data of the studied tokkoite in comparison with PDF-2 database files.

Author Contributions

Conceptualization, E.K. and R.S.; methodology, E.K. and R.S.; investigation, E.K. and R.S.; writing—original draft preparation, E.K. and R.S.; writing—review and editing, E.K. and R.S.; visualization, E.K. and R.S. All authors have read and agreed to the published version of the manuscript.

Funding

This research was supported by the Russian Science Foundation (project no. 22-27-00183).

Institutional Review Board Statement

Not applicable.

Informed Consent Statement

Not applicable.

Data Availability Statement

Not applicable.

Acknowledgments

The study was carried out using the facilities of the Centers for Collective Use: “Center for isotopic-geochemical investigations” at the Vinogradov Institute of Geochemistry SB RAS. The samples for this investigation were kindly provided by M.A. Mitichkin and N.V. Vladykin. We thank T.A. Radomskaya for providing us with photos of the samples. The authors are grateful to I.S. Sharygin and A.E. Marfin for the facilities at the Laboratory of Orogenesis at the Institute of the Earth’s Crust SB RAS. We are grateful to reviewers for their valuable comments.

Conflicts of Interest

The authors declare no conflict of interest.

References

  1. Rogov, Y.G.; Rogova, V.P.; Voronkov, A.A.; Moleva, V.A. Tinaksite, NaK2Ca2TiSi7O19(OH), a new mineral. Dokl. Acad. Nauk SSSR 1965, 162, 658–661. [Google Scholar]
  2. Lazebnik, K.A.; Nikishova, L.V.; Lazebnik, Y.D. Tokkoite—A new mineral of charoitites. Mineral. Zhurnal 1986, 8, 85–89. [Google Scholar]
  3. Sokolova, M.N.; Zabavnikova, N.I.; Yakovlevskaya, T.A.; Rudnitskaya, E.S. Tinaksite from pegmatites of the apatite deposit Rasvumchorr (Khibiny Massif). Proc. Rus. Miner. Soc. 1975, 104, 39–43. [Google Scholar]
  4. Kostyleva-Labuntsova, E.E.; Borutzky, B.E.; Sokolova, M.N.; Shlyukova, Z.V.; Dorfman, M.D.; Dudkin, O.B.; Kozyreva, L.V.; Ikorskii, S.V. Mineralogy of Khibiny Massif; Nauka: Moscow, Russia, 1978; Volume 1, p. 228. [Google Scholar]
  5. Kasatkin, A.V.; Cámara, F.; Chukanov, N.V.; Škoda, R.; Nestola, F.; Agakhanov, A.A.; Belakovskiy, D.I.; Lednyov, V.S. Patynite, NaKCa4[Si9O23], a new mineral from the Patynskiy massif, Southern Siberia, Russia. Minerals 2019, 9, 611. [Google Scholar] [CrossRef] [Green Version]
  6. Kaneva, E.; Shendrik, R.; Mesto, E.; Bogdanov, A.; Vladykin, N. Spectroscopy and crystal chemical properties of NaCa2[Si4O10]F natural agrellite with tubular structure. Chem. Phys. Lett. 2020, 738, 136868. [Google Scholar] [CrossRef]
  7. Kaneva, E.; Lacalamita, M.; Mesto, E.; Schingaro, E.; Scordari, F.; Vladykin, N. Structure and modeling of disorder in miserite from the Murun (Russia) and Dara-i-Pioz (Tajikistan) massifs. Phys. Chem. Miner. 2014, 41, 49–63. [Google Scholar] [CrossRef]
  8. Rozhdestvenskaya, I.V.; Nikishova, L.V. The crystal structure of frankamenite. Miner. Mag. 1996, 60, 897–905. [Google Scholar] [CrossRef]
  9. Kaneva, E.; Radomskaya, T.; Suvorova, L.; Sterkhova, I.; Mitichkin, M. Crystal chemistry of fluorcarletonite, a new mineral from the Murun alkaline complex (Russia). Eur. J. Miner. 2020, 32, 137–146. [Google Scholar] [CrossRef] [Green Version]
  10. Kaneva, E.V.; Shendrik, R.Y.; Radomskaya, T.A.; Suvorova, L.F. Fedorite from Murun alkaline complex (Russia): Spectroscopy and crystal chemical features. Minerals 2020, 10, 702. [Google Scholar] [CrossRef]
  11. Dunn, P.J.; Wilson, W.E. Nomenclature revisions in the apophyllite group: Hydroxyapophyllite, apophyllite, fluorapophyllite. Miner. Rec. 1978, 3, 95–98. [Google Scholar]
  12. Rozhdestvenskaya, I.V.; Vasilieva, V.A. Cation ordering and structural deformations in pectolite HNaCaSi3O9–serandite HNaMn2Si3O9. J. Struct. Chem. 2014, 55, 1268–1276. [Google Scholar] [CrossRef]
  13. Rozhdestvenskaya, I.V.; Mugnaioli, E.; Schowalter, M.; Schmidt, M.U.; Czank, M.; Depmeier, W.; Rosenauerd, A. The structure of denisovite, a fibrous nanocrystalline polytypic disordered ‘very complex’ silicate, studied by a synergistic multi-disciplinary approach employing methods of electron crystallography and X-ray powder diffraction. IUCr J. 2017, 4, 223–242. [Google Scholar] [CrossRef] [PubMed]
  14. Rozhdestvenskaya, I.; Mugnaioli, E.; Czank, M.; Depmeier, W.; Kolb, U.; Reinholdt, A.; Weirich, T. The structure of charoite, (K, Sr, Ba, Mn)15-16(Ca, Na)32[Si70(O,OH180](OH,F)4·nH2O, solved by conventional and automated electron diffraction. Miner. Mag. 2010, 74, 159–177. [Google Scholar] [CrossRef] [Green Version]
  15. Rozhdestvenskaya, I.; Mugnaioli, E.; Czank, M.; Depmeier, W.; Kolb, U.; Merlino, S. Essential features of the polytypic charoite-96 structure compared to charoite-90. Miner. Mag. 2011, 75, 2833–2846. [Google Scholar] [CrossRef]
  16. Kaneva, E.V.; Radomskaya, T.A.; Shendrik, R.Y.; Chubarov, V.M.; Amosova, A.A.; Mitichkin, M.A. FTIR, XRF and powder XRD experimental study of charoite: Crystal chemical features of two associated generations. In Minerals: Structure, Properties, Methods of Investigation. Springer Proceedings in Earth and Environmental Sciences; Votyakov, S., Kiseleva, D., Grokhovsky, V., Shchapova, Y., Eds.; Springer: Cham, Switzerland, 2020; pp. 97–104. [Google Scholar] [CrossRef]
  17. Liebau, F. Structural Chemistry of Silicates: Structure, Bonding, and Classification; Springer: New York, NY, USA, 2012. [Google Scholar]
  18. Lacalamita, M.; Mesto, E.; Kaneva, E.; Scordari, F.; Pedrazzi, G.; Vladykin, N.; Schingaro, E. Structure refinement and crystal chemistry of tokkoite and tinaksite from the Murun massif (Russia). Miner. Mag. 2017, 81, 251–272. [Google Scholar] [CrossRef]
  19. Uvarova, Y.A.; Sokolova, E.; Hawthorne, F.C.; Agakhanov, A.A.; Pautov, L.A.; Karpenko, V.Y. The crystalchemistry of senkevichite, CsKNaCa2TiO[Si7O18(OH)], from the Dara-i-Pioz alkaline massif, northern Tajikistan. Can. Miner. 2006, 44, 1341–1348. [Google Scholar] [CrossRef]
  20. Momma, K.; Izumi, F. VESTA 3 for three-dimensional visualization of crystal, volumetric and morphology data. J. Appl. Crystallogr. 2011, 44, 1272–1276. [Google Scholar] [CrossRef]
  21. Kaneva, E.V. Crystal Structure and Crystal Chemical Studies of Minerals of Alkaline Rocks from Russia, Tajikistan and Mongolia. Ph.D. Thesis, Universitá degli Studi di Bari “Aldo Moro”, Bari, Italy, 2014. [Google Scholar]
  22. Bruker AXS. Bruker AXS EVAluation of Powder Diffraction Data, Version 14.0.0.0; Bruker AXS: Madison, WI, USA, 2008. [Google Scholar]
  23. ICDD. The Powder Diffraction File; International Center for Diffraction Data: Newton Square, PA, USA, 2007. [Google Scholar]
  24. Faber, J.; Fawcett, T. The Powder Diffraction File: Present and future. Acta Crystallogr. 2002, B58, 325–332. [Google Scholar] [CrossRef] [Green Version]
  25. Coelho, A.A. TOPAS and TOPAS-Academic: An optimization program integrating computer algebra and crystallographic objects written in C++. J. Appl. Cryst. 2018, 51, 210–218. [Google Scholar] [CrossRef] [Green Version]
  26. Kaneva, E.; Bogdanov, A.; Shendrik, R. Structural and vibrational properties of agrellite. Sci. Rep. 2020, 10, 15569. [Google Scholar] [CrossRef]
  27. Sapozhnikov, A.N.; Tauson, V.L.; Lipko, S.V.; Shendrik, R.Y.; Levitskii, V.I.; Suvorova, L.F.; Chukanov, N.V.; Vigasina, M.F. On the crystal chemistry of sulfur-rich lazurite, ideally Na7Ca(Al6Si6O24)(SO4)(S3)·nH2O. Amer. Miner. 2021, 106, 226–234. [Google Scholar] [CrossRef]
  28. Petrunina, A.A.; Ilyukhin, V.V.; Belov, N.V. Crystal structure of tinaksite NaK2Ca2TiSi7O19(OH). Sov. Phys. Dokl. 1971, 16, 338–340. [Google Scholar]
  29. Bissert, G. Verfeinerung der struktur von tinaksit, Ca2K2NaTiO[Si7O18(OH)]. Acta Crystallogr. 1980, B36, 259–263. [Google Scholar] [CrossRef]
  30. Rozhdestvenskaya, I.V.; Nikishova, L.V.; Lazebnik, Y.D.; Lazebnik, K.A. The crystal structure of tokkoite and its relation to the structure of tinaksite. Z. Kristallogr. 1989, 189, 195–204. [Google Scholar] [CrossRef]
  31. Rozhdestvenskaya, I.V.; Nikishova, L.V.; Lazebnik, K.A. Features of the crystal structure of minerals of the tinaksite group. Miner. Zhurnal 1991, 13, 3–12. [Google Scholar]
  32. Huang, E.; Chen, C.H.; Huang, T.; Lin, E.H.; Xu, J. Raman spectroscopic characteristics of Mg-Fe-Ca pyroxenes. Amer. Miner. 2000, 85, 473–479. [Google Scholar] [CrossRef]
  33. Shendrik, R.; Kaneva, E.; Radomskaya, T.; Sharygin, I.; Marfin, A. Relationships between the structural, vibrational, and optical properties of microporous cancrinite. Crystals 2021, 11, 280. [Google Scholar] [CrossRef]
  34. Su, Y.; Balmer, M.L.; Bunker, B.C. Raman spectroscopic studies of silicotitanates. J. Phys. Chem. B 2000, 104, 8160–8169. [Google Scholar] [CrossRef]
  35. Bogdanov, A.; Kaneva, E.; Shendrik, R. New insights into the crystal chemistry of elpidite, Na2Zr[Si6O15]·3H2O and (Na1+yCax1-x-y)∑=2Zr[Si6O15]·(3-x)H2O, and ab initio modeling of IR spectra. Materials 2021, 14, 2160. [Google Scholar] [CrossRef]
  36. Byrne, C.; Fagan, R.; Hinder, S.; McCormack, D.E.; Pillai, S.C. New approach of modifying the anatase to rutile transition temperature in TiO2 photocatalysts. RSC Adv. 2016, 6, 95232–95238. [Google Scholar] [CrossRef]
  37. Dong, B.; Liu, Y.; Han, N.; Sun, H.; Xing, F.; Qin, D. Study on the microstructure of cement-based piezoelectric ceramic composites. Constr. Build. Mater. 2014, 72, 133–138. [Google Scholar] [CrossRef]
  38. Pekov, I.V.; Chukanov, N.V.; Tarassoff, P.; Yamnova, N.A.; Zadov, A.E. Gjerdingenite-Na and gjerdingeniteCa, two new minerals of the labuntsovite group. Can. Miner. 2007, 45, 529–539. [Google Scholar] [CrossRef]
  39. Almeida, R.M.; Marques, A.C. Characterization of sol–gel materials by infrared spectroscopy. In Handbook of Sol-Gel Science and Technology; Klein, L., Aparicio, M., Jitianu, A., Eds.; Springer: Cham, Switzerland, 2016; p. 1137. [Google Scholar] [CrossRef]
  40. Burns, R.G. Mineralogical Application of Crystal Field Theory; Cambridge University Press: Cambridge, UK, 1993. [Google Scholar] [CrossRef] [Green Version]
  41. Kaneva, E.; Radomskaya, T.; Shendrik, R.; Chubarov, V.; Danilovsky, V. Potassic-hastingsite from the Kedrovy district (East Siberia, Russia): Petrographic description, crystal chemistry, spectroscopy, and thermal behavior. Minerals 2021, 11, 1049. [Google Scholar] [CrossRef]
  42. Zhou, O.; Dolgov, L.; Srivastava, A.M.; Zhou, L.; Wang, Z.; Shi, J.; Dramićanin, M.D.; Brik, M.G.; Wu, M. Mn2+ and Mn4+ red phosphors: Synthesis, luminescence and applications in WLEDs. A review. J. Mater. Chem. C 2018, 11, 2652–2671. [Google Scholar] [CrossRef]
  43. Yarovoy, P.N. Laser-Induced Luminescence Identification of Materials. 1996. Available online: https://luminescence.csiro.au/ (accessed on 17 February 2022).
  44. Rogers, E.G.; Dorenbos, P. Vacuum energy referred Ti3+/4+ donor/acceptor states in insulating and semiconducting inorganic compounds. J. Lumin. 2014, 153, 40–45. [Google Scholar] [CrossRef]
  45. Naik, R.; Prashantha, S.C.; Nagabhushana, H.; Girish, K.M. Electrochemical, photoluminescence and EPR studies of Fe3+ doped nano forsterite: Effect of doping on tetra and octahedral sites. J. Lumin. 2018, 197, 233–241. [Google Scholar] [CrossRef]
  46. Abragam, A.; Bleaney, B. Electron Paramagnetic Resonance of Transition Ions; Oxford University Press: Oxford, UK, 2012. [Google Scholar]
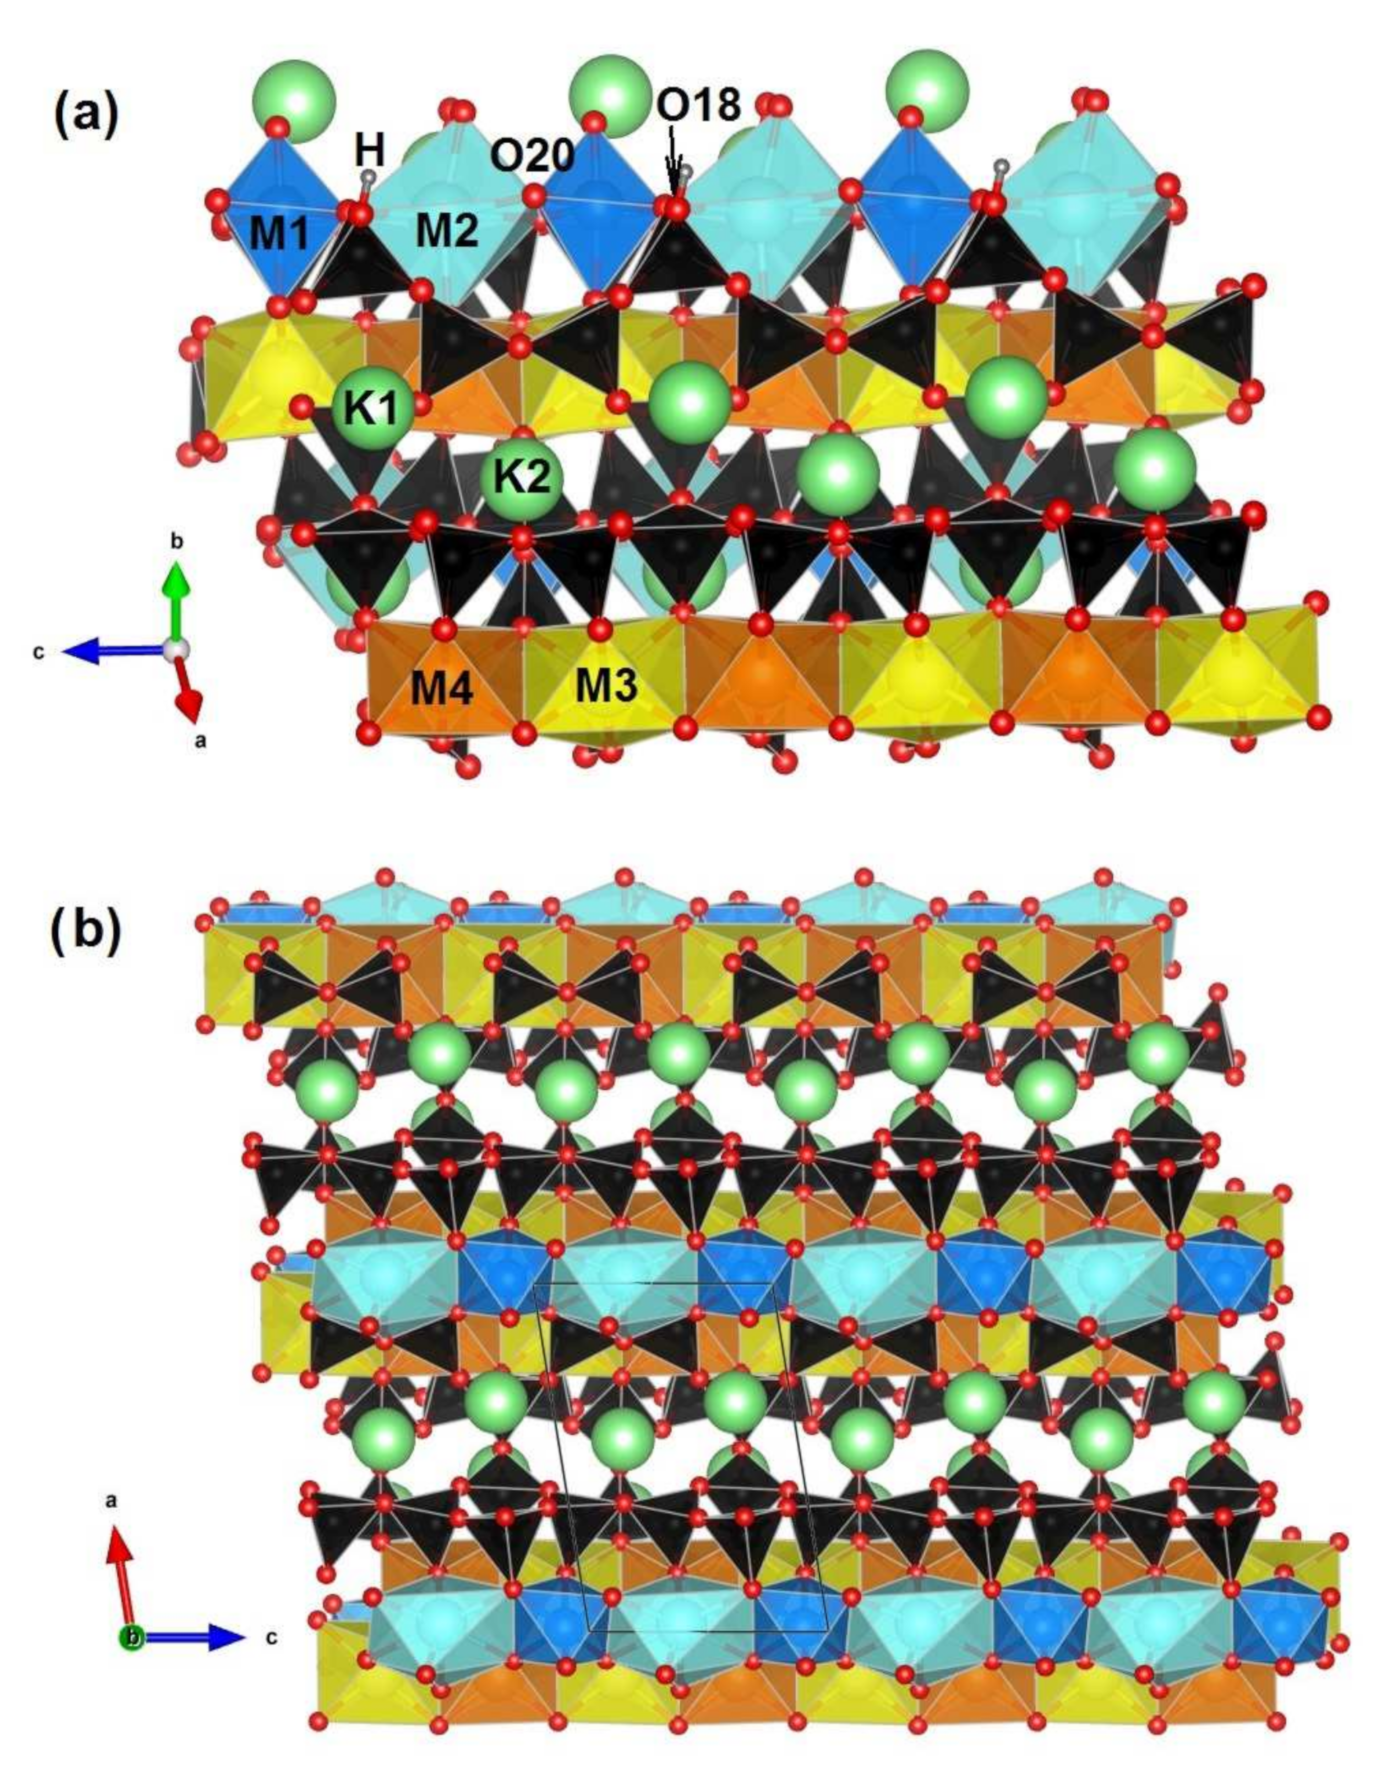
Figure 1. Crystal structure of the studied tinaksite projected down to {110} (a) and {010} (b). Si- tetrahedra are black; Ti-octahedra (M1) and Na-polyhedra (M2) are blue and cyan, respectively; M3 and M4 Ca-octahedra are yellow and orange, respectively. In the tokkoite crystal structure, all the M positions are occupied by Ca ions. K atoms are light green, O and H atoms are drawn in red and grey, respectively. The figure was prepared in the program VESTA (version 4.3.0) [20] using single-crystal data obtained in [21].
Crystals 12 00377 g001
Figure 2. The polished side of the sample of tinaksite-containing (a) and tokkoite-containing (b) charoitite. Tinaksite (a) is light brown, tokkoite (b) is light brown to brown, charoite is violet. The specimens are deposited at the Sidorov State Mineralogical Museum (INRTU, Irkutsk, Russia). Photo by Tatiana Radomskaya.
Crystals 12 00377 g002
Figure 3. (a) X-ray powder diffraction patterns (XRPDP) of tinaksite and tokkoite; (b) experimental and calculated XRPDP of tinaksite; (c) experimental and calculated XRPDP of tokkoite. The range of 5–70° 2θ is shown.
Crystals 12 00377 g003
Figure 4. Raman spectra of tinaksite (1) and tokkoite (2).
Crystals 12 00377 g004
Figure 5. Infrared absorption spectra of tinaksite (1) and tokkoite (2). Vertical lines point positions of Ti-related and OH stretching bands.
Crystals 12 00377 g005
Figure 6. Temperature dependences of relative absorbance of 3320 cm−1 (1); 3366 cm−1 (2); 3470 cm−1 (3) bands and intensity of Fe3+ signal in ESR spectrum (4) of tinaksite.
Crystals 12 00377 g006
Figure 7. Temperature dependences of relative absorbance of 3360 cm−1 (1); 3470 cm−1 (2); 3540 cm−1 (3) bands and intensity of Fe3+ signal in ESR spectrum (4) of tokkoite.
Crystals 12 00377 g007
Figure 8. Optical absorption spectra of tinaksite (1) and tokkoite (2).
Crystals 12 00377 g008
Figure 9. Photoluminescence spectra of tinaksite under 405 nm (curve 1) and 532 nm (curve 2) excitations and tokkoite under 405 nm excitation (curve 3) at 77 K.
Crystals 12 00377 g009
Figure 10. ESR spectrum of tinaksite.
Crystals 12 00377 g010
Figure 11. ESR spectrum of tokkoite.
Crystals 12 00377 g011
Table 1. Unit cell parameters, space group, and crystal chemical formulas of tinaksite and tokkoite as compared with the data in the literature and PDF-2 files. PDF 00–018-1382—[1], tinaksite from Murun massif, Cr Kα radiation; PDF 00–054-0646—Karimova O. IGEM RAS, Moscow, Russia, ICDD Grant-in-Aid, 2002, tinaksite from the Khibiny massif, Cu Kα radiation; PDF 01–072-1823—calculated from ICSD using POWD-12++ (2004), [28], tinaksite from Murun massif, Cu Kα radiation; PDF 01-071-1758—calculated from ICSD using POWD-12++ (2004), [29], tinaksite from Murun massif, Cu Kα radiation; PDF 00-040-0517—[2], tokkoite from Murun massif, unknown radiation; PDF 01-079-1981—calculated from ICSD using POWD-12++ (2004), [30], tokkoite from Murun massif, Cu Kα radiation.
a (Å)b (Å)c (Å)α (°)β (°)γ (°)Sp. Gr.Source
Tinaksite
10.371 (6)12.167 (6)7.060 (5)90.91 (2)99.37 (3)92.79 (3) P 1 ¯ This work
10.375 (2)12.190 (2)7.057 (1)90.75 (3)99.25 (3)92.81 (3) P 1 ¯ [18]
10.370 (1)12.162 (1)7.057 (1)90.89 (1)99.20 (1)92.80 (1) P 1 ¯ [18]
10.361 (2)12.153 (2)7.044 (1)90.79 (2)99.22 (2)92.83 (2) P 1 ¯ [31]
10.35012.1707.05091.0099.3392.50 P 1 ¯ PDF 00-018-1382
10.36912.1777.05290.0099.0092.00 P 1 ¯ PDF 00-054-0646
10.35012.1707.05091.0099.3392.50P1PDF 01-072-1823
10.37712.1667.05990.9199.3092.76 P 1 ¯ PDF 01-071-1758
Tokkoite
10.436 (5)12.474 (7)7.085 (4)89.98 (3)99.50 (3)92.89 (3) P 1 ¯ This work
10.423 (1)12.492 (1)7.116 (1)89.89 (1)99.69 (1)92.95 (1) P 1 ¯ [18]
10.424 (1)12.477 (1)7.113 (1)89.88 (1)99.68 (1)92.99 (1) P 1 ¯ [18]
10.423 (1)12.462 (1)7.106 (1)89.98 (1)99.68 (1)92.95 (1) P 1 ¯ [18]
10.37025.3907.27091.67100.6692.09 P 1 ¯ PDF 00-040-0517
10.43812.5117.11289.9299.7592.89 P 1 ¯ PDF 01-079-1981
Table 2. Infrared band positions and suggested assignments of the observed bands in the lattice region of tinaksite and tokkoite.
Wavenumber (cm−1)Assignment
TinaksiteTokkoite
485Lattice modes involving Si–O–Si bending and Ca–O stretching
510518
527 TiO6 stretching
538
546O–Si–O bending vibrations
634641
653
682
702 TiO6 stretching
727Tetrahedral ring vibrations
777
893905
923
937 Si–O–Ti stretching
956966Stretching vibrations of apical Si–O bonds
994
1025 Si–O–Ti stretching
1044Stretching vibrations of the Si–O–Si framework
1067 Si–O–Ti stretching
1077
1097Stretching vibrations of the Si–O–Si framework
1108
3320 w Adsorbed H2O
3366 s3366 wOH
3470 m3470 sOH
3540 wAdsorbed H2O
Publisher’s Note: MDPI stays neutral with regard to jurisdictional claims in published maps and institutional affiliations.