Article

Gas Permeability Prediction of Mortar Samples Based on Different Methods

1
School of Civil Engineering, Sun Yat-sen University & Southern Marine Science and Engineering Guangdong Laboratory, Zhuhai 519082, China
2
School of Environment and Civil Engineering, Dongguan University of Technology, Dongguan 523000, China
3
School of Civil Engineering, Guangzhou City University of Technology, Guangzhou 510800, China
*
Author to whom correspondence should be addressed.
Crystals 2022, 12(5), 581; https://doi.org/10.3390/cryst12050581
Submission received: 24 March 2022 / Revised: 11 April 2022 / Accepted: 14 April 2022 / Published: 21 April 2022
(This article belongs to the Special Issue Advances in Cement-Based and Construction Materials)

Abstract

:
Gas permeability is one of the durability indicators of cementitious materials; permeability predictions based on pore characteristics are useful approaches to obtain gas permeability when experimental conditions are limited. In this study, the gas permeabilities of mortar are predicted by using the Hagen–Poiseuille equation combined with a processed backscattered electron (BSE) image, the Katz–Thompson equation, and the Winland model with pore parameters obtained from MIP tests. The permeabilities calculated by the BSE method are different from the measured value because the observation range is limited and it is difficult to completely display the actual pore structure. The Katz–Thompson equation underestimates the contribution of coarse capillary pores on permeability, thus the results are two orders of magnitude lower than the measured value. The results obtained from the Winland model are close to the measured permeabilities, which indicate that the Winland model is the most suitable method for predicting gas permeability among the three methods described in this paper.

1. Introduction

Cementitious materials are the most widely used building materials in the world; the durability properties, which determine the long-term performance of the cementitious materials and further affect the service life of cement-based structures, have attracted the attention of many scholars. Gas permeability is one of the indicators for evaluating the durability of cementitious materials [1] since the infiltration of O2 and CO2 may lead to the performance deterioration because of the carbonation of cementitious materials and corrosion of steel bars [2]. The relationship between the CO2 diffusion coefficient and gas permeability has been investigated and the carbonation resistance can be indirectly assessed through gas permeability [3,4]. Moreover, compared with a liquid seepage medium such as water, gas can penetrate into pores with finer diameter, which makes it more suitable to evaluate the performance of modern cementitious materials with high compactness [5].
The gas permeability of cementitious materials can be measured by laboratory tests; previous studies indicated that the gas permeability is influenced by the pore characteristics such as the porosity, the critical pore diameter, and the pore size distribution [6,7]; other factors such as moisture content, aggregate size effects, and microcracking also have obvious influence on the gas permeability [8,9]. However, the measurement of gas permeability requires high air tightness and accuracy for the test instrument, which increases the difficulty and cost of test instrument manufacture and makes the measurement of gas permeability is less universal. Therefore, gas permeability prediction of cementitious materials based on pore characteristics becomes a useful method to obtain the permeability value and evaluate the durability when lacking experimental conditions. Different analytical models on predicting gas permeability from microstructure properties have been proposed by scholars, and the microstructure properties are generally characterized by the backscattered electron images (BSE) and the mercury intrusion porosimetry test (MIP).
The backscattered electron images (BSE) have been widely used to characterize micromorphology, pore structure, and hydration products of cementitious materials [10,11]. However, most of studies on pore structure are qualitative analysis, which makes it difficult to establish the relationship between gas permeability and the pore structure characterized by BSE images. Through image processing technology, the porosity and the pore size distribution can be characterized quantitatively and makes it possible to predict the gas permeability of the sample by the BSE images. Therefore, it is vital to find an appropriate algorithm to extract and analyze the pore structure since the gas permeability is estimated through the extracted pore structure characteristics. Wong et al. [12,13] presented methods to predict the gas permeability using the BSE images and effective medium theory; the results showed that most of the predicted values corresponded closely to the measured values. Wei et al. [14] adopted the general effective media (GEM) model to predict the permeability of OPC paste; however, the results lack comparison with the measured value.
The mercury intrusion porosimetry test (MIP) is a commonly used technology on the pore structure characterization of the porous medium since it can intuitively provide pore structure properties such as porosity, pore size distributions, the critical pore diameter, the median pore diameter, etc., and it needs a suitable permeability prediction model to calculate the gas permeability by using the obtained pore structure properties. Different permeability prediction models, including both empirical models and theoretical models, have been proposed based on the pore structure properties obtained by the MIP test. Hamami et al. [1] investigated the relationship between the critical pore diameter and the gas permeability; here, the critical pore diameter is defined as the pore diameter of the main peak on the pore size distribution. The results showed that the gas permeability is well fitted by the critical pore diameter and the total pore volume fraction. Tsivilis et al. [15] proposed an empirical model to predict the gas permeability by using the mean pore diameter. Sakai [16] used the threshold pore diameter, which was determined through percolation theory to estimate the gas permeability of cementitious materials, and obtained a good correlation. Wang et al. [17] calculated the fractal dimension of concrete samples by using a fractal model based on MIP tests, and they indicated that the permeability has a good fitting relationship with the fractal dimension.
In conclusion, both BSE images and the MIP test can be used to predict the gas permeability of cementitious materials by adopting the prediction models derived from the pore structure properties. In this study, the gas permeability of mortar samples was measured by laboratory test and the pore structure properties were characterized by backscattered electron images (BSE) coupled with Yen’s algorithm and watershed algorithm and the mercury intrusion porosimetry test (MIP). Different methods based on the measured pore structure properties that have been adopted for the gas permeability prediction of other porous medium and obtained good prediction results, including the Hagen–Poiseuille method, the Katz–Thompson method, and Winland model, were used to predict the gas permeability and compared with the measured results. This study aims to verify the applicability of these methods in predicting gas permeability of mortar.

2. Materials and Methods

2.1. Materials and Sample Preparation

The experimental study was carried out on mortar samples with different silica fume (SF) dosage as our previous study showed that SF can effectively reduce the gas permeability and refine the pore size distribution [18], which is helpful to verify the applicability of different prediction methods to samples with different pore structures. The samples were cast by using Chinese commercial P I 42.5 Portland cement, silica fume, ISO standard siliceous sand with a particle size of 0.08–2 mm, and tap water. The water–binder ratio (w/c) and the sand–binder ratio were determined through preliminary experiments and were 0.5 and 3, respectively. Using this mixture proportion, mortar with a relatively low permeability can be produced. The composition of cement, SF, and mortar are listed in Table 1 and Table 2.
The mix procedure followed the instruction of Chinese standard for the laboratory test of mortar samples (JGJ/T70). Cement and standard sand were first dry mixed and tap water was added subsequently. The ingredients were mixed carefully and the mixture obtained was transferred to ring Teflon molds with an inner diameter of 50 mm and a height of 10 mm to cast samples. The mixture was then placed on a shaking table to remove the air bubbles by vibration. After 24 h, the samples were demolded and cured for 28 days under a relative humidity (RH) of 95% and a constant temperature of 20 °C ± 2 °C.

2.2. Experimental Procedures

2.2.1. Measurement of Gas Permeability

A gas permeability test apparatus based on the CEMBUREAU method was used to measure the gas permeability of the mortar samples. As shown in Figure 1, the confining pressure within the confining cell is provided by a pressure amplifier; the high-pressure gas in the gas holder is reduced to a certain pressure through the pressure regulator and is then injected into the buffer reservoir. When valve 2 and valve 3 are opened, gas flows through the sample into the atmosphere; the gas flow rate was recorded by an electronic gas flowmeter with an accuracy of 0.01 mL/min at the outlet. According to the Darcy’s law, the gas permeability of the sample can be calculated by Equation (1):
k a = 2 Q μ L P 0 A ( P h 2 P 0 2 )
where k a is the calculated apparent permeability (m2), μ is the dynamic viscosity of the gas (Pa·s), L is the sample thickness (m), P h is the injected gas pressure (Pa), P 0 is the atmospheric pressure (Pa), and A is the cross-sectional area of the sample (m2). The sample to be tested is wrapped with rubber film and heat-shrinkable tubing to fix the sample and prevent gas leakage from the side of the sample. Before the measurement of gas permeability, the cured samples were dried in a digital oven at 40 °C for 7 days to remove the moisture; therefore, the gas flow in the dried mortar samples was affected by the slippage effect and the intrinsic gas permeability, which can be calculated through the Klinkenberg equation [19]:
k a = k i ( 1 + b P m )
where b is the Klinkenberg coefficient (MPa) and P m = ( P h + P 0 ) / 2 is the mean gas pressure of inlet and outlet (MPa). Through measurement of k a at several different inlet pressures P h , the intrinsic gas permeability k i of the sample can be obtained by curve fitting. In this study, helium was used for the measurement of gas permeability since helium is a noble gas with low molecular weight that is easier to percolate in low-permeability media; the confining pressure was kept to 4 MPa. Helium with four different pressure values (1.3, 1.2, 1.1, and 1 MPa) was applied to the sample to measure and deduce the intrinsic gas permeability.

2.2.2. BSE Observation

The microstructures of the samples were observed by a scanning electron microscope (SEM) with backscattered electrons (BSE). The size of the samples for BSE observation was 5.0–10.0 mm and cut from the bulk mortar sample that had been used for the measurement of gas permeability. The samples were first dried at 40 °C for 1 day to remove the moisture from the air and then impregnated with low viscosity epoxy resin; the epoxy resin was carefully mixed and the entrapped air in the epoxy was removed by ultrasonic vibration. After curing for 24 h at room temperature, the epoxy-impregnated sample was removed and then ground and polished to prepare a flat surface for BSE observation. The grinding stage used 800/1500/3000/6000/10,000 grit sandpaper sequentially to grind the sample, and ethanol was used as lubricant. The polishing stage used 3, 1, and 0.25 μm polishing suspension to obtain a flat-polished surface. The sample was cleaned ultrasonically in ethanol after each grind and polish stage.

2.2.3. MIP Analyze

The pore size distributions of the mortar samples were directly characterized by the mercury intrusion porosimetry test (MIP); the samples used in the MIP test were also small cubes with 10 mm size taken from the bulk mortar. The mercury porosimeter is able to generate mercury intrusion pressure up to 250 MPa, which corresponds to pores with diameters of 5.89 nm–360 μm. With increasing injected mercury pressure, the size of mercury invaded pore decreases. The intrusion mercury volume and the intrusion pressure were recorded; the pore size d could be calculated by using the Washburn Equation (3):
d = 4 γ H g cos θ H g P
where P is the intrusion mercury pressure, γ H g is the surface tension of mercury (0.481 N/m), and θ H g is the contact angle between mortar and mercury (140°).

2.3. BSE Image Preprocessing

Image processing is an important step in extracting the pore structure information in BSE images; image segmentation is the most important step in image processing as it partitions an image into multiple segments, thus making the target object more prominent and easier to analyze. The thresholding method is the commonly used method in image segmentation [20]; the basic idea of the thresholding method is to select a reasonable threshold value and then binarize the image by comparing the pixel gray value with the threshold value:
b ( x , y ) = 255     g ( x , y ) > T 0   g ( x , y ) T
where g ( x , y ) is the gray value of the original image, T is the threshold value, and b ( x , y ) is the gray value after binarization.
Different threshold calculation algorithms have been proposed by scholars in past decades, including the maximum entropy algorithm, the balanced histogram thresholding algorithm, and the Otsu’s algorithm, etc. However, each algorithm has a different field of application, which makes different algorithms have different accuracy in distinguishing pores. Song et al. [21] compared the processing results of different algorithms on BSE images and reported that Yen’s algorithm [22] draws the most accurate results. Yen’s algorithm uses the maximum correlation criterion to choose the optimal threshold value T Y that can maximize the total amount of correlation between the objects and the background. Assuming that an image with a size of M × N pixels has 255 gray levels, the probability of a certain gray level i in the image can be defined as:
p i = n i M × N
where n i is the number of the appearance of gray level i . The total amount of correlation between the pores and the cement matrix can be described as:
C ( T ) = 2 ln ( i = 0 T p i i = T + 1 255 p i ) ln ( i = 0 T p i 2 i = T + 1 255 p i 2 )
where T is a set of threshold values ranging from 0 to 255; the optimal threshold value T Y is the value that makes C ( T ) to be maximum: C ( T Y ) = max 0 < T < 255 C ( T ) . After image segmentation, the pore space information was extracted using a watershed algorithm coupled with city-block distance transform function and median filtering proposed by Rabbani [23] was used to obtain the pore size distribution.

2.4. Calculation Methods of Gas Permeability

2.4.1. Gas Permeability Estimation from the BSE Image

The pores in a mortar sample can be simplified to long cylindrical capillary tubes with various radii, and the capillary bundle model can be adopted to calculate the fluid flow rate through the cross-section of a mortar sample; the total fluid flow rate Q can be regarded as the sum of the fluid flow rate Qi in each capillary tube:
Q = i = 1 n Q i
where n is the number of the capillary tubes; the fluid flow rate Q i in a one-capillary-tube can be expressed by the Hagen–Poiseuille equation:
Q i = π r c i 4 Δ P 8 μ g L c i
where r c i is the radius of the capillary tube, Δ P is the pressure difference, μ g is the dynamic viscosity of the fluid, and L c i is the length of the capillary tube. The gas permeability k g can be calculated according to the Darcy’s law:
Q = k g A μ g Δ P h
where Δ P / h is the pressure gradient. Combining Equations (7)–(9) yields:
k g = π 8 A i = 1 n r c i 4 τ i
where τ i = L c i / h , which refers to the tortuosity of the capillary pore and can be characterized by the MIP test [24,25].

2.4.2. Katz–Thompson Equation

Katz and Thompson [26] derived the following equation to calculate the permeability of porous medium by considering the critical pore diameter, based on the percolation theory of conductivity:
k = 1 226 σ σ 0 d c 2
where σ is the electrical conductivity of the porous medium saturated by a solution with a conductivity of σ 0 and d c is the critical pore diameter that is determined by the maximum porosity in the pore size distribution curve or the inflection point on the cumulative mercury intrusion volume versus the pore diameter curve obtained from the MIP test [27]. Katz and Thompson further indicated that the conductivity formation factor σ / σ 0 can be calculated through the pore parameters:
σ σ 0 = d max e d c φ S ( d max e )
where d max e is the electrical conductivity characteristic dimension that produces maximum conductance and d max e = 0.34 d c for a material with wide pore size distribution, and φ is the porosity of the material, and S ( d max e ) gives the fractional volume of the pore space with size larger than d max e . The parameters required in the Katz–Thompson equation can all be obtained from the MIP test, which makes it a more advantageous method in gas permeability prediction.

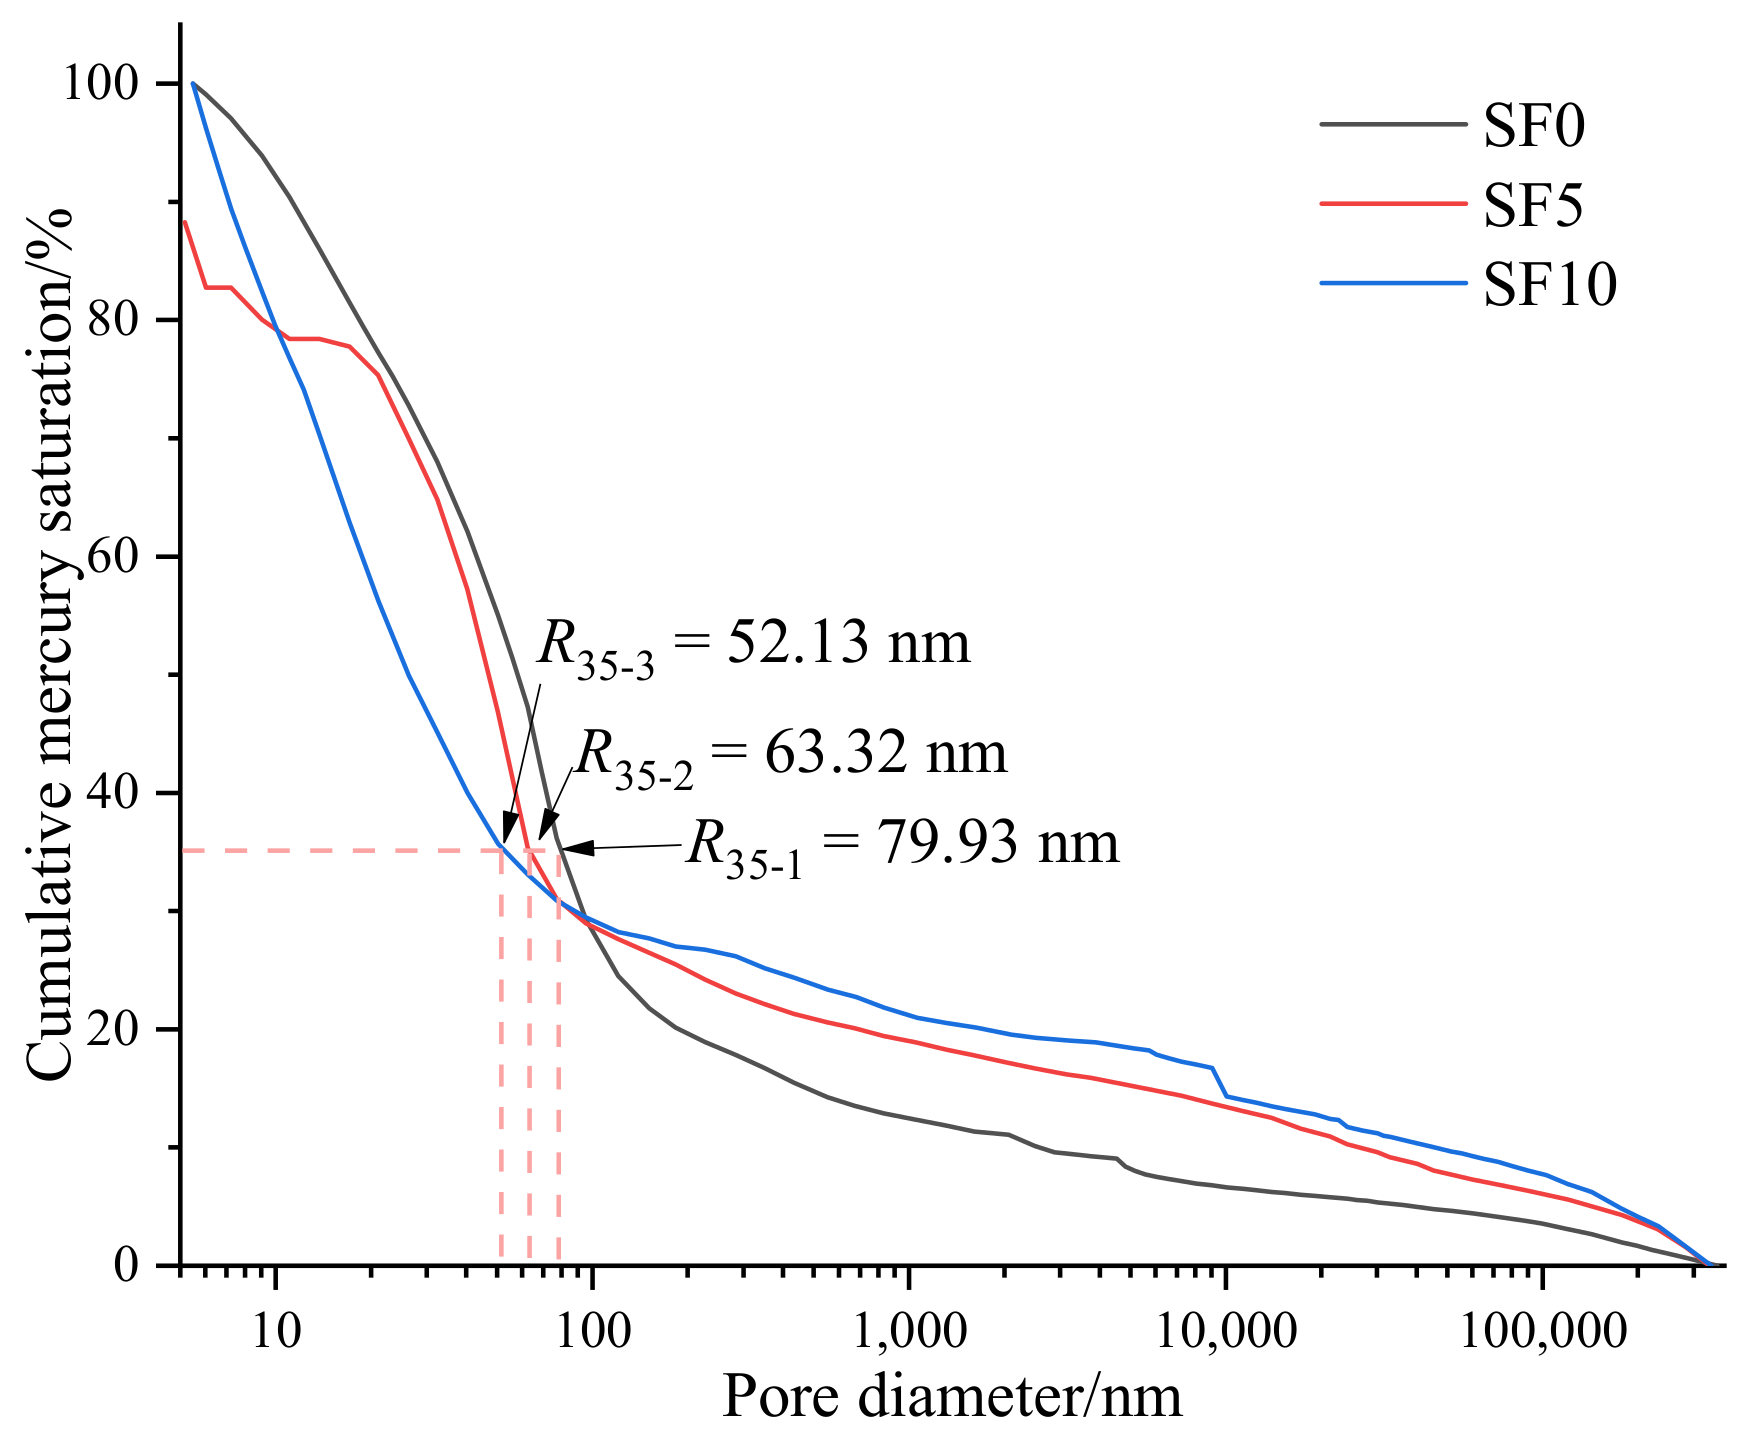
2.4.3. Winland Model

The Winland model is an empirical model based the MIP test, which has been widely used to predict the permeability of porous medium [28]:
k = a 1 R 35 a 2 φ a 3
where R 35 presents the pore diameter when the cumulative mercury saturation reaches 35%; a 1 , a 2 , and a 3 are empirical parameters (Winland adopted this model on 82 rock samples and recommended the following empirical parameter values: a 1 = 49.4, a 2 = 1.7 and a 3 = 1.47). Liu et al. [29] used the recommended parameters to predict the permeability of bentonite and reported that the calculated value is very close to the measured value. Therefore, the recommended parameters are also adopted in this work.

3. Results and Discussion

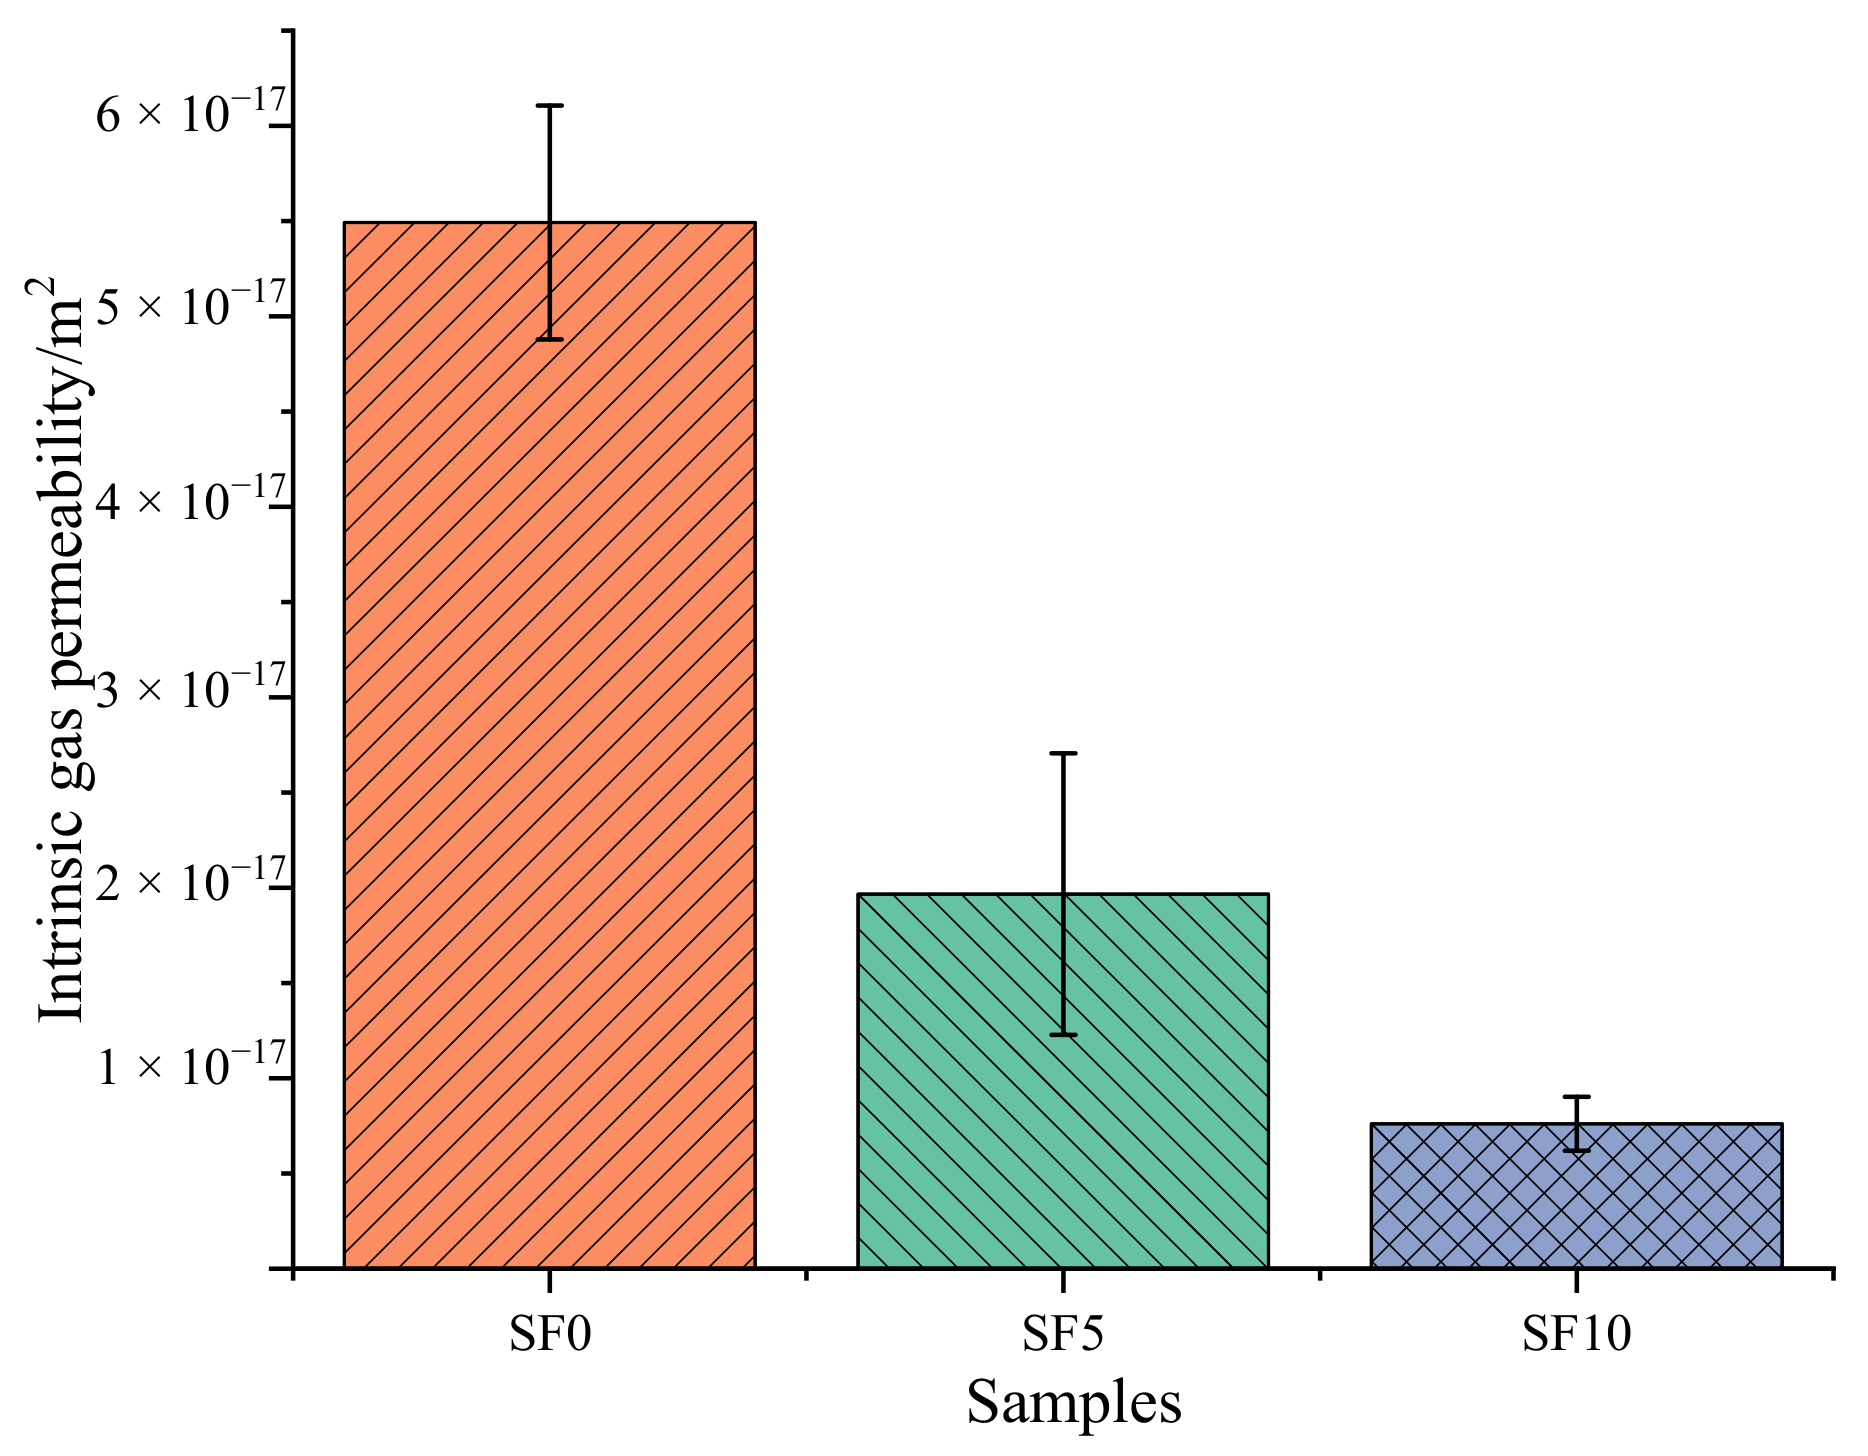
3.1. Gas Permeability Measured by Laboratory Test

By adopting the gas permeability test described above, the intrinsic gas permeability of the mortar samples with different mixing proportion was measured. For each mixing proportion, the gas permeability was measured by using the average of three replicate samples. As shown in Figure 2, the gas permeability of mortar samples with SF dosage of 0%, 5%, and 10% is 5.49 × 10⁻¹⁷, 1.97 × 10⁻¹⁷, and 7.61 × 10⁻¹⁸ m2, respectively. The incorporation of SF significantly reduces the gas permeability of mortar samples, since the pozzolanic reaction and the filling effect of SF particles can reduce the porosity and optimize the pore size distribution of mortar [30].

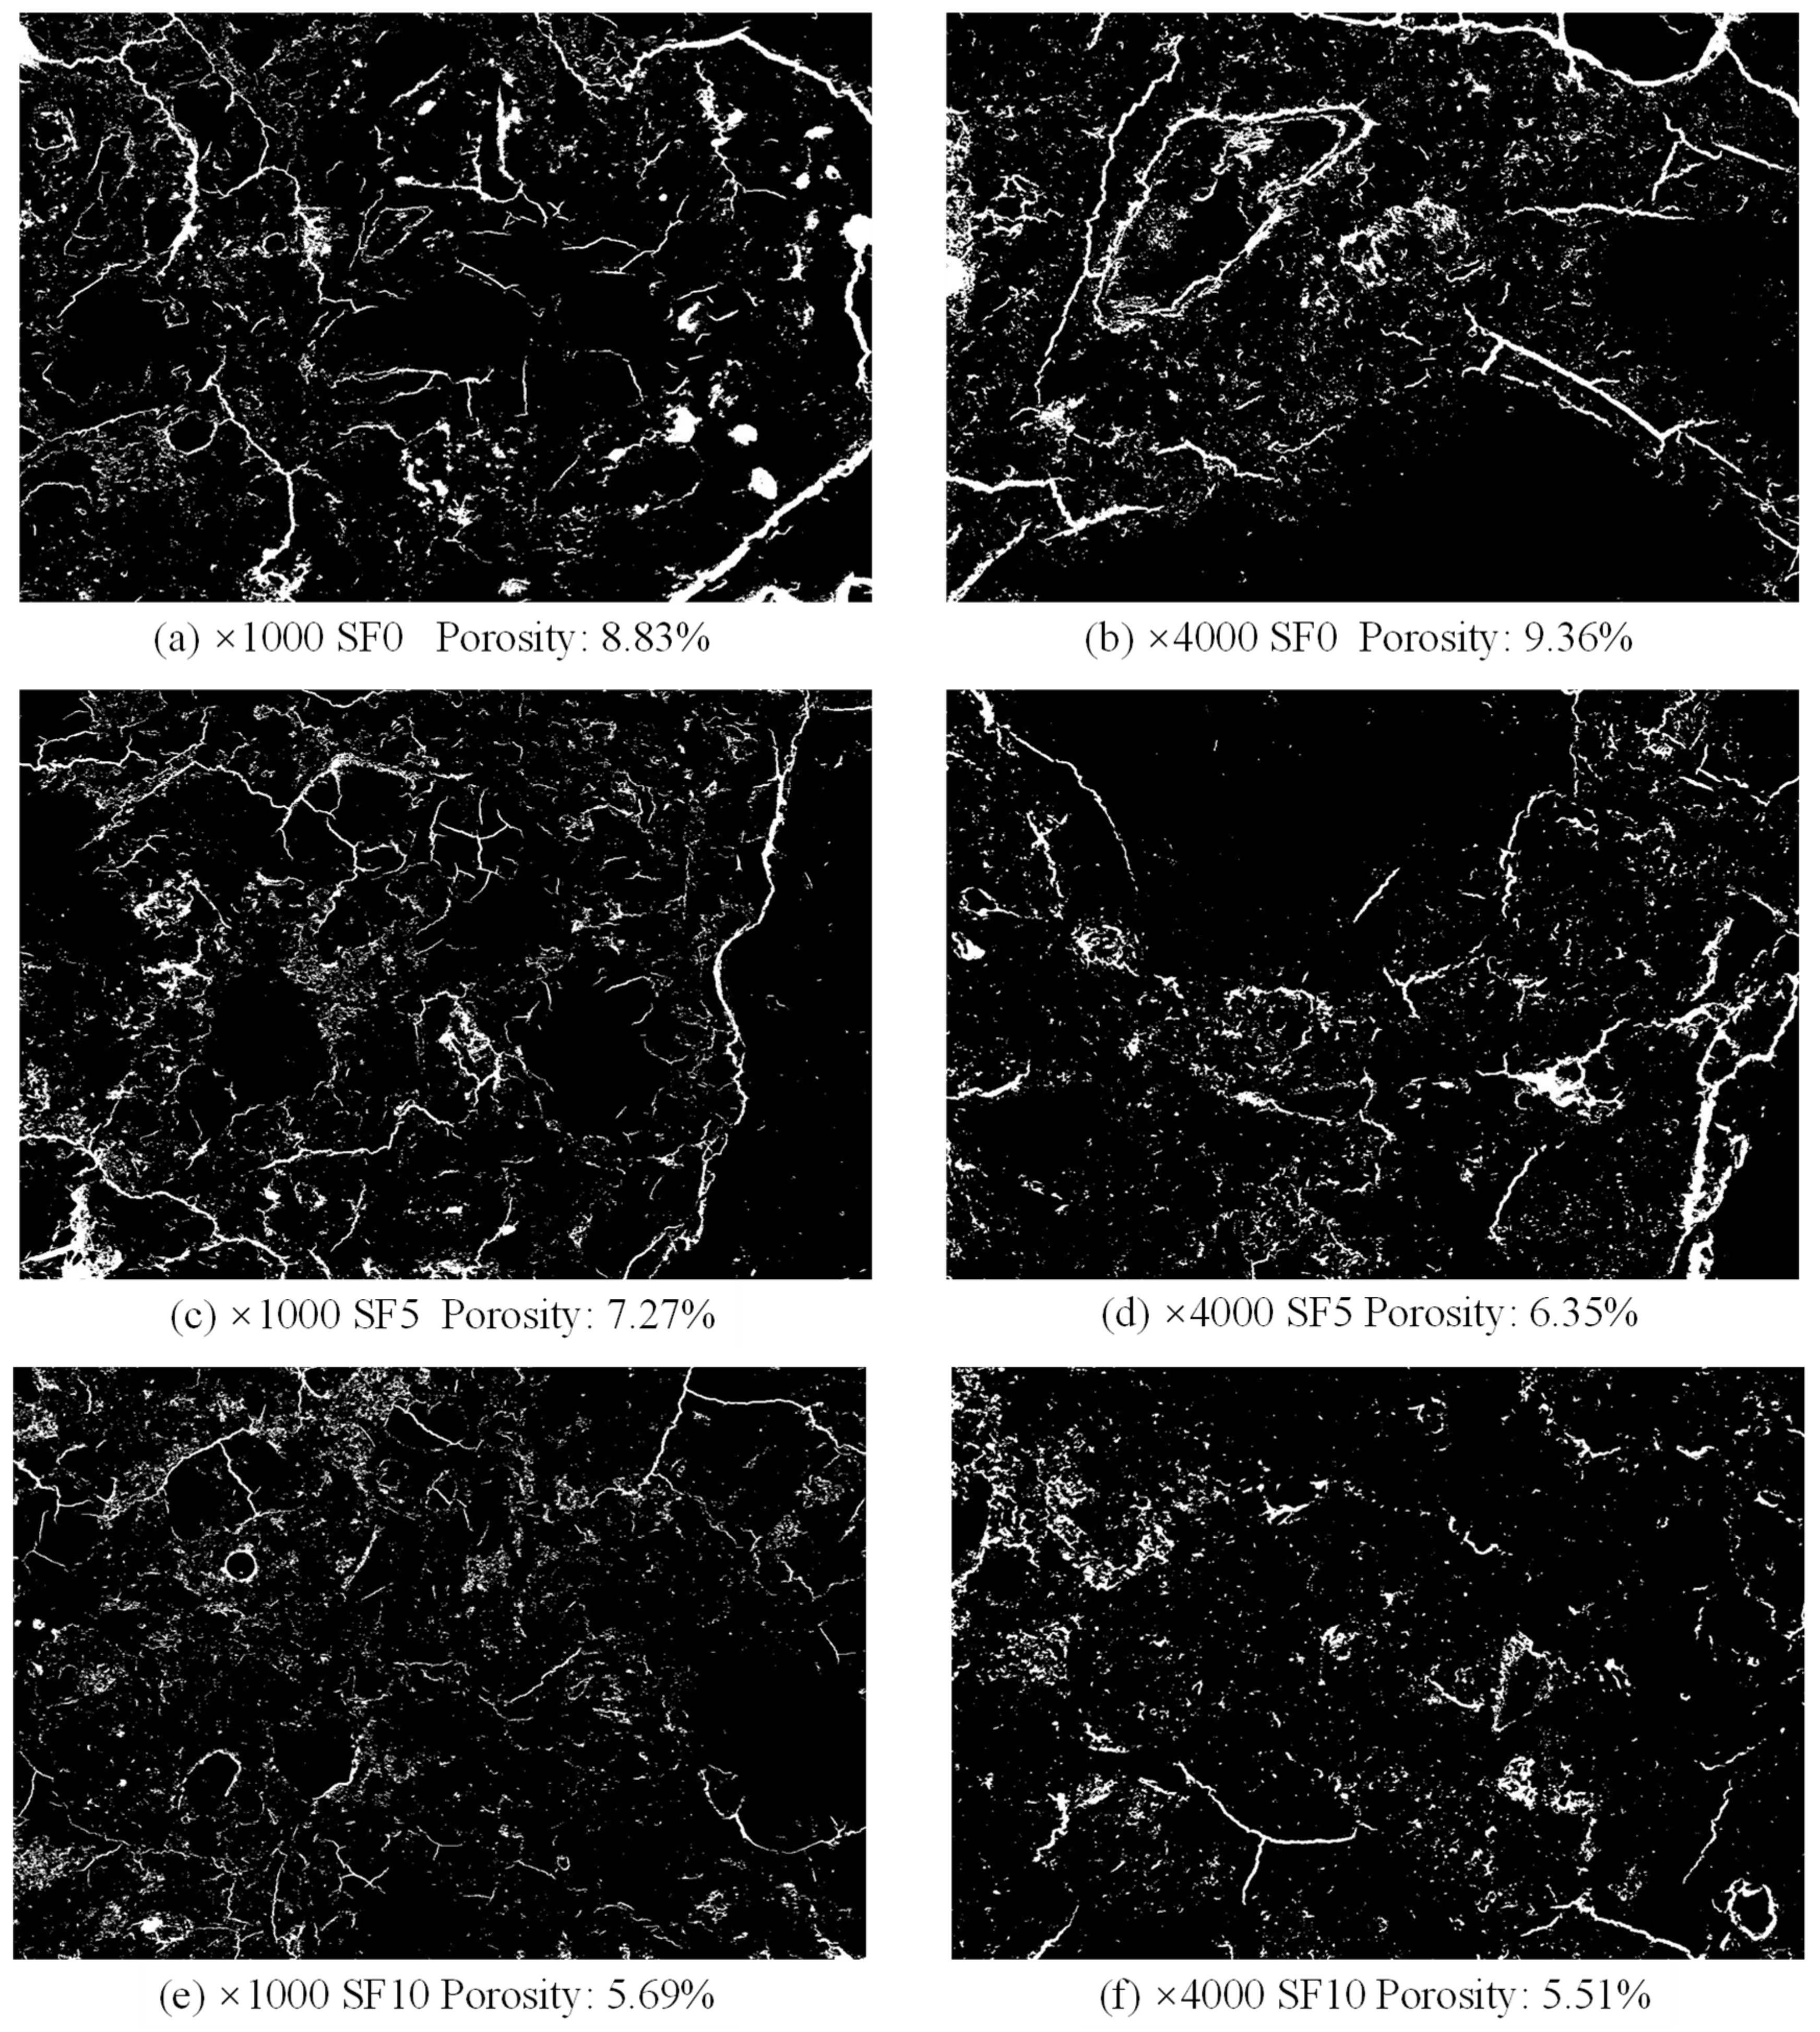
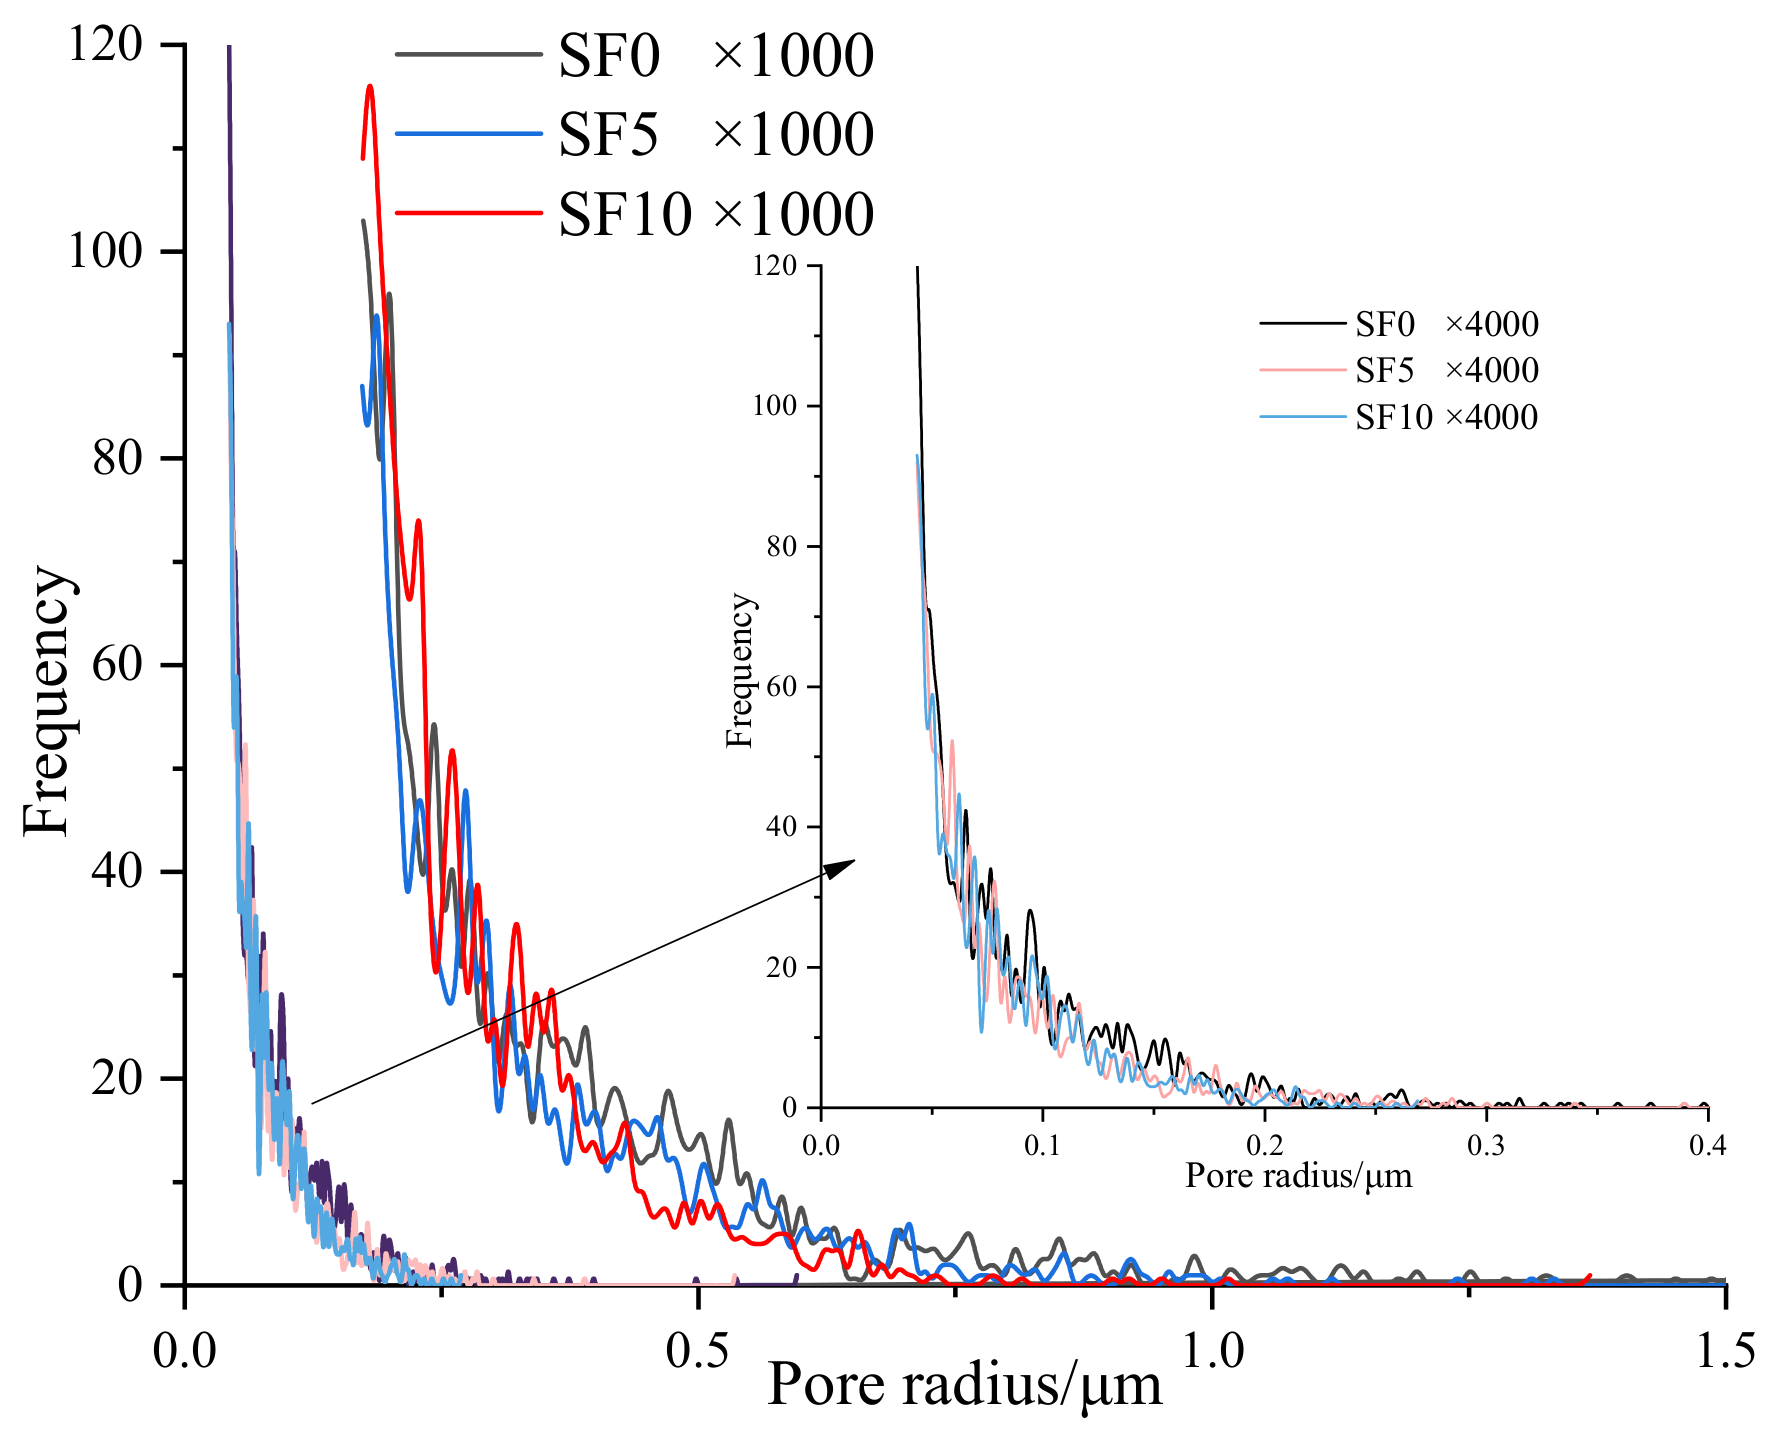
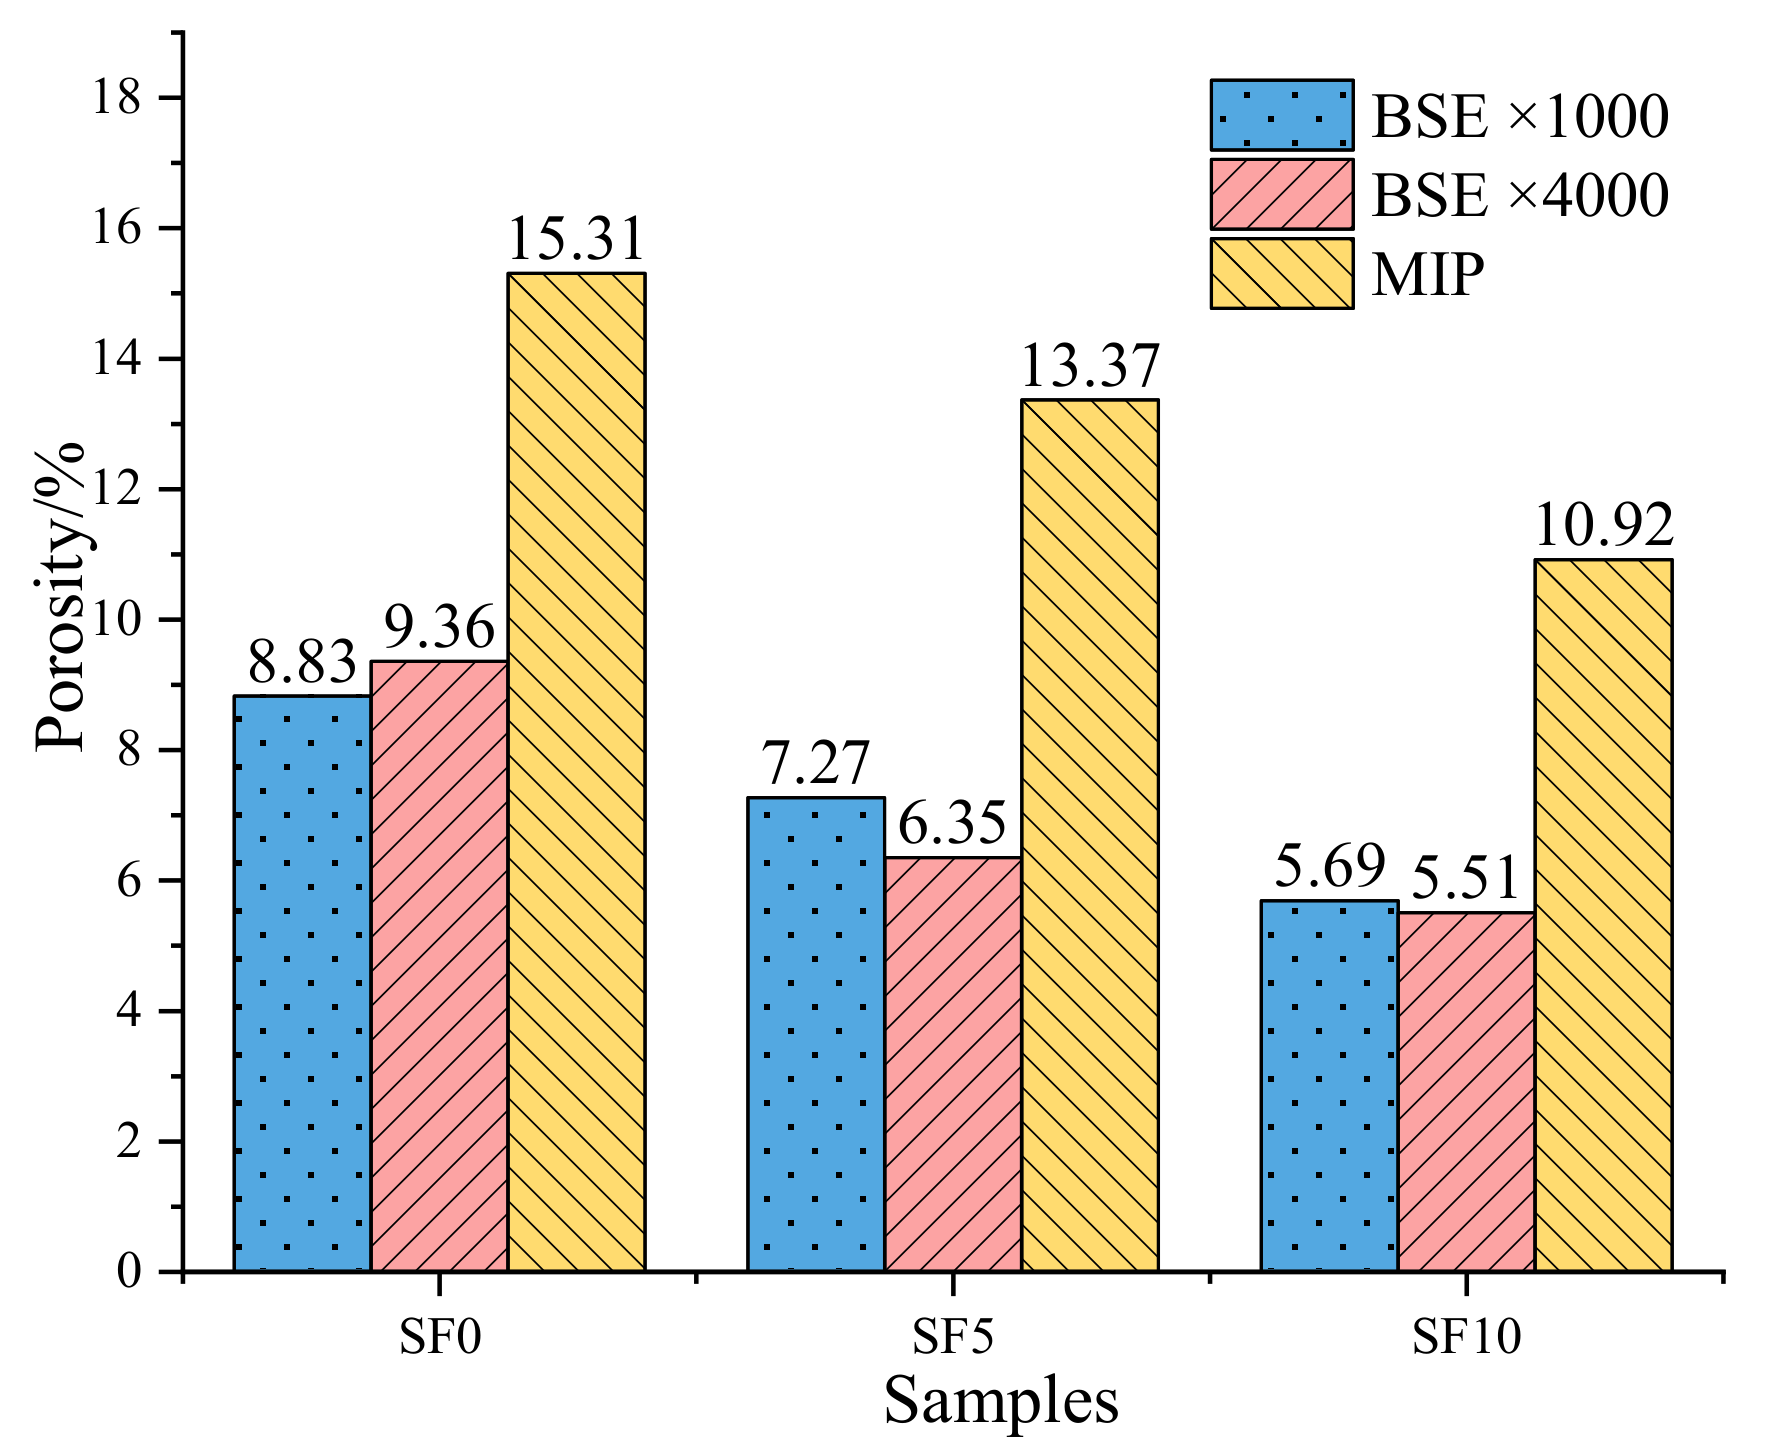
3.2. Image Processing Results of Mortar Sample

Figure 3 displays the BSE images of the mortar samples with different magnifications; the typical micromorphological characteristics of mortar are clearly presented in the BSE images: sand particles appear as gray irregular particles and wrapped in the hardened cement hydration paste, and residual unhydrated cement particles appear as brighter inclusions distributed on the hardened cement hydration paste. The black pores located on the surface of hardened cement hydration paste and the interfacial transition zone (ITZ) of sand particle and hardened cement hydration paste are the capillary pores. The capillary pores are the dominant pathway of gas flow within the mortar; the pore size and quantity are the governing factors that influence the gas permeability of the mortar samples. When the magnification increases to 4000 times, the capillary pores become more obvious and it can be found that the capillary pores are more densely distributed near the ITZ, which indicates that the ITZ is the weak area in the sample. Meanwhile, it can be found that the number of pores decreases with the increase in the SF content, which is consistent with the variation in gas permeability.
In order to analyze the pore structure characteristics of the mortar samples more intuitively, the pore structure information was extracted by image segmentation by adopting Yen’s algorithm. The binary images after processing are shown in Figure 4, the white areas in the figure represent the pores in the mortar sample; it can be found that almost all the capillary pores in the original BSE images have been extracted. The pores randomly distributed on the surface of the hardened cement paste while there are almost no pores on the surface of sand and unhydrated cement particles. However, more pores are distributed around the edge of the sand particle and some unhydrated cement particles; the junction of different phases in the mortar is more prone to generate pores. The porosity of the sample is calculated by the ratio of the white pixels to the total pixels of the image: the porosities of sample SF0 at different magnification are 8.83% and 9.36%, the porosities for SF5 sample are 7.27% and 6.35%, and the porosities for SF10 sample are 5.69% and 5.51%; the calculated porosity decreases with increase in the content of SF. The porosity calculated from BSE images with different magnifications is relatively close. With increasing magnification, the pore structure becomes more apparent and the pores which are not visible at low magnification are also observed and extracted; however, the observation range of the BSE image shrinks correspondingly with the increase in the magnification, eventually resulting in a similar porosity of the image with different magnifications.
Figure 5 presents the pore size distribution curves obtained from the binary BSE images of mortar samples at different magnifications. The pore radius ranges from approximately 0.17 to 1.5 μm when the magnification is 1000 times, while it ranges from 0.04 to 0.4 μm when the magnification increases to 4000. The pore size of most pores is smaller than 0.75 and 0.2 μm for 1000 and 4000 times magnification, respectively. The increase in magnification improves the accuracy of pore identification: the minimum extracted pore radius and the range of the pore size distribution are both reduced. It can be inferred that the identification range to pores of BSE is limited and the range can be influenced by the magnification; it is difficult to extract the complete pore distribution information by BSE image. However, not all the pores in the sample will have an effect on the gas permeability, since cement-based material is a porous medium material with complicated pore structure and pore distribution characteristics; previous investigations on the pore structure of cement-based materials classified the pores into the following categories: gel pores (d < 10 nm), capillary pores (10 nm < d < 1 μm), and air void (d > 1 μm) [30], and it is indicated that the capillary pores can increase the gas permeability of cement-based materials, obviously [31]. Furthermore, microcracks would also have a huge influence on the measured gas permeability. The size of most pores extracted through the BSE image (0.04~1 μm) is within the range of the capillary pores, which have the most significant influence on the gas permeability; thus, it is reasonable to predict the gas permeability through the pore size distribution obtained from the BSE image.

3.3. Pore Structure Characteristics from MIP

The pore size distributions of the mortar samples measured by the MIP technology are shown in Figure 6; the shape of the pore size distribution curves obtained by MIP is similar to that of the curves from the BSE image processing; however, the range of the pore size distribution measured by the MIP is approximately 5 nm~340 μm, which is much larger than the range for BSE image processing. The tortuosity of pores of sample SF0, SF5, and SF10 is, respectively, 3.66, 5.89, and 7.06. As shown in Figure 7, the porosities measured by the MIP technology are also larger than that calculated by image processing. In addition to the capillary pores, the MIP technology can also characterize the gel pores and air voids, thus it can reveal the pore distribution characteristic more comprehensively. The pore size distribution curves indicate that there are certain amounts of air voids with pore diameter larger than 5 μm in the sample; these air voids mainly include the residual entrained air bubbles during the preparation of the mortar samples, which are usually distributed randomly in the samples with the form of discrete and separate spherical shaped bubbles [32]. Although the air voids are discrete and separate, they are actually interconnected by small capillary pores and can facilitate gaseous transport [33]. However, the amount of air voids is lower than that of capillary pores and microcracks, thus the air voids have less significant influence on the gas permeability than capillary pores and microcracks.
The pore size distributions of mortar samples presented in Figure 6 show that most of the pores in the mortar samples are capillary pores with diameters ranging from 10 to 100 nm; capillary pores are mainly formed by the evaporation of residual free water. Previous studies indicated that the mass of combined water is approximately 22.7% of the total cement mass after the cement is fully hydrated [34], while the water/binder ratio used in this study is 0.5, which means that excess water was added during the mixing of the mortar. Therefore, part of the free water does not participate in the cement hydration and eventually forms the interconnected capillary pores in the mortar sample during the sample curing. The capillary pores act as the gas flow pathway and therefore have a significant impact on the gas permeability. The critical pore diameters dc of the three samples are determined by the maximum of the pore size distribution curves within 10–100 nm, and are 69.01, 49.91, and 14.13 nm for sample SF0, SF5, and SF10, respectively. The variation in critical pore diameters dc is consistent with the change in gas permeability, which expresses the importance of dc for the gas permeability. The total porosity and dc decrease with the increase in the content of SF, which indicates that the incorporation of SF reduces the porosity and refines the pore structure.
The evolution of the cumulative mercury saturation versus the pore diameter is shown in Figure 8. The development trend of the saturation curve can correspond to the pore size distribution curve: the peaks on the pore size distribution curve correspond to rapid growth segment on the cumulative saturation curve, the mercury saturation increases dramatically to 100% after the pore diameter is smaller than 100 nm, and capillary pores account for approximately 70% of the total pores within the mortar sample. R35, which represents the pore diameter when cumulative mercury saturation is 35%, is close to the inflection point that mercury saturation begins to increase rapidly; thus, it can be used as the characteristic pore size for gas permeability prediction of the mortar sample.

3.4. Gas Permeabilities Obtained from Different Methods

The gas permeabilities of the mortar samples measured from laboratory tests and calculated from different theoretical methods are listed in Table 3. The pore parameters used in the permeability calculation are all taken with two decimal places; the gas permeability estimated from the BSE image is the average of the calculated results from 10 BSE images. It can be found that the gas permeability calculated from high magnification BSE images is smaller than that calculated from low magnification BSE images. Even though more capillary pores can be observed in the BSE image with a high magnification, the maximum pore diameter extracted from the image with 1000 times magnification is larger than that extracted from the image with 4000 times magnification. According to Equation (10), pores with large diameter contribute more to the calculated result of gas permeability; this causes the result that the gas permeability obtained from a 1000 times magnification image is larger than that obtained from a 4000 times magnification image. The gas permeabilities predicted through a 1000-times BSE image are 218.6%, 103.55%, and 34.03% larger than the measured values, while the gas permeabilities predicted from a 4000 times BSE image are 83.06%, 77.87%, and 74.90% lower than the actual values. A drawback of the BSE image processing method is that it can hardly completely display the actual pore distribution, even when many images were used to obtain the average. The observation range of a 1000 times BSE image is larger and it can extract some relatively large capillary pores; however, not all the capillary pores are interconnected in a real mortar sample—only parts of the observed pores participate in the actual gas migration process, which makes it overestimate the gas permeability. The pore size extracted from a 4000 times BSE image is smaller, which may lead to ignoring the contribution of macropores to gas permeability. Therefore, to accurately display the undisturbed three-dimensional pore structure of cement-based materials, 3D imaging technology with less disturbance to the original pore structure, such as X-ray micro-CT, laser scanning confocal microscopy, and FIB/SEM, have been proposed to obtain the tortuosity and connectivity of the pore structure [35,36], and it can be a future research topic. Furthermore, it also should be noted that the gas permeability was measured under a confining pressure of 4 MPa while BSE observation was conducted at zero confining pressure; the high confining pressure may lead to the pores and cracks in the test sample to narrow or partially close, thereby decreasing the measured gas permeability. To obtain more accurate prediction values, the prediction method by BSE images may need to have an added parameter considering confining pressure.
The gas permeabilities calculated by adopting the Katz–Thompson model (K–T model) are approximately two orders of magnitude lower than that measured by laboratory tests, Wei et al. [14] and Care et al. [37] reported similar conclusions when using the Katz–Thompson model to predict the gas permeability of cementitious materials. The Katz–Thompson equation is a theoretical formula and it overemphasizes the influence of critical pore size on gas permeability; thus, it does not effectively manifest the contribution of coarse capillary pores on gas permeability, which makes the predicted permeability lower than the measured value. Furthermore, it cannot reflect the influence of pore tortuosity and connectivity on gas permeability. In addition, research has found that there is indeed a correlation between critical pore diameter and gas permeability, identified through data fitting [38]; the gas permeability can be predicted through the critical pore diameter by adopting the empirical formula obtained by fitting.
The Winland model is an empirical formula based on the pore diameter when cumulative mercury saturation reaches 35%. The gas permeabilities calculated by the Winland model for SF0, SF5, and SF10 are, respectively, 24.77%, 17.76%, and 62.94% lower or larger than the measured values, which are closer to the measured permeabilities than the gas permeabilities calculated from BSE images. Although the empirical parameters in the Winland model were obtained by calibrating the experimental data of sandstone and carbonates, and since gas transport is a physical process and is affected by the pore structure, cementitious material may have similar gas percolation properties with other porous media materials such as rock and bentonite; thus, the empirical parameters also work well when adapting them for predicting gas permeability of cementitious materials.

4. Conclusions

This study aims to provide insight into the applicability of different calculation methods in predicting gas permeability of mortar samples and explore possible permeability prediction approaches when experimental conditions are limited. The Hagen–Poiseuille equation combined with the pore structure information extracted from the processed BSE image, the Katz–Thompson equation with the critical pore diameter determined from the MIP test, and the Winland model with the pore size when cumulative mercury intrusion in the MIP test reaches 35% were used to predict the gas permeability of mortar samples. The main conclusions are listed below.
(1)
The BSE image binarization processing performed by using Yen’s algorithm and the watershed algorithm are used to obtain the pore size distribution from the binarized BSE image. The algorithms can effectively extract pore structure information; the extracted pores are capillary pores with diameters ranging from 0.04 to 1 μm. The gas permeability estimated from the BSE image differs with different image magnification; a high magnification BSE image results in a lower calculated value. However, the calculated permeabilities from a 1000 times magnification BSE image are about 1.5–3 times higher than the measured values from laboratory tests, while the gas permeabilities predicted from a 4000 times BSE image are approximately 5 times lower than actual values. The deviation is mainly because this method cannot easily and completely display the actual pore structure; it is limited by the scope of observation and magnification.
(2)
MIP technology can reveal the pore distribution characteristic of the mortar sample more comprehensively; the measured pore size distribution range and the porosity are larger than that obtained from the BSE image. All the pore types in the mortar sample, including air voids, capillary pores, and parts of the gel pores, can be characterized by the MIP test. The critical pore diameters of the three samples are 69.01, 49.91, and 14.13 nm for samples SF0, SF5 and SF10, respectively. The permeabilities predicted by using the Katz–Thompson equation are approximately two orders of magnitude lower than the measured value. The Katz–Thompson equation only uses the critical pore diameter and neglects the contribution of coarse capillary pores on gas permeability.
(3)
The Winland model uses the pore diameter when cumulative mercury saturation reaches 35% and empirical parameters calibrated from the experimental data of sandstone and carbonates. The gas permeabilities calculated by the Winland model are very close to the measured gas permeabilities.

Author Contributions

Conceptualization, methodology, software, writing—original draft preparation, Z.C.; validation, investigation, Y.W. and C.H.; writing—review and editing, supervision, funding acquisition, J.Z. All authors have read and agreed to the published version of the manuscript.

Funding

This research was funded by Open Research Fund Projects of the State Key Laboratory of Subtropical Building Science (2022ZB20), the National Natural Science Foundation of China (No. 51908568), the Natural Science Foundation of Guangdong Province (2019A1515011981) and Hundred-Talent Program of The Guangzhou City University of Technology (YB180002).

Institutional Review Board Statement

Not applicable.

Informed Consent Statement

Not applicable.

Data Availability Statement

Data are contained within the article.

Conflicts of Interest

The authors declare no conflict of interest.

References

  1. Hamami, A.A.; Turcry, P.; Aït-Mokhtar, A. Influence of mix proportions on microstructure and gas permeability of cement pastes and mortars. Cem. Concr. Res. 2012, 42, 490–498. [Google Scholar] [CrossRef]
  2. Salvoldi, B.G.; Beushausen, H.; Alexander, M.G. Oxygen permeability of concrete and its relation to carbonation. Constr. Build. Mater. 2015, 85, 30–37. [Google Scholar] [CrossRef]
  3. Zhang, X.; Zhou, X.; Zhou, H.; Gao, K.; Wang, Z. Studies on forecasting of carbonation depth of slag high performance concrete considering gas permeability. Appl. Clay Sci. 2013, 79, 36–40. [Google Scholar] [CrossRef]
  4. Neves, R.; Da Fonseca, B.S.; Branco, F.; De Brito, J.; Castela, A.; Montemor, M.F. Assessing concrete carbonation resistance through air permeability measurements. Constr. Build. Mater. 2015, 82, 304–309. [Google Scholar] [CrossRef]
  5. Gui, Q.; Qin, M.; Li, K. Gas permeability and electrical conductivity of structural concretes: Impact of pore structure and pore saturation. Cem. Concr. Res. 2016, 89, 109–119. [Google Scholar] [CrossRef]
  6. Abbas, A.; Carcassès, M.; Ollivier, J.P. The importance of gas permeability in addition to the compressive strength of concrete. Mag. Concr. Res. 2000, 52, 1–6. [Google Scholar] [CrossRef]
  7. Zhang, X.; Li, Z.; Ma, Q.; Zhou, X.; Wang, Q. Study on the correlation between SHPC pore structure and air permeability. Teh. Vjesn.-Tech. Gaz. 2017, 24, 1425–1430. [Google Scholar] [CrossRef] [Green Version]
  8. Wu, Z.; Wong, H.; Buenfeld, N. Influence of drying-induced microcracking and related size effects on mass transport properties of concrete. Cem. Concr. Res. 2014, 68, 35–48. [Google Scholar] [CrossRef] [Green Version]
  9. Wu, Z.; Wong, H.; Buenfeld, N. Transport properties of concrete after drying-wetting regimes to elucidate the effects of moisture content, hysteresis and microcracking. Cem. Concr. Res. 2017, 98, 136–154. [Google Scholar] [CrossRef]
  10. Chen, X.-T.; Caratini, G.; Davy, C.; Troadec, D.; Skoczylas, F. Coupled transport and poro-mechanical properties of a heat-treated mortar under confinement. Cem. Concr. Res. 2013, 49, 10–20. [Google Scholar] [CrossRef]
  11. Ye, B.; Cheng, Z.; Ni, X. Effects of multiple heating-cooling cycles on the permeability and microstructure of a mortar. Constr. Build. Mater. 2018, 176, 156–164. [Google Scholar] [CrossRef]
  12. Wong, H.; Buenfeld, N.; Head, M. Estimating transport properties of mortars using image analysis on backscattered electron images. Cem. Concr. Res. 2006, 36, 1556–1566. [Google Scholar] [CrossRef] [Green Version]
  13. Wong, H.; Zimmerman, R.; Buenfeld, N. Estimating the permeability of cement pastes and mortars using image analysis and effective medium theory. Cem. Concr. Res. 2011, 42, 476–483. [Google Scholar] [CrossRef] [Green Version]
  14. Wei, Y.; Guo, W.; Wu, Z.; Gao, X. Computed permeability for cement paste subject to freeze-thaw cycles at early ages. Constr. Build. Mater. 2020, 244, 118298. [Google Scholar] [CrossRef]
  15. Tsivilis, S.; Chaniotakis, E.; Batis, G.; Meletiou, C.; Kasselouri, V.; Kakali, G.; Psimadas, C. The effect of clinker and limestone quality on the gas permeability, water absorption and pore structure of limestone cement concrete. Cem. Concr. Compos. 1999, 21, 139–146. [Google Scholar] [CrossRef]
  16. Sakai, Y. Correlations between air permeability coefficients and pore structure indicators of cementitious materials. Constr. Build. Mater. 2019, 209, 541–547. [Google Scholar] [CrossRef]
  17. Wang, L.; Jin, M.; Guo, F.; Wang, Y.; Tang, S. Pore structural and fractal analysis of the influence of fly ash and silica fume on the mechanical property and abrasion resistance of concrete. Fractals 2021, 29, 2140003. [Google Scholar] [CrossRef]
  18. Cheng, Z.; Ye, B.; Zhao, J. Investigation of the Gas Breakthrough Pressure of Cement Mortar with Different Experimental Techniques. KSCE J. Civ. Eng. 2021, 26, 325–335. [Google Scholar] [CrossRef]
  19. Klinkenberg, L.J. The permeability of porous media to liquids and gases. Socar Proc. 1941, 2, 200–213. [Google Scholar] [CrossRef]
  20. Münch, B.; Holzer, L. Contradicting geometrical concepts in pore size analysis attained with electron microscopy and mercury intrusion. J. Am. Ceram. Soc. 2008, 91, 4059–4067. [Google Scholar] [CrossRef]
  21. Song, S.-B.; Liu, J.-F.; Yang, D.-S.; Ni, H.-Y.; Huang, B.-X.; Zhang, K.; Mao, X.-B. Pore structure characterization and permeability prediction of coal samples based on SEM images. J. Nat. Gas Sci. Eng. 2019, 67, 160–171. [Google Scholar] [CrossRef]
  22. Yen, J.C.; Chang, F.-J.; Chang, S. A new criterion for automatic multilevel thresholding. IEEE Trans. Image Process. 1995, 4, 370–378. [Google Scholar] [CrossRef] [PubMed]
  23. Rabbani, A.; Salehi, S. Dynamic modeling of the formation damage and mud cake deposition using filtration theories coupled with SEM image processing. J. Nat. Gas Sci. Eng. 2017, 42, 157–168. [Google Scholar] [CrossRef]
  24. Laskar, A.; Kumar, R.; Bhattacharjee, B. Some aspects of evaluation of concrete through mercury intrusion porosimetry. Cem. Concr. Res. 1997, 27, 93–105. [Google Scholar] [CrossRef]
  25. Manickam, S.S.; Gelb, J.; McCutcheon, J.R. Pore structure characterization of asymmetric membranes: Non-destructive characterization of porosity and tortuosity. J. Membr. Sci. 2014, 454, 549–554. [Google Scholar] [CrossRef]
  26. Katz, A.J.; Thompson, A.H. Prediction of rock electrical conductivity from mercury injection measurements. J. Geophys. Res.-Solid Earth 1987, 92, 599–607. [Google Scholar] [CrossRef]
  27. Halamickova, P.; Detwiler, R.J.; Bentz, D.P.; Garboczi, E.J. Water permeability and chloride ion diffusion in Portland cement mortars: Relationship to sand content and critical pore diameter . Cem. Concr. Res. 1995, 25, 790–802. [Google Scholar] [CrossRef]
  28. Kolodzie, S.J. Analysis of pore throat size and use of the Waxman-Smits equation to determine OOIP in spindle field. In Proceedings of the SPE Annual Technical Conference and Exhibition, Dallas, TX, USA, 21–24 September 1980. [Google Scholar]
  29. Liu, J.; Song, S.; Cao, X.; Meng, Q.; Pu, H.; Wang, Y. Determination of full-scale pore size distribution of Gaomiaozi bentonite and its permeability prediction. J. Rock Mech. Geotech. Eng. 2020, 12, 403–413. [Google Scholar] [CrossRef]
  30. Wu, Z.; Shi, C.; Khayat, K. Influence of silica fume content on microstructure development and bond to steel fiber in ultra-high strength cement-based materials (UHSC). Cem. Concr. Compos. 2016, 71, 97–109. [Google Scholar] [CrossRef] [Green Version]
  31. Oltulu, M.; Sahin, R. Pore structure analysis of hardened cement mortars containing silica fume and different nano-powders. Constr. Build. Mater. 2014, 53, 658–664. [Google Scholar] [CrossRef]
  32. Zeng, Q.; Li, K.F.; Chong, T.F.; Dangla, P. Pore structure characterization of cement pastes blended with high-volume flyash. Cem. Concr. Res. 2012, 42, 194–204. [Google Scholar] [CrossRef]
  33. Wong, H.; Pappas, A.; Zimmerman, R.; Buenfeld, N. Effect of entrained air voids on the microstructure and mass transport properties of concrete. Cem. Concr. Res. 2011, 41, 1067–1077. [Google Scholar] [CrossRef] [Green Version]
  34. Zhang, J.; Bian, F.; Zhang, Y.; Fang, Z.; Fu, C.; Guo, J. Effect of pore structures on gas permeability and chloride diffusivity of concrete. Constr. Build. Mater. 2018, 163, 402–413. [Google Scholar] [CrossRef]
  35. Yio, M.; Wong, H.; Buenfeld, N. 3D pore structure and mass transport properties of blended cementitious materials. Cem. Concr. Res. 2018, 117, 23–37. [Google Scholar] [CrossRef]
  36. Song, Y.; Dai, G.; Zhao, L.; Bian, Z.; Li, P.; Song, L. Permeability prediction of hydrated cement paste based on its 3D image analysis. Constr. Build. Mater. 2020, 247, 118527. [Google Scholar] [CrossRef]
  37. Care, S.; Derkx, F. Determination of relevant parameters influencing gas permeability of mortars. Constr. Build. Mater. 2011, 25, 1248–1256. [Google Scholar] [CrossRef]
  38. Cheng, Z.; Zhao, J.; Cui, L. Exploration of hydration and durability properties of ferroaluminate cement with compare to Portland cement. Constr. Build. Mater. 2021, 319, 126138. [Google Scholar] [CrossRef]
Figure 1. Schematic diagram of the gas permeability test apparatus.
Crystals 12 00581 g001
Figure 2. Intrinsic gas permeability of mortar samples with different mixing proportions.
Crystals 12 00581 g002
Figure 3. BSE images of mortar samples with different magnifications (1000 times and 4000 times). (a) sample SF0 with 1000 times magnification; (b) sample SF0 with 4000 times magnification; (c) sample SF5 with 1000 times magnification; (d) sample SF5 with 4000 times magnification; (e) sample SF10 with 1000 times magnification; (f) sample SF10 with 4000 times magnification.
Crystals 12 00581 g003
Figure 4. Binary images after processing of mortar samples. (a) sample SF0 with 1000 times magnification; (b) sample SF0 with 4000 times magnification; (c) sample SF5 with 1000 times magnification; (d) sample SF5 with 4000 times magnification; (e) sample SF10 with 1000 times magnification; (f) sample SF10 with 4000 times magnification.
Crystals 12 00581 g004
Figure 5. Pore size distributions of different samples obtained by image processing.
Crystals 12 00581 g005
Figure 6. Pore size distribution measured by the MIP technology.
Crystals 12 00581 g006
Figure 7. Porosity of mortar samples obtained by different approaches.
Crystals 12 00581 g007
Figure 8. Cumulative mercury saturation versus the pore diameter.
Crystals 12 00581 g008
Table 1. Chemical composition and physical properties of the cement and silica fume.
Compositions (wt. %)Loss (%)BS (m2/kg)
SiO2Al2O3CaOSO3MgONa2OK2OFe2O3
Cement21.585.1663.052.571.570.270.313.393.1316
Silica fume95.3-1.15-0.170.170.460.290.3-
Table 2. Mixing proportion of mortar samples.
Mixturesw/cMass of Ingredient (g)
CementSilica FumeStandard SandWater
SF00.545001350225
SF50.5427.522.51350225
SF100.5405451350225
Table 3. Gas permeability of mortar samples obtained from different methods.
SamplesExperimental k (m2)Calculate k with Different Methods (m2)
BSE × 1000BSE × 4000K–T ModelWinland Model
SF05.49 × 10−171.75 × 10−160.93 × 10−178.03 × 10−194.13 × 10⁻¹⁷
SF51.97 × 10−174.01 × 10−174.36 × 10−183.89 × 10−192.32 × 10⁻¹⁷
SF107.61 × 10−181.02 × 10−171.91 × 10−183.28 × 10−201.24 × 10⁻¹⁷
Publisher’s Note: MDPI stays neutral with regard to jurisdictional claims in published maps and institutional affiliations.

