Article

Development of a Computational Fluid Dynamics (CFD) Numerical Approach of Thermoelectric Module for Power Generation

by
Mohammed A. Qasim
1,2,*,
Vladimir I. Velkin
1 and
Sergey E. Shcheklein
1
1
Nuclear Power Plants and Renewable Energy Sources Department, Ural Federal University, 620002 Yekaterinburg, Russia
2
Department of Projects and Engineering Services, Ministry of Health, Baghdad 10047, Iraq
*
Author to whom correspondence should be addressed.
Crystals 2022, 12(6), 828; https://doi.org/10.3390/cryst12060828
Submission received: 23 May 2022 / Revised: 7 June 2022 / Accepted: 9 June 2022 / Published: 10 June 2022
(This article belongs to the Special Issue Advanced Materials and Composites for Thermoelectric Applications)

Abstract

:
The recent innovations in thermoelectric generating materials have led to exceptional technologies that generate power from excess and lost heat. These technologies have proven to be of significant environmental and economic importance, especially with global warming issues and escalating fuel prices. This study developed a computational fluid dynamics (CFD) model for a thermoelectric generator (TEG) consisting of five TEG modules embedded between two aluminum blocks. The upper block collects solar energy and heats the hot side of the modules. The lower block has an internal M-shaped water channel to cool the cold side of the modules. The model predictions were compared with the authors’ previously published experimental results to assess its validity and reliability. A parametric study was conducted to investigate the effects of various solar collector block thicknesses and different water flow velocities on the TEG-generated voltage and efficiency. The results show excellent agreement between the model predictions and the experimental data. Moreover, the parametric study revealed a slight inverse relationship between the thickness of the solar-collecting mass, the efficiency of the system, and an increase in the heat flux. However, the relationship was proportional to the velocity of water flow.

1. Introduction

Utilization of waste energy has attracted considerable attention in recent years [1]. It has a wide spectrum of sources, such as electricity generation, industrial chimneys, and vehicle exhaust gases. During many industrial operations, a large portion of the process heat is released into the environment. According to the United State Department of Energy, approximately 20–50% of the industrial energy inputs are discharged into the environment as waste heat [2]. Additionally, more than 30% of the energy that is generated by fuel combustion in diesel engines is discharged with the exhaust gases as waste heat [3]. Even though waste heat is sometimes re-used for drying and preheating purposes, a great amount of it is lost, resulting in wasted energy and environmental pollution.
With increased fuel prices, the design of systems with improved energy efficiency has become a vital engineering concern. Efficient heat recovery systems provide significant economic and environmental advantages [4] that may considerably reduce industrial energy consumption and mitigate global warming impacts. Heat recovery methods comprise (1) preheating processes utilizing heat transfer between exhaust gases and combustion air, (2) heat transformation to the load entering furnaces, (3) electrical power and steam generation, or (4) employing heat pumps to utilize waste heat for cooling or heating of facilities [5].
Development of the heat recovery systems has globally become a key research area in recent years [6]. According to Arangurenetal. [7], up to 50% of the power needed to run an automobile’s electronic systems can be recovered from the waste energy of its exhaust gases. Organic Rankine Cycles (ORCs) are a verified powerful heat recovery technology. Researchers consider this technology from different engineering perspectives, such as system structure optimization [8], working fluid screening [9], and control strategy optimization [10]. A variety of turbines, such as the radial flow [11], blade [12], and axial flow turbines [13], have been used as organic expanders in ORC systems. However, these expanders have been found to be inefficient due to significant flow losses and high operating speeds [14]. Additionally, due to the substantial pressure drop associated with fluid pumps, ORCs experience a large sealing performance challenge, resulting in the need for sophisticated design along with high manufacturing and maintenance costs [15]. Therefore, an ORC is considered as an inefficient heat recovery option, especially in small-scale applications such as automobile engines. Alternatively, the Tesla bladeless turbine is a reliable and low-cost design, with a simple structure, and thus has great potential in small-scale power-generating applications [16]. However, it has not yet been commercially used because of its low efficiency and operational flaws [17,18].
Thermoelectric generators (TEGs), on the other hand, have witnessed a growing interest over the past few decades as an efficient heat recovery technique. They are solid-state devices that rely on the Seebeck effect to convert thermal energy into electrical energy. Stationary heat recovery systems cover a range of applications, such as solar heat [19] and geothermal heat recovery [20,21]. Mobile heat recovery systems have been used in automotive applications [22,23] and space exploration [24]. Reliability, robustness, compactness, and the lack of moving parts are the primary advantages that made TEGs an excellent option in advanced applications such as power supplies for spacecraft using radioisotopes, power for navigational aids, and telecommunications systems [25,26,27].
Numerical simulation has been used to analyze TEG output power under various operating conditions [28] and configurations [29]. They do not just minimize the experimental work, cost, and time, but offer a significant prediction and optimization procedure for process design [30]. Several studies have simulated TEG performance using different approaches. A. Qasim et al. [31] used the Maximum Power Point Tracking (MPPT) technique and an Interval Type 2 Fuzzy Logic Controller (IT2FLC) to model a TEG module. The model was implemented in MATLAB SIMULINK R2017a. In other studies, energy equilibrium or zero-dimensional models were employed [32,33]. These models have many advantages, such as a capability to develop an analytical expression for TEG performance. However, they have limited accuracy because of their simplifying assumptions. To overcome these issues, researchers used one-dimensional [34,35] and three-dimensional [36,37] heat transfer models.
Researchers also employed computational fluid dynamics (CFD) to analyze TEG performance. Chen et al. [4] developed an innovative simulation technique that uses CFD with a thermoelectric module (TEM) that absorbs heat from flue gases. The model evaluated the performance of the TEM considering the effects of the cold-surface heat transfer coefficient, Reynolds number, channel geometry, and inlet temperature of the flue gas. In another study, Shen et al. [38] developed a three-dimensional TEG solver that can evaluate the heat transfer, flow process, electricity conversion, and fuel combustion in detail. The precision and accuracy of the model were verified using experimental data. The results reveal that the developed model is capable of reproducing the TEG system characteristics. This information can be utilized for TEG structural design and optimization. To encompass electrical power generation in a CFD simulation, Högblom and Andersson [39] adopted a multiphysics methodology to develop a generic model with sub-grid CFD models. With the capability of modeling energy transport using Peltier, Fourier, and Thomson mechanisms as a function of current and temperature, the develop model is considered a powerful multipurpose computational approach. In a more recent study, Bejjam et al. [40] used CFD to investigate various ways to enhance TEG performance. For that purpose, a three-dimensional TEG model was developed using SOLIDWORKS software, which was then exported and analyzed with ANSYS-FLUENT.
In this study, a CFD model is proposed for a solar-powered thermoelectric generator consisting of 5-TEG modules. The generator design comprises five TEG modules fitted with a solar-collecting plate on the top (hot side), and a water-cooled cooling aluminum block on the bottom (cold side). The aim of developing the CFD model was to evaluate the effect of the solar-collecting plate thickness, element mesh size, and the water flow rate in the cooling block on power generation and generator efficiency in a low-energy application.

2. Model Design and Theoretical Background

Thermoelectrics are solid-state devices that perform energy conversion using the Seebeck effect. According to Zhao et al. [41], the temperature difference between the hot and cold junctions is the driving force of the Seebeck effect to produce a potential difference across the load. Figure 1a illustrates use of a TEG module, and Figure 1b demonstrates its fundamental design, where heat flux, α I T h , is collected by the hot junction, and α I T c is ejected at the cold junction. The TEG process is also associated with the Joule effect, heat leakage, and Thomson effect. The latter exhibits the lowest impact on the TEG output compared to the others. Therefore, it is usually neglected in modeling. Table 1 provides the basic specifications of the considered TEG module.
The physical process of heat dissipation in a resistance circuit is known as joule heating. A thermoelectric generator will also experience resistive heating as a result of the electric current flowing through it. The total amount of heat dissipated, in Joules, may be calculated as follows [43]:
Q J = I 2   R  
where R and I denote the electrical resistance and current, respectively.
The Seebeck effect occurs when a temperature difference is applied to a TEG module in an open-circuit situation. This results in an electrical potential difference between the hot and cold sides of the TEG. The produced Seebeck voltage, also known as the electromotive force (EMF), is represented as:
V o c = α   Δ T  
where V o c   , α ,   a n d   Δ T are the open-circuit voltage, Seebeck coefficient, and temperature difference ( Δ T = T h T c ) , respectively.
The electrical power from a TEG across the external load results in a current flow in the circuit, which may be computed using the power balancing in Equation (3) [44].
W = Q h Q c = V · I
where Q h and Q c denote the absorbed heat generated by the thermal load, and the liberated heat removed by the heat sink, respectively, for steady-state analysis at both sides of the TEG.
Q h = K p + k n T h T c + α p α n I T h I 2 R 2
Q c = K p + k n T h T c + α p α n I T c + I 2 R 2  
The thermal conductivities of the p-type TEG legs are denoted by K p , while the thermal conductivities of the n-type TEG legs are denoted by k n . The temperatures at the hot and cold junctions are T h   a n d   T c , respectively, and α p   , α n are Seebeck coefficients for p-type and n-type TEG junctions.
The output voltage of a TEG through the load is:
V = V o c I R i n t
where R and I are internal resistance and current, respectively. Performance of TE materials is predicted by the dimensionless figure of merit Z , which comprises the electrical resistivity, ρ , Seebeck coefficient, α , and thermal conductivity, k . It can be represented as:
Z p , n = α 2   ρ   k
For an absolute temperature, T ¯ , Z T ¯ may be written as follows:
Z T ¯ p , n = α 2   T ¯ ρ   k
T ¯ = T h   + T c 2
σ = 1 ρ  
where σ denotes electrical conductivity, which is the inverse of electrical resistivity, ρ . Maximal TEG efficiency is determined as:
η m a x   = T h   T C   T h   1 + Z T ¯ 1   1 + Z T ¯ + T c T h

3. Methodology

3.1. Model Design

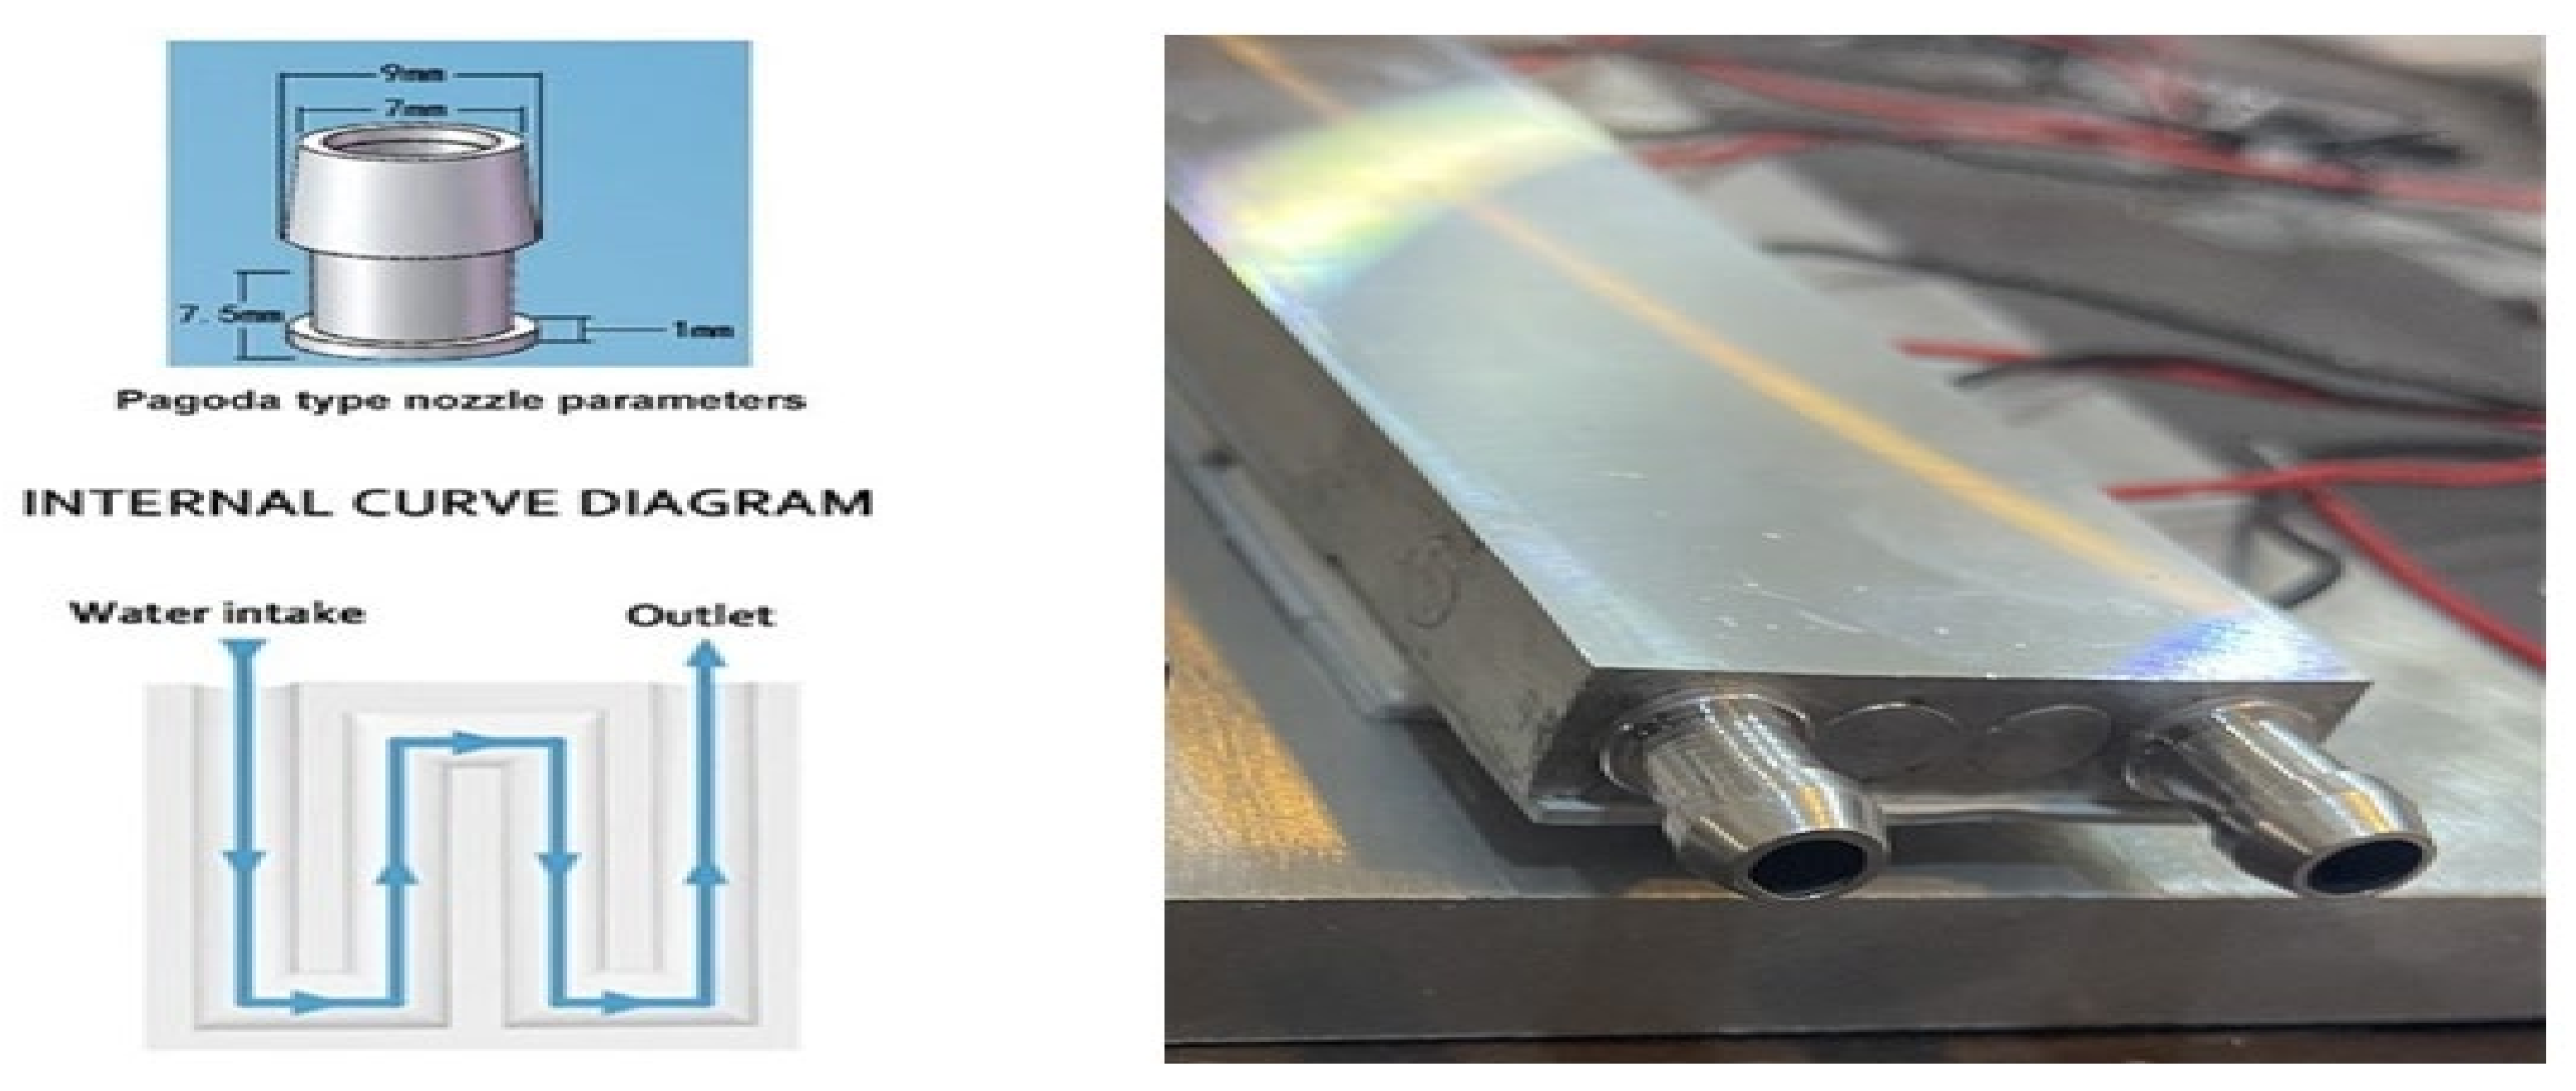
To generate power, the hot surface of a TEG must absorb enough heat while the cold surface remains at a lower temperature. A temperature difference triggers the Seebeck effect to convert heat into electricity. The Workbench ANSYS program was used in this study to build a TEG model. It consists of a solar-heat-collecting plate, 5-TEG modules, and a water-cooled aluminum block heat sink (Figure 2). The upper part of the device is a block made of aluminum alloy 6063 with dimensions of 240 mm × 40 mm × 16 mm (L, W, H), and it acts as a solar collector. The middle part contains the TEG modules, evenly distributed with 5 mm spacing between the modules. The lower part is a cuboid block made of an aluminum alloy with dimensions of 240 mm × 40 mm × 10 mm (L, W, H). It has an internal M-shaped water flow channel to maximize the heat exchange area for a better cooling effect.
The physical properties of the aluminum alloy used in the design are given in Table 2, and the configuration of the cooling block is illustrated in Figure 3.
A 1 mm-thick thermal paste layer was used between both hot and cold surfaces of the TEG module. It provides improved surface contact to ensure good heat transfer from the hot plate to the module and from the module to the heat sink block.

3.2. Theoretical Formulations

3.2.1. Governing Equations

Steady-state flow is assumed in the M-shaped channel with a laminar and incompressible characteristic assumed for the flow field. The governing equations are solved simultaneously. They include the continuity, momentum, and energy equations, as follows [4].
Continuity equation:
· ρ V = 0  
Momentum equation:
ρ V · V = P + μ V + V T  
Energy equation:
ρ C P V T = · k T  

3.2.2. Boundary Conditions

The simulation adopted the same boundary conditions employed earlier by Qasim et al. [1]. Various inlet fluid flow velocities (0.2, 0.4, 0.6, and 0.8 m/s) were used for the cooling block. The temperature was set to (300 K) with the default viscosity ratio and turbulence intensity. Radiation was the heat transfer process at the solar collection plate surface. Mass and energy conservation were adopted at the outlet. A fixed 1 atm pressure was set at the outlet with a no-slip condition at the channel walls.

3.3. Numerical Approach and Validation

A finite volume method was used to solve the governing Equations (12)–(14) to calculate the water flow velocity. Thermo-flow numerical analysis was conducted using ANSYS FLUENT CFD code. The energy and momentum equations were solved using a second-order upwind scheme to eliminate potential numerical errors. The momentum and continuity equations were solved first, before flow determination. Then, the energy equation was solved to determine the thermal field in the domain. The procedure continued until the sum of the residuals of the continuity and energy equations reached the converging criteria.

3.3.1. Mesh Study

The analyzed model was entirely discretized with the hexahedral mesh shown in Figure 4. This includes the upper solar-collecting plate, the TEG modules, and the lower heat sink block (flow domain).
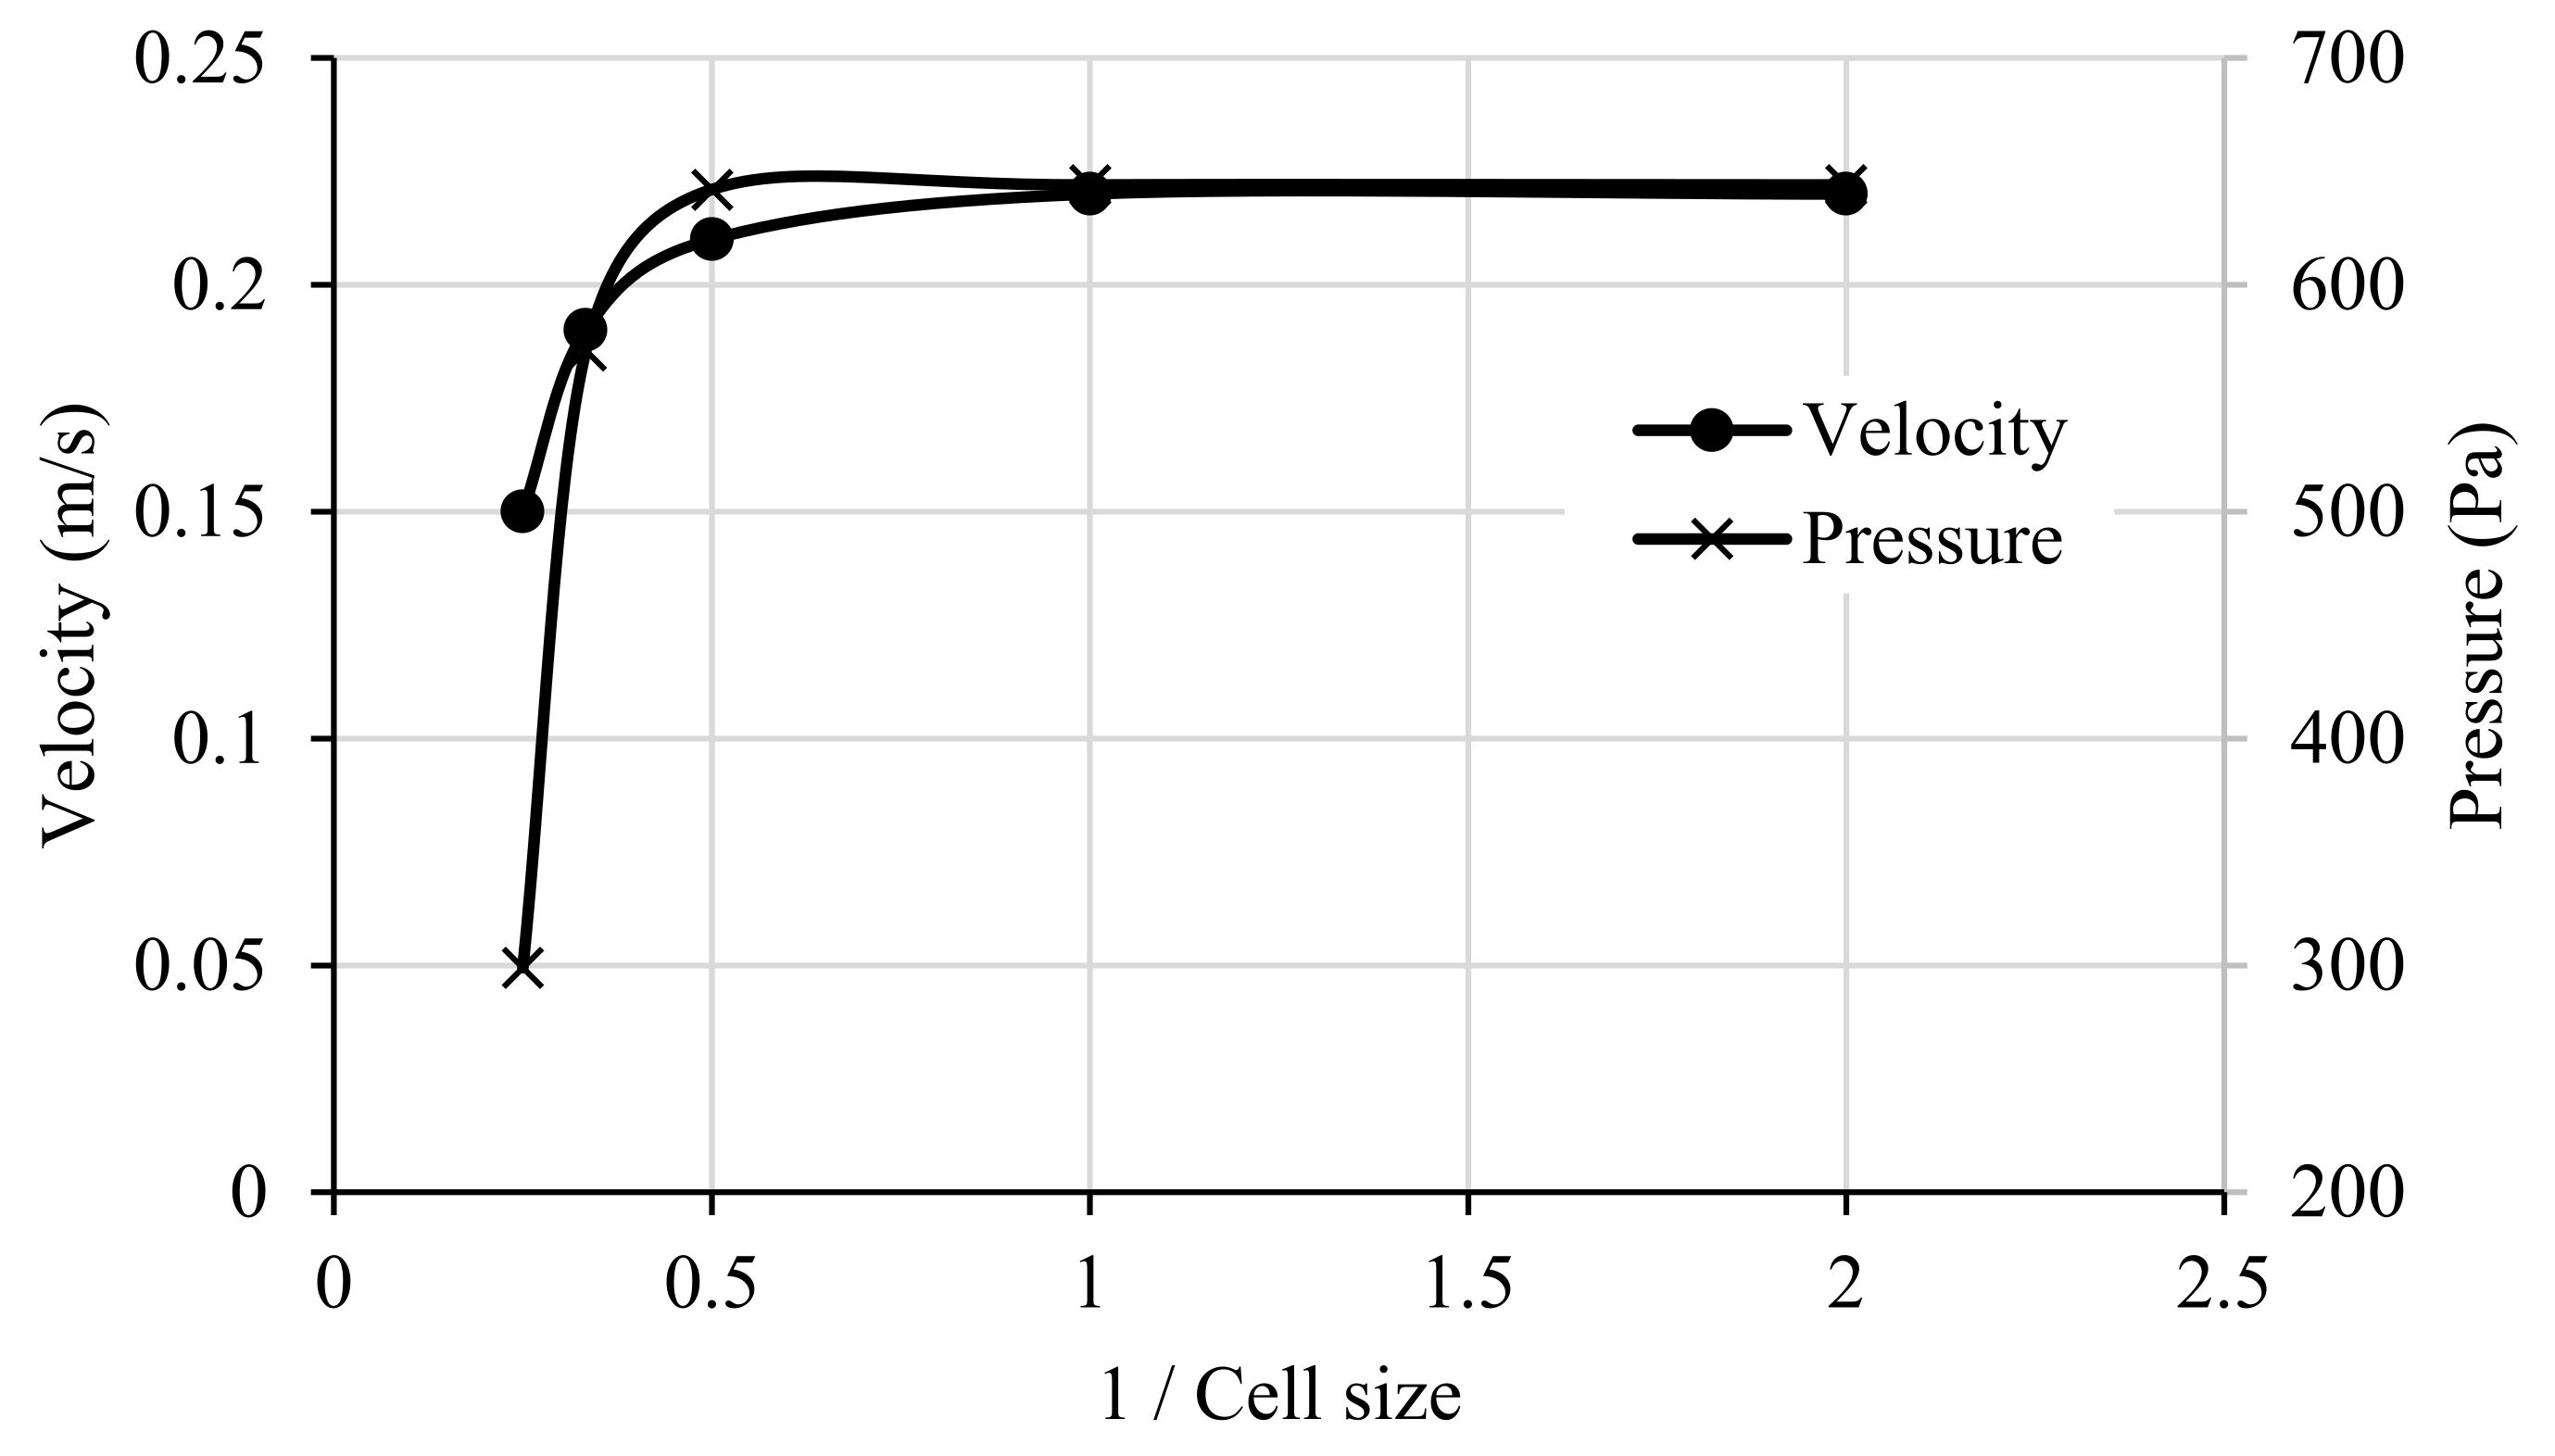
A mesh independence study was performed to determine that the predicted results were independent of mesh size. There was no significant change in the temperature obtained when solving the energy equation. So, pressure and velocity results were chosen instead. Two points were chosen before the outlet to obtain independent mesh values for the velocity and pressure. Figure 5 shows the effect of the cell size on pressure and velocity. Independent pressure and velocity values were obtained for all cell sizes. Here, mesh cell sizes of 1 and 2 mm both reached steady state. However, the solution used a cell size of 1 mm because it reached steady state earlier than the 2 mm cells, as shown in Figure 5.
The number of cells corresponding to each examined mesh size is given in Table 3 below.

3.3.2. Model Validation

Once the optimum cell size and mesh density were determined, verification processes were performed to confirm the accuracy and reliability of the model. Validation processes were carried out using previously published experimental results [1]. A many-TEG modules, arranged in 30 sections, was investigated in the experimental system. However, using symmetry considerations to simplify the model, only one section was considered in this study. Figure 6 shows the experimental model that was validated. The current simulation used the same design and process parameters considered in the experiment. Therefore, this work can be considered valid and has achieved its aim.
A weighted average area method was used to obtain the temperature values at the TEG hot and cold surfaces. Table 4 provides a comparison of the current model predictions and the corresponding experimental data obtained at different times of the day.

4. Results and Discussion

The effects of the solar plate thickness and the flow velocity on the temperature difference, Δ T , between the hot and cold surfaces of the TEG module are presented in this section.

4.1. Solar Plate Thickness

Figure 7 depicts the effects of four different solar plate thicknesses on the TEG module surface temperatures. No significant variation in T h or T c due to changes in plate thickness was seen.
Figure 8 demonstrates a significant effect of the plate thickness on the heat flux difference across the module’s hot and cold surfaces. Greater plate thickness resulted in higher heat flux. This is attributed to the increased heat capacity of the thicker solar plate compared to the cold plate.
Figure 9 demonstrates the effect of the solar plate thickness on the efficiency, η , of the TEG. Equation (11) was used for calculation of this efficiency. The results indicate significant effects of plate thickness on TEG efficiency. Increasing the plate thickness had a slight adverse effect on efficiency. This is due to the dependence of efficiency upon the temperatures of the two sides of the TEG module according to Equation (11).

4.2. Flow Velocity

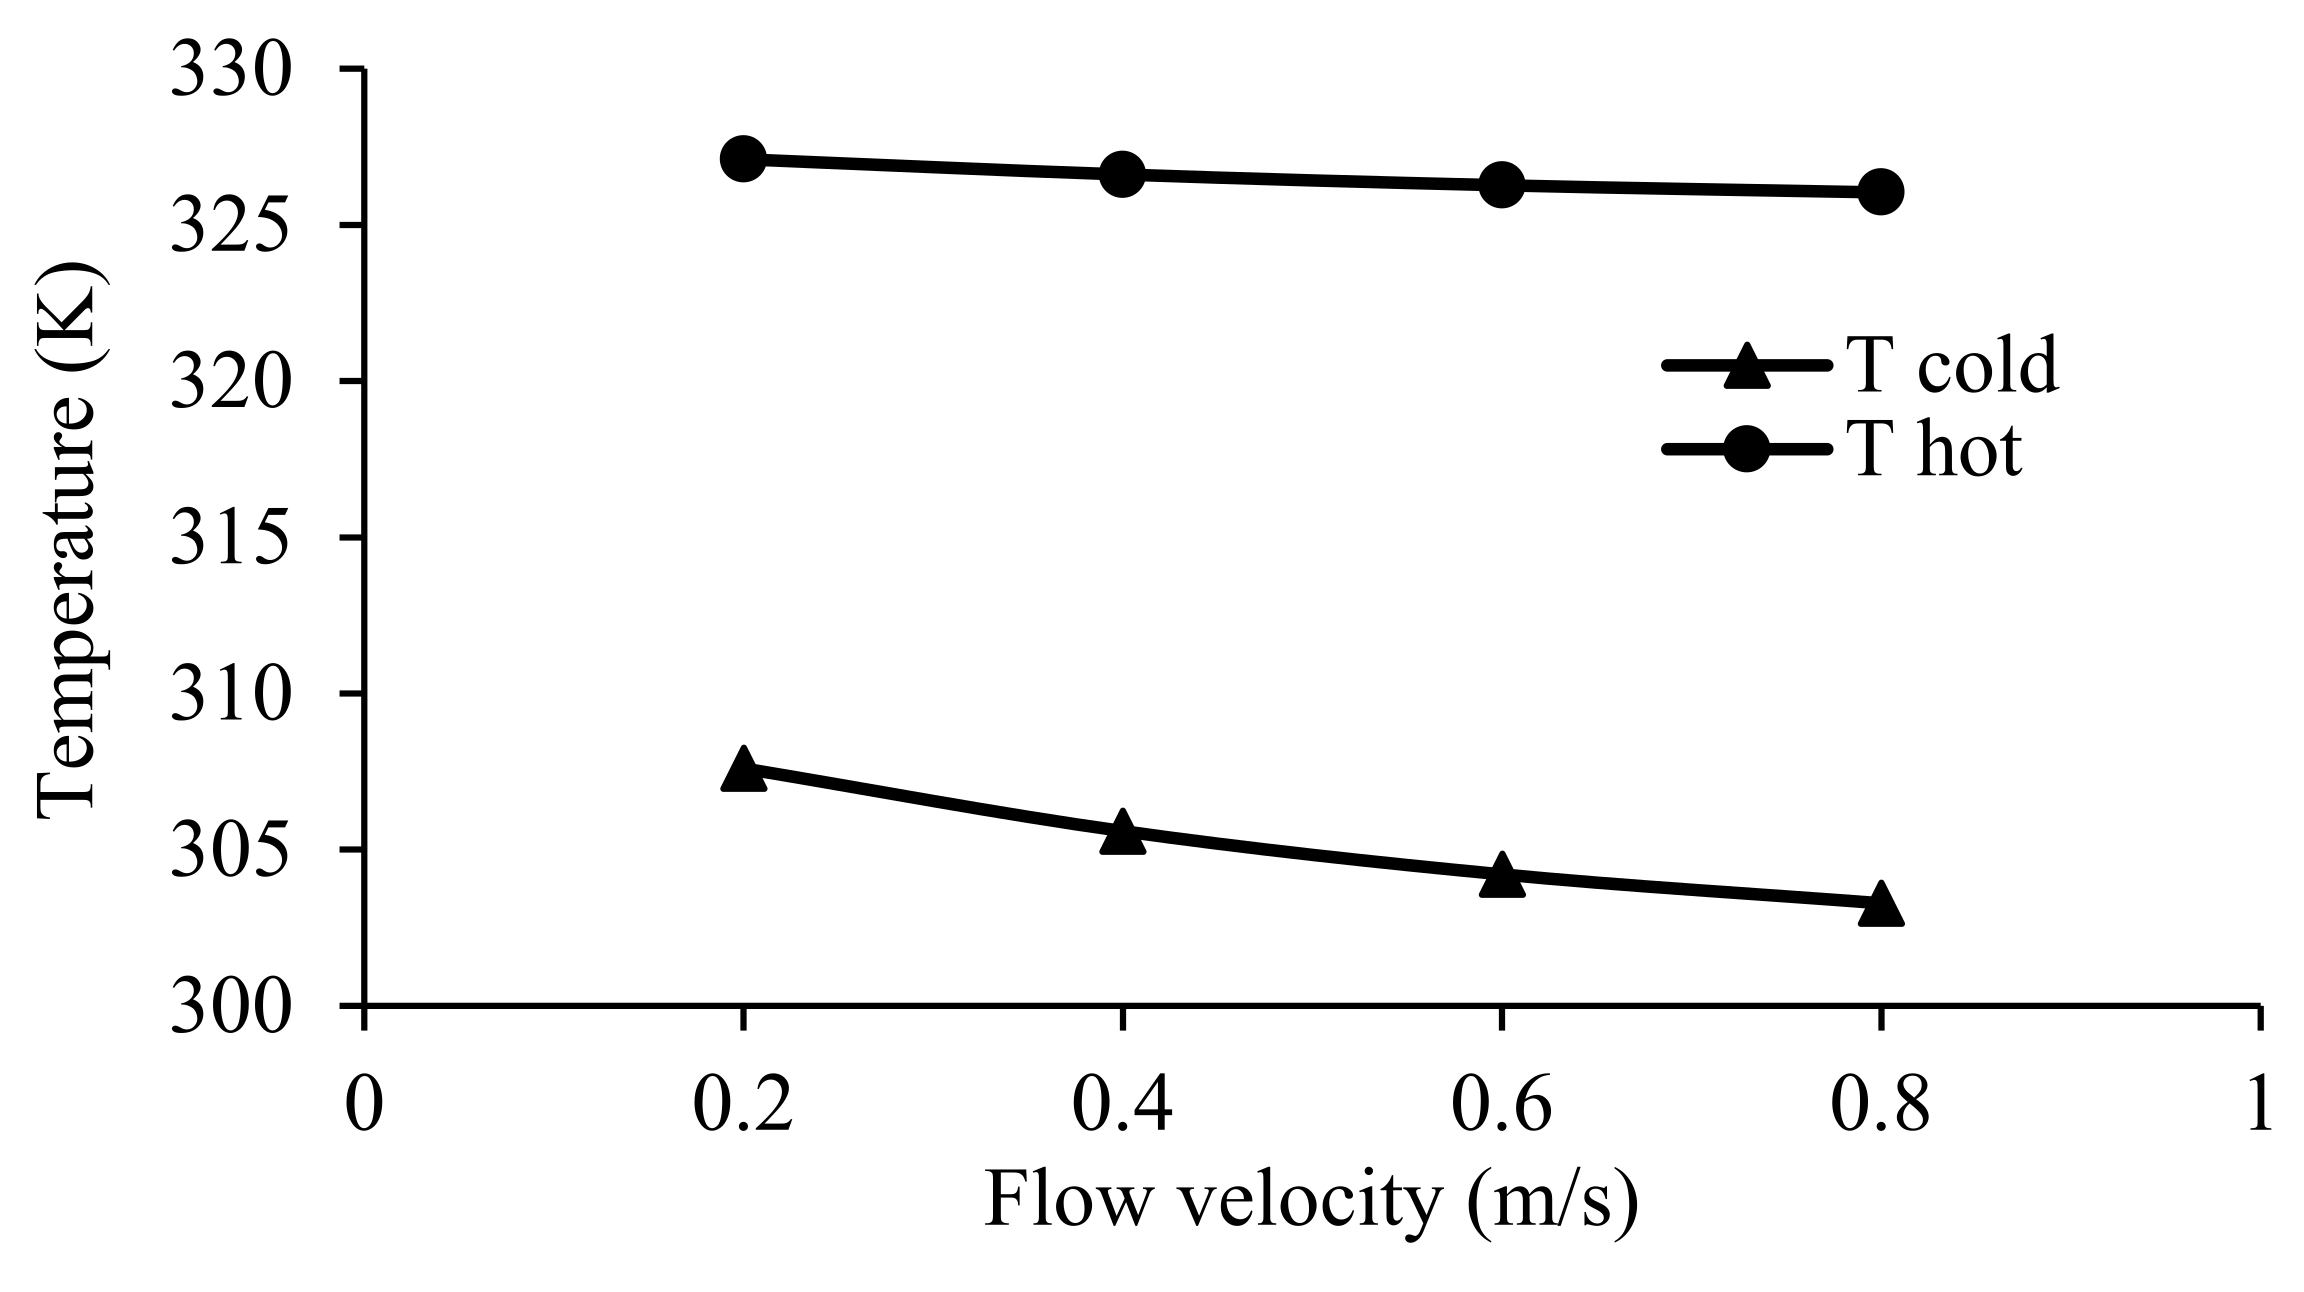
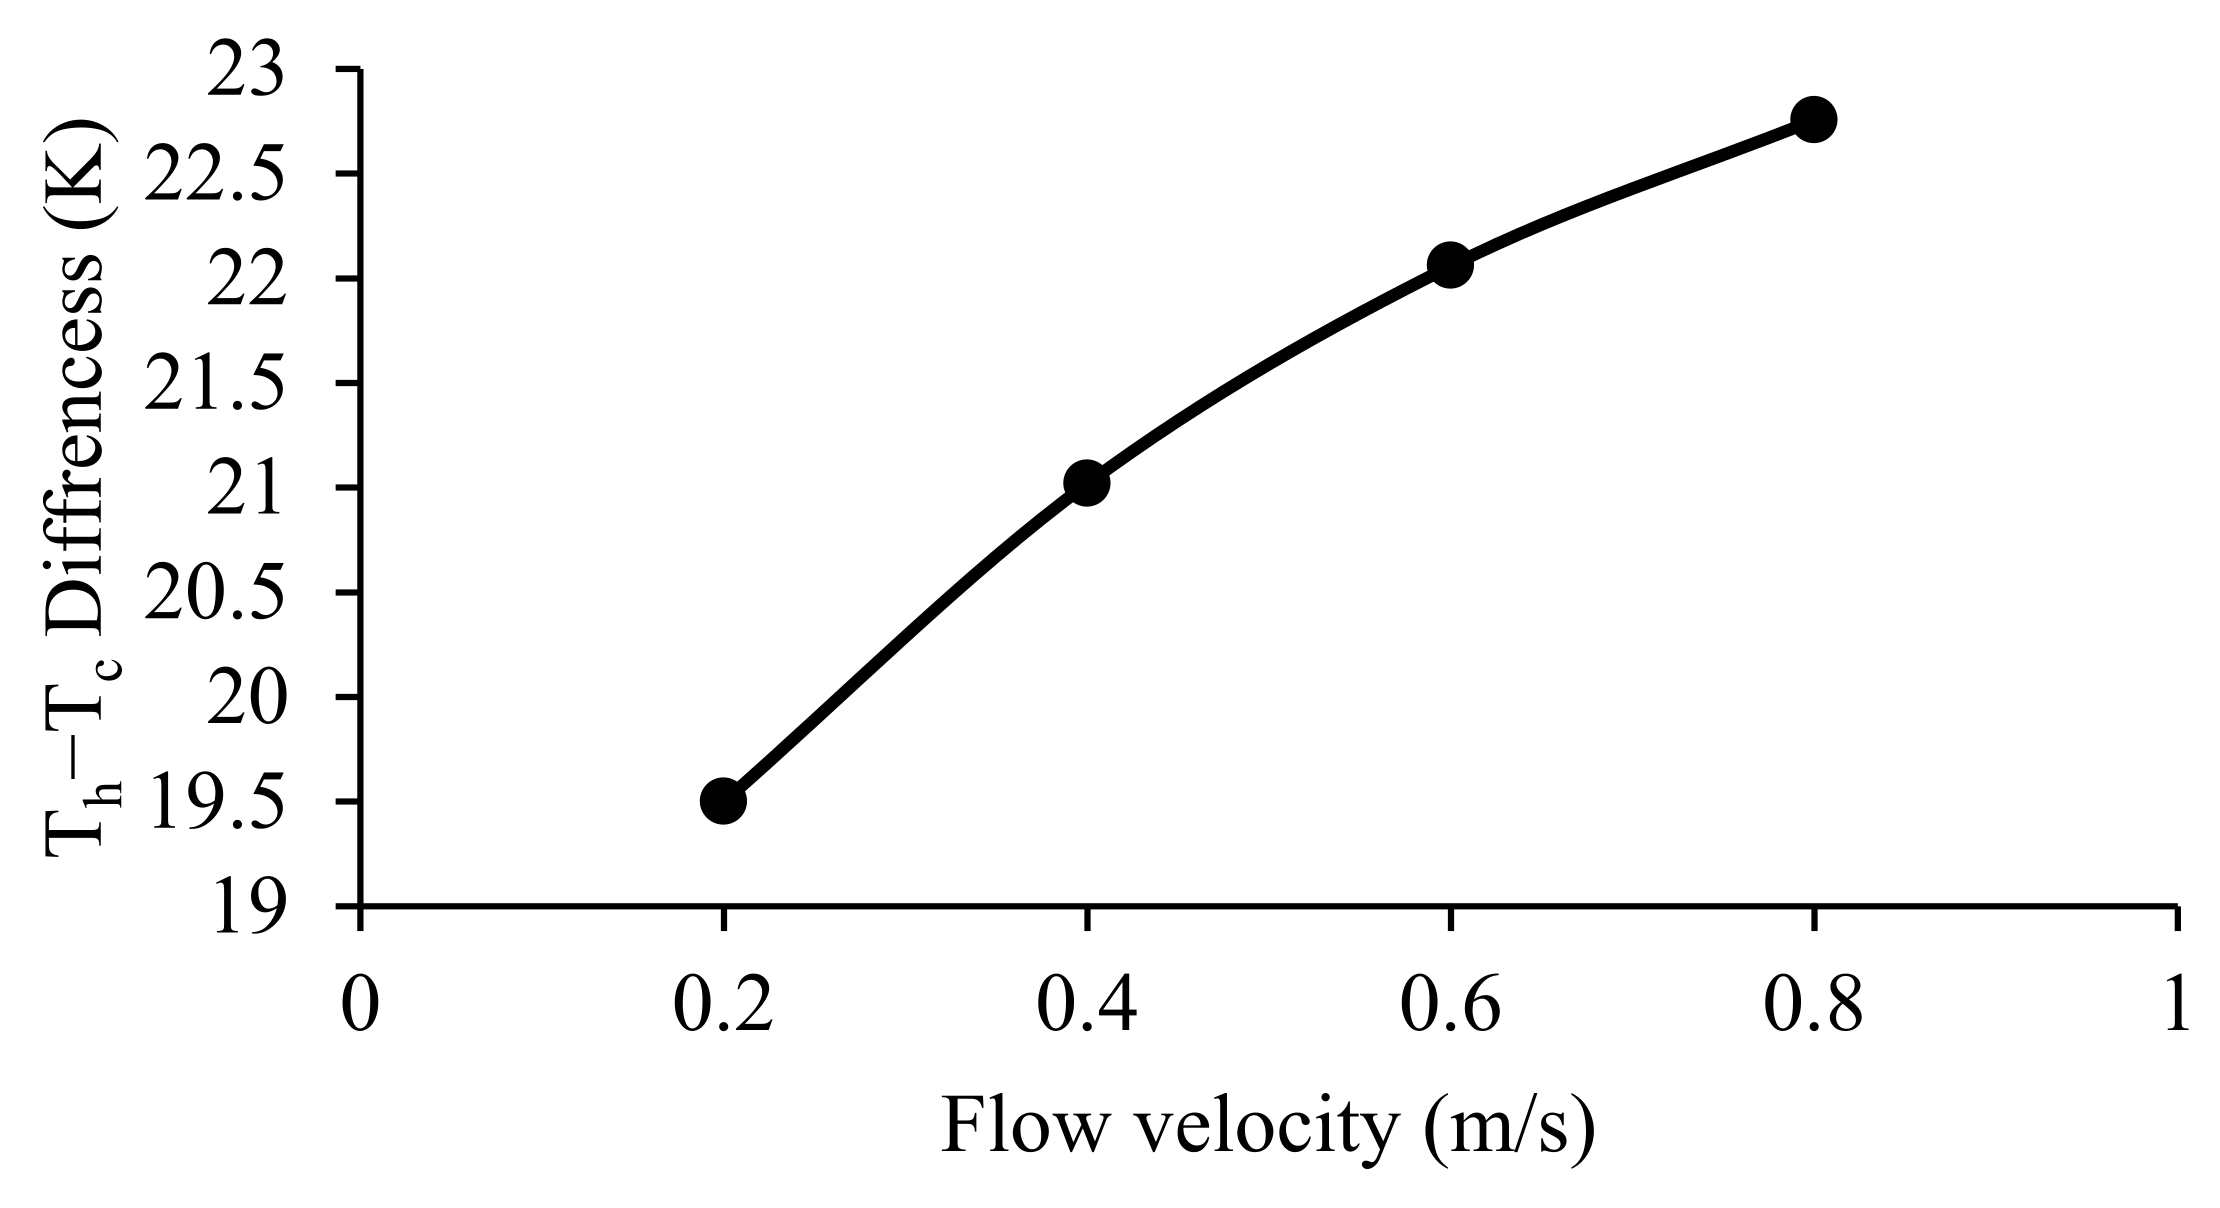
The effect of the cooling water flow velocity on the temperature of the module surfaces is shown in Figure 10. The results show a more prominent effect of the flow velocity on the cold surface than the hot one. Accordingly, larger temperature differences were achieved for higher flow velocities, as is illustrated in Figure 11.
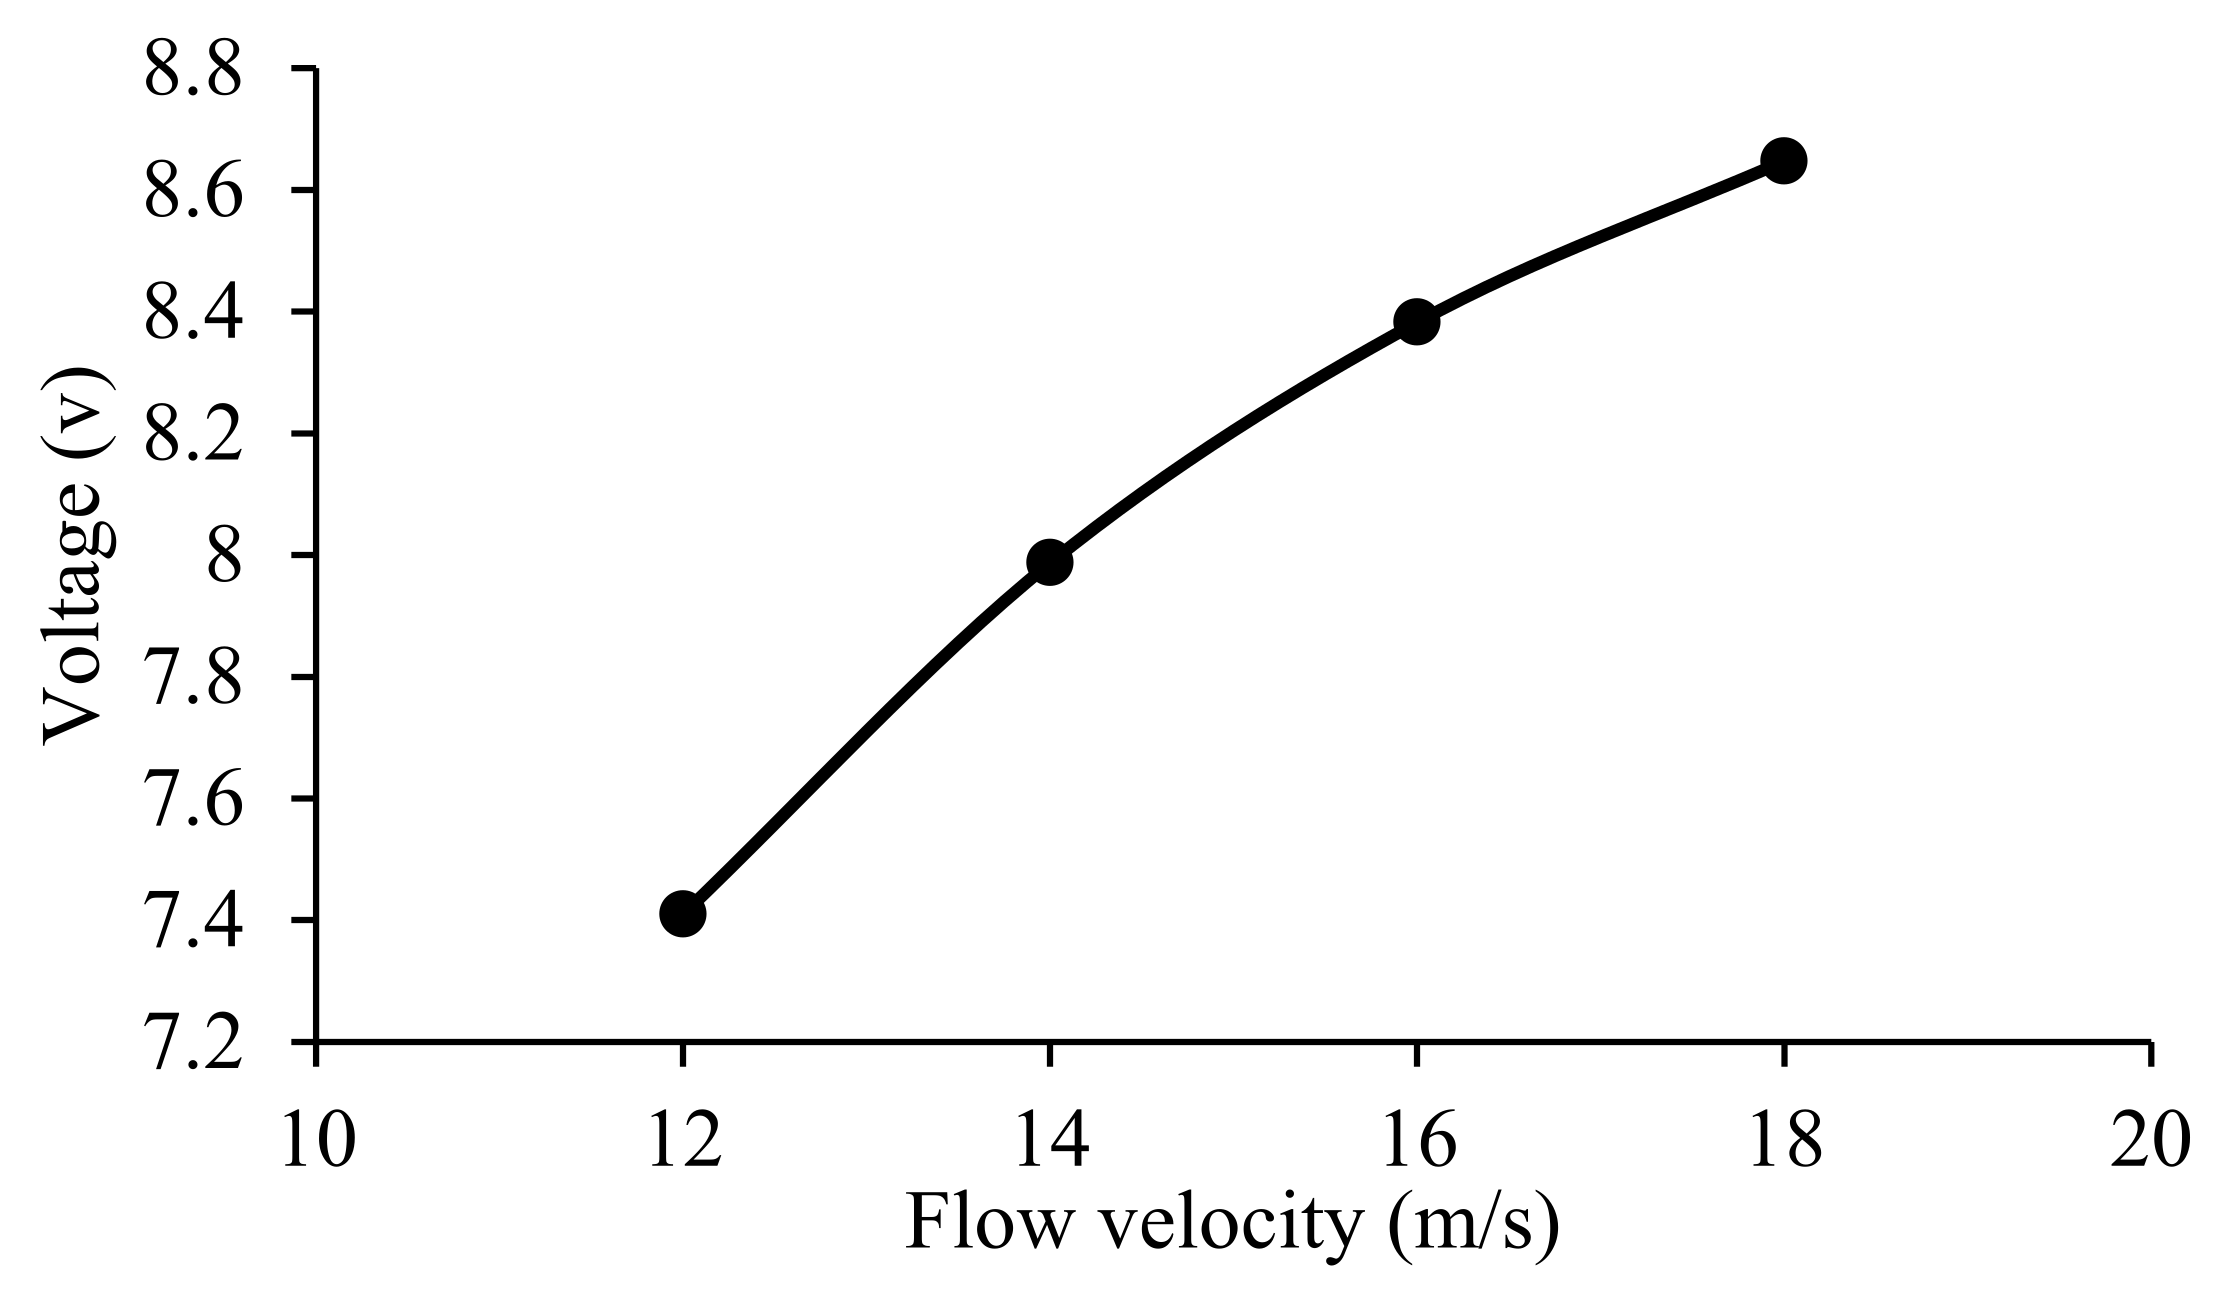
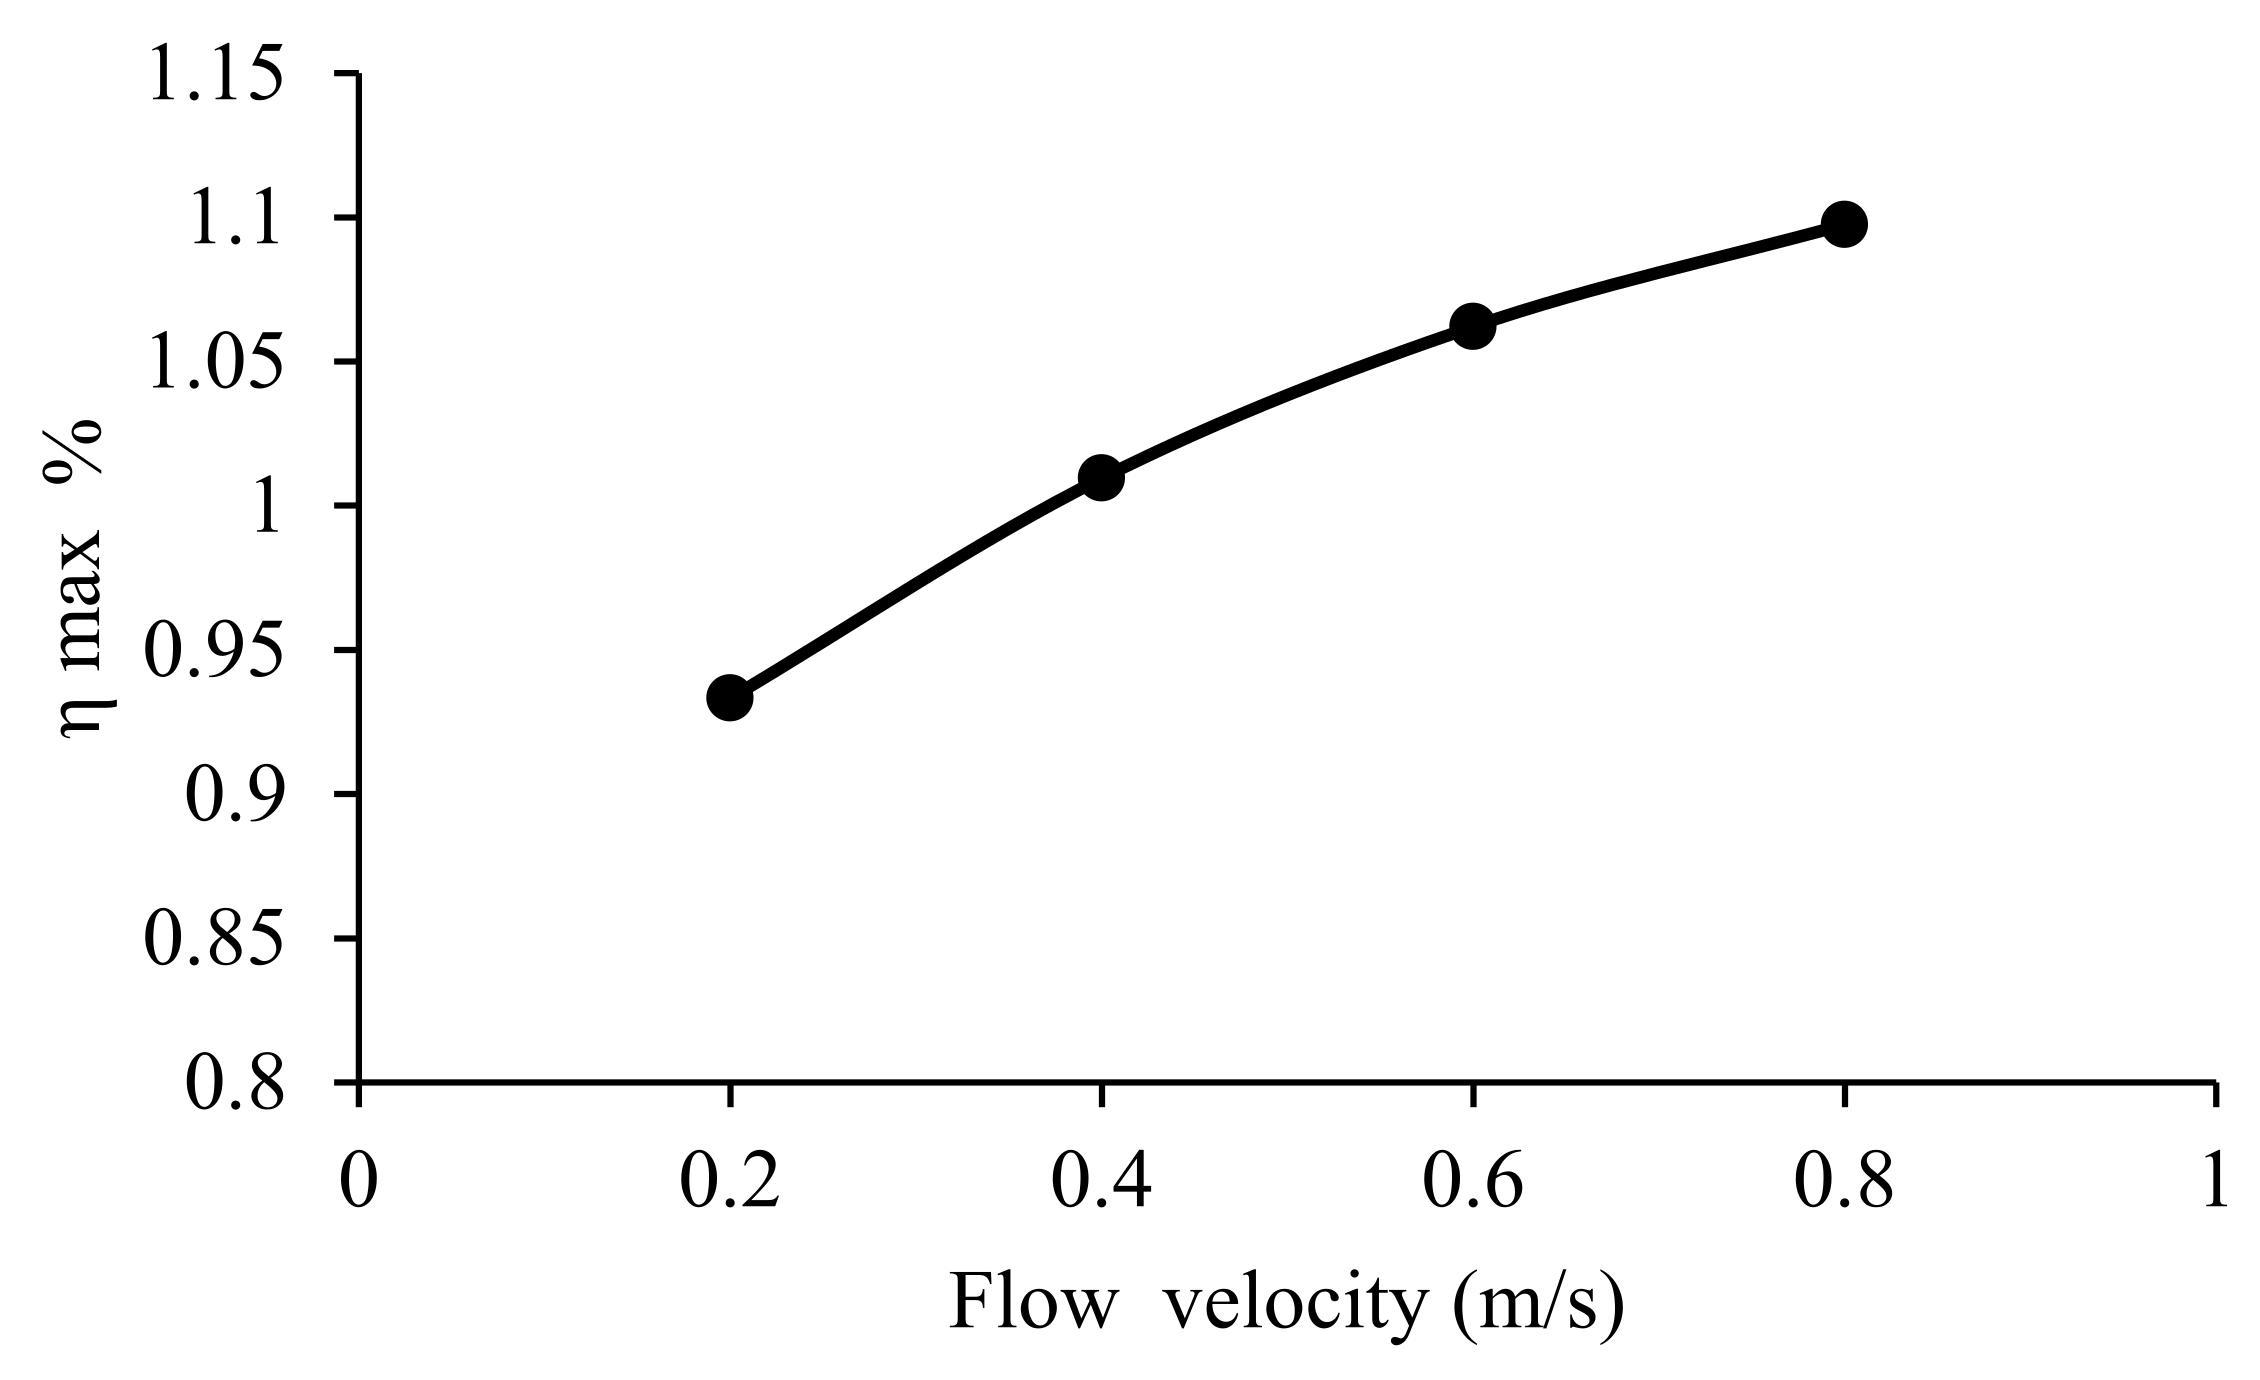
The effect of the flow velocity on the output voltage and efficiency of the TEG is presented in Figure 12 and Figure 13, respectively. The results indicate a positive effect of the flow velocity on the output voltage and efficiency. Comparing these results to earlier research [45,46], it was found that using stripe-shaped surfaces on the cooling cold side of a TEG module is better than plate-shaped or diamond-shaped surfaces. In these earlier studies, temperature increases in the cooling fluid from the inlet-to-outlet conditions were 8.5, 6.2, and 10.5 °C, respectively, for stripe-, plate-, and diamond-shaped surfaces. In the current study, the cooling system employed an M-shaped channel through a block of an aluminum alloy, and the inlet-to-outlet temperature rise was about 2   ° C with a flow rate of 0.8 m/s, as shown in Figure 14d. These results demonstrate better efficiency using an M-shaped channel rather than other shapes. It allows for maintenance of a higher temperature differential for heat transfer and therefore a higher output voltage [45,46,47].
In Figure 14, contour plots of the temperature distribution at a plane just below the cold surface of the TEG, for different inlet flow velocities, are presented. (The results indicate a reduction in the temperature near the fluid channel that was proportional to the inlet flow velocity. The reason for this is to reduce the heat gain time between the entry and exit of aluminum block, and this leads to a high cooling rate. Hence, a larger Δ T for two surfaces of (TEG) is anticipated when the inlet flow velocity is increased).
Figure 14 shows the flow velocity contours at the same plane as the temperature contours. Velocity contours are presented in Figure 15. The highest flow velocity was at the inlet. However, due to turns in the channel, high-pressure regions were generated, which resulted in a velocity reduction at the channel outlet.

5. Conclusions and Future Research Recommendations

A successful, new CFD model was developed in this study to analyze the performance of a solar power–thermoelectric power generation system. The system comprises five TEG modules embedded between two aluminum blocks. A single block functions as a solar power collector to heat one side of the modules, while the other side has an internal M-shaped channel cooled with ordinary tap water. The model was first validated with experimental data available in the literature. Then, it was employed to conduct a parametric study to investigate the effect of different solar block thicknesses and water flow velocities on power generation and efficiency. The results show that the optimum cell size for the best results is 1 mm. Additionally, the model output showed excellent agreement with the experimental data, which makes it a powerful tool for TEG system design. Cooling water flow velocity had a positive effect on the temperature difference between the TEG module surfaces, which consequently produced higher voltage and efficiency. Moreover, the proposed M-shaped water flow provided even heat distribution along the cold side of the TEG system, which is essential for constant voltage generation. Additionally, greater plate thickness resulted in higher heat flux between the hot and cold sides of the TEGs.
For further investigations and improvement, nanofluids can be investigated as alternatives to cooling water. It is anticipated that they can enhance heat dissipation from the cold surface and consequently increase power output.

Author Contributions

Conceptualization, M.A.Q. and V.I.V.; methodology, M.A.Q.; software, M.A.Q.; validation, M.A.Q., S.E.S. and V.I.V.; formal analysis, M.A.Q. and V.I.V.; investigation, M.A.Q.; resources, S.E.S. and M.A.Q.; data curation, M.A.Q. and S.E.S.; writing—original draft preparation, M.A.Q.; writing—review and editing, M.A.Q.; visualization, M.A.Q., supervision, V.I.V.; project administration, M.A.Q.; funding acquisition, M.A.Q. All authors have read and agreed to the published version of the manuscript.

Funding

This research received no external funding.

Data Availability Statement

All important data are included in the manuscript.

Acknowledgments

The authors extend their appreciation to our university library (UrFU) for their support in completing this research.

Conflicts of Interest

The authors declare no conflict of interest.

References

  1. Qasim, M.A.; Velkin, V.I.; Shcheklein, S.E. The Experimental Investigation of a New Panel Design for Thermoelectric Power Generation to Maximize Output Power Using Solar Radiation. Energies 2022, 15, 3124. [Google Scholar] [CrossRef]
  2. Zhang, Q.; Zhao, X.; Lu, H.; Ni, T.; Li, Y. Waste energy recovery and energy efficiency improvement in China’s iron and steel industry. Appl. Energy 2017, 191, 502–520. [Google Scholar] [CrossRef]
  3. Dolz, V.; Novella, R.; García, A.; Sánchez, J. HD Diesel engine equipped with a bottoming Rankine cycle as a waste heat recovery system. Part 1: Study and analysis of the waste heat energy. Appl. Therm. Eng. 2012, 36, 269–278. [Google Scholar] [CrossRef]
  4. Chen, W.H.; Lin, Y.X.; Chiou, Y.B.; Lin, Y.L.; Wang, X.D. A computational fluid dynamics (CFD) approach of thermoelectric generator (TEG) for power generation. Appl. Therm. Eng. 2020, 173, 115203. [Google Scholar] [CrossRef]
  5. Barati, M.; Esfahani, S.; Utigard, T. Energy recovery from high temperature slags. Energy 2011, 36, 5440–5449. [Google Scholar] [CrossRef]
  6. Jouhara, H.; Khordehgah, N.; Almahmoud, S.; Delpech, B.; Chauhan, A.; Tassou, S.A. Waste heat recovery technologies and applications. Therm. Sci. Eng. Prog. 2018, 6, 268–289. [Google Scholar] [CrossRef]
  7. Aranguren, P.; Astrain, D.; Pérez, M.G. Computational and experimental study of a complete heat dissipation system using water as heat carrier placed on a thermoelectric generator. Energy 2014, 74, 346–358. [Google Scholar] [CrossRef]
  8. Wu, C.; Wang, S.S.; Bai, K.L.; Li, J. Thermodynamic analysis and parametric optimization of CDTPC-ARC based on cascade use of waste heat of heavy-duty internal combustion engines (ICEs). Appl. Therm. Eng. 2016, 106, 661–673. [Google Scholar] [CrossRef]
  9. Shu, G.; Liu, P.; Tian, H.; Wang, X.; Jing, D. Operational profile based thermal-economic analysis on an Organic Rankine cycle using for harvesting marine engine’s exhaust waste heat. Energy Convers. Manag. 2017, 146, 107–123. [Google Scholar] [CrossRef]
  10. Wang, X.; Shu, G.; Tian, H.; Liu, P.; Jing, D.; Li, X. Dynamic analysis of the dual-loop Organic Rankine Cycle for waste heat recovery of a natural gas engine. Energy Convers. Manag. 2017, 148, 724–736. [Google Scholar] [CrossRef]
  11. Song, J.; Gu, C.W.; Ren, X. Influence of the radial-inflow turbine efficiency prediction on the design and analysis of the Organic Rankine Cycle (ORC) system. Energy Convers. Manag. 2016, 123, 308–316. [Google Scholar] [CrossRef]
  12. Zhou, Y.; Wang, H.C.; Du, F.R.; Ding, S.T. Algorithm to construct line-shaped feature point clouds of single-value ruled blades for gas turbines. J. Manuf. Sci. Eng. 2014, 136, 041022. [Google Scholar] [CrossRef]
  13. Ennil, A.B.; Al-Dadah, R.; Mahmoud, S.; Rahbar, K.; AlJubori, A. Minimization of loss in small scale axial air turbine using CFD modeling and evolutionary algorithm optimization. Appl. Therm. Eng. 2016, 102, 841–848. [Google Scholar] [CrossRef]
  14. Li, G.; Bao, M.; Ding, S.; Li, Y. A system for accurate measuring of thermal-structure displacement on a high speed rotating turbine disk by using digital image correlation technology. Appl. Therm. Eng. 2017, 113, 36–46. [Google Scholar] [CrossRef]
  15. Habhab, M.B.; Ismail, T.; Lo, J.F. A laminar flow-based microfluidic tesla pump via lithography enabled 3D printing. Sensors 2016, 16, 1970. [Google Scholar] [CrossRef]
  16. Guha, A.; Sengupta, S. Similitude and scaling laws for the rotating flow between concentric discs. Proc. Inst. Mech. Eng. Part A J. Power Energy 2014, 228, 429–439. [Google Scholar] [CrossRef]
  17. Song, J.; Ren, X.D.; Li, X.S.; Gu, C.W.; Zhang, M.M. One-dimensional model analysis and performance assessment of Tesla turbine. Appl. Therm. Eng. 2018, 134, 546–554. [Google Scholar] [CrossRef]
  18. Krishnan, V.G.; Romanin, V.; Carey, V.P.; Maharbiz, M.M. Design and scaling of microscale Tesla turbines. J. Micromech. Microeng. 2013, 23, 125001. [Google Scholar] [CrossRef]
  19. Zhang, M.; Miao, L.; Kang, Y.P.; Tanemura, S.; Fisher, C.A.J.; Xu, G.; Li, C.X.; Fan, G.Z. Efficient, low-cost solar thermoelectric cogenerators comprising evacuated tubular solar collectors and thermoelectric modules. Appl. Energy 2013, 109, 51–59. [Google Scholar] [CrossRef]
  20. Suter, C.; Jovanovic, Z.; Steinfeld, A. A 1 kWe thermoelectric stack for geothermal power generation–Modeling and geometrical optimization. Appl. Energy 2012, 99, 379–385. [Google Scholar] [CrossRef]
  21. Whalen, S.A.; Dykhuizen, R.C. Thermoelectric energy harvesting from diurnal heat flow in the upper soil layer. Energy Convers. Manag. 2012, 64, 397–402. [Google Scholar] [CrossRef]
  22. Li, B.; Huang, K.; Yan, Y.; Li, Y.; Twaha, S.; Zhu, J. Heat transfer enhancement of a modularised thermoelectric power generator for passenger vehicles. Appl. Energy 2017, 205, 868–879. [Google Scholar] [CrossRef]
  23. Nonthakarn, P.; Ekpanyapong, M.; Nontakaew, U.; Bohez, E. Design and Optimization of an Integrated Turbo-Generator and Thermoelectric Generator for Vehicle Exhaust Electrical Energy Recovery. Energies 2019, 12, 3134. [Google Scholar] [CrossRef]
  24. El-Genk, M.S.; Saber, H.H. Performance analysis of cascaded thermoelectric converters for advanced radioisotope power systems. Energy Convers. Manag. 2005, 46, 1083–1105. [Google Scholar] [CrossRef]
  25. Wang, Y.; Dai, C.; Wang, S. Theoretical analysis of a thermoelectric generator using exhaust gas of vehicles as heat source. Appl. Energy 2013, 112, 1171–1180. [Google Scholar] [CrossRef]
  26. Weng, C.-C.; Huang, M.-J. A simulation study of automotive waste heat recovery using a thermoelectric power generator. Int. J. Therm. Sci. 2013, 71, 302–309. [Google Scholar] [CrossRef]
  27. Champier, D.; Bédécarrats, J.P.; Kousksou, T.; Rivaletto, M.; Strub, F.; Pignolet, P. Study of a TE (thermoelectric) generator incorporated in a multifunction wood stove. Energy 2011, 36, 1518–1526. [Google Scholar] [CrossRef]
  28. Chen, W.-H.; Lin, Y.X.; Wang, X.D.; Lin, Y.L. A comprehensive analysis of the performance of thermoelectric generators with constant and variable properties. Appl. Energy 2019, 241, 11–24. [Google Scholar] [CrossRef]
  29. Yu, J.; Zhao, H.; Xie, K. Analysis of optimum configuration of two-stage thermoelectric modules. Cryogenics 2007, 47, 89–93. [Google Scholar] [CrossRef]
  30. Chen, W.-H.; Wu, P.-H.; Lin, Y.-L. Performance optimization of thermoelectric generators designed by multi-objective genetic algorithm. Appl. Energy 2018, 209, 211–223. [Google Scholar] [CrossRef]
  31. Qasim, M.A.; Alwan, N.T.; PraveenKumar, S.; Velkin, V.I.; Agyekum, E.B. A New Maximum Power Point Tracking Technique for Thermoelectric Generator Modules. Inventions 2021, 6, 88. [Google Scholar] [CrossRef]
  32. Meng, F.; Chen, L.; Sun, F. Extreme working temperature differences for thermoelectric refrigerating and heat pumping devices driven by thermoelectric generator. J. Energy Inst. 2010, 83, 108–113. [Google Scholar] [CrossRef]
  33. Yu, J.; Wang, B. Enhancing the maximum coefficient of performance of thermoelectric cooling modules using internally cascaded thermoelectric couples. Int. J. Refrig. 2009, 32, 32–39. [Google Scholar] [CrossRef]
  34. Chakraborty, A.; Saha, B.B.; Koyama, S.; Ng, K.C. Thermodynamic modelling of a solid state thermoelectric cooling device: Temperature–entropy analysis. Int. J. Heat Mass Transf. 2006, 49, 3547–3554. [Google Scholar] [CrossRef]
  35. Huang, M.-J.; Yen, R.-H.; Wang, A.-B. The influence of the Thomson effect on the performance of a thermoelectric cooler. Int. J. Heat Mass Transf. 2005, 48, 413–418. [Google Scholar] [CrossRef]
  36. Chen, W.-H.; Liao, C.-Y.; Hung, C.-I. A numerical study on the performance of miniature thermoelectric cooler affected by Thomson effect. Appl. Energy 2012, 89, 464–473. [Google Scholar] [CrossRef]
  37. Chen, M.; Rosendahl, L.A.; Condra, T. A three-dimensional numerical model of thermoelectric generators in fluid power systems. Int. J. Heat Mass Transf. 2011, 54, 345–355. [Google Scholar] [CrossRef]
  38. Shen, R.; Gou, X.; Zhong, J. A Three-dimensional Dynamic Analysis CFD Tool for Thermoelectric Generators. Int. J. Thermophys. 2020, 41, 1–19. [Google Scholar] [CrossRef]
  39. Högblom, O.; Andersson, R. Multiphysics CFD Simulation for Design and Analysis of Thermoelectric Power Generation. Energies 2020, 13, 4344. [Google Scholar] [CrossRef]
  40. Bejjam, R.B.; Dabot, M.; Wondatir, T.; Negash, S. Performance evaluation of thermoelectric generator using CFD. Mater. Today Proc. 2021, 47, 2498–2504. [Google Scholar] [CrossRef]
  41. Zhao, Y.; Wang, S.; Ge, M.; Li, Y.; Yang, Y. Energy and exergy analysis of thermoelectric generator system with humidified flue gas. Energy Convers. Manag. 2018, 156, 140–149. [Google Scholar] [CrossRef]
  42. Nagaraj, N.N.A.; Kumar, L.S. Electrical Energy Harvesting Using Thermo Electric Generator for Rural Communities in India. Int. J. Energy Power Eng. 2019, 13, 663–667. [Google Scholar]
  43. Tsai, H.-L.; Lin, J.-M. Model building and simulation of thermoelectric module using Matlab/Simulink. J. Electron. Mater. 2010, 39, 2105. [Google Scholar] [CrossRef]
  44. Hsu, C.-T.; Huang, G.Y.; Chu, H.S.; Yu, B.; Yao, D.J. An effective Seebeck coefficient obtained by experimental results of a thermoelectric generator module. Appl. Energy 2011, 88, 5173–5179. [Google Scholar] [CrossRef]
  45. Pfeiffelmann, B.; Benim, A.C.; Joos, F. Water-Cooled Thermoelectric Generators for Improved Net Output Power: A Review. Energies 2021, 14, 8329. [Google Scholar] [CrossRef]
  46. Su, C.Q.; Xu, M.; Wang, W.S.; Deng, Y.D.; Liu, X.; Tang, Z.B. Optimization of cooling unit design for automotive exhaust-based thermoelectric generators. J. Electron. Mater. 2015, 44, 1876–1883. [Google Scholar] [CrossRef]
  47. Qasim, M.A.; Velkin, V.I.; Hassan, A.K. Seebeck Generators and Their Performance in Generating Electricity. J. Oper. Autom. Power Eng. JOAPE 2022, 10, 200–205. [Google Scholar]
Figure 1. (a) Geometry of the module, (b) the basic structure of a TEG.
Crystals 12 00828 g001
Figure 2. The geometry of proposed design.
Crystals 12 00828 g002
Figure 3. The practical configuration of the lower aluminum block with an M-shaped water channel.
Crystals 12 00828 g003
Figure 4. (a) Top and (b) side views of structural hexahedral mesh of the CFD model used in this study.
Crystals 12 00828 g004
Figure 5. The mesh convergence study results.
Crystals 12 00828 g005
Figure 6. A schematic view of one row of the TEG board consisting of two sections, each with 5 modules.
Crystals 12 00828 g006
Figure 7. The effects of the solar plate thickness on the temperature of the module’s hot and cold surfaces.
Crystals 12 00828 g007
Figure 8. The relation between the solar plate thickness and the heat flux between the module’s hot and cold surfaces.
Crystals 12 00828 g008
Figure 9. The relation between solar plate thickness and TEG efficiency.
Crystals 12 00828 g009
Figure 10. The relation between the flow velocity and the module’s hot and cold surface temperatures.
Crystals 12 00828 g010
Figure 11. The effect of flow velocity on the temperature difference between the TEG module’s hot and cold surfaces.
Crystals 12 00828 g011
Figure 12. The relation between the flow velocity and output voltage.
Crystals 12 00828 g012
Figure 13. The relation between flow velocity and TEG efficiency.
Crystals 12 00828 g013
Figure 14. Temperature distribution contours at a plane just below the cold surface of the TEG for flow velocity: (a) 0.2 m/s, (b) 0.4 m/s, (c) 0.6 m/s, and (d) 0.8 m/s.
Crystals 12 00828 g014
Figure 15. Flow velocity contours.
Crystals 12 00828 g015
Table 1. Specifications of the TEG SP1848-27145 module as given by [1,42].
SpecificationValue
MaterialCeramic/Bismuth Telluride
ColorWhite
Temperature ( ° C )150
Open-circuit voltage (V)4.8
Short-circuit current (mA)20/0.97/225; 40/1.8/368; 60/2.4/469; 80/3.6/559; 100/4.8/669
Module size (L × W × H)40 × 40 × 4 mm3
Weight25 g
Table 2. Physical properties of the aluminum alloy 6063.
PropertyValue
Density2.70 kg/m3
Thermal expansion23.5 × 10−6/K
Thermal conductivity200 W/m·K
Electrical resistivity0.035 × 10−6 Ω · m
Table 3. Number of cells for each cell size.
Cell SizeTotal Number of Cells
4.004861
3.006759
2.0019,551
1.00128,474
0.50964,572
Table 4. Experimental data and model predictions obtained at different times of the day.
TimeQasim, Velkin [1]PredictedDiff.
(%)
T h
( ° C )
T c
( ° C )
Δ T
( ° C )
T h   ( ° C ) T c   ( ° C ) Δ T ( ° C )
11:30 a.m.5127245129228.3
12:30 p.m.6232306231313.3
1:30 p.m.7237357235375.7
3:30 p.m.6332316331323.2
Publisher’s Note: MDPI stays neutral with regard to jurisdictional claims in published maps and institutional affiliations.