Article

Electrochemical Characterization Method of Laves Phase in 9Cr Martensitic Heat-Resistant Steel and Creep Life Prediction

1
Xi’an Thermal Power Research Institute Co., Ltd., Xi’an 710032, China
2
School of Materials, Sun Yat-sen University, No. 135, Xingang Xi Road, Guangzhou 510275, China
*
Authors to whom correspondence should be addressed.
Crystals 2023, 13(11), 1600; https://doi.org/10.3390/cryst13111600
Submission received: 8 October 2023 / Revised: 11 November 2023 / Accepted: 13 November 2023 / Published: 20 November 2023
(This article belongs to the Special Issue Modern Technologies in the Manufacturing of Metal Matrix Composites)

Abstract

:
The Laves phase formed during the long-term creep of 9% Cr heat-resistant steels plays an important role in their high-temperature mechanical properties. Detecting and quantifying the Laves phase is one of the main problems in predicting the creep residual life. This study detects and quantifies the Laves phase in various 9% Cr heat-resistant steel samples by anodic polarization. Both T92/P92 samples after creep and 9Cr ferritic martensitic samples after thermal ageing precipitate Laves phase particles, and the content of the Laves phase increases with the service time. Comparing the results obtained by the electrochemical method with those obtained by the traditional SEM observation method, it can be found that there is a similar two-stage linear relationship between the two results in all materials, which is related to the diameter change of Laves phase particles during service. According to the correlation between the Laves phase content and creep time, an extrapolation method for the prediction of the residual creep life is proposed. The results show that the creep life of P92 can be predicted by using the dissolved charge density of the Laves phase with high prediction accuracy. This method has the potential to evaluate the service states of materials and predict the long-term creep life in the industrial field.

1. Introduction

Heat-resistant martensitic 9% Cr steels have been found not only to be currently applicable in high-temperature and high-pressure parts of fossil fuel power plants, but also as candidate materials for a new generation (Generation Ⅳ) of reactors [1]. During long-term creep, the microstructure of the material will change, and new phases, such as the Laves phase (Fe, Cr)2(W, Mo), primarily precipitate at the boundaries of primary austenite grains, subgrains and martensite laths [2,3,4,5]. The finely dispersed Laves phase has a precipitation-strengthening effect on the matrix, which can prevent the recovery of martensitic slats and dislocations [6,7,8]. However, Abe et al. [9,10] found that the precipitation of the Laves phase led to a decrease in the creep rate, but when the size of the Laves phase began to increase significantly, the creep rate increased after reaching the minimum creep rate. Therefore, the creep-resistant property of 9% Cr steels is closely related to the Laves phase evolution.
In order to evaluate and predict the creep life of materials, much work has been conducted to study the precipitation of the Laves phase in heat-resistant steel during high-temperature service. The quantification of Laves phase precipitation in heat-resistant steels has mainly been studied by morphology observation methods through electron microscopy [3,4]. However, these methods need advanced facilities, such as a scanning electron microscope (SEM) or transmission electron microscope (TEM), and the spatial area of investigation is limited. In recent years, it has been found that the electrochemical method can selectively dissolve the Laves phase in 9–12% Cr heat-resistant steel after long-term aging in a strong alkaline solution [11,12,13]. A good linear relationship was established between the area fraction data of the Laves phase collected by SEM imaging and the dissolved peak charge obtained by the electrochemical method. This fact shows that the electrochemical method can be used for the quantitative analysis of Laves phase particles on 9–12% Cr steel.
However, studies of phase evolution models for long-term creep steels suggest that equilibrium may not be reached even beyond 10 years [14,15,16], whereas the samples used in the literature so far are of a relatively short age and only prepared in the laboratory. In this work, the Laves phases formed in interrupted creep T92 samples up to 24,000 h and in-service P92 samples up to 82,000 h were detected and quantified by the electrochemical method with the purpose of establishing the relationship between the electrochemical parameters and the amount of Laves phase. In addition, 9Cr ferritic martensitic steels were studied with electrochemical tests with the aim of verifying the generalizability of the method. An extrapolation method for the prediction of the residual creep life is proposed based on the correlation between the Laves phase content and creep time.

2. Materials and Methods

The materials for the experiments were T92/P92 steel and 9Cr ferritic martensitic steel (hereinafter referred to as 9Cr F/M), and the compositions are shown in Table 1. T92/P92 was labelled in two different ways to specify its origin. T92 steel was normalized at 1050 °C for 1 h and tempered at about 700 °C for 5 h (air cooling), and then the internal pressure creep test was carried out at a temperature of 600 °C and a pressure of 130 MPa until the tube sample burst, with a creep time of 24,000 h. Among them, four tube samples were interrupted and removed when the test time reached 1700 h, 5000 h, 12,800 h, and 18,600 h, respectively; details are shown in Table 2. Two P92 samples taken from the fossil power plant pipe at a temperature of about 600 °C and a pressure of about 67 MPa, with a service time of 50,000 h and 82,000 h, were also used for residual life prediction. It should be noted that the difference in composition between T92 and P92 steel was negligible. The 9Cr F/M steels were quenched after solid solution treatment at 1050 °C for 1 h and tempered at 730 °C for 3 h, and then aged at 650 °C for a series of time periods (0 h, 1000 h, 2000 h, 3500 h, 5000 h, and 6500 h).
The samples for the electrochemical tests were cut into 10 × 10 × 5 (mm) specimens, and then cold-mounted in epoxy resin with a plastic-wrapped copper wire welded on each specimen for electrical contact. Before the electrochemical tests, the exposed surface was ground to 2000 grit and washed in distilled water and ethanol for later use. The electrochemical tests in this study were conducted on a CHI 660 electrochemical workstation with a conventional three-electrode cell, which used a saturated Ag/AgCl electrode as the reference electrode and a Pt electrode as the counter electrode. The anodic polarization tests were performed in a series of 5–8 mol/L NaOH solutions with a scan rate of 0.5 mV/s. All of the potentiodynamic scans were started after reaching a stable open circuit potential (OCP) and ended when the oxygen evolution reaction occurred. Each test was conducted at least 3 times to ensure the reproducibility of the data. According to Faraday’s law, the amount of charge density (Q) transferred in the Laves phase dissolution reaction corresponds to the dissolved Laves phase content. The charge density of the Laves phase in T92 and P92 specimens could be obtained by integrating the current density on each polarization curve with the polarization time. To ensure the reliability of the data, each experiment was performed at least 3 times.
Before the observation of the microstructure, all the specimens were polished up to 0.5 μm with a diamond paste. A Crossbeam 350 SEM was used to observe the surface morphologies of specimens with different service times and surface changes before/after the polarization tests. The morphology and composition of the precipitates in specimens were examined by a JXA-iHP200F field emission electron probe microanalyzer (EPMA), transmission electron microscope (TEM), and energy-dispersive spectroscopy (EDS). To ensure the validity of the data, SEM images were taken at 20 different positions randomly for each specimen, with both the secondary electron (SE) and backscattered electron (BSE) mode, with magnification of 2000×. BSE images were used to identify the Laves phase from the matrix due to its clear Z-contrast, and an SE image on the same area was taken to estimate the exact shape of the Laves phase, to avoid counting particles below the surface. The Image J software (1.53 k) was used to calculate the area fraction, number, and average diameter of Laves phase particles.

3. Results

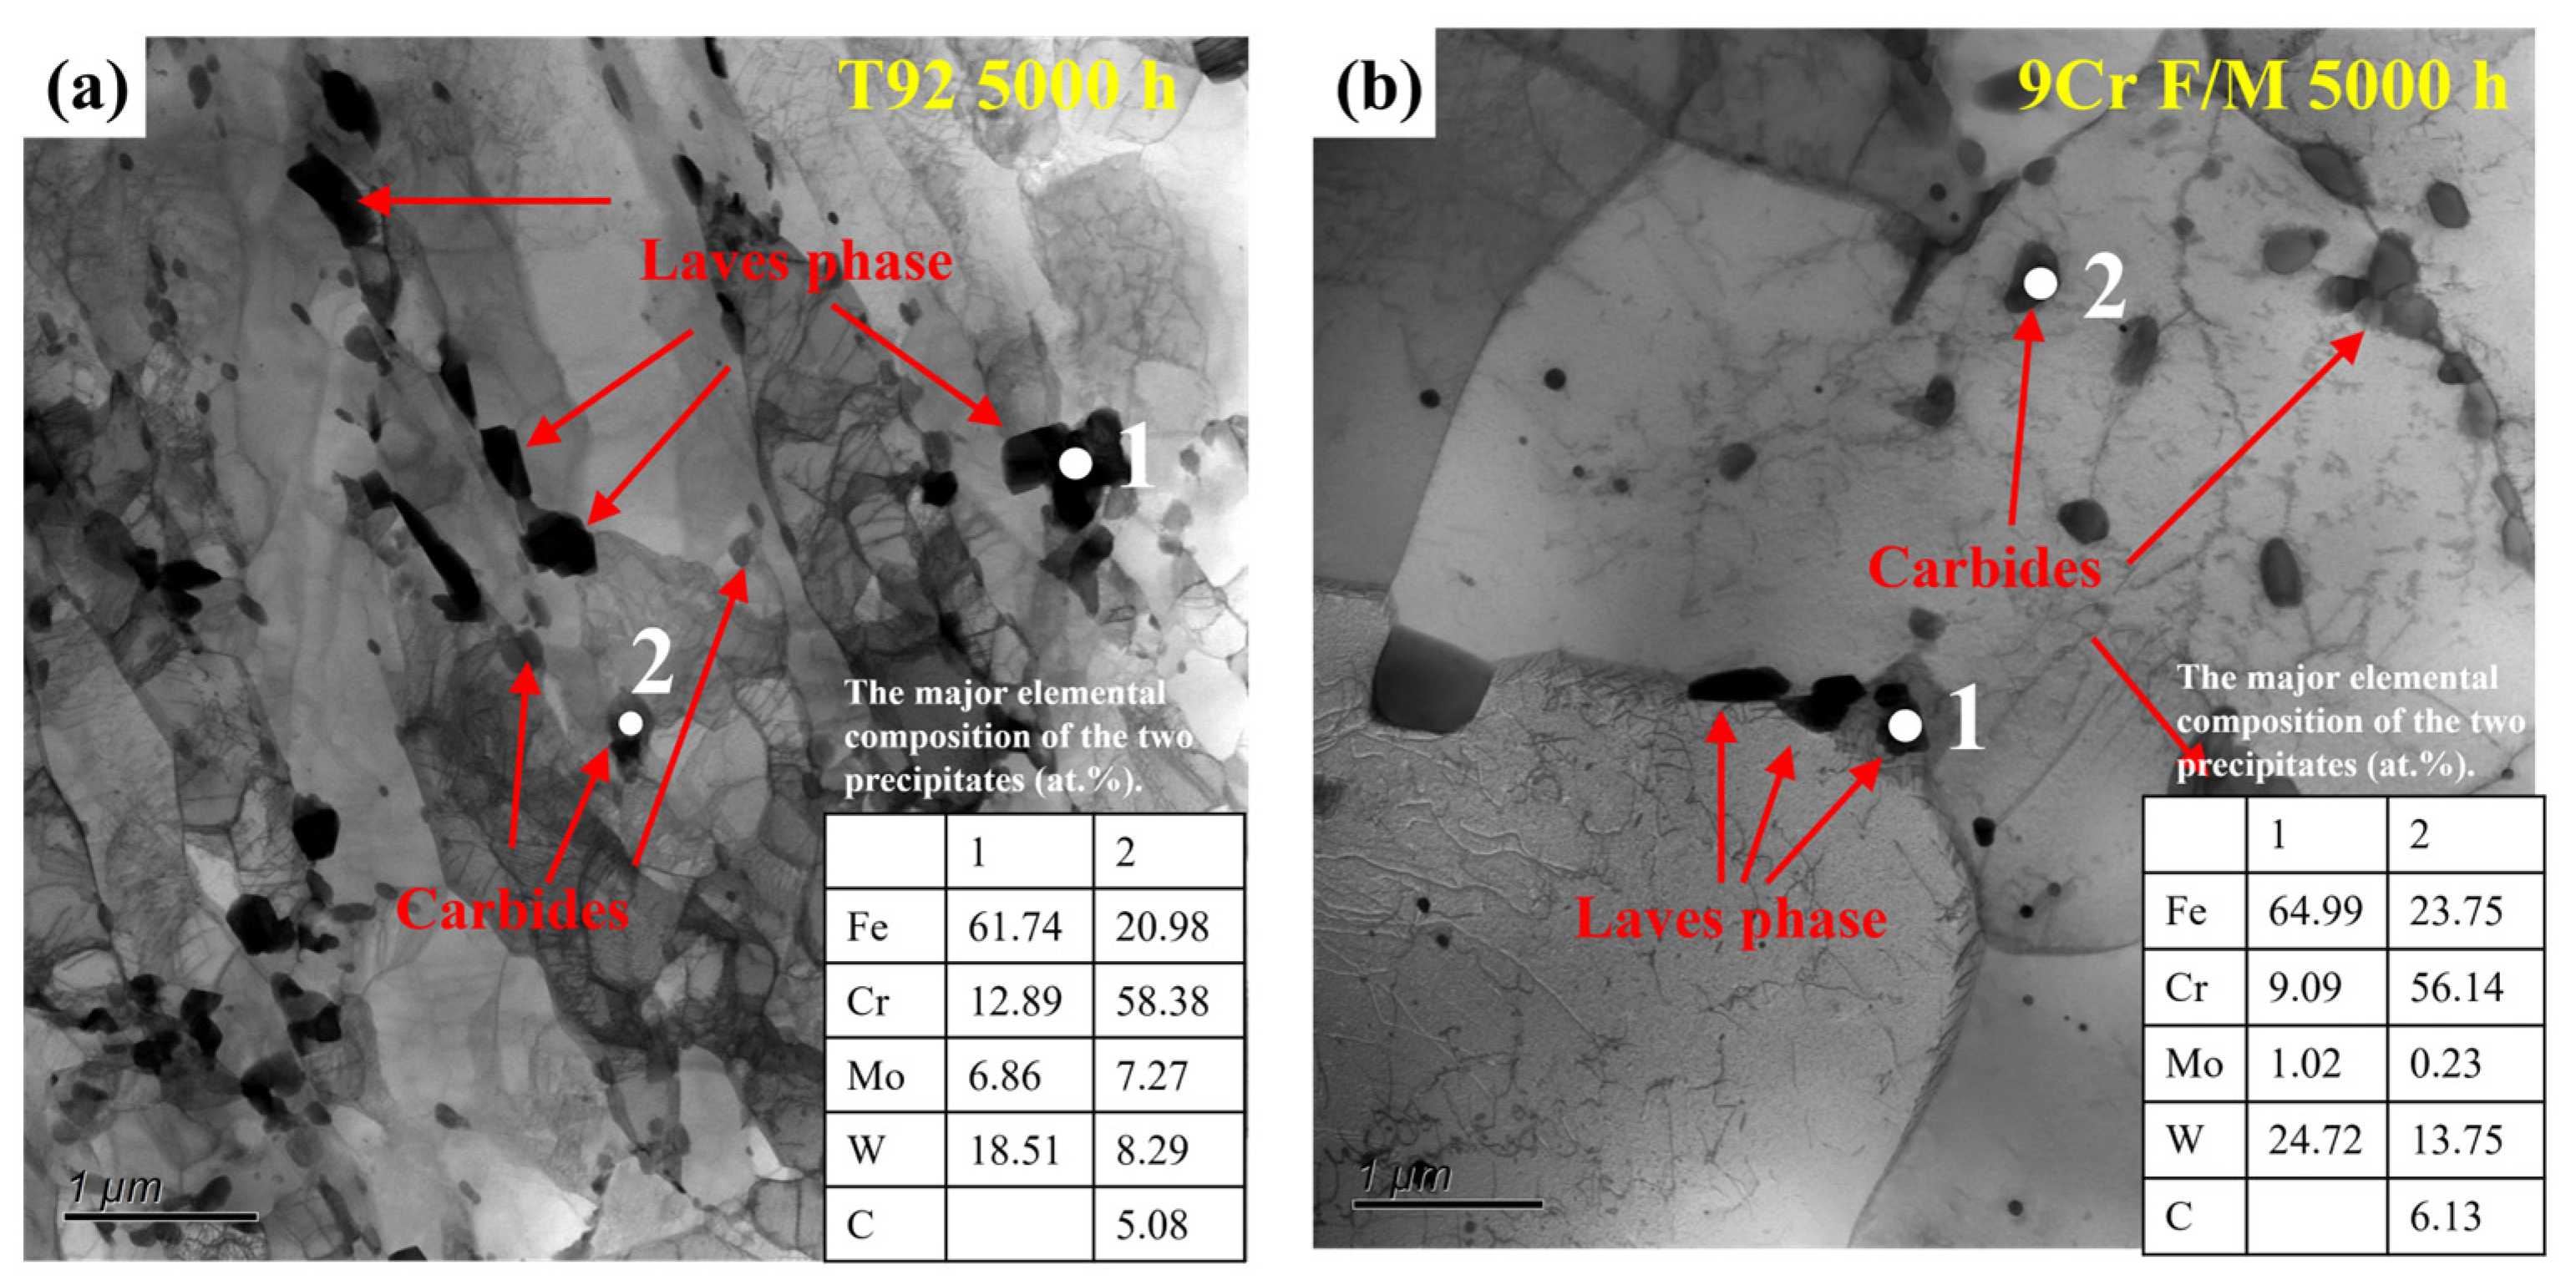
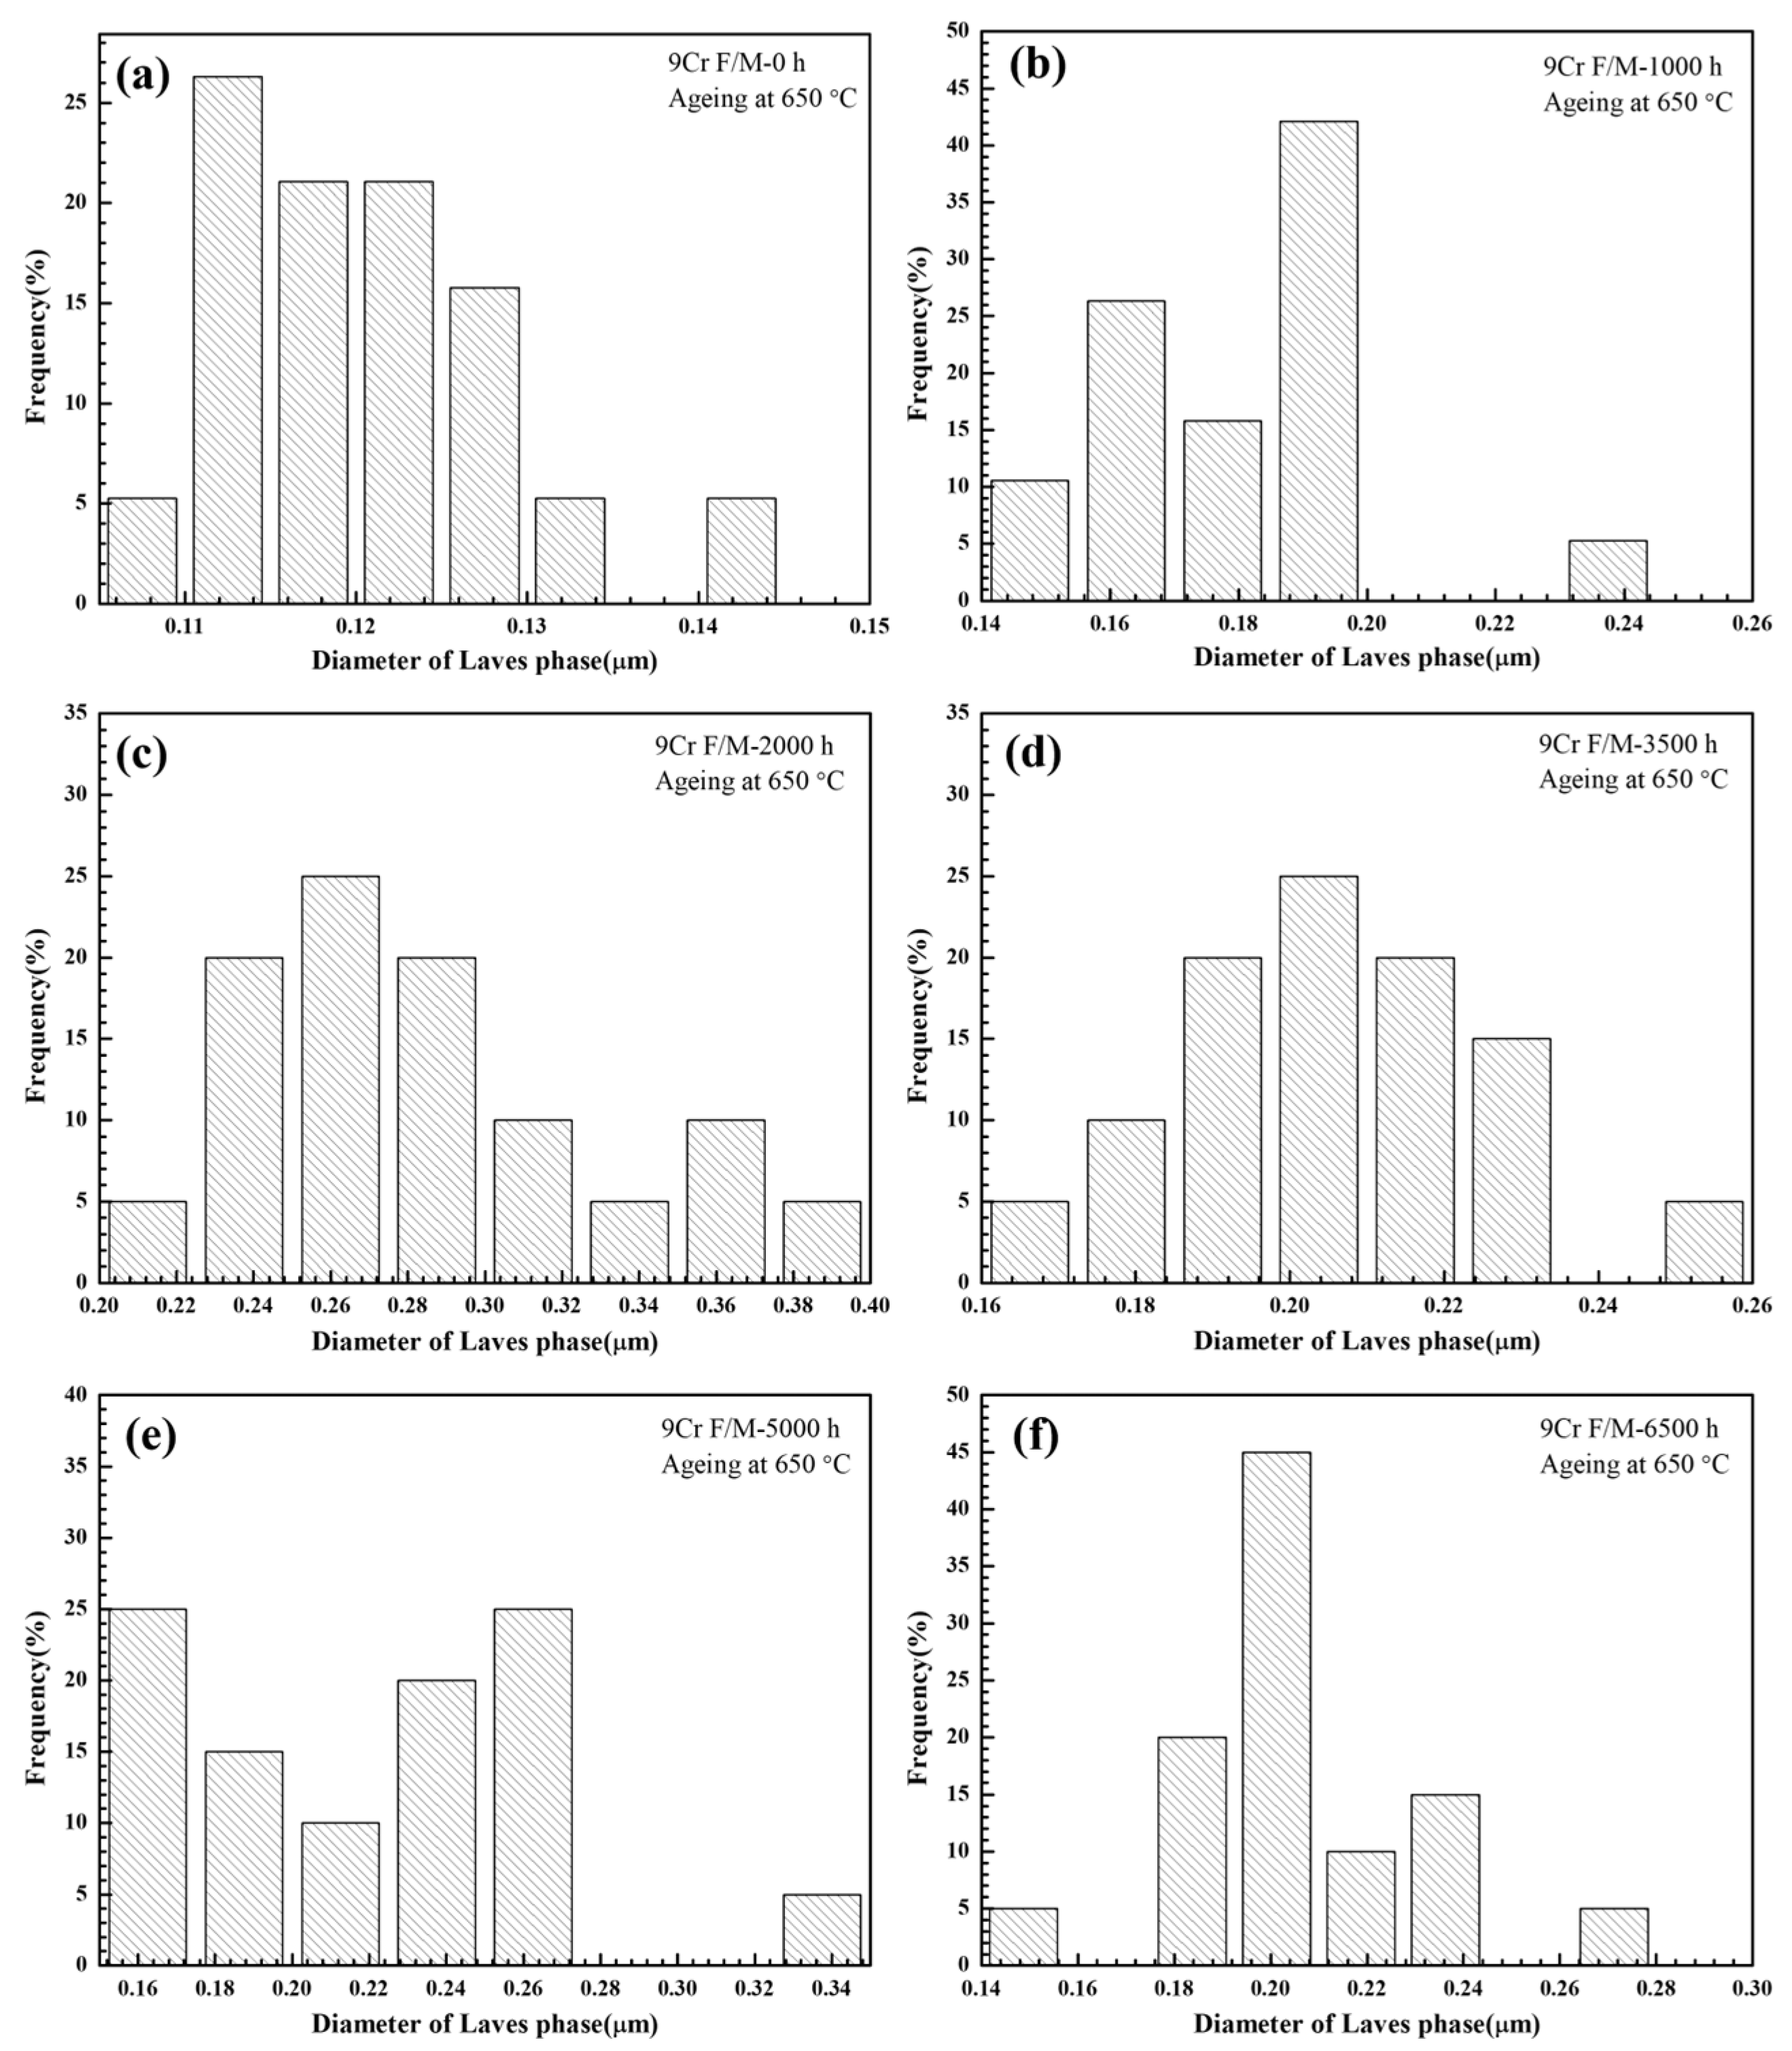
3.1. Characterization of the Laves Phase

Figure 1a–f show the SEM morphologies of T92 specimens after 0 h, 1700 h, 5000 h, 12,800 h, 18,600 h, and 24,000 h of creep separately, as well as P92 specimens with a service time of 50,000 h and 82,000 h. There are no precipitates on the surface of the T92-0 h specimen (solution quenching and tempering treatment), and a typical tempered martensitic structure can be observed. The surfaces of all specimens show bright precipitates of different sizes. The chemical composition of the particles in the T92 crept 24,000 h specimen was obtained by EPMA, as shown in Figure 2. These precipitates are rich in W and Mo elements compared to the matrix and can be confirmed as the Laves phase [5]. Additionally, some small particles with the enrichment of Cr and C were M23C6 carbides [2,17], and the small amount of segregation of V and Nb may have corresponded to the precipitation of MX nitrides and the Z-phase [18,19]. In the early stage of creep, as shown in Figure 1b,c, the Laves phase was preferentially precipitated along the prior austenite grain boundaries. With the increase in creep time, the polygonal outline gradually disappeared, and the Laves phase formed within the primary austenite grains and mainly precipitated along the martensite lath, as shown in Figure 1d–h. It is worth noting that the number of Laves phase particles on the surfaces of the P92 50,000 h and 82,000 h specimens with a longer service time, shown in Figure 1g,h, was significantly smaller than that of the T92 24,000 h specimen. This may be due to the different service conditions of the two samples.
Figure 3a–c show the statistical results of the number per area, area fraction, and average equivalent diameter of Laves phase particles on different specimens’ surfaces derived from BSE images, respectively. The number of Laves phase particles increased with time at the initial stage and increased to the maximum value when the creep time reached 12,800 h. Subsequently, the number of Laves phase particles decreased rapidly again. With the increase in creep time, both the area fraction and average diameter of Laves phase particles increased continuously, but there were differences in the growth trends between them. The area fraction of Laves phase particles increased rapidly in the early stage of creep, reached the maximum value and remained roughly stable after 18,600 h, and then decreased slightly. However, the average diameter of the Laves phase particles increased slowly or even decreased slightly in the early phase, and then increased rapidly with the extension of the creep time, and finally became stable. Therefore, it can be speculated that a large number of fine Laves phase particles precipitated rapidly in the T92 sample at the beginning of creep; then, with the extension of the creep time, the particles of the Laves phase continued to agglomerate and gradually reached saturation. At this time, the area fraction of the Laves phase remained unchanged, while the particle number rapidly decreased and the particle size increased. In addition, P92 specimens had a lower area fraction and particle density, as well as a larger particle size.
Figure 4 shows the TEM images of the microstructure of the T92 specimen with creep ageing for 5000 h and the 9Cr F/M aged specimen for 5000 h. Two types of precipitates appeared in both samples, which are identified as the Laves phase and carbides, as previously mentioned. Since the Laves phase contains higher W and/or Mo content than the carbides, it has a clearer Z-contrast. Depending on the contrast in the TEM images, the darker particles are enriched in W and Mo, identified as the Laves phase, and the lighter particles are enriched in Cr, which are confirmed as carbides. It should be mentioned that the size of the Laves phase particles in the T92 specimen is much larger than that in 9Cr F/M. In contrast, the carbides in 9Cr F/M have a larger size. This may be attributed to differences in the composition of the two materials. The T92 specimen contains more W and Mo, which are the major elements that make up the Laves phase, while 9Cr F/M contains more C, which is more conductive to the formation of carbides.
Figure 5a–f show the SEM morphologies of 9Cr F/M specimens after 0 h, 1000 h, 2000 h, 3500 h, 5000 h, and 26,500 h of ageing separately. Similar to the T92 and P92 specimens, the number per area, area fraction, and average equivalent diameter of the Laves phase particles in the 9Cr F/M specimens with the increment in ageing time obtained by SEM observation were calculated using the Image J software, and the results are shown in Figure 6a–c. The number per area fluctuated around 0.2 μm−2 during the first 3500 h of ageing, and then dropped slightly. Figure 7 shows the size dispersion of the Laves phase in 9Cr F/M specimens after ageing at 650 °C with different times. Consistent with the results of T92, the area fraction of the Laves phase in 9Cr F/M increased with the aging time and then reached saturation. However, the value of the 9Cr F/M specimen reached its maximum of 0.54% after 1000 h of ageing, which was much smaller than that of T92. It can be concluded that the Laves phase can also grow after thermal aging without stress, but the area fraction of the Laves phase at saturation is much lower than that of the sample after creep. The average diameter of the Laves phase in 9Cr F/M reached a maximum and then dropped from 0.28 μm to 0.21 μm. After this, the diameter of the particles stayed the same. It can be seen from the statistical results that the size of the Laves phase in 9Cr F/M steel is smaller than that in T92, which is consistent with the TEM topography in Figure 4.

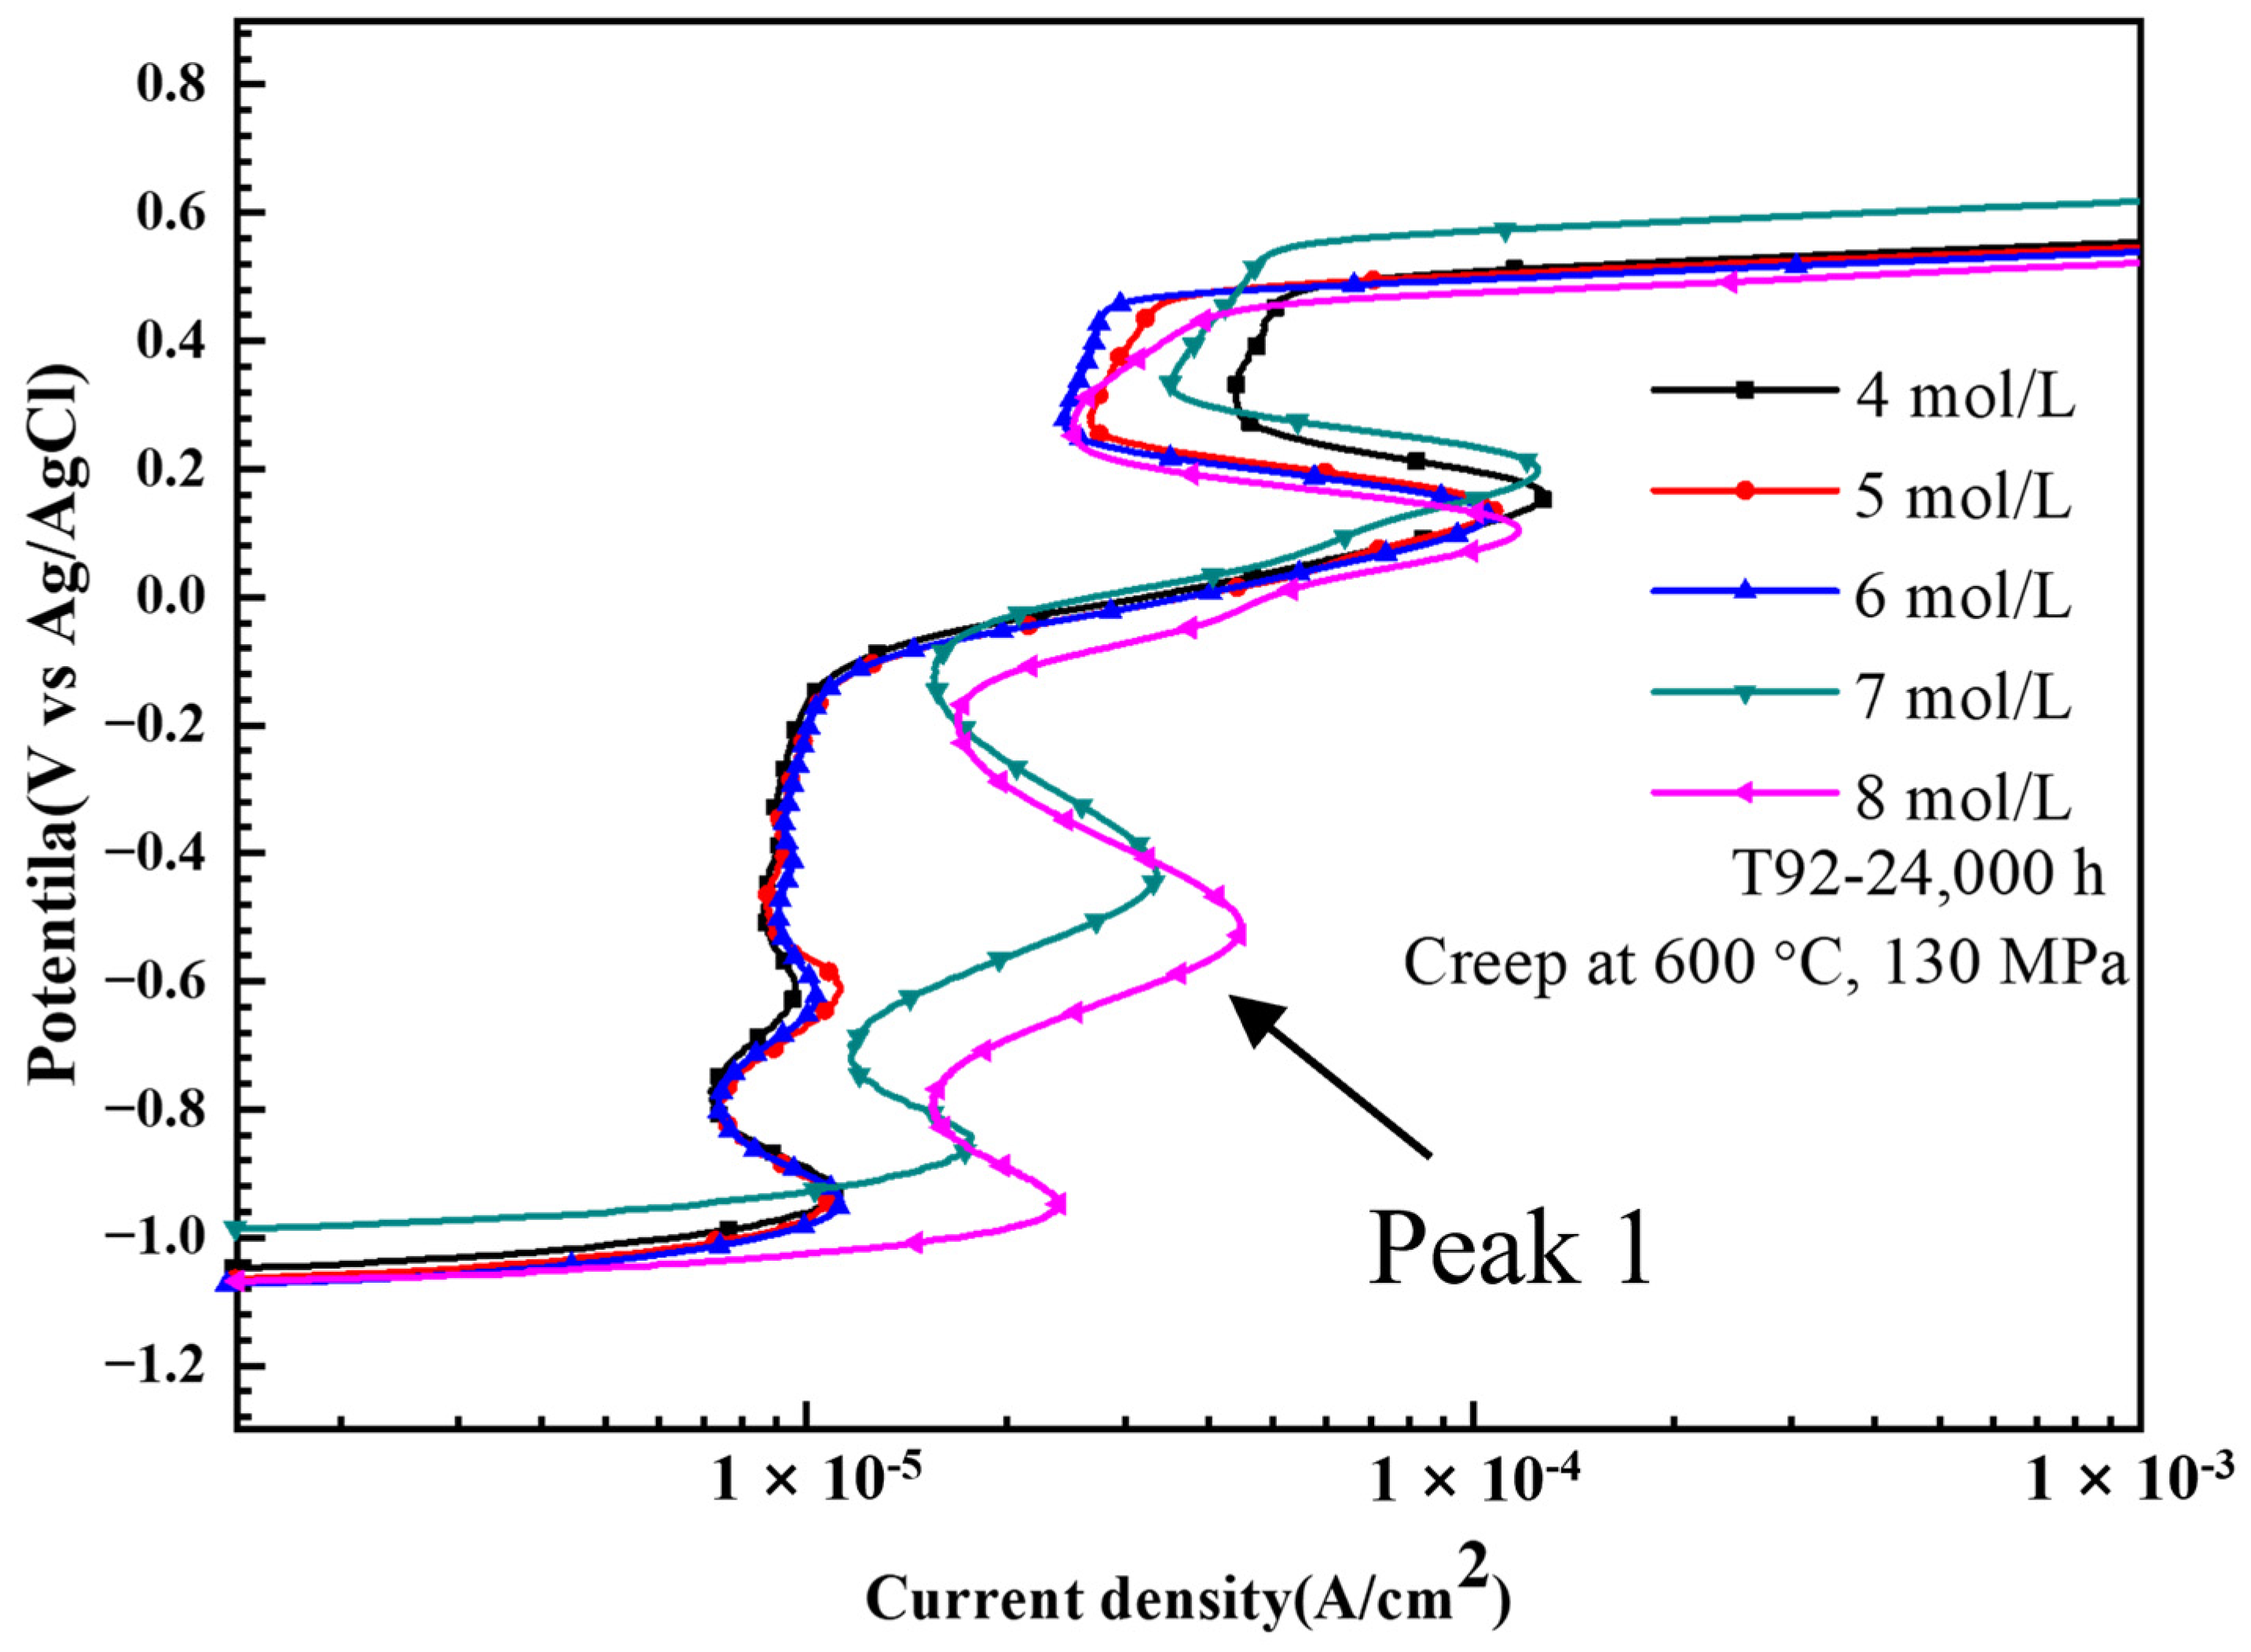
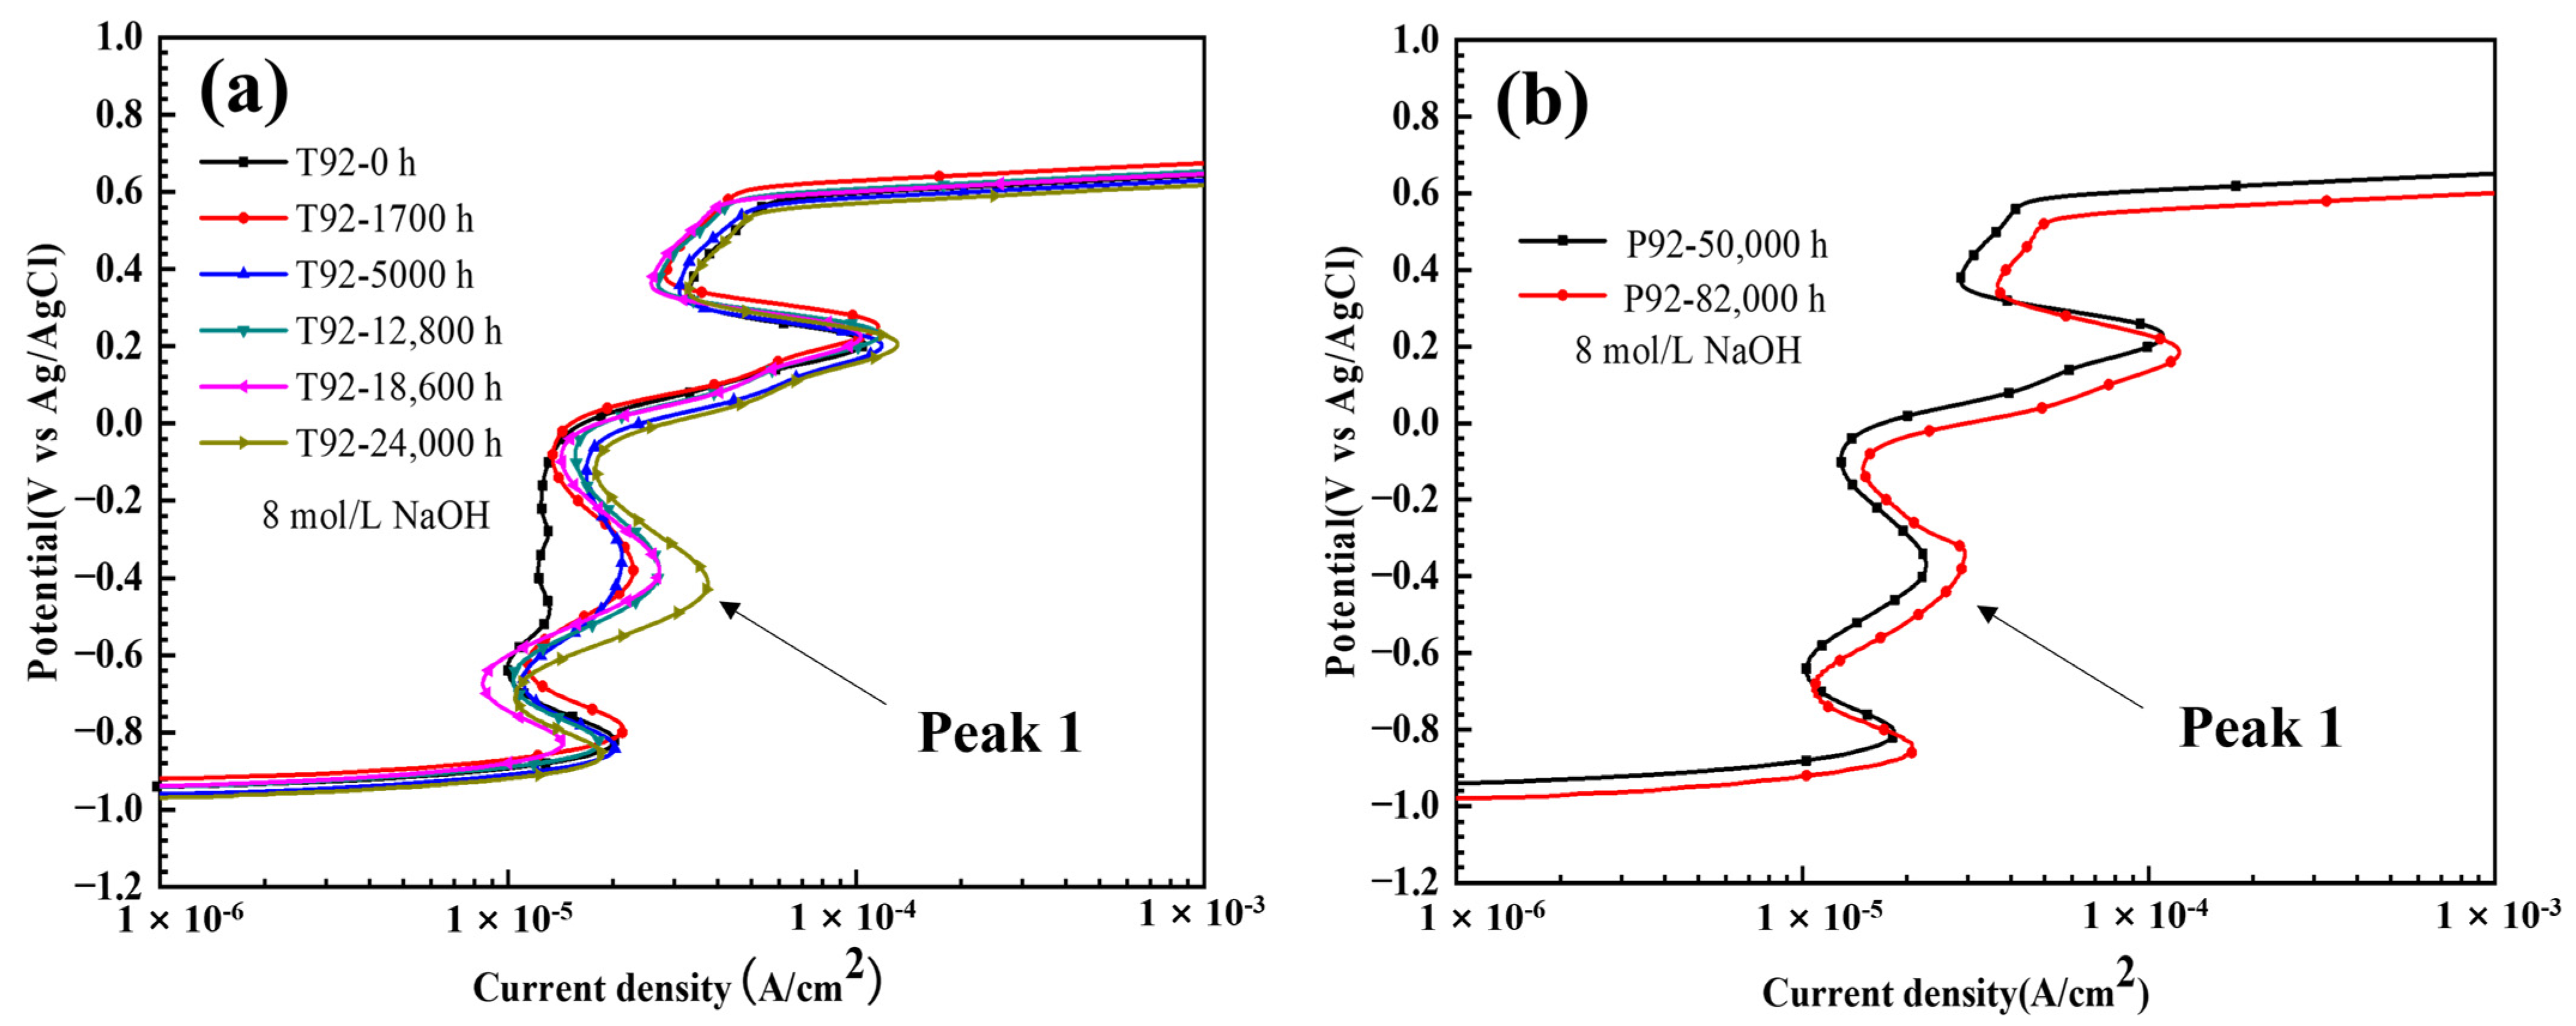
3.2. Quantitative Analysis of Laves Phase Amount by Electrochemical Method

The potentiodynamic polarization curves of T92-24,000 h specimens tested in NaOH solutions of different concentrations (4 mol/L to 8 mol/L) are shown in Figure 8. Two peaks, one at ca. −0.5 V Ag/AgCl and another at ca. 0.2 V Ag/AgCl, were observed on all curves, which were related to the dissolution of the Laves phase and carbides, respectively [11]. The curves are almost passivated in the range of −0.7 to −0.1 V Ag/AgCl until the concentration of NaOH is higher than 7 mol/L, which is consistent with reported results [13]. The morphology changes before and after anodic polarization in an 8 mol/L NaOH solution observed with SEM are shown in Figure 9a,b. It is clear that almost all Laves phase particles were dissolved in the 8 mol/L test. The results confirm that the current peak does correspond to the dissolution of the Laves phase particles [11,13].
Figure 10a,b show the polarization curves of the T92 and P92 specimens with different service times in an 8 mol/L NaOH solution. The dissolution peaks of the Laves phase are observed in all curves in the range of −0.7 to −0.1 V Ag/AgCl, named “peak 1” in the figure. Obviously, the curve of the T92-0 h specimen without the precipitation of the Laves phase exhibits only a very weak peak 1. By integrating the peak 1 current density on each polarization curve with the polarization time, the charge density of the Laves phase in T92 and P92 specimens can be obtained, as shown in Figure 11. With the increase in creep time, the charge density of the Laves phase in T92 specimens shows an increasing trend, which is consistent with the trend obtained by the SEM characterization results, indicating that the Laves phase in T92 samples continuously precipitates during the creep process. Moreover, the charge density of the Laves phase in P92 specimens increases with the service time, but it is smaller than that of the T92-24,000 h specimen, which is consistent with the statistical results of SEM as well.
Figure 12a shows the typical polarization curves of the 9Cr F/M samples with different ageing times in an 8 mol/L NaOH solution. Similar to the data shown in Figure 8, all specimens except the 0 h specimen show an obvious current peak in the range of −0.7 V to −0.1 V Ag/AgCl, and, generally, the current peak height also increases with the increase in the ageing time. The changing density corresponding to Laves phase dissolution with aging time is obtained by integrating the current peak with time, as shown in Figure 12b. As can be seen in the figure, the charge density of the Laves phase continues to increase during the aging process, and it does not reach saturation until 6500 h.

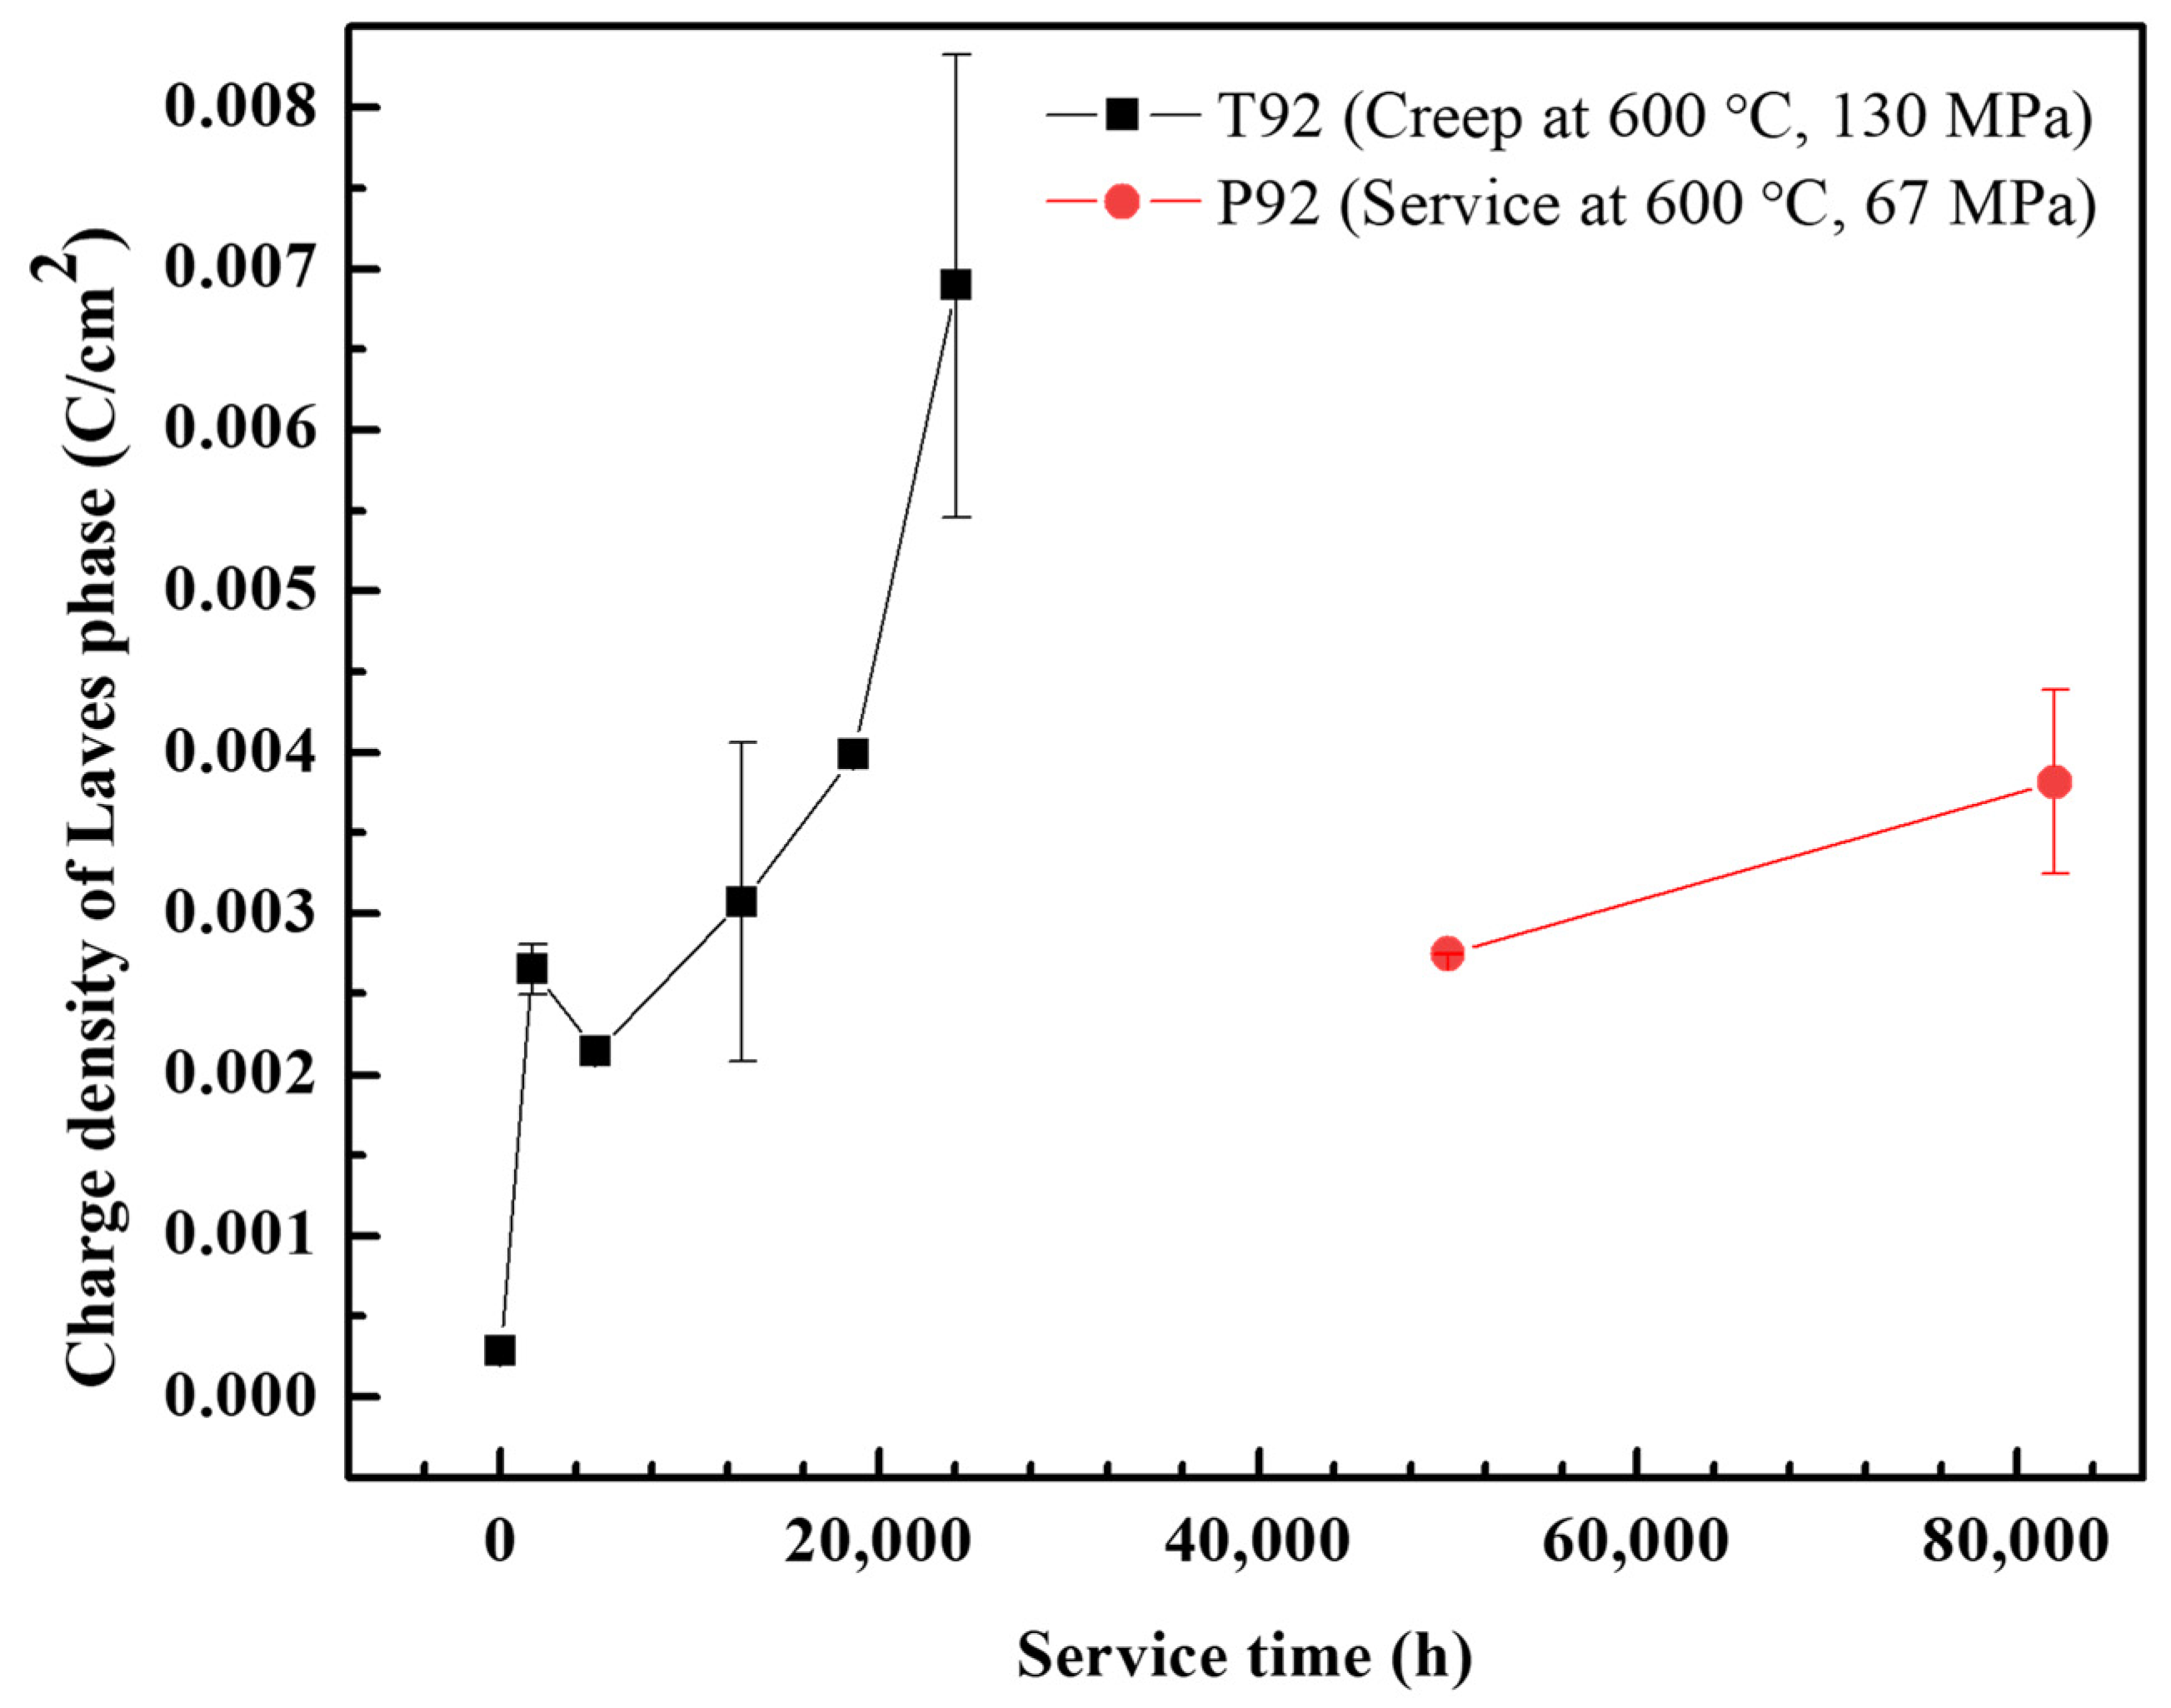
3.3. Correlation between Electrochemical and SEM Data

Since the area fraction of the Laves phase obtained by SEM images and the dissolved charge density obtained by the electrochemical method both reflect the Laves phase content in the specimen, the correlation images of these two parameters are given in Figure 13, and the linear fit of the data is also given in the figure. As shown in Figure 13, the results of the linear fitting are divided into two stages in both T92 and 9Cr F/M samples. In the early stage of creep, the slope rises sharply, which proves that the area grows rapidly with little volume change; meanwhile, in the later period of creep, the slope obviously slows down. The charge density on the horizontal axis represents the volume of Laves phase precipitates, while the area fraction on the vertical axis represents the area of the Laves phase, so the area fraction/charge density (namely the slope on the curve) is positively correlated with the reciprocal of the radius of the Laves phase. Therefore, it can be concluded that the average diameter of the Laves phase precipitated in the beginning is small, and it gradually increases with the creep time while the area fraction remains almost unchanged. This conclusion is consistent with the changing trend of the average diameter of the Laves phase particles obtained from SEM in Figure 3 and Figure 4. In addition, connecting the data of the 50,000 h and 82,000 h specimens of P92, the slope is similar to that of the later stage of creep in T92, which fits with the statistical results of the average diameter in Figure 3c as well.
The above results indicate that the electrochemical method can be used to detect and quantify the Laves phase in other 9% Cr martensitic stainless steels.

4. Discussion

4.1. Creep Life Prediction Based on Laves Phase Content

It is reported that the performance of martensitic heat-resistant steel will degrade during long-term high-temperature service, and the change in its microstructure is mainly manifested as a reduction in dislocation density and the migration of subgrain boundaries. The strengthening mechanisms of 9%Cr heat-resistant steel include precipitated phase strengthening, solid solution strengthening, dislocation strengthening, grain boundary strengthening, etc., which promote each other to hinder dislocation movement and subgrain boundary migration, thus leading to high microstructural thermal stability. For example, the solid solution strengthening of W and Mo atoms is one of the most important strengthening mechanisms of 9% Cr martensitic steels. However, with creep/aging at high temperatures, Laves phase particles will gradually precipitate in 9% Cr martensitic steels. Due to the formation of the Laves phase, the depletion of W and Mo in the matrix reduces the strengthening effect of the solid solution. On the other hand, fine and discrete Laves phase particles can prevent the recovery of martensitic laths and dislocations to improve the creep behavior [1,7,20,21,22,23]. In general, the creep fracture strength increases with the precipitation of the fine Laves phase, reaches a maximum value, and then decreases due to the coarsening of the Laves phase. Therefore, the Laves phase plays a complex role relative to the creep strength of the material during the creep process.
In this work, the dissolved charge density of the Laves phase in the T92/P92 samples was measured by the electrochemical method. At the same time, the number, area fraction, and average diameter of the Laves phase particles in T92/P92 with different creep times were analyzed by SEM. It can be seen from Figure 3b and Figure 11 that the area fraction and dissolved charge density of the Laves phase in T92/P92 tended to increase with time, and the Laves phase content of the P92 sample at 82,000 h had not yet reached the Laves phase content of the T92 fractured sample. Therefore, if the value of a certain parameter in T92 at fracture (i.e., 24,000 h) is used as the basis to determine the occurrence of creep fracture in the material, only the dissolved charge density and area fraction of the Laves phase meet the conditions.
Generally, the creep deformation in metals is usually divided into three stages: the creep rate decreases in the primary creep region, followed by a constant or minimal creep rate in the secondary creep region, and then a rapid increase in the creep rate until fracture during the tertiary creep stage [24]. Since the secondary creep region usually has the longest duration, it is assumed that the P92 sample (50,000 h and 82,000 h) used for the life prediction validation test is in this stage, and the Laves phase content is linearly related to the creep time. Although the composition of T92 and P92 is the same, the parts used are different: one is a pipe (P92) and the other is a tube (T92). Therefore, the creep properties of both materials can be deemed identical. On the other hand, the service temperature of T92 and P92 is the same, and only the stresses are different. The stress in the internal pressure creep test is relatively high, mainly to accelerate the creep failure. In addition, the stress will also promote the formation of the Laves phase. Thus, we try to judge the creep lifetime of the materials through a single variable: the charge density of the Laves phase. This is achieved by extrapolating the data of P92 50,000 h and 82,000 h samples to reach the dissolved charge density value of the T92 fracture sample, as shown in Figure 14a. The relationship between the service time and charge density of the Laves phase can be described by the following linear fitting equation:
Q = 3.31 × 10 8 t 0.0011
where Q represents the charge density of the Laves phase, and t represents the service time. When the charge density reaches the value of the fractured sample (i.e., 0.0069 C/cm2), the creep life is about 241,692 h, which is basically consistent with the design life of 30 years (i.e., 262,800 h) for thermal power plants. The current experimental data show that this variable as the basis can fit the two sets of data well (i.e., the charge density of the Laves phase in internal pressure creep and field materials), which indicates that the charge density of the Laves phase is a promising variable in predicting the residual life of T/P92. It should be pointed out that this method is only a tentative approach at present, due to the limited data points, and we are still in the development stage.
It should be mentioned that although all studies state that the precipitation of the Laves phase has an effect on the creep life of 9%Cr steels, there is no report predicting the service life of materials through some parameters of the Laves phase. As mentioned above, most reports suggest that the fine Laves phase precipitated in the early stage can hinder the dislocation movement of the material, thereby reducing the creep rate, and the coarsening of the Laves phase in the later stage has a harmful effect on the creep performance [9,10]. It can be seen from the data in Figure 3b that the number and average diameter of the Laves phase in P92 samples under creep for 50,000 h and 82,000 h both exceed the corresponding parameter values at T92 fracture. Therefore, these two parameters are not suitable as evaluation criteria for the creep life.
The area fraction of the Laves phase is expected to be used as the evaluation standard. According to the results in Figure 14a, the lifetime prediction of P92 obtained by using the area fraction as the evaluation standard is shown in Figure 14b. The result shows that the expected lifetime of P92 is about 460,000 h, which indicates that using the area fraction as an evaluation criterion will seriously overestimate the lifetime of the material. This is due to the coarsening of the Laves phase in the late stage of creep, which reduces the creep life of the material. It can be seen from Figure 12 that the relationship between the dissolved charge density and the area fraction of the Laves phase is not linear throughout the entire time range but a two-stage linear relationship, and the turning point roughly corresponds to the time point of the coarsening of the Laves phase. The charge density of the Laves phase contains information on the particle size relative to the area fraction, which leads to a more accurate prediction of the creep life. We emphasize that the accuracy of this prediction method is still uncertain due to the few data points available at present. It is suggested to increase the sample size in the next step and establish a more accurate creep life prediction model based on big data.

4.2. Advantages of the Electrochemical Method

The evaluation and prediction of creep life at high temperatures has always been an important topic in the research and development of heat-resistant steel. At present, the traditional life evaluation methods widely used by related industries include the isotherm extrapolation method, time-temperature parameter (TTP) method, and θ-projection method [25,26,27]. However, these methods are based on metallographic and mechanical performance indicators, and service pipes must be cut and tested in the laboratory. This greatly increases the time and economic cost of pipeline inspection. In contrast, the electrochemical method is easily conducted and has the potential to realize in-site detection without cutting the tube, which brings great convenience for steel performance evaluation in operating plants.

5. Conclusions

In this paper, an electrochemical method is used to detect and quantify the Laves phase content in martensitic heat-resistant steel, and a creep life prediction method is proposed based on the relationship between the creep time and the dissolved charge density of the Laves phase. The conclusions are summarized as follows.
(1)
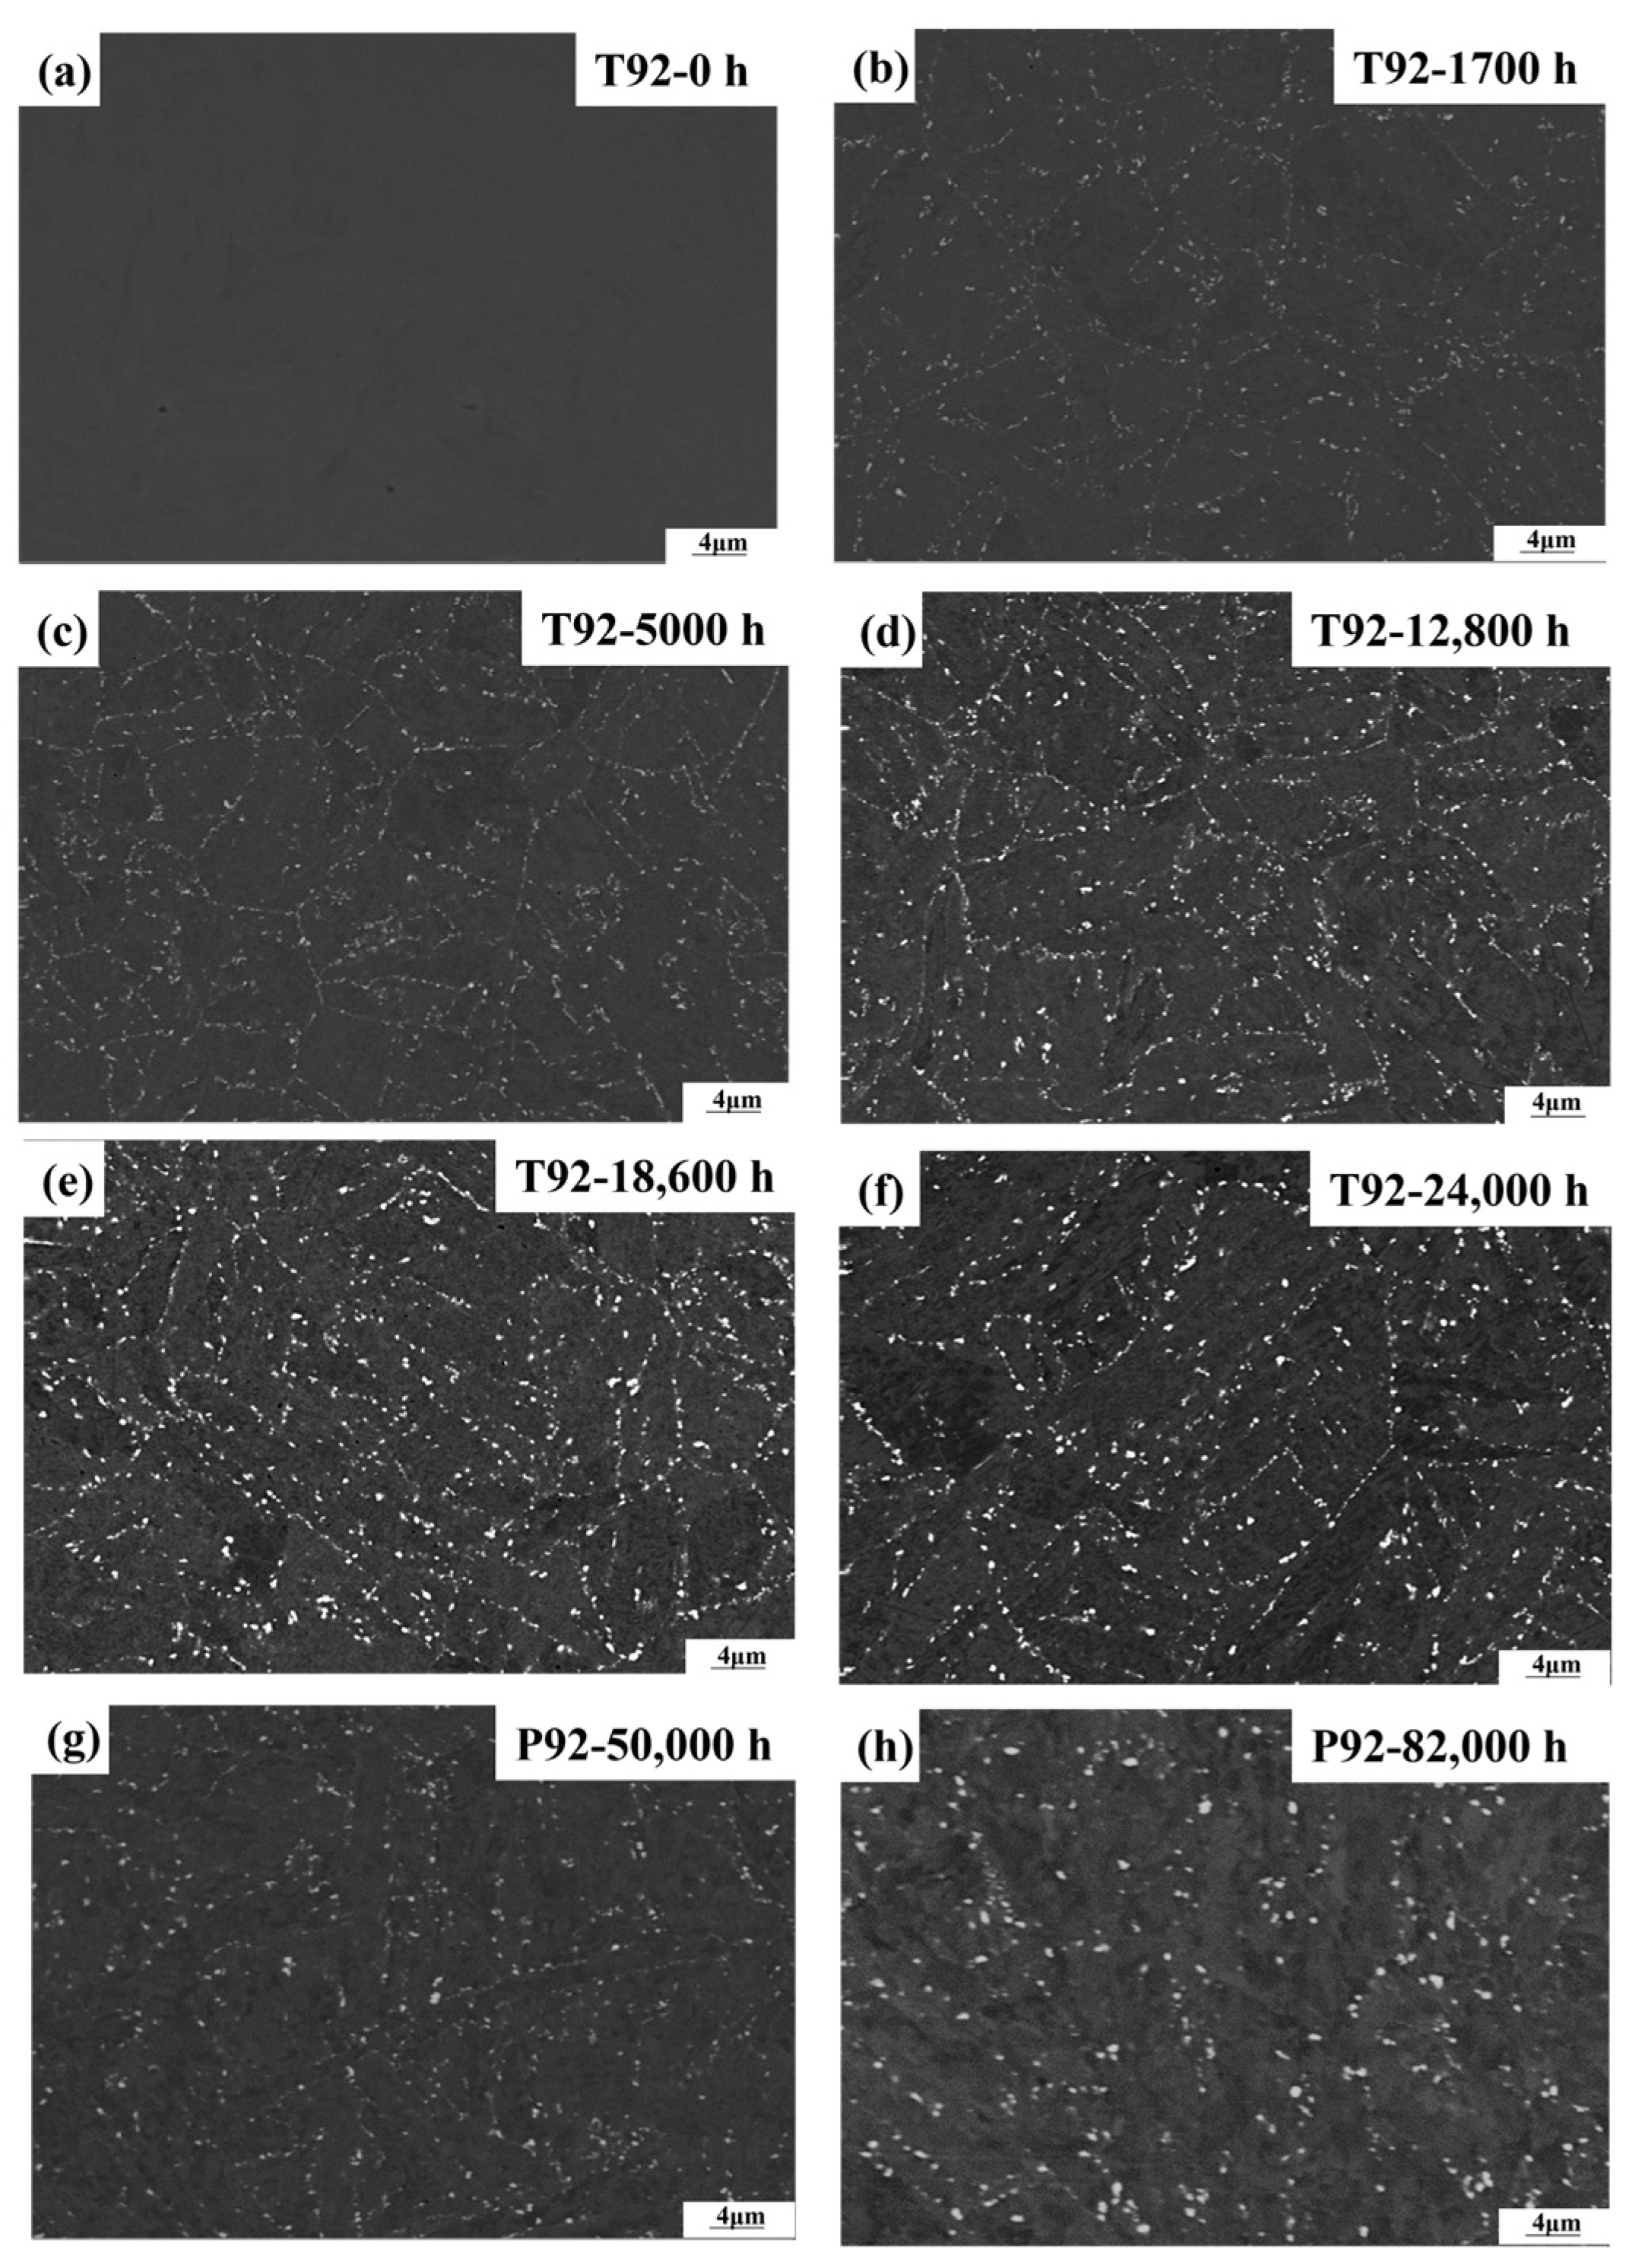
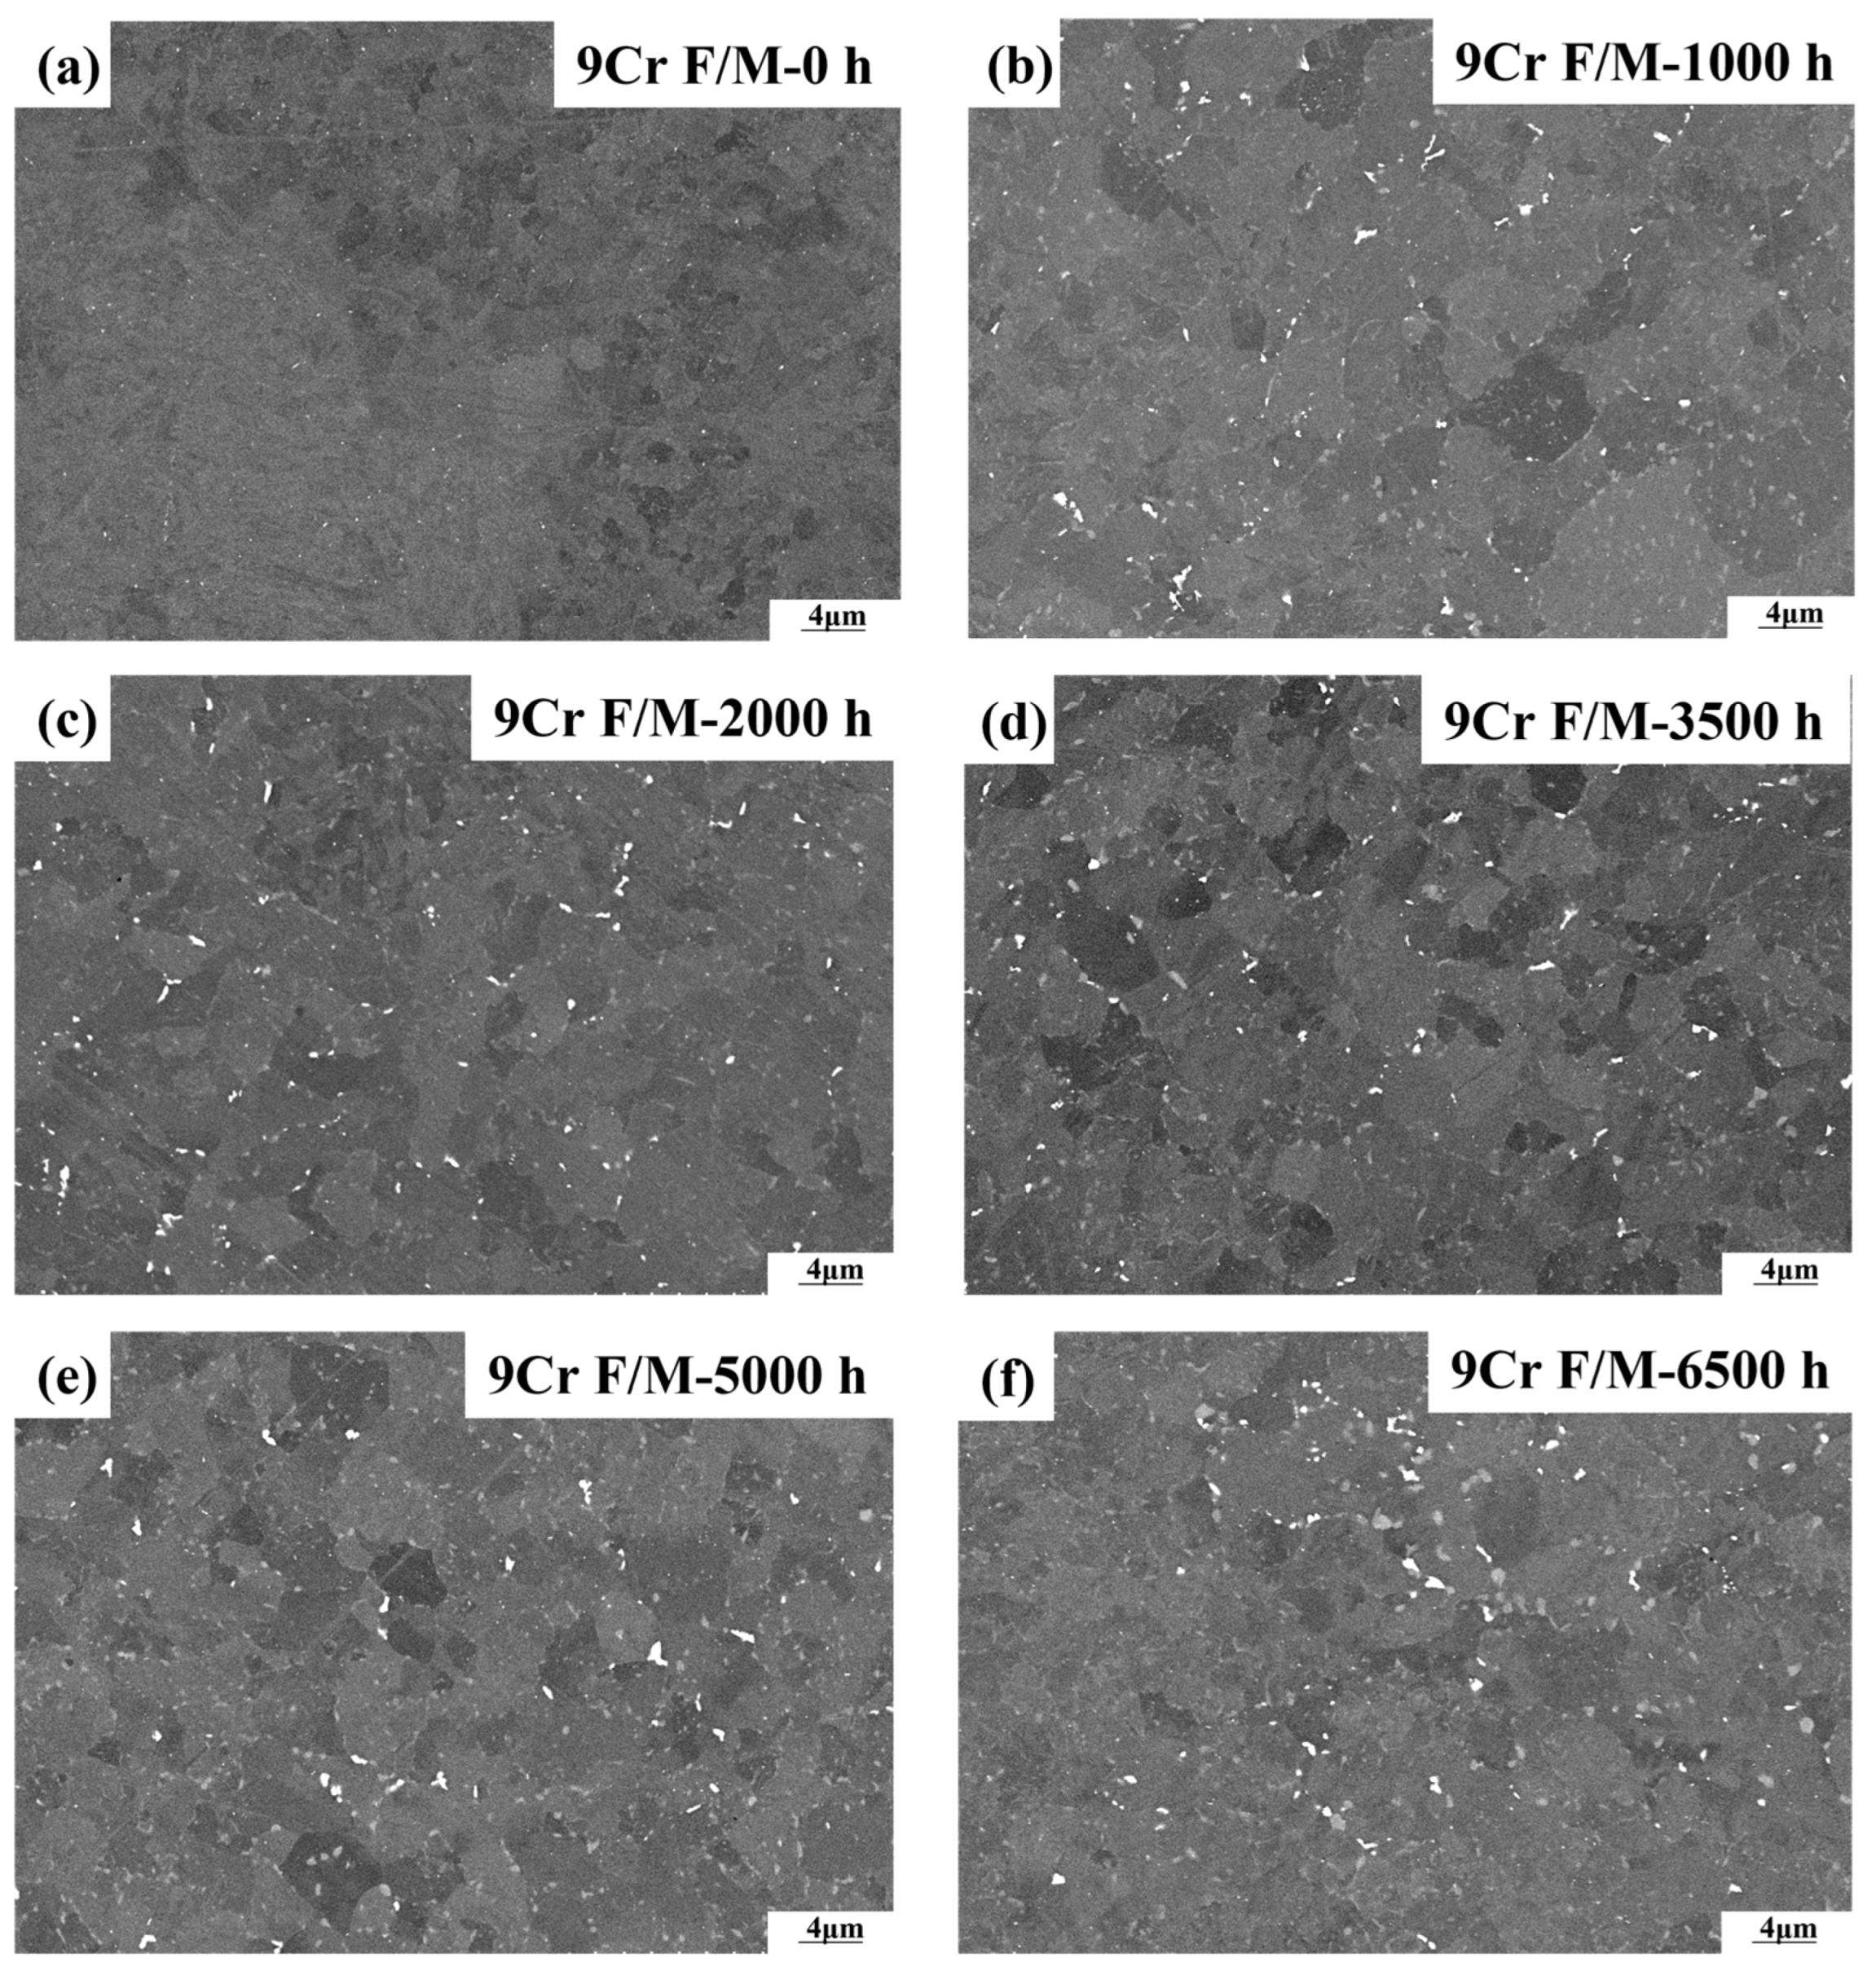
Both T92/P92 samples after creep and 9Cr F/M samples after thermal ageing will precipitate Laves phase particles, and the content of the Laves phase increases with the service time. However, the content of the Laves phase in 9Cr F/M steel (0.54%) is much lower than that in T/P92 steels (4.0%).
(2)
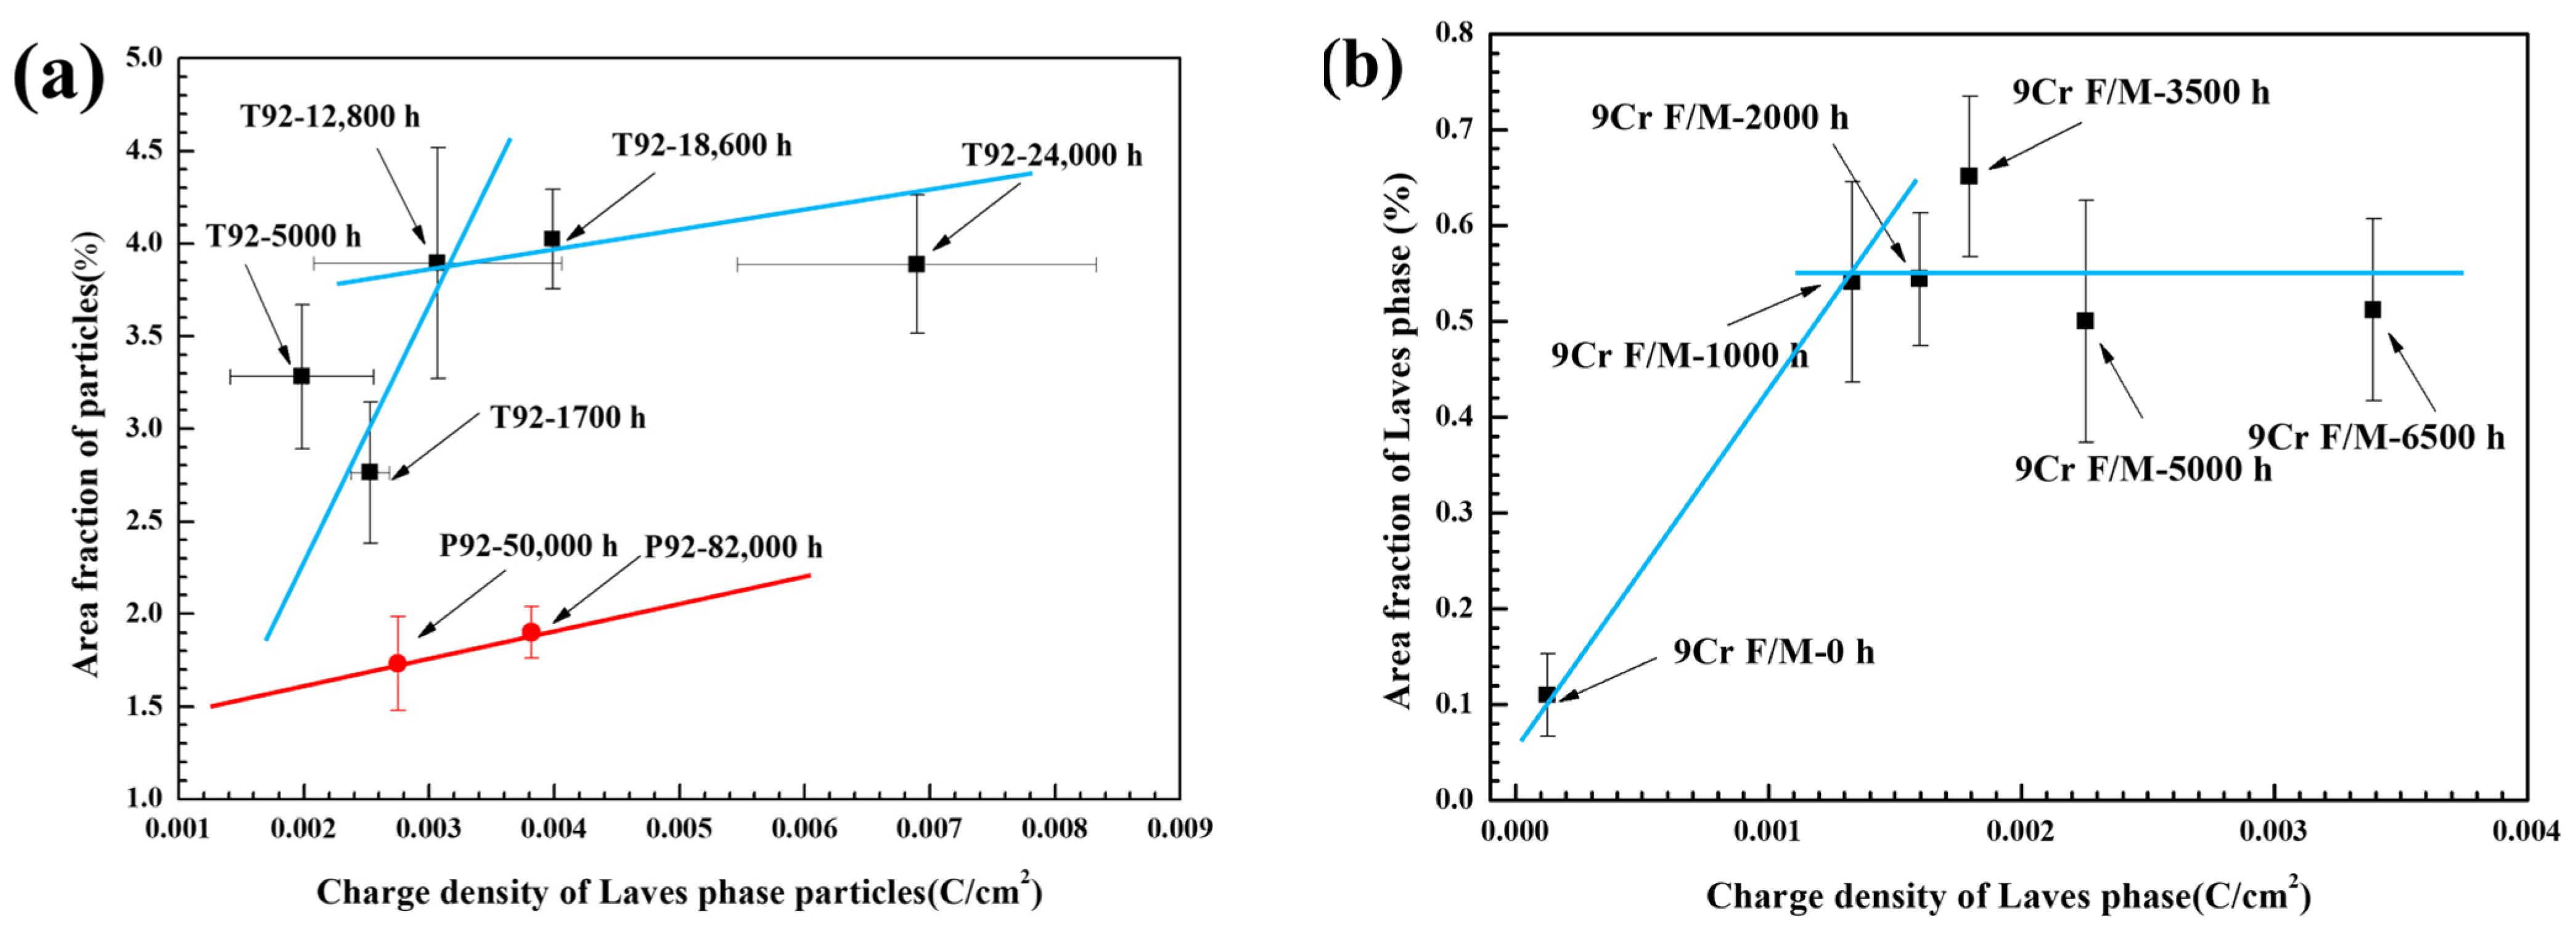
An electrochemical method was used to detect and quantify the Laves phase in T92/P92 steels and 9Cr F/M steel, and the Laves phase in all materials was found to be preferentially dissolved in a strong alkaline solution. The relationship between the area fraction of the Laves phase and the charge density corresponding to the dissolution peak of the Laves phase in all materials shows a similar two-stage linear relationship, which is related to the diameter change of Laves phase particles during creep. The results also demonstrate the general applicability of electrochemical methods for the quantification of Laves phase particles in 9Cr martensitic steel.
(3)
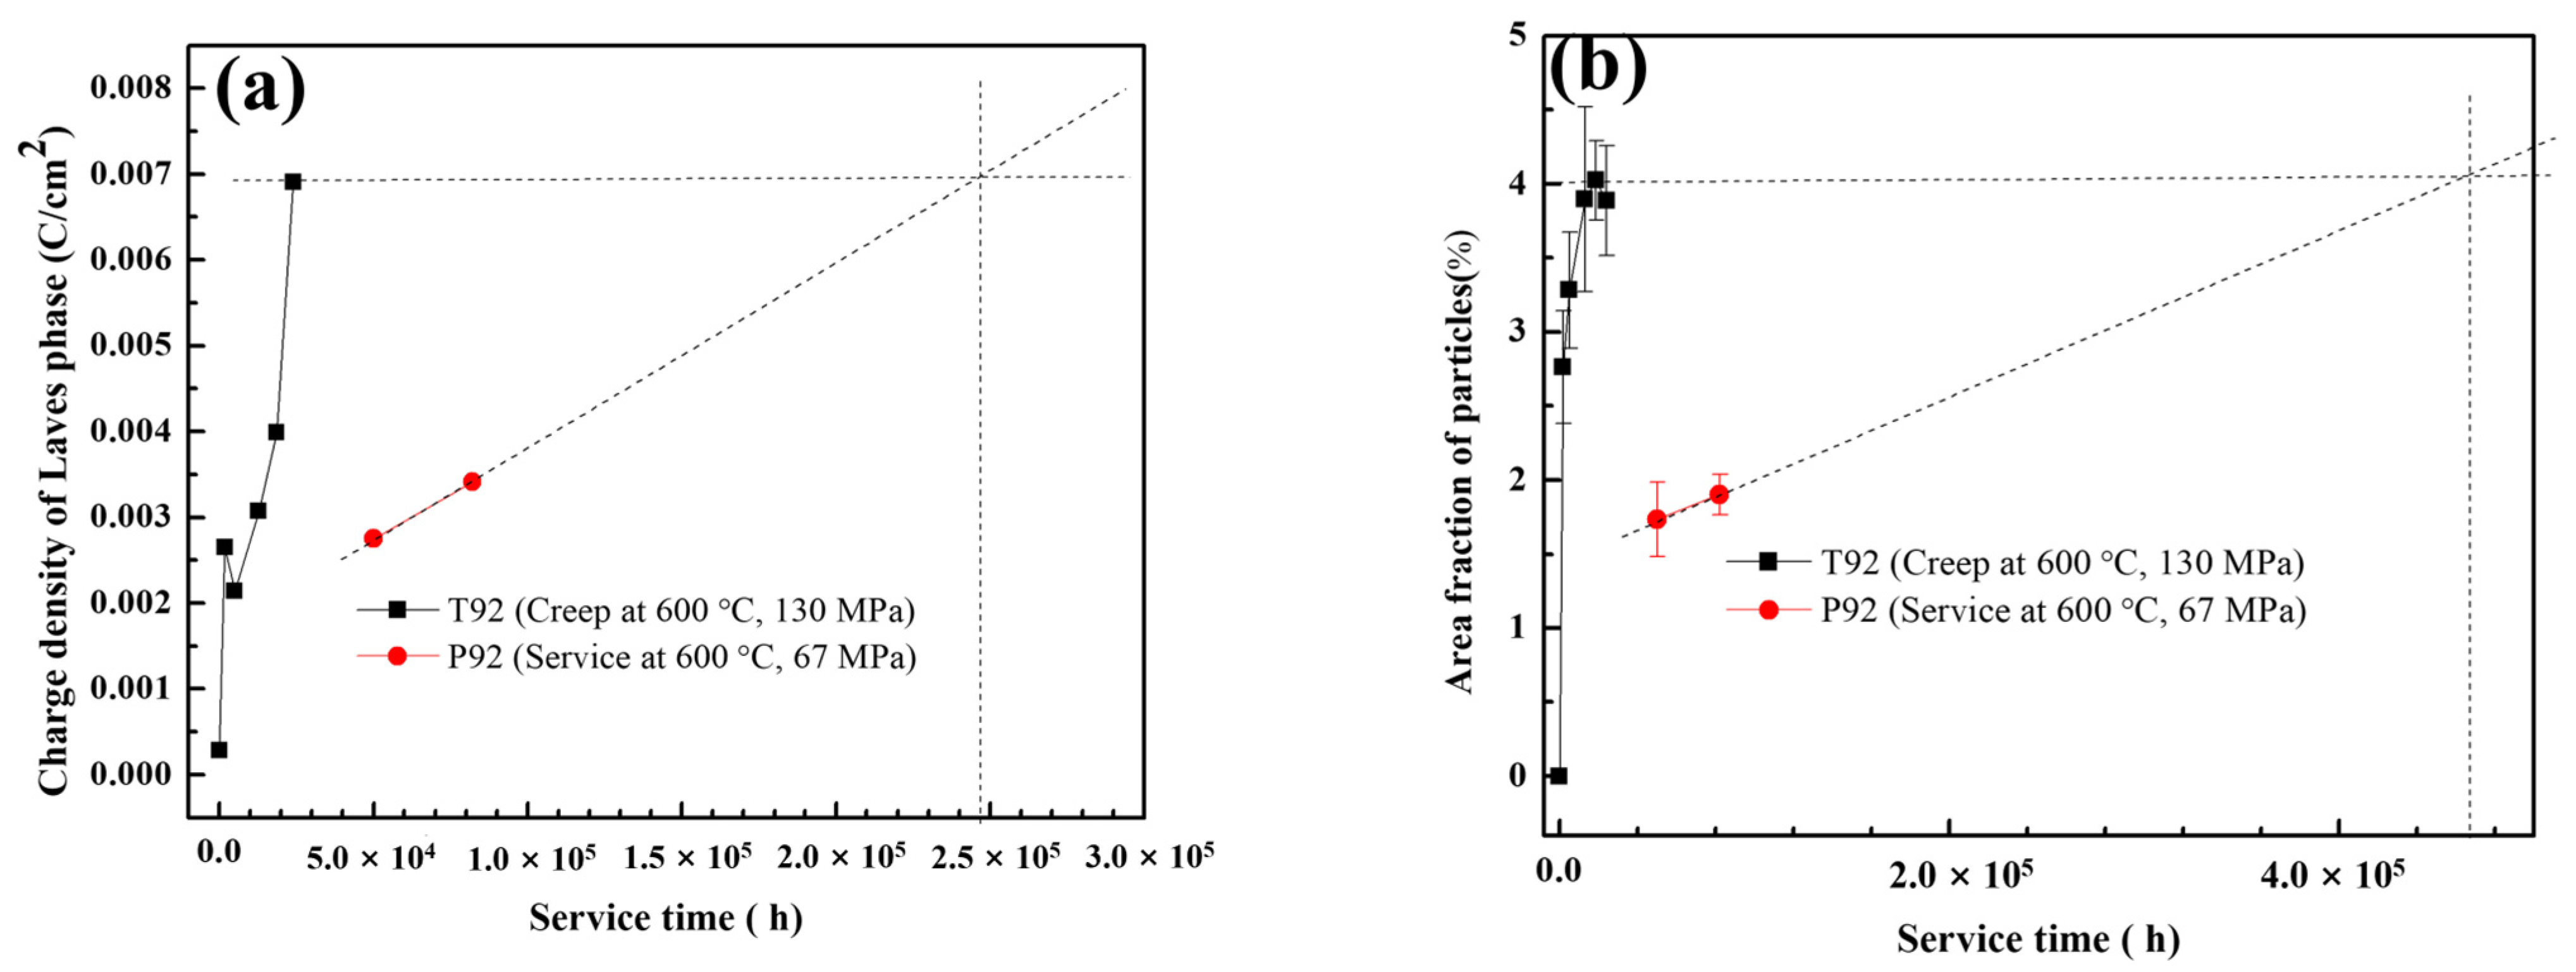
An extrapolation method to predict the residual creep life is proposed based on the correlation between the Laves phase content and creep time. It is found that the creep life of P92 can be predicted more accurately by the Laves phase content obtained by the dissolved charge density than by the area fraction. This may be related to the fact that the dissolved charge density of the Laves phase, relative to the area fraction, also takes into account the particle size information. This method has the potential to evaluate the service state of materials and predict the long-term creep life in the industrial field.

Author Contributions

Conceptualization, S.Y., J.X., J.L. and R.Z.; methodology, S.Y., R.Z. and H.Z.; validation, S.Y., J.L. and J.X.; formal analysis, S.Y. and L.T.; investigation, J.L. and J.X; resources, J.L., Q.G. and J.X; data curation, S.Y.; writing—original draft preparation, S.Y.; writing—review and editing, S.Y., J.L. and J.X.; supervision, J.L. and J.X.; project administration, J.L. and J.X.; funding acquisition, J.L., Q.G. and J.X.; All authors have read and agreed to the published version of the manuscript.

Funding

This research was funded by the Natural Science Basic Research Program of Shaanxi (Program No. 2022JQ-400), the Independent Science and Technology Program of TPRI (TN-21-TYK24), the National Natural Science Foundation of China (51901254, 52001336), the Foundation Research Funds for the Central Universities (19lgpy22), and the Shenzhen Higher Education Stability Support Program (2022A007).

Data Availability Statement

The raw/processed data required to reproduce these findings cannot be shared at this time due to privacy or technical.

Conflicts of Interest

The authors declare no conflict of interest.

References

  1. Di Gianfrancesco, A.; Vipraio, S.T.; Venditti, D. Long Term Microstructural Evolution of 9–12%Cr Steel Grades for Steam Power Generation Plants. Procedia Eng. 2013, 55, 27–35. [Google Scholar] [CrossRef]
  2. Hald, J. Microstructure and long-term creep properties of 9–12% Cr steels. Int. J. Press. Vessel. Pip. 2008, 85, 30–37. [Google Scholar] [CrossRef]
  3. Korcakova, L.J.H.; Somers, M.A.J. Quantification of Laves phase particle size in 9CrW steel. Mater. Charact. 2001, 47, 111–117. [Google Scholar] [CrossRef]
  4. Dimmler, G.; Weinert, P.; Kozeschnik, E.; Cerjak, H. Quantification of the Laves phase in advanced 9–12% Cr steels using a standard SEM. Mater. Charact. 2003, 51, 341–352. [Google Scholar] [CrossRef]
  5. Isik, M.I.; Kostka, A.; Eggeler, G. On the nucleation of Laves phase particles during high-temperature exposure and creep of tempered martensite ferritic steels. Acta Mater. 2014, 81, 230–240. [Google Scholar] [CrossRef]
  6. Hu, P.; Yan, W.; Sha, W.; Wang, W.; Guo, Z.; Shan, Y.; Yang, K. Study on Laves phase in an advanced heat-resistant steel. Front. Mater. Sci. China 2009, 3, 434–441. [Google Scholar] [CrossRef]
  7. Stein, F.; Leineweber, A. Laves phases: A review of their functional and structural applications and an improved fundamental understanding of stability and properties. J. Mater. Sci. 2020, 56, 5321–5427. [Google Scholar] [CrossRef]
  8. Junek, M.; Svobodova, M.; Horvath, J.; Mara, V. The Effect of Long-Term Ageing on Microstructural Properties and Laves Phase Precipitation of Welded P91 and P92 Steels. Steel Res. Int. 2021, 93, 2100311. [Google Scholar] [CrossRef]
  9. Abe, F. Creep rates and strengthening mechanisms in tungsten-strengthened 9Cr steels. Mater. Sci. Eng. A 2001, 319–321, 770–773. [Google Scholar] [CrossRef]
  10. Abe, F. Effect of Fine Precipitation and Subsequent Coarsening of Fe2W Laves Phase on the Creep Defotmation Behavior of Tempered Martensitic 9Cr-W Steels. Mater. Sci. Eng. A 2005, 36, 321–332. [Google Scholar]
  11. Wang, Z.; Xu, J.; Takeda, Y.; Shoji, T.; Watanabe, Y.; Yamashita, M.; Izumi, S. An electrochemical method for detection and quantification of Laves phase in 12Cr martensitic stainless steel. Corros. Sci. 2018, 135, 215–221. [Google Scholar] [CrossRef]
  12. Wang, Z.; Takeda, Y.; Zhong, X.; Shoji, T.; Xu, J.; Watanabe, Y.; Yamashita, M.; Izumi, S. Mechanistic Understanding of the Dissolution Behavior of the Precipitates in 12Cr Martensitic Steel during Potentiodynamic Polarization in Strong Alkaline Solutions. J. Electrochem. Soc. 2020, 167, 141501. [Google Scholar] [CrossRef]
  13. Wu, Y.; Yuan, S.; Yan, J.; Liu, J.; Nong, J.; Guo, Q.; Xu, J. Dissolution Behaviour of Laves Phase in P92 High Alloy Steel in Alkaline Solutions. J. Electrochem. Soc. 2021, 168, 031505. [Google Scholar] [CrossRef]
  14. Schneider, A.; Inden, G. Simulation of the kinetics of precipitation reactions in ferritic steels. Acta Mater. 2005, 53, 519–531. [Google Scholar] [CrossRef]
  15. Panait, C.G.; Bendick, W.; Fuchsmann, A.; Gourgues-Lorenzon, A.F.; Besson, J. Study of the microstructure of the Grade 91 steel after more than 100,000 h of creep exposure at 600 °C. Int. J. Press. Vessel. Pip. 2010, 87, 326–335. [Google Scholar] [CrossRef]
  16. Prasad, S.; Rajkumar, V.B.; Hari Kumar, K.C. Numerical simulation of precipitate evolution in ferritic–martensitic power plant steels. Calphad 2012, 36, 1–7. [Google Scholar] [CrossRef]
  17. Xu, Y.; Nie, Y.; Wang, M.; Li, W.; Jin, X. The effect of microstructure evolution on the mechanical properties of martensite ferritic steel during long-term aging. Acta Mater. 2017, 131, 110–122. [Google Scholar] [CrossRef]
  18. Golpayegani, A.; Andrén, H.-O.; Danielsen, H.; Hald, J. A study on Z-phase nucleation in martensitic chromium steels. Mater. Sci. Eng. A 2008, 489, 310–318. [Google Scholar] [CrossRef]
  19. Cipolla, L.; Danielsen, H.K.; Venditti, D.; Di Nunzio, P.E.; Hald, J.; Somers, M.A.J. Conversion of MX nitrides to Z-phase in a martensitic 12% Cr steel. Acta Mater. 2010, 58, 669–679. [Google Scholar] [CrossRef]
  20. Hald, J. Metallurgy and creep properties of new 9–12%Cr steels. Steel Res. 1996, 67, 369–374. [Google Scholar] [CrossRef]
  21. Lee, J.S.; Armaki, H.G.; Maruyama, K.; Muraki, T.; Asahi, H. Causes of breakdown of creep strength in 9Cr–1.8W–0.5Mo–VNb steel. Mater. Sci. Eng. A 2006, 428, 270–275. [Google Scholar] [CrossRef]
  22. Aghajani, A.; Richter, F.; Somsen, C.; Fries, S.G.; Steinbach, I.; Eggeler, G. On the formation and growth of Mo-rich Laves phase particles during long-term creep of a 12% chromium tempered martensite ferritic steel. Scr. Mater. 2009, 61, 1068–1071. [Google Scholar] [CrossRef]
  23. Maddi, L.; Deshmukh, G.S.; Ballal, A.R.; Peshwe, D.R.; Paretkar, R.K.; Laha, K.; Mathew, M.D. Effect of Laves phase on the creep rupture properties of P92 steel. Mater. Sci. Eng. A 2016, 668, 215–223. [Google Scholar] [CrossRef]
  24. Samuel, E.I.; Choudhary, B.K.; Palaparti, D.P.R.; Mathew, M.D. Creep Deformation and Rupture Behaviour of P92 Steel at 923K. Procedia Eng. 2013, 55, 64–69. [Google Scholar] [CrossRef]
  25. Orr, R.L.; Sherby, O.D.; Dorn, J.E. CORRELATIONS OF RUPTURE DATA FOR METALS AT ELEVATED TEMPERATURES. Available online: https://www.osti.gov/servlets/purl/4425999 (accessed on 12 November 2023).
  26. Bråthe, L. Estimation of kachanov parameters and extrapolation from isothermal creep rupture data. Int. J. Mech. Sci. 1978, 20, 617–624. [Google Scholar] [CrossRef]
  27. Evans, R.W.; Wilshire, B. Creep of Metals and Alloys; IMM North American Publishing Center: Brookfield, VT, USA, 1985. [Google Scholar]
Figure 1. SEM images of the T92 specimens after creep tests at 600 °C, 130 MPa and P92 specimens after service at 600 °C, 67 MPa for different times under the backscattered electron mode. (a) T92-0 h, (b) T92-1700 h, (c) T92-5000 h, (d) T92-12,800 h, (e) T92-18,600 h, (f) T92-24,000 h, (g) P92-50,000 h, and (h) P92-82,000 h.
Crystals 13 01600 g001
Figure 2. Elemental distribution of T92 specimen after 24,000 h of creep at 600 °C, 130 MPa, measured by EPMA. An SEM BSE mode image is also given ahead of the element mapping.
Crystals 13 01600 g002
Figure 3. The (a) number, (b) area fraction, and (c) average diameter of the Laves phase particles per area of the T92 samples after creep at 600 °C, 130 MPa and P92 specimens after service at 600 °C, 67 MPa with different service times. The scatter bars in the figure indicate the standard deviation of the data.
Crystals 13 01600 g003
Figure 4. The TEM images of the microstructure of (a) T92 specimen with creep ageing for 5000 h at 600 °C, 130 MPa; (b) 9Cr F/M specimen after ageing at 650 °C for 5000 h. The major elemental composition (at.%) of the two precipitates is also given in the figure.
Crystals 13 01600 g004
Figure 5. SEM images of the 9Cr F/M specimens after ageing at 650 °C for different times under the backscattered electron mode. (a) 9Cr F/M-0 h, (b) 9Cr F/M-1000 h, (c) 9Cr F/M-2000 h, (d) 9Cr F/M-3500 h, (e) 9Cr F/M-5000 h, (f) 9Cr F/M-6500 h.
Crystals 13 01600 g005
Figure 6. The (a) number, (b) area fraction, and (c) average diameter of the Laves phase particles per area of the 9Cr F/M samples after ageing at 650 °C with different times. The scatter bars in the figure indicate the standard deviation of the data.
Crystals 13 01600 g006
Figure 7. The size dispersion of the Laves phase in 9Cr F/M specimens after ageing at 650 °C with different times. (a) 9Cr F/M-0 h, (b) 9Cr F/M-1000 h, (c) 9Cr F/M-2000 h, (d) 9Cr F/M-3500 h, (e) 9Cr F/M-5000 h, (f) 9Cr F/M-6500 h.
Crystals 13 01600 g007
Figure 8. The potentiodynamic polarization curves of the T92 specimen after 24,000 h of creep at 600 °C, 130 MPa.
Crystals 13 01600 g008
Figure 9. The morphologies of the polished specimens with 24,000 h creep at 600 °C, 130 MPa (a) before and (b) after anodic polarization in an 8 mol/L NaOH solution.
Crystals 13 01600 g009
Figure 10. The polarization curves of the (a) T92 specimens after creep at 600 °C, 130 MPa and (b) P92 specimens after service at 600 °C, 67 MPa with different times in an 8 mol/L NaOH solution. Peak 1 marked in the figure is believed to be caused by the dissolution of the Laves phase.
Crystals 13 01600 g010
Figure 11. The corresponding quantity of electric charge per unit area of Peak 1 (Q) in the polarization curves of specimens with different service times in an 8 mol/L NaOH concentration.
Crystals 13 01600 g011
Figure 12. (a) The polarization curves of the 9Cr F/M samples after ageing at 650 °C with different times in an 8 mol/L NaOH solution; (b) the charge density corresponding to Laves phase dissolution calculated by the integration of the dissolution peak shown in (a).
Crystals 13 01600 g012
Figure 13. The correlation of the area fraction data acquired with SEM images and the Q data acquired with the electrochemical tests. (a) T92 specimens after creep at 600 °C, 130 MPa and P92 specimens after service at 600 °C, 67 MPa; (b) 9Cr F/M specimens after ageing at 650 °C.
Crystals 13 01600 g013
Figure 14. (a) Area fraction and (b) charge density of Laves phase in T92 specimens after creep at 600 °C, 130 MPa and P92 specimens after service at 600 °C, 67 MPa with different times and lifetime prediction.
Crystals 13 01600 g014
Table 1. The chemical compositions of the materials used in this study (wt.%).
MaterialFeCrWMoCSiMnVNb
T92/P92Bal.8.561.920.390.120.180.380.190.07
9Cr F/MBal.8.501.460.231.810.600.200.10
Table 2. Sample information of internal pressure creep tested T92.
No.StatusTime (h)Creep Life Loss (%)
1as-received00
2creep interrupt sample17007
3creep interrupt sample500020
4creep interrupt sample12,80053
5creep interrupt sample18,60077
6creep fracture sample24,000100
Disclaimer/Publisher’s Note: The statements, opinions and data contained in all publications are solely those of the individual author(s) and contributor(s) and not of MDPI and/or the editor(s). MDPI and/or the editor(s) disclaim responsibility for any injury to people or property resulting from any ideas, methods, instructions or products referred to in the content.

