Abstract
According to statistics, 80% of failed components in mechanical equipment are caused by various types of wear and corrosion. Therefore, in order to reduce material loss, research on wear-resistant materials is urgent. In order to solve the difficulty of directly observing the infiltration process of liquid metal in preform, this study first conducted infiltration experiments on liquid metal in ZTA ceramic particle preform at different pouring temperatures, and then used Fluent software to numerically simulate the infiltration behavior of liquid metal in preform. By changing parameters such as pouring temperature and infiltration pressure, the influence of these parameters on the penetration depth of liquid metal in prefabricated structures was determined. The research results indicate that when the pouring temperatures are 1420 °C, 1570 °C, 1720 °C, and 1870 °C, the infiltration depths are 4 mm, 8 mm, 11 mm, and 15 mm; when the casting infiltration pressures are 7620 Pa, 15,240 Pa, 22,860 Pa, and 30,480 Pa, the infiltration depths are 10 mm, 16 mm, 20 mm, and 22 mm. The simulation results of the pouring temperature on the infiltration depth are basically consistent with the experimental results.
1. Introduction
Over the past few decades, metal matrix composites (MMCs) have developed into engineering materials with wide applications in multiple fields, with huge commercial scales in various markets [1,2,3,4,5]. Metal matrix composites are generally composed of ceramic strengthening phases (mainly SiC, Al2O3, B4C, TiC, NbC, TaC, TiB2, and WC, etc.) and metal matrix composition (main components are Al, Mg, Ni, Cu, Fe, and Ti, etc. [6,7,8,9,10,11]). Zirconia toughened alumina (ZTA) has a high strength and toughness, making it a good choice for enhancing particles [10]. In the production of millimeter-level particle-reinforced metal matrix composites, the casting infiltration method can uniformly disperse the ceramic particles in the metal matrix and can produce various forms of preforms as required and install them in jobs that are easily damaged by friction [12,13,14]. At the same time, the overall fraction of ceramic particles in the composite area can reach more than 50%, so it has become the main production process for the production of ceramic particle-reinforced metal matrix composites at home and abroad. Scholars at home and abroad have conducted a lot of research on infiltration behavior. V A. Dutka [15] proposed a numerical model for porous preforms that infiltrate ceramic materials during sintering. The mathematical model of infiltration is based on the Richards equation and Van Genuchten formula that describe the porous structure and permeability of a penetrant. Guan et al. [16] investigated the infiltration of liquid metal into fiber preforms. The results show that the infiltration rate increases with an increase in infiltration pressure, but the increasing range decreases gradually. The fine pores in the composite can be eliminated by increasing the osmotic pressure. Orbulov [17] et al. made Al/Al2O3 composites by impregnating porous Al2O3 preform with pure Al under different pressures in an argon atmosphere and found that the infiltration quality and comprehensive performance of the composites improved with the increase in pressure. Guo et al. [18] implemented a pore-scale, non-isothermal, two-phase flow numerical model based on high-resolution, three-dimensional (3D) computed microtomography (μCT) images of porous silicon carbide particulate-reinforced composite (SiCp) preforms. This model describes the evolution of the flow displacement pattern as the displacement velocity decreases during the infiltration process. The simulation method was performed by coupling the Cahn–Hilliard phase field and heat equations using a robust finite element solver. Du et al. [19] utilized finite element analysis to simulate the mold filling process for zirconia toughened high-chromium composites, employing a porous medium model for flow phenomena and solving multiphase flow and heat equations. Comparing simulations with experiments led to the identification of optimal parameters and gating system designs. German et al. [20] investigated the infiltration process of A356 aluminum alloy foam under vacuum pressure, examining how preform geometry, system pressure, and filling time interrelate. Utilizing Flow 3D for simulations, they identified optimal pressures and vacuum durations for defect-free aluminum foam production. Experiments with NaCl preforms validated the simulations, yielding high-quality foam with varying pore sizes, uniform interconnectivity, and consistent porosity. Previous work has rarely discussed the direct observation of the infiltration process of prefabricated bodies, so this article will establish a model that can simulate the infiltration and solidification process to simulate the process of composite material casting.
In this paper, the experimental results of the liquid-metal infiltration in the preform containing ZTAP at different pouring temperatures is presented. A model simulating the infiltration behavior of liquid metal in preform is developed. Finally, the influence of pouring temperature and infiltration pressure on the penetration depth of liquid metal in prefabricated structures is determined.
2. Experimental Methods and Results
The fabrication of Zirconia Toughened Alumina Particle (ZTAP)/High Chromium Cast Iron (HCCI) composites is delineated through two pivotal processes: Firstly, the synthesis of porous ZTA preforms necessitates the permeation of molten high-chromium cast iron into the interstices of porous ceramic substrates. Within the ambit of ZTA preform preparation, particles boasting an equivalent diameter ranging from 1 to 3 mm were deployed as the reinforcement phase, whilst high-chromium cast iron was adjudicated as the matrix substance. Concurrently, a quantity equating to 55% by weight of a fine powder was discretely introduced into the milling apparatus and amalgamated with ZTA ceramic particulates. Subsequent to this, a 6% mass fraction of sodium silicate binder (Na2O·nSiO2·nH2O) was integrated into the amalgam, culminating in the formation of a hexahedral entity measuring 40 × 50 mm. The last step entailed the positioning of the crafted preform within a microwave oven for sintering at a temperature of 65 °C.
HCCI (High Chromium Cast Iron) is heated to a molten state using an intermediate frequency induction melting furnace, and then the molten metal is poured into the mold cavity. The metal liquid smoothly infiltrates into the ceramic preform through the gaps and completely fills the ceramic preform. Furthermore, it is held in the sand mold for 24 h to obtain ZTAP-reinforced HCCI-based composite materials.
When studying the infiltration of liquid metal in the ceramic particle preform, in order to correspond to the two-dimensional model of the numerical simulation experiment, exclude other factors, and produce a better sampling analysis, the preform is selected. Buried in the sand mold, only one face is left facing the cavity so that the molten metal can only infiltrate the preform from this face. The schematic diagram of the placement of the preform in the cavity is shown in Figure 1. The next process is the melting process of the alloy. After the melting metal liquid was poured into the pouring bag, pouring was performed at 1420 °C, 1570 °C, 1720 °C, and 1870 °C. The casting pressure can be controlled by different pouring heights, that is, using different static pressure heads to obtain different static pressures and using these static pressures as the pressures during pouring. This section aims to verify the accuracy of the numerical simulation of the infiltration behavior of liquid metal in ceramic particle preforms. The experimental materials and conditions are consistent with the material properties and process parameters set in the simulation process.
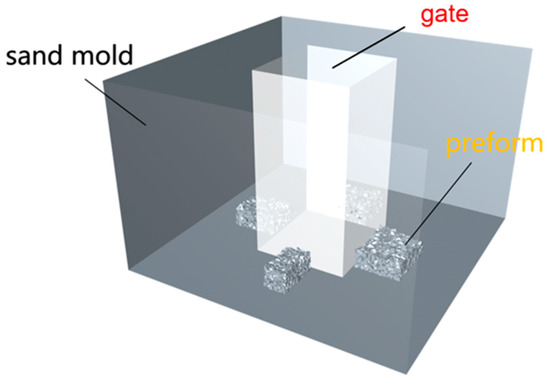
Figure 1.
Schematic illustration of position of preform in cavity.
The process involves crushing the sand mold, removing the casting, and then cutting along the surface connecting the metal liquid and the prefabricated body to obtain ZTAP/HCCI Composites. Measurements are taken from the infiltration surface and several values with the highest average infiltration depth are taken. From Figure 2, it can be seen that under experimental conditions, as the pouring temperature increases, the infiltration depth of liquid metal in the prefabricated body becomes deeper.

Figure 2.
The actual infiltration of liquid metal in the preform at different pouring temperatures: (a–d) are the actual pouring temperatures of 1420 °C, 1570 °C, 1720 °C, and 1870 °C, respectively.
Figure 3 shows the infiltration depth of liquid metal in the preform under actual conditions. After the experiment, the maximum infiltration depth of high-chromium cast iron was measured using a ruler. The results obtained were as follows: at pouring temperatures of 1420 °C, 1570 °C, 1720 °C, and 1870 °C, the depths of liquid metal penetration into the preform were 4.5 mm, 7.6 mm, 11 mm, and 14 mm, respectively.

Figure 3.
The infiltration depth of liquid metal in preforms.
3. Mathematical Models
This article describes numerical simulation in the filling and solidification process of ZTA ceramic particle-reinforced high-chromium cast iron matrix composites prepared by a casting infiltration method.
3.1. Macroscopic Temperature Field
In the numerical model, the Fourier–Kirchhoff equation is used to represent the heat transfer, and a coordinate system is established with a certain point on the casting as the origin [21,22,23].
where is the specific heat capacity of the material; ρ is the fluid density; is the thermal conductivity. These three parameters are closely related to the temperature T. [24]. Q is the heat source within the casting. When the casting temperature is higher than the liquidus temperature or lower than the solidus temperature, Q = 0, when the temperature is also between the solidus and the liquidus [25].
where L is the latent heat and is the solid fraction of metal.
3.2. Macroscopic Flow Field
During the filling and solidification process of the casting, the change process will not affect the increase or decrease in the mass, and the mass remains constant throughout the process, so it can be described by the fluid mechanics continuity equation. For incompressible fluids, the continuity equation is
The momentum conservation equation is as follows [20].
where , and are the components of the velocity in the three directions of , and , respectively; , and are the accelerations in the three directions of , and , respectively; is the fluid kinematic viscosity; t is time; p is pressure; and is thermal conductivity.
3.3. Turbulence
A variant of the k-ε model was developed by Yakhot and Orszag [26] using the renormalization group (RNG) method, in which the smallest motion scales are systematically removed. This model was subsequently modified by Yakhot et al. [27]. Turbulent viscosity is expressed as
where k is the turbulent kinetic energy, ε, for the turbulent dissipation rate.
The turbulent production term P is defined as
Model coefficients take the following default values:
Cμ = 0.085, C1 = 1.42, C2 = 1.68, Ck = 0.7179, στ = 0.7179, k = 0.4
3.4. Model Construction of Particle-Reinforced Metal Matrix Composites Preform
Currently, the latest geometric method for generating polyhedral mesoscopic structures is based on an algorithm utilizing Voronoi diagrams, as illustrated in Figure 4. The particle model produced by this method exhibits properties closely resembling an actual particle model: all regions of the model (or particles) within the Thyssen polygon consist of a convex polyhedron and voids [28].
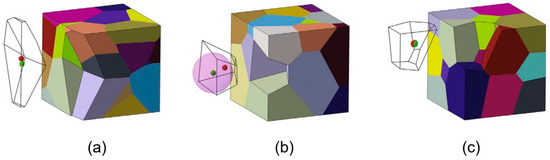
Figure 4.
Voronoi graphics generated by different seeds: (a) Random germs approach. (b) Hardcore germs with hardcore radius 0.15. (c) Centroidal Voronoi tessellation which enforces that germs and geometrical midpoints of the Voronoi cells coincide [28].
According to the actual production process of the preform, the three-dimensional model of the ZTA particle preform is constructed based on the Thiessen polygon. Firstly, we set a box as a rigid body attribute and divide it based on the Tyson polygon, as shown in Figure 5a. Then, we set the outer mold as a collision object attribute. When the rectangular box falls under the action of gravity and collides with the bottom of the mold, it will break into an irregular polyhedron according to the previous division. These polyhedrons have a structure very similar to the actual ZTA ceramic particle structure, and the polyhedron will pile up at the bottom of the mold, as shown in Figure 5b. Then, we repeat the previous operation and continuously stack polyhedral particles in the mold, as shown in Figure 5c, until the mold is filled, forming a prefabricated three-dimensional model.

Figure 5.
Construction process of 3D model of preform. (a) preform construction begins (b) preform particle stacking (c) preform construction completed.
3.5. Construction of 2D Model of Prefab
Firstly, a three-dimensional solid packing model of ceramic particles is established through modeling software (version number SolidWorks2023), and then a cross-section is taken on the model, and a two-dimensional model is established by using the contour of the cross-section. The two-dimensional model is shown in Figure 6 below:
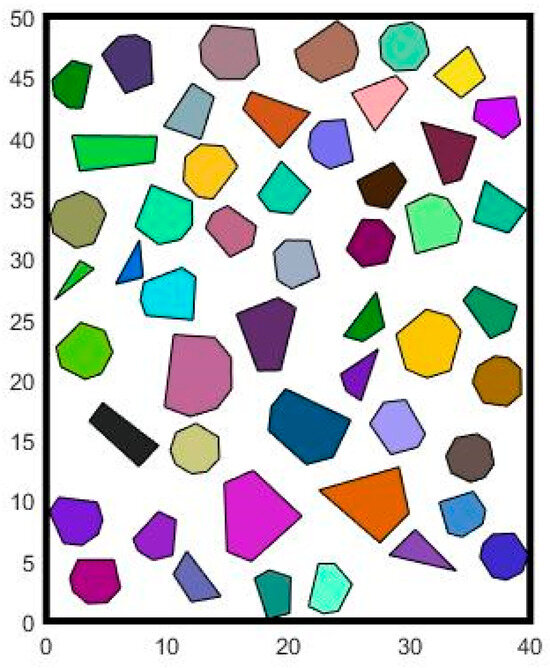
Figure 6.
Two-dimensional model.
3.6. Meshing
The number of grids divided this time is 726,756, and the number of nodes is 650,114. The two-dimensional prefab model consists of irregular convex polygons, and the size of the model is 40 mm × 50 mm.
3.7. Initial and Boundary Conditions
When simulating the infiltration behavior of a liquid metal in ZTA particle preforms, it is necessary to provide initial conditions in order to obtain the velocity and pressure fields during the infiltration process. The infiltration and solidification process of liquid metal involves the mutual transformation of multiple phases, so it is necessary to open a multiphase flow model. The flow of liquid metal in the voids of prefabricated bodies is irregular, so it is necessary to turn on the turbulence model switch and select the RNG k-ε Model. Because the solidification process is also accompanied by energy conversion, it is necessary to turn on the energy and solidification/melting switches. During the simulation of the filling process, input boundary conditions such as velocity, pressure, etc., on the previously defined interface are required. At the same time, because it also involves changes in the temperature field, it is necessary to set the heat transfer coefficients between the fluid and various defined walls, as well as the physical properties of the material.
4. Discussion and Results
4.1. Numerical Simulation of Liquid Metal Infiltration into Preform
This two-dimensional model is used to simulate the infiltration behavior of liquid metal in the preform. The right side of the model is the inlet direction of the molten metal, the pouring temperature is 1720 °C, the infiltration pressure is 7620 Pa, and the calculation and simulation process are started. The simulation results are shown in Figure 7.
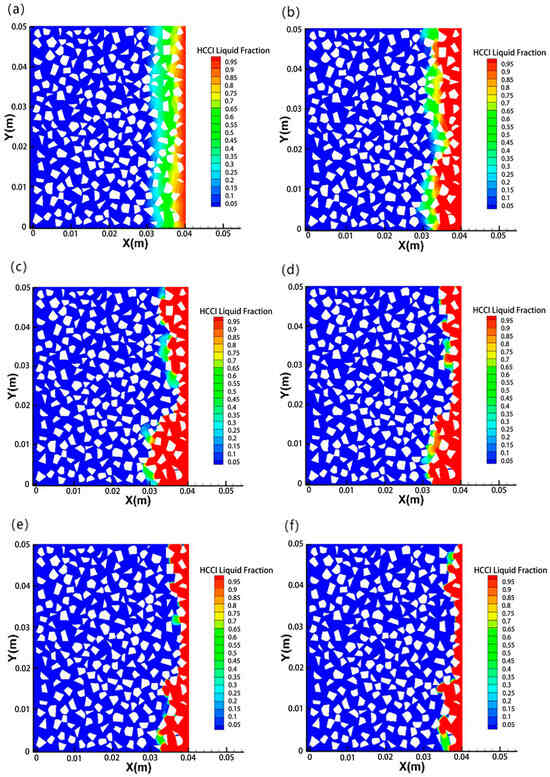
Figure 7.
Liquid phase distribution of liquid metal in preform under different infiltration processes: (a–c), respectively, show the liquid phase distribution of liquid metal at the beginning of infiltration, during infiltration, and at the end of infiltration in the preform; (d–f), respectively, show the liquid phase distribution when the liquid metal begins to solidify after infiltration, during solidification, and at the end of solidification.
It can be seen from Figure 7a–c that as the liquid metal gradually immerses into the preform from the right, the volume fraction of the liquid metal gradually expands to the interior of the preform. Because the set inlet condition for infiltration from the right is pressure infiltration, the infiltration speed is almost the same at the beginning. As the liquid metal encounters ceramic particles with irregular shapes and random distribution, the original ceramic particles are hindered. Infiltration behavior changes. In the sparse distribution of ceramic particles, the liquid metal can flow stably, while in the dense distribution of ceramic particles, the diameter of the void channels between the particles is too small, making it difficult for the liquid metal to continue to flow under the action of capillary resistance. This is because the liquid metal will also exchange heat with the ceramic particles and the wall during the flow process. As the flow progresses, the heat of the liquid metal will gradually decrease, and the temperature of the liquid metal will gradually decrease. When the temperature of the liquid metal is lower than the liquidus temperature, the liquid metal begins to solidify and the flow of the liquid metal is forced to stop. It can be seen from Figure 7d–f that when the liquid metal begins to solidify, the volume fraction of the liquid metal gradually decreases, and when it is completely solidified, the volume fraction of the liquid metal disappears completely. Therefore, the deepest position where the liquid metal volume fraction appears represents the infiltration depth of the liquid metal in the preform.
We take a measurement point at the position where the liquid metal infiltrates the deepest in the preform and measure the curve and volume fraction change curve of this point with temperature, as shown in Figure 8a,b. It can be seen from Figure 8a that the temperature of the liquid metal is lower than the temperature at the beginning of filling due to heat loss during the infiltration of the pores of the ceramic particle preform. When passing the temperature measurement point, its temperature is already lower than the liquidus temperature, and there is solid phase precipitation in the liquid metal. It can be seen from Figure 8b that the liquid metal has precipitated a solid phase when it passes through the measurement point. With the subsequent replenishment of the liquid metal, the liquid phase fraction of the liquid metal increases rapidly until it completely changes to the liquid phase. And the infiltration behavior of the liquid metal in the preform stops. The liquid phase at the temperature measurement point begins to solidify, a solid phase is precipitated, and the volume fraction of the liquid phase gradually decreases until it reaches zero.
Figure 8.
Relationship between temperature and liquid fraction with infiltration process at measuring point in preform (a) shows the temperature change curve of the measuring point in the whole calculation process; (b) shows the volume fraction change curve of liquid metal at the measuring point during the whole calculation process.
4.2. Temperature Field during Casting Infiltration Process
In order to investigate the effect of pouring temperature on the depth of liquid metal infiltration in preforms, the infiltration pressure was set at 6000 Pa, and the pouring temperatures were set at 1420 °C, 1570 °C, 1720 °C, and 1870 °C, respectively. Then, the infiltration process was numerically simulated, and the temperature field of the molten metal in the preform at different pouring temperatures was obtained, as shown in Figure 9.

Figure 9.
Temperature field in the composite area of liquid metal and preform at different pouring temperatures: (a–d) when the pouring temperatures are 1420 °C, 1570 °C, 1720 °C, and 1870 °C, respectively.
The temperature field of the preform and liquid metal composite area at different pouring temperatures is seen in Figure 9. As the pouring temperature increases, the temperature distribution area above the liquidus of the liquid metal becomes wider.
The boundary condition at the inlet was set as the pressure inlet boundary, and the pouring temperature was 1693 °C. The infiltration pressures were sequentially set as 7620 Pa, 15,240 Pa, 22,860 Pa, and 30,480 Pa. Then, the infiltration process was numerically simulated, and the temperature field of the molten metal in the prefabricated body under different infiltration pressures was obtained as shown in Figure 10.
Figure 10.
Temperature field in the composite area of liquid metal and preform under different infiltration pressures: (a–d) are the temperature field of the composite area of the molten metal and the preform when the infiltration pressures are 7620 Pa, 15,240 Pa, 22,860 Pa, and 30,480 Pa, respectively.
As shown in Figure 10, with the increase in infiltration pressure, the temperature distribution area above the liquidus of the metal becomes wider and covers some parts that cannot be infiltrated.
4.3. Depth of Liquid Metal Infiltration into Preform
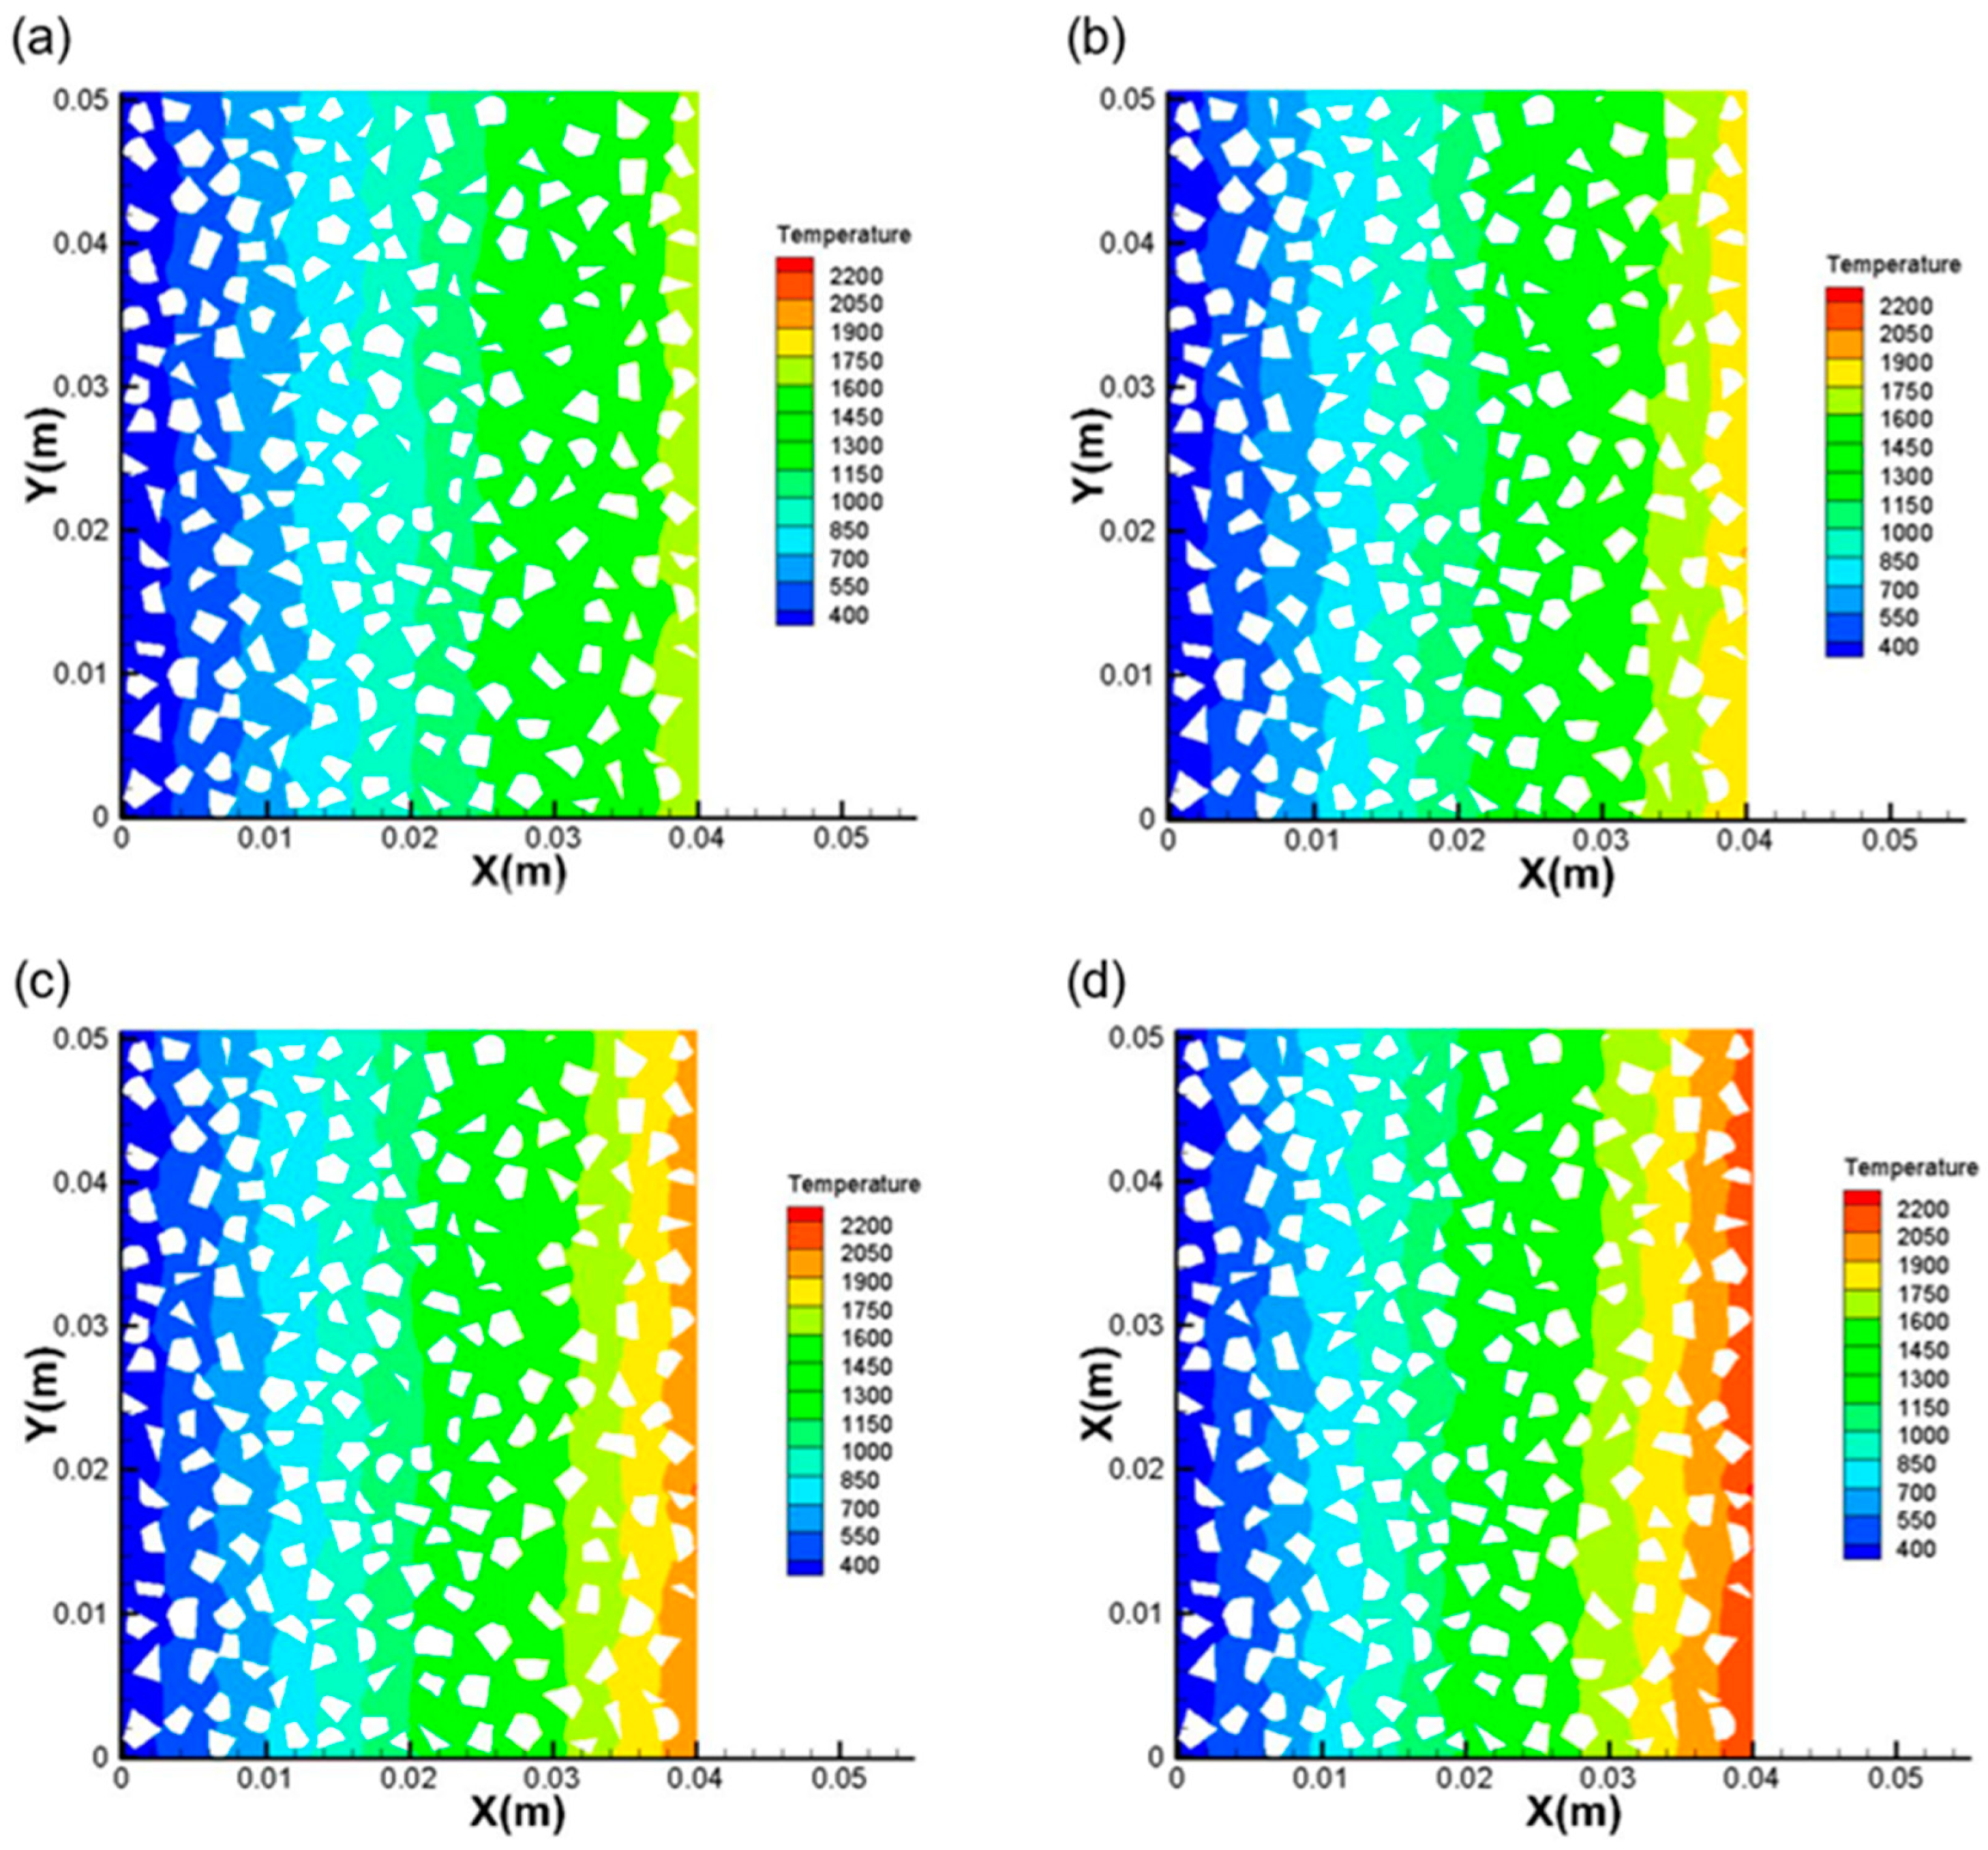
At an infiltration pressure of 6000 Pa, pouring temperatures were sequentially set at 1420 °C, 1570 °C, 1720 °C, and 1870 °C. Then, the infiltration process was numerically simulated, and the results of the infiltration depth of the metal liquid in the prefabricated body under different pouring temperatures were obtained, as shown in Figure 11.
Figure 11.
The infiltration depth of liquid metal in the preform at different pouring temperatures: (a–d) when the pouring temperatures are 1420 °C, 1570 °C, 1720 °C, and 1870 °C, respectively.
It can be seen from Figure 11 that as the pouring temperature increases, the liquid metal distribution in the preform is deeper, which indicates that the infiltration depth of the liquid metal in the preform is also greater. The higher the initial temperature of the liquid metal is, the longer the liquid metal stays at the liquidus during the flow in the pores of the preform, and the greater the depth of infiltration of the liquid metal.
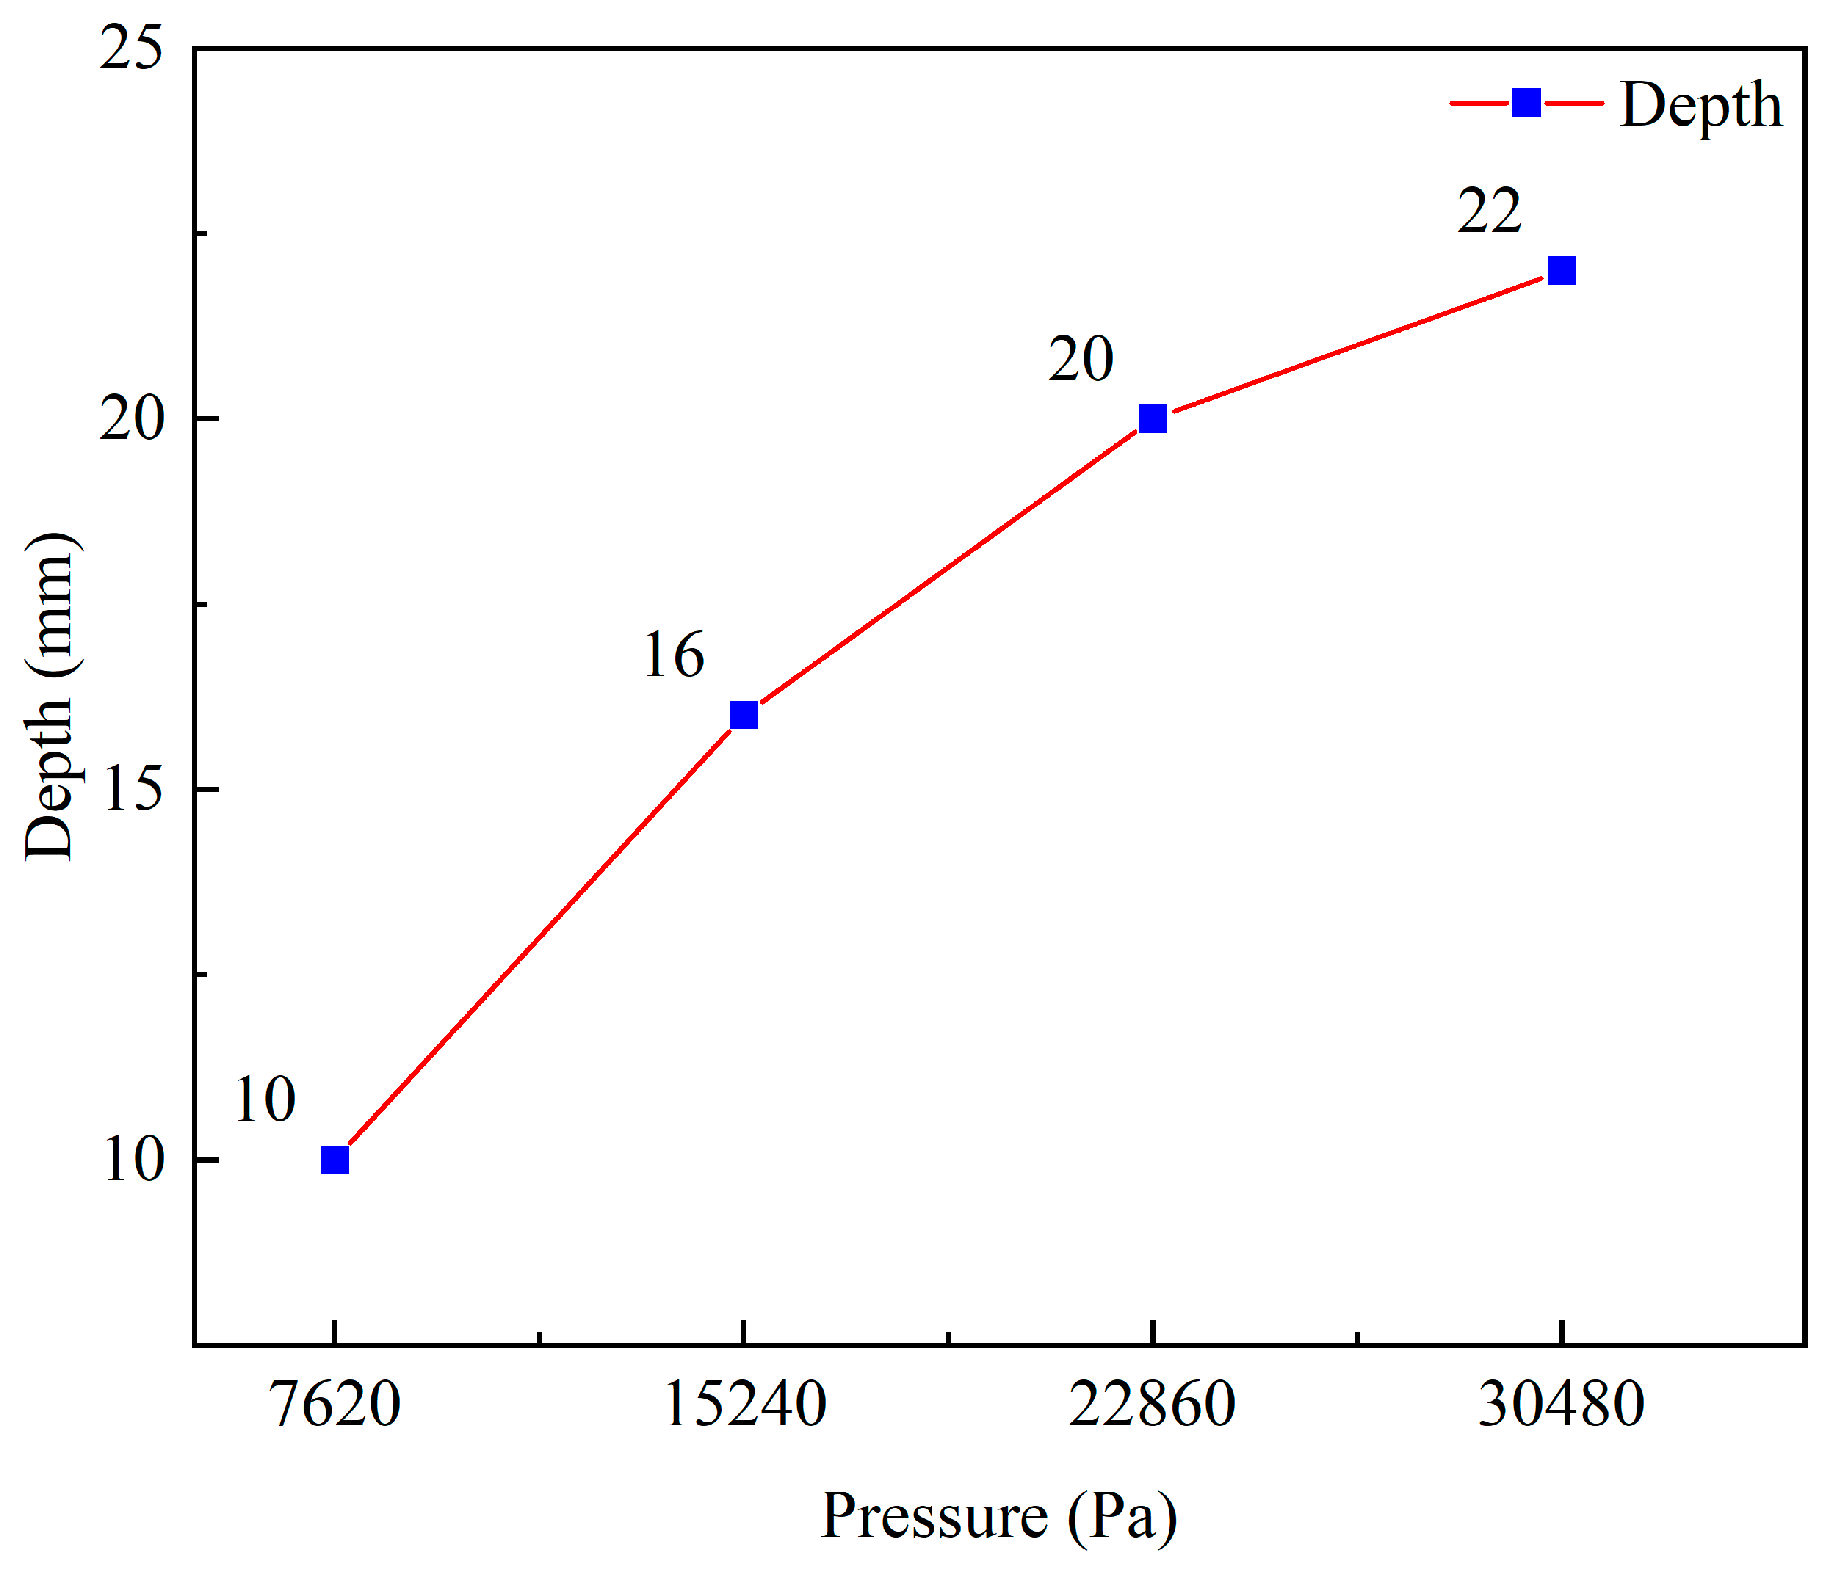
The boundary condition at the inlet is set as the pressure inlet boundary, the pouring temperature is 1693 °C, and the infiltration pressure is sequentially set to 7620 Pa, 15,240 Pa, 22,860 Pa, and 30,480 Pa. Then, the infiltration process is numerically simulated, and the results of the infiltration depth of the metal liquid in the prefabricated body under different infiltration pressures are shown in Figure 12.
Figure 12.
The infiltration depth of liquid metal in the preform under different infiltration pressures: (a–d) are the infiltration depth of the liquid metal in the preform when the infiltration pressures are 7620 Pa, 15,240 Pa, 22,860 Pa, and 30,480 Pa, respectively.
It can be seen from Figure 12 that as the infiltration pressure increases, the liquid metal distribution in the preform is deeper, which indicates that the infiltration depth of the liquid metal in the preform is also greater. The greater the initial pressure of the liquid metal, the smaller the influence of the infiltration resistance of the liquid metal in the flow of the preform pores on its flow rate, and the less the liquid metal can flow from the pouring temperature to the liquidus. The greater the distance, the greater the penetration depth of the liquid metal. And with the increase in the infiltration pressure, we can see that in the middle part of the model, the infiltration cannot be continued due to the capillary pressure, and the liquid metal overcomes the capillary pressure and flows through these small pore areas.
In the measurement of infiltration depth in numerical simulations, we employed the method of using a ruler because the dimensions of the model are 40 × 50 mm. At 1420 °C, 1570 °C, 1720 °C, and 1870 °C, the simulated values for the infiltration depth of liquid metal are, respectively, 4 mm, 8 mm, 11 mm, and 15 mm. During measurement, we selected the maximum infiltration depth as the measured value. Compared with Figure 2 and Figure 3, at the same casting temperature, the experimental values were, respectively, 4.5 mm, 7.6 mm, 11 mm, and 14 mm. Upon comparing the experimental data with the simulated data, it was found that the error in infiltration depth was within 1 mm. From Figure 13, it can be observed that as the casting temperature increases, both the infiltration depth and the infiltration rate also increase. The reasons for the increase in infiltration depth and permeation rate in the preform within composite materials are as follows: An increase in temperature leads to a decrease in the viscosity of high-chromium cast iron melts. A melt with lower viscosity flows more easily, enabling it to more effectively fill the micro-pores and channels within the preform, thereby increasing both the depth of infiltration and the rate of permeation. In some cases, the increase in temperature can also accelerate the interface reactions between the melt and the preform. These reactions may alter the physicochemical properties at the interface, for example, by forming phases with better wettability to promote permeation.
Figure 13.
Variation in preform infiltration depth with casting temperature.
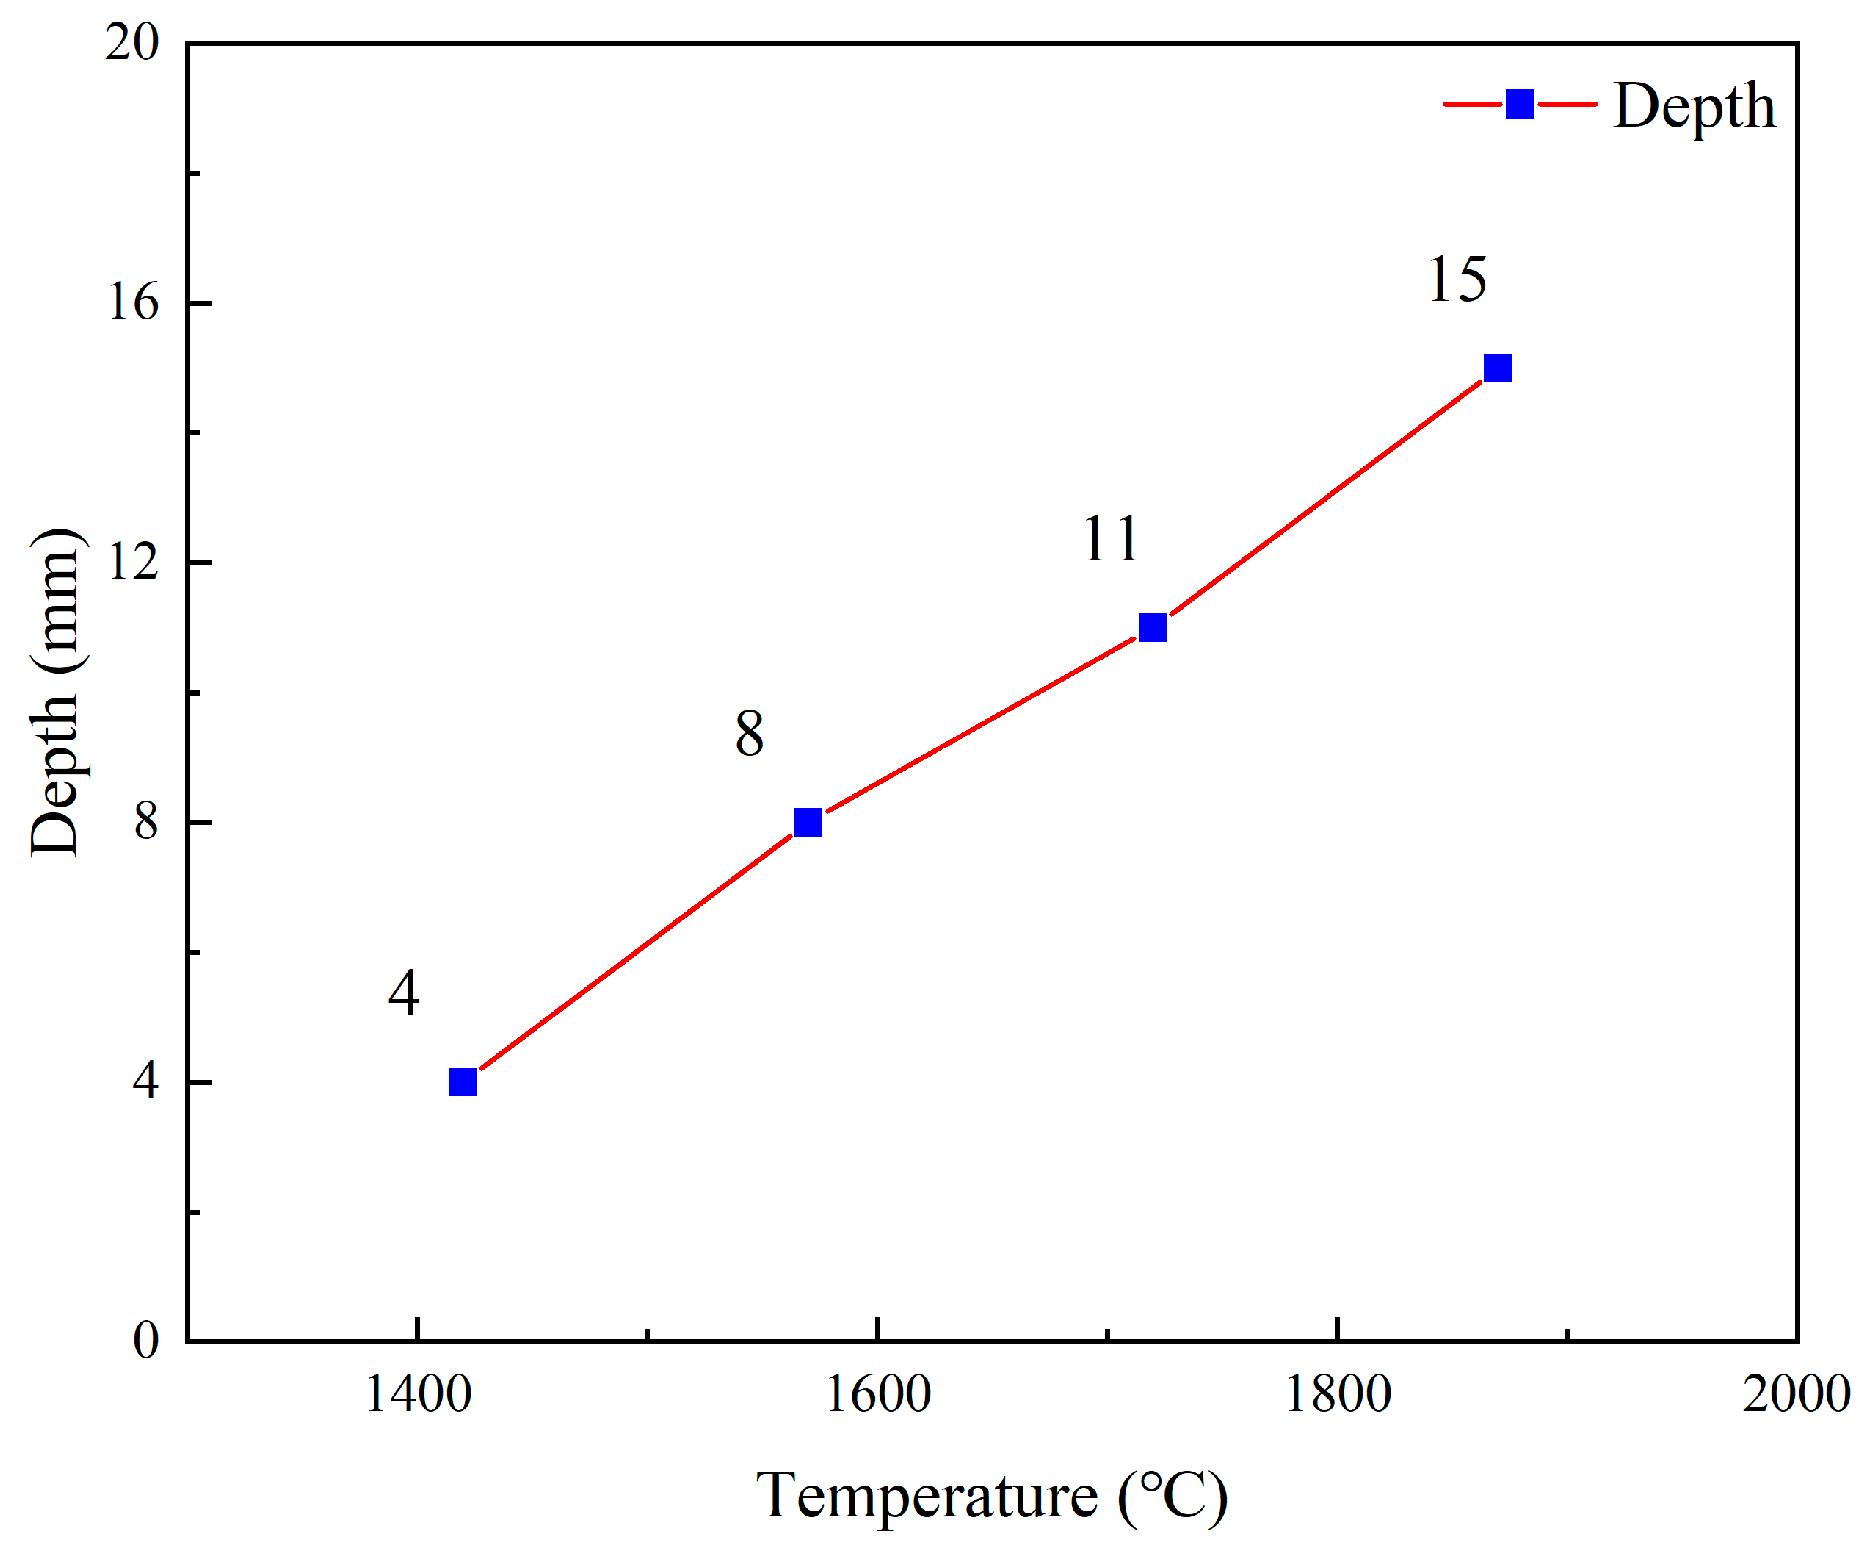
The variation trend of liquid metal infiltration depth with infiltration pressure is shown in Figure 14 below. When the infiltration pressure increases successively from 7620 Pa to 15,240 Pa, 22,860 Pa, and 30,480 Pa, the infiltration depths are 10 mm, 16 mm, 20 mm, and 22 mm, respectively. From Figure 14, it can be observed that as the infiltration pressure increases, the infiltration depth increases, but the infiltration rate gradually decreases. As the infiltration pressure of high-chromium cast iron increases, the depth of infiltration into the preform indeed increases, but the rate of permeation may gradually decrease due to the following reasons: The increase in pressure helps to drive the melt deeper into the preform because the high pressure can overcome the resistance in the pores, pushing the melt through the fine pores and channels. Hence, the depth of infiltration increases with increasing pressure. However, as the pores and channels within the preform are filled, the paths available for melt flow decrease, leading to an increase in flow resistance. In the initial stages, due to the abundance of pores, the melt can permeate quickly; but as the pores gradually fill, the remaining permeable paths narrow, thus reducing the permeation rate. As the infiltration process progresses, the distribution of the melt inside the preform gradually reaches a dynamic equilibrium, causing the rate of increase in permeation to gradually diminish and eventually stabilize.
Figure 14.
Variation in preform infiltration depth with infiltration pressure.
5. Conclusions
In order to solve the difficulty of directly observing the infiltration process of liquid metal in preform, this paper first conducted infiltration experiments on liquid metal in ZTA ceramic particle prefabricated parts at different pouring temperatures. Then, Voronoi graphics were used to construct a preparation method based on actual preform, and a three-dimensional particle stacking model was established. A two-dimensional finite element model was constructed by taking a cross-section of the three-dimensional preform. The leaching behavior of the liquid metal in preform was simulated using Fluent software (version number Fluent15.0), and the influencing factors of liquid metal infiltration depth were analyzed. The main conclusions are as follows:
- (1)
- In the infiltration experiment, at pouring temperatures of 1420 °C, 1570 °C, 1720 °C, and 1870 °C, the depths of liquid metal infiltration into the preform were 4.5 mm, 7.6 mm, 11 mm, and 14 mm. Under the same conditions, the simulated values of liquid metal infiltration depth were 4 mm, 8 mm, 11 mm, and 15 mm, respectively, and the experimental values are basically consistent with the simulated values.
- (2)
- As the infiltration pressure increases sequentially from 7620 Pa to 15,240 Pa, 22,860 Pa, and 30,480 Pa, it is beneficial to overcome the infiltration resistance of the liquid metal during the flow of the ceramic particle preform and to increase the infiltration depth of the liquid metal in the preform. The infiltration depths are 10 mm, 16 mm, 20 mm, and 22 mm, respectively.
Author Contributions
X.H.: Writing—original draft preparation and investigation, Y.L.: data curation and experimental data compilation, X.L.: supervision and guidance, M.Z.: supervision and guidance, Y.J.: supervision and guidance. All authors have read and agreed to the published version of the manuscript.
Funding
This work was supported by the Yunnan Major Scientific and Technological Projects (grant no. 202202AG050007).
Data Availability Statement
The authors confirm that the data supporting the findings of this study are available within the article.
Acknowledgments
The authors appreciate the state local joint Engineering Laboratory of Advanced Solidification Forming and Equipment Technology of Metal, Kunming University of Science and Technology.
Conflicts of Interest
The authors declare no conflicts of interest.
References
- Gupta, M. Metal Matrix Composites—The Way Forward. Appl. Sci. 2020, 10, 3000. [Google Scholar] [CrossRef]
- Kim, C.-S.; Cho, K.; Manjili, M.H.; Nezafati, M. Mechanical performance of particulate-reinforced Al metal-matrix composites (MMCs) and Al metal-matrix nano-composites (MMNCs). J. Mater. Sci. 2017, 52, 13319–13349. [Google Scholar] [CrossRef]
- Malaki, M.; Tehrani, A.F.; Niroumand, B. Fatgiue behavior of metal matrix nanocomposites. Ceram. Int. 2020, 46, 23326–23336. [Google Scholar] [CrossRef]
- Maleki, A.; Taherizadeh, A.; Issa, H.; Niroumand, B.; Allafchian, A.; Ghaei, A. Development of a new magnetic aluminum matrix nanocomposite. Ceram. Int. 2018, 44, 15079–15085. [Google Scholar] [CrossRef]
- Qin, Y.; Tian, Y.; Peng, Y.; Luo, L.; Zan, X.; Xu, Q.; Wu, Y. Research status and development trend of preparation technology of ceramic particle dispersion strengthened copper-matrix composites. J. Alloy. Compd. 2020, 848, 156475. [Google Scholar] [CrossRef]
- Kumar, V.M.; Venkatesh, C.V. A comprehensive review on material selection, processing, characterization and applications of aluminium metal matrix composites. Mater. Res. Express 2019, 6, 072001. [Google Scholar] [CrossRef]
- Mortensen, A.; Llorca, J. Metal Matrix Composites. Annu. Rev. Mater. Res. 2010, 40, 243–270. [Google Scholar] [CrossRef]
- Nie, K.; Wang, X.; Deng, K.; Hu, X.; Wu, K. Magnesium matrix composite reinforced by nanoparticles—A review. J. Magnes. Alloy. 2021, 9, 57–77. [Google Scholar] [CrossRef]
- Sui, Y.; Han, L.; Jiang, Y. Effect of Ta2O5 addition on the microstructure and mechanical properties of TiO2-added yttria-stabilized zirconia-toughened alumina (ZTA) composites. Ceram. Int. 2018, 44, 14811–14816. [Google Scholar] [CrossRef]
- Zhang, W.; Chen, H.; Prentki, R. Numerical analysis of the mechanical behavior of ZTAp/Fe composites. Comput. Mater. Sci. 2017, 137, 153–161. [Google Scholar] [CrossRef]
- Zhou, M.; Sui, Y.; Chong, X.; Jiang, Y. Wear Resistance Mechanism of ZTAP/HCCI Composites with a Honeycomb Structure. Metals 2018, 8, 588. [Google Scholar] [CrossRef]
- Sktani, Z.D.I.; Arab, A.; Mohamed, J.J.; Ahmad, Z.A. Effects of additives additions and sintering techniques on the microstructure and mechanical properties of Zirconia Toughened Alumina (ZTA): A review. Int. J. Refract. Met. Hard Mater. 2022, 106, 105870. [Google Scholar] [CrossRef]
- Sui, Y.; Zhou, M.; Jiang, Y. Characterization of interfacial layer of ZTA ceramic particles reinforced iron matrix composites. J. Alloy. Compd. 2018, 741, 1169–1174. [Google Scholar] [CrossRef]
- Wang, J.; Stevens, R. Zirconia-toughened alumina (ZTA) ceramics. J. Mater. Sci. 1989, 24, 3421–3440. [Google Scholar] [CrossRef]
- Dutka, V.A. Numerical modeling of liquid-phase infiltration in the process of sintering ceramic composites. J. Superhard Mater. 2014, 36, 105–116. [Google Scholar] [CrossRef]
- Guan, J.-T.; Qi, L.-H.; Liu, J.; Zhou, J.-M.; Wei, X.-L. Threshold pressure and infiltration behavior of liquid metal into fibrous preform. Trans. Nonferrous Met. Soc. China 2013, 23, 3173–3179. [Google Scholar] [CrossRef]
- Orbulov, I.N. Metal matrix syntactic foams produced by pressure infiltration—The effect of infiltration parameters. Mater. Sci. Eng. A 2013, 583, 11–19. [Google Scholar] [CrossRef]
- Guo, X.; Liu, R.; Wang, J.; Shuai, S.; Xiong, D.; Bai, S.; Zhang, N.; Gong, X.; Wang, X. 3D actual microstructure-based modeling of non-isothermal infiltration behavior and void formation in liquid composite molding. Appl. Math. Model. 2021, 94, 388–402. [Google Scholar] [CrossRef]
- Du, J.; Chong, X.; Jiang, Y.; Feng, J. Numerical simulation of mold filling process for high chromium cast iron matrix composite reinforced by ZTA ceramic particles. Int. J. Heat Mass Transf. 2015, 89, 872–883. [Google Scholar] [CrossRef]
- Barragán De Los Rios, G.A.; Salazar Martínez, S.A.; Mendoza Fandiño, E.; Fernandez-Morales, P. Numerical Simulation of Aluminum Foams by Space Holder Infiltration. Int. J. Met. 2024, 1–17. [Google Scholar] [CrossRef]
- Chen, Z.; Li, Y.; Zhao, F.; Li, S.; Zhang, J. Progress in numerical simulation of casting process. Meas. Control. 2022, 55, 257–264. [Google Scholar] [CrossRef]
- Cheng, H.; Chang, J.; Sun, Y.; Zhang, J.; Wang, X. Numerical simulation of stress distribution for CF/EP composites in high temperatures. J. Therm. Stress. 2019, 42, 416–425. [Google Scholar] [CrossRef]
- Kurz, W.; Fisher, D.J.; Rappaz, M. Fundamentals of Solidification, 5th ed.; Trans Tech Publications: Zurich, Switzerland, 2023. [Google Scholar]
- Li, B. Numerical simulation of flow and temperature evolution during the initial phase of steady-state solidification. J. Mater. Process. Technol. 1997, 71, 402–413. [Google Scholar] [CrossRef]
- Katgerman, L. Principles of Solidification. Mater. Today 2011, 14, 502. [Google Scholar] [CrossRef]
- Yakhot, V.; Orszag, S.A. Renormalization group analysis of turbulence. I. Basic theory. J. Sci. Comput. 1986, 1, 3–51. [Google Scholar] [CrossRef]
- Smith, L.M.; Reynolds, W.C. On the Yakhot–Orszag renormalization group method for deriving turbulence statistics and models. Phys. Fluids A Fluid Dyn. 1992, 4, 364–390. [Google Scholar] [CrossRef]
- Bargmann, S.; Klusemann, B.; Markmann, J.; Schnabel, J.E.; Schneider, K.; Soyarslan, C.; Wilmers, J. Generation of 3D representative volume elements for heterogeneous materials: A review. Prog. Mater. Sci. 2018, 96, 322–384. [Google Scholar] [CrossRef]


Disclaimer/Publisher’s Note: The statements, opinions and data contained in all publications are solely those of the individual author(s) and contributor(s) and not of MDPI and/or the editor(s). MDPI and/or the editor(s) disclaim responsibility for any injury to people or property resulting from any ideas, methods, instructions or products referred to in the content. |
© 2024 by the authors. Licensee MDPI, Basel, Switzerland. This article is an open access article distributed under the terms and conditions of the Creative Commons Attribution (CC BY) license (https://creativecommons.org/licenses/by/4.0/).