Article

Reactive Ceramic Membrane for Efficient Micropollutant Purification with High Flux by LED Visible-Light Photocatalysis: Device Level Attempts

1
School of Chemistry and Chemical Engineering, Chongqing University of Technology, Chongqing 400054, China
2
Chongqing Municipal Center of Urban-Rural Drainage Treatment, Chongqing 400010, China
3
College of Materials Science and Engineering, Chongqing University, Chongqing 400044, China
*
Authors to whom correspondence should be addressed.
These authors contributed equally to this work.
Crystals 2023, 13(4), 651; https://doi.org/10.3390/cryst13040651
Submission received: 4 March 2023 / Revised: 5 April 2023 / Accepted: 7 April 2023 / Published: 10 April 2023

Abstract

:
Micropollutants (MPs) are widely occurring in surface water all over the world with extremely low concentrations, and their treatment requires high energy consumption and efficiency. In this study, a large-sized planar photocatalytic reactive ceramic membrane (PRCM) was prepared using the facile dip-coating method with nitrogen-doped TiO2 (N-TiO2-CM) for the purification of tetracycline hydrochloride (TC) as a model MP. The N-TiO2 nanoparticles and the as-prepared N-TiO2-CM were characterized by SEM/EDS, TEM, XPS, UV–Vis DRS, and FT-IR. A fixed bed reactor integrated N-TiO2-CM, and visible LED light was fabricated for the new PRCM water treatment system for the removal of TC with a comprehensive consideration of the degradation rate and permeate flux. The SEM/EDS results indicated that the N-TiO2 was uniformly and tightly loaded onto the flat CM, and the pure water flux could reach over 2000 L/(m2 × h) under a trans-membrane pressure (TMP) of −92 kPa. The fixed bed PRCM water treatment system is extremely suited for MP purification, and the removal efficiency of TC was as high as 92% with 270 min even though its initial concentration was as low as 20 mg/L. The degradation rate and permeate flux of N-TiO2-CM was 2.57 and 2.30 times as high as that of the CM, indicating its good self-cleaning characteristics. The quenching experiments illustrated that the reactive radicals involved in the PRCM process, •OH and •O2, were responsible for TC degradation. This research also provides a utilization proposal for a scale-up N-TiO2-CM system for water and wastewater treatment.

1. Introduction

With the development of the economy and society, a large number of organics from antibiotics, dyes, personal care products, pesticides, flame retardants, organic solvents, etc., enter into the ecosystem with the characteristics of stable structure, recalcitrance, and low concentration [1,2]. These organic pollutants are known as emerging micropollutants (MPs), which seriously threaten human health and affect ecological balance and stability. Therefore, water treatment and reuse are key topics concerning the scarcity of drinking water on Earth [3]. There is global concern associated with the elimination of MPs before possible reuse or discharge into the environment [4]. However, MPs are difficult to remove completely, requiring a large amount of chemical oxidant, high energy consumption, low efficiency, and the production of a lot of disinfection by-products [5,6,7]. It is crucial to find a method of removing MPs with high efficiency but low cost. As a result, researchers from both home and abroad have turned to membrane separation for help such as nanofiltration (NF) and reverse osmosis (RO) because of their advantages of high water quality of treated effluent, smaller footprint, convenient operation, low operating cost, etc. [8,9]. Nevertheless, fouling is a big problem for the application of NF or RO due to the adsorption physicochemical reaction of nano sizes of colloidal material, macromolecular compounds, and microorganisms in long-run operation [10,11,12].
As mentioned above, it is vital to develop an anti-fouling membrane for the treatment of MPs. Currently, research studies on the anti-fouling membrane mainly focus on the coupling processes of advanced oxidation and membrane separation, because the former generates strong oxidizing free radicals, which not only benefits the degradation of organic pollutants but also eliminates the fouling of the membrane [13,14]. In existing articles, ceramic membranes have been fully combined with advanced oxidation technology, and nano-catalysts are supported on CM by spraying, which can not only reduce the adhesion of pollutants on the membrane but also facilitate the reuse of nano-catalysts [15]. As a result, the coupling technologies can not only avoid the shortcomings of a single process but also exhibit a synergistic effect for the treatment of pollutants, such as the coupling process of TiO2 photocatalysis, Fenton (like) oxidation, persulfate oxidation, ozonation, and electrocatalytic oxidation, etc., with a ceramic membrane (CM), ultrafiltration, NF and RO [16,17,18,19,20,21,22]. Among them, the coupling process of TiO2 photocatalysis and CM has become an attractive technology for the treatment of MPs due to high degradation efficiency, prominent anti-fouling performance, facile operation, and the usage of solar energy to cut costs. However, the coupling technologies are also divided into two systems, one is CM, which is placed in a slurry TiO2 photocatalysis system, and the other is developing a reactive CM with TiO2 nanocatalyst. Compared with the former system, the latter shows many advantages of much fewer losses and no agglomeration of TiO2 photocatalyst, is simple to control and operate, and so on.
Therefore, the fabrication methods of a TiO2 photocatalyst-loaded reactive ceramic membrane is extremely important with outstanding visible light catalytic activity, high flux, and better stability and reuse performance, which mainly include dip-coating, physical deposition, spin coating, immersion precipitation, and electrospinning, etc. However, as we know, not much research targets the preparation of a larger reactive flat ceramic membrane module with superficial area over 200 cm2 and water treatment capacity over 1 L. Therefore, we make a comparison, as shown in Table 1. In this paper, we use a peculiarly cheap precursor of urea to synthetize the N-doped TiO2 (N-TiO2) photocatalyst to expand its visible light response activity with the sol-gel method. Then, a larger N-TiO2 loaded flat CM (N-TiO2-CM) with a superficial area of 240 cm2 (15 cm × 8 cm × 2 sides) was prepared by a facile dip-coating method. The N/TiO2-CM was fabricated into a CM module and a water treatment system using LED UVA light as a light source was designed and set up correspondingly. Model MPs of tetracycline hydrochloride (TC) aqueous solutions were treated in the new N-TiO2-CM water treatment system, respectively, and the degradation performance and permeate flux were investigated comprehensively.

2. Experiment and Methods

2.1. Preparation of the N-TiO2-CM

The planar CM used in the experiments is produced by Shenzhen Huahuai circulation material of China. with a main component of α-Al2O3 (L × W × H = 510 × 150 × 4 mm), a nominal pore size of 0.1 µm, water purification channels of 43 (L × W = 2 × 3 mm), a porosity of 53%, and an effective membrane area of 0.024 m2. For the preparation of N-TiO2-x-CM, firstly, the CM was cut into smaller pieces with a dimension of 90 mm × 150 mm (L × W). Then, the CM was immersed in a mixture of deionized water, absolute alcohol, and acetone with a volume ratio of 1:1:1 for 6 h. After that, the CM was washed with deionized water and dried at 105 °C in an oven for further use. The preparation procedures of N-doped TiO2 sol and the batch photocatalytic experiment with N-TiO2 nanoparticles were detailly described in the Supplementary Materials. As can be seen in Figure S1, N-TiO2-1 (n(Ti):n(N) = 1:1) and N-TiO2-2 (n(Ti):n(N) = 1:2) exhibited a better visible light photocatalytic activity. As a result, N-TiO2-1 and N-TiO2-1 were chosen to prepare the N-TiO2-CM [23,24].
The dip-coating experiments were conducted with a TL 0.01 dip-coater (MTI corporation), and the procedures were as follows: (1) the clean-washed CM was soaked in the as-prepared N-TiO2 sol (n(Ti):n(N) = 1:1 or 1:2) for 10 min; (2) then, the CM was lifted up with a speed of 10 mm/min, and air dried for 30 min after the movement; (3) the dip-coating procedure was repeated another two times (3 layers) due to the adverse effect of higher layers (6 and 9 layers) on the pure water flux of PRCM shown in Figure S2. After drying in air, the N-TiO2 sol-coated CM was calcined in a muffle furnace at 105 °C for 30 min at a heating rate of 1 °C/min and then continued to heat up to 500 °C for 2 h at the same heating rate of 1 °C/min. Finally, the membrane material was cooled to room temperature at 1 °C/min to obtain the photocatalytic reactive CM of N-TiO2-x-CM (x- refers to N/Ti molar ratio). The as-prepared N-TiO2-x-CM was then bonded with plastic subassembly by epoxy resin to obtain a PRCM module, which is shown in Figure 1 [24].

2.2. The Experimental Setup of PRCM

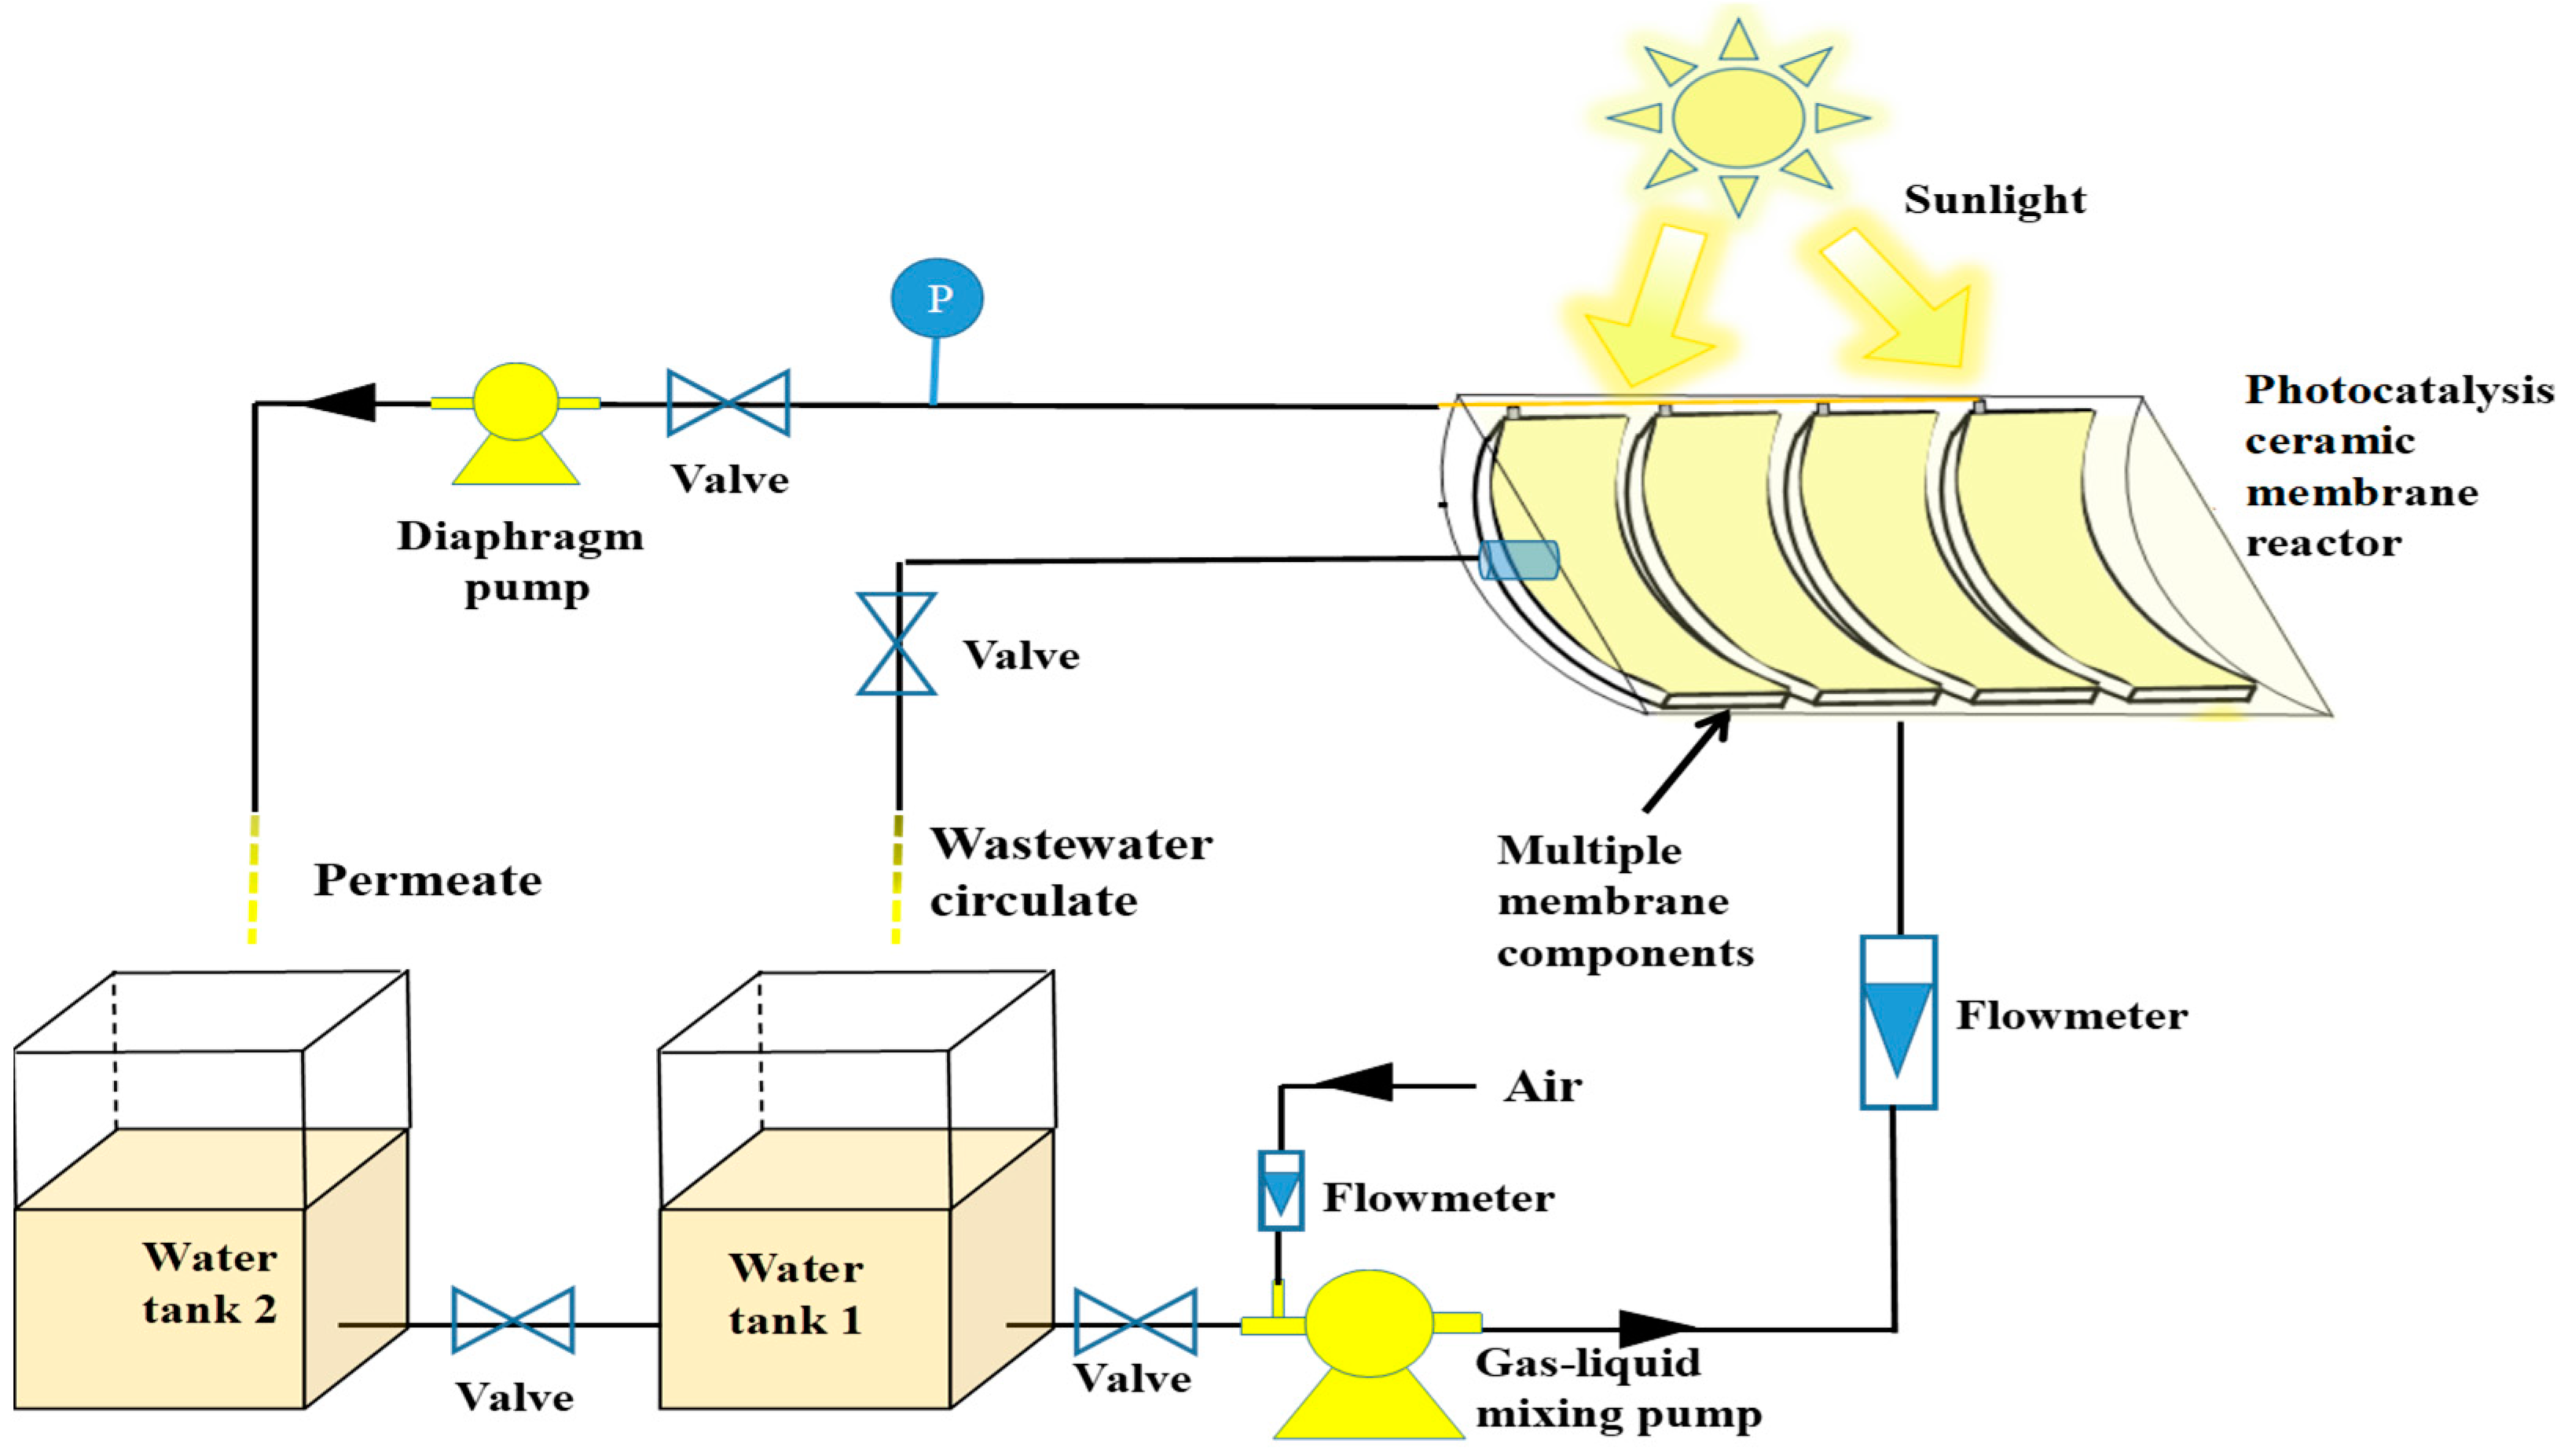
The water treatment system with PRCM consisted of a quartz fixed bed reactor (FBR, L × W × H = 180 × 25 × 130 mm), in which the N-TiO2-CM was vertically placed, along with two LED lamps (405 nm, 45 W), two water tanks (L × W × H = 100 × 100 × 240 mm), a diaphragm pump, a peristaltic pump, and some accessories of valves and piezometers, as shown in Figure 2. The LED lamps were placed face to face outside both sides of the FBR at a distance of 10 mm. The MP wastewater was circulated between FBR and the 2# water tank through the peristaltic pump and was degraded by the PC process. As for the MF process, the permeate was sucked out to the 1# water tank by the diaphragm pump. It is worth mentioning that the trans-membrane pressure (TMP) was recorded by two piezometers before and after the diaphragm pump.

2.3. Removal of MP by the Fixed Bed PRCM System

For each experiment, 2.0 L of 20 mg/L of TC solution was poured into the 2# water tank of the new N-TiO2-CM water treatment system as shown in Figure 2. Then, the peristaltic pump was turned on and the wastewater was circulated between the fixed bed reactor and the water tank. After running for ten min, 20 mL of TC solution was sampled and labeled as a zero-point sample. Then, the LED lamps and the diaphragm pump with different vacuum pressures (−20, −40, −60, −80 kPa) were turned on to start the photocatalysis and membrane filtration coupling process. At the same time, the valve of the two tanks was also opened. Several samples were taken out at an interval of 30 min to detect the absorbance of MP concentrations by a spectrophotometer. The removal efficiency (R) of MP was calculated using the following equation,
R = C 0 C t C 0 × 100 %
where C0 (mg/L) and Ct (mg/L) are the MP concentration at the beginning and any time t, respectively.
The first-order reaction kinetic equation was used for fitting the photocatalytic degradation dynamics, and the reaction rate constant k (min−1) can be obtained using Equation (2) [25].
l n C 0 C t = k × t
The permeate flux (J, L/(h·m2)) of the PRCM is expressed as Equation (3) according to the literature [26].
J = V A × t
where V is the volume of permeate (L), A is the MF area (m2), and t is the time (h).

2.4. Analysis Methods

The crystal texture of the TiO2 and N-TiO2 nanoparticles was identified by X-ray diffraction (XRD, XRD-7000). The morphology and microstructure of the nanoparticles were observed via scanning electron microscopy (SEM, JEOL-7500) and transmission electron microscope (TEM, JEM-2010). The binding energy position and coordination environment of Ti and N in the catalyst were characterized by X-ray photoelectron spectroscopy (XPS, Thermo Fisher Scientific K-Alpha). The surface functional groups analysis was conducted by using a Fourier transform infrared spectroscopy (FT-IR, Thermo Fisher Scientific, Waltham, MA, USA). The light absorption performance of powder materials was determined through a UV-Vis-NIR spectrophotometer (Cary 5000, Agilent Technologies, Santa Clara, CA, USA). The pore size of the PRCM was determined by a membrane pore size analyzer (3H-2000 PB, Beijing Beishide Instrument Technology Co., Beijing, China).

3. Results and Discussion

3.1. Characterization of the N-TiO2 Nanoparticles

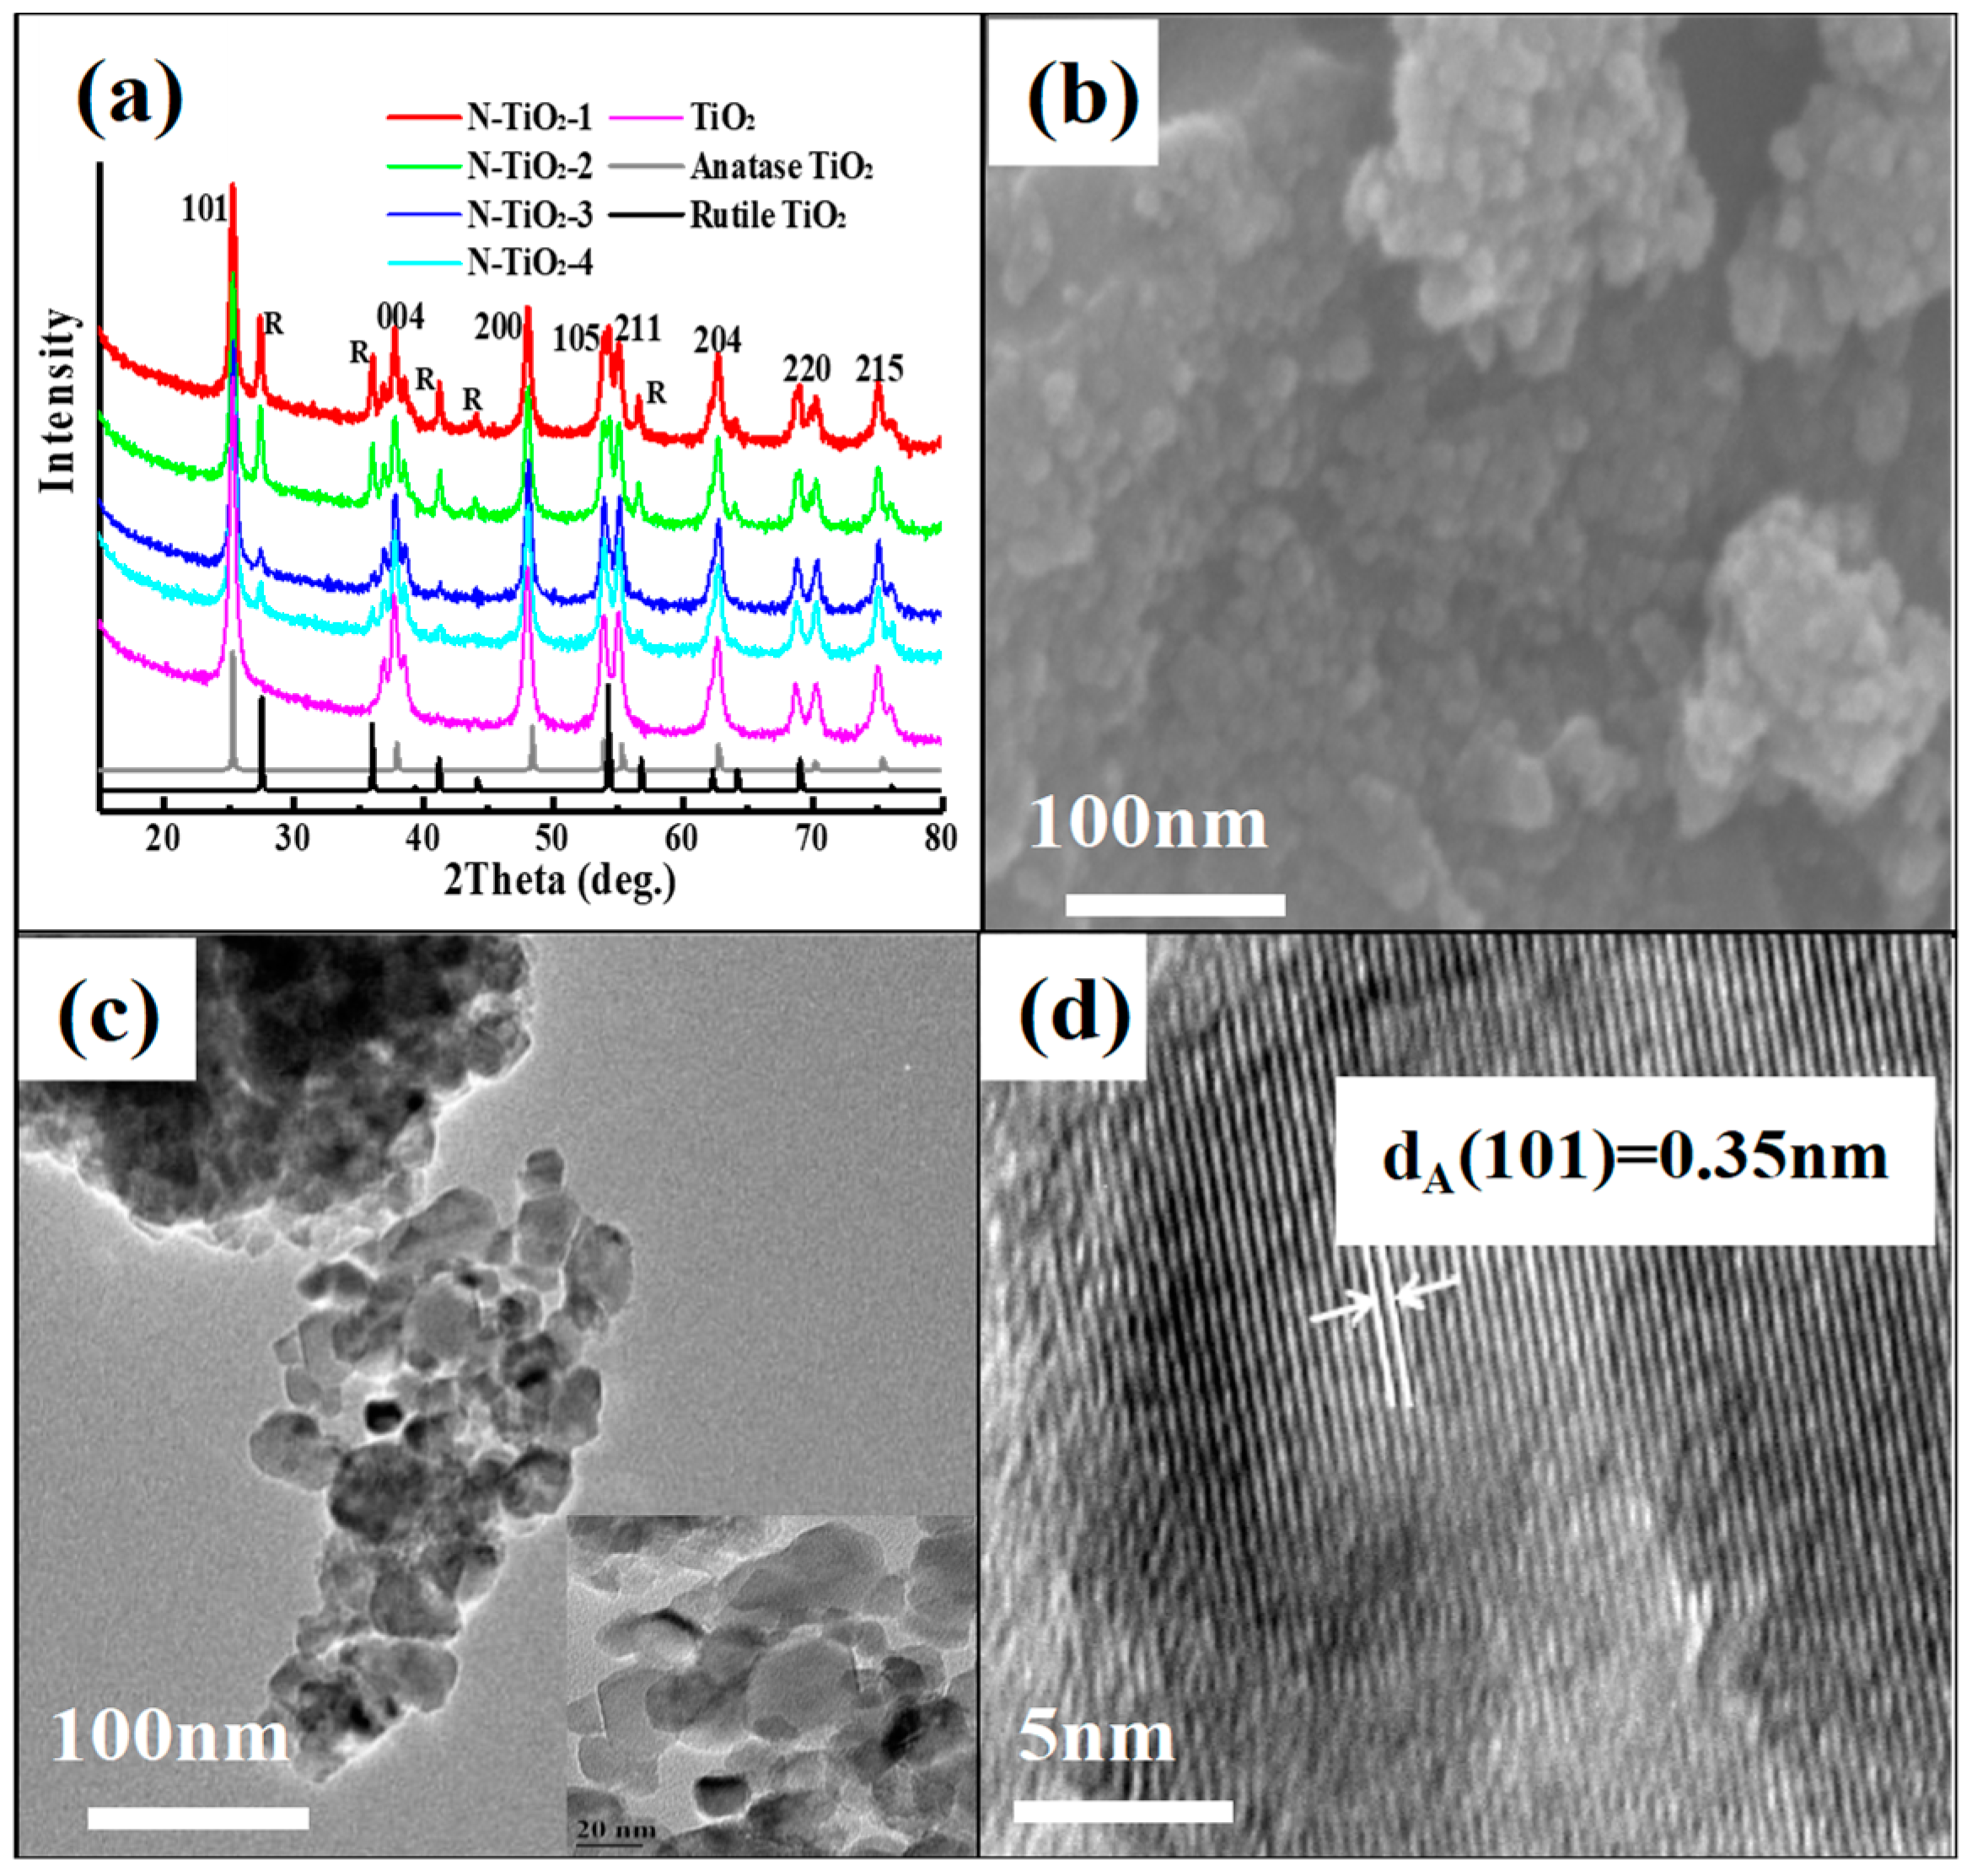
Figure 3a shows the XRD spectra of N-TiO2 with different doping ratios. The diffraction peaks at 37.80°, 48.06°, 53.87°, 55.08°, 62.59°, 70.20°, and 75.01° correspond to {004}, {200}, {105}, {211}, {204}, {220}, and {215} crystal planes of anatase, respectively [27]. The crystalline phase of the undoped TiO2 was the main anatase. However, adding nitrogen to the TiO2, there exhibited a diffraction peak of the rutile phase [28]. The rutile phase of TiO2 has stronger thermal stability, and the diffraction angle is at 27.5°. With the increase in nitrogen, the degree of rutile crystallization decreased. This indicated that appropriate N addition (n(Ti):n(N) = 1:1) was beneficial to the crystallization of TiO2, which probably improved the photocatalytic degradation performance of N-TiO2. However, excessive N addition (n(Ti):n(N) = 1:2, 1:3, 1:4) would reduce the crystallinity due to the nitrogen–oxygen exchange and lattice distortion during the reaction process, and delayed the crystallization process [29]. The average crystal size of N-TiO2 was calculated as 20.04 nm by the Scherrer formula [30]. As can be seen in Figure 3b,c, N-TiO2 nanoparticles appeared spherical morphology with nanosized. Moreover, the surface of the particles was rough and uneven, which could expose a larger area of surface-active sites. In Figure 3d, the interplanar distance of N-TiO2 was calculated as 0.35 nm according to the Bragg equation (2d sinθ = n λ) [31], which corresponds to the {101} crystal plane of TiO2 [32]. As a result, the doping of nitrogen did not affect the dominantly exposed facets of the TiO2.
Tnanoparticles were tested by XPS spectrum, and the results were presented in Figure 4a–c. As can be seen in Figure 4a, the sample contained four elements of C, N, O, and Ti, and the bond energy of the C 1s orbital was 284.95 eV. The presence of element C indicated that the residue of urea might not be completely removed after the calcination of the nanocatalysts. There existed a weak N 1s peak on the surface of the sample, which indicated that N was successfully doped into the TiO2 [33]. In Figure 4b, the bond energy of Ti 2p orbital was 458.48 eV, which is a little different than that of the 459.05 eV of pure TiO2, and the peaks at 464.08 eV attributed to Ti 2p1/2 [34]. Figure 4c shows the N 1s peaks located at 397.98 eV, 399.93 eV, and 403.58 eV [35]. The peak of 399.93 eV indicated that most of the N element doped into the TiO2 lattice in the form of O–Ti-N bonds or N–O-Ti bonds, formed a product similar to NOx [36,37,38]. While the emergence of the peak was at 397.98 eV, the N atom in the crystal successfully replaced the O atom to form a Ti–N-Ti bond [39,40]. The N 1s peak at 403.58 eV indicated that a handful of N elements was adsorbed on the surface of TiO2 in the form of nitrogen-containing compounds, which exhibited no chemical bond associated with TiO2 crystals [41].
Figure 4d illustrates the FT-IR results of N-doped TiO2. The characteristic absorption peak of 600~925 cm−1 refers to the O-Ti-O frame. The absorption peak around 3300~3500 cm−1 should be the O-H stretching vibration of the hydroxyl on the TiO2 surface and the adsorbed water [42]. The narrow peak at 2000~2350 cm−1 was due to the mixing of the N 2p state and the O 2p state in the valence band. The substitution of a N atom for an O atom was conducive to narrowing the band gap of TiO2 and improving the photocatalytic activity under visible light [43]. An absorption peak at about 1750 cm−1 owed TiO2 surface adsorbed water of O-H bending vibration. The anti-symmetric weak peak at 1600 cm-1 belonged to the absorption peak of N-O.
Figure 4e shows the bandgap energy (Eg) of the photocatalyst calculated by the Tauc method through the plot of photon energy (hv) with (Ahv)2 [44]. As confirmed, the band Eg of N-TiO2 was reduced from 3.10 eV of undoped TiO2 to 2.70 eV of N-TiO2 which could be predicted that N-TiO2-1 probably exhibits competitive visible-light-induced photocatalytic activity [45].

3.2. Characterization of PRCM

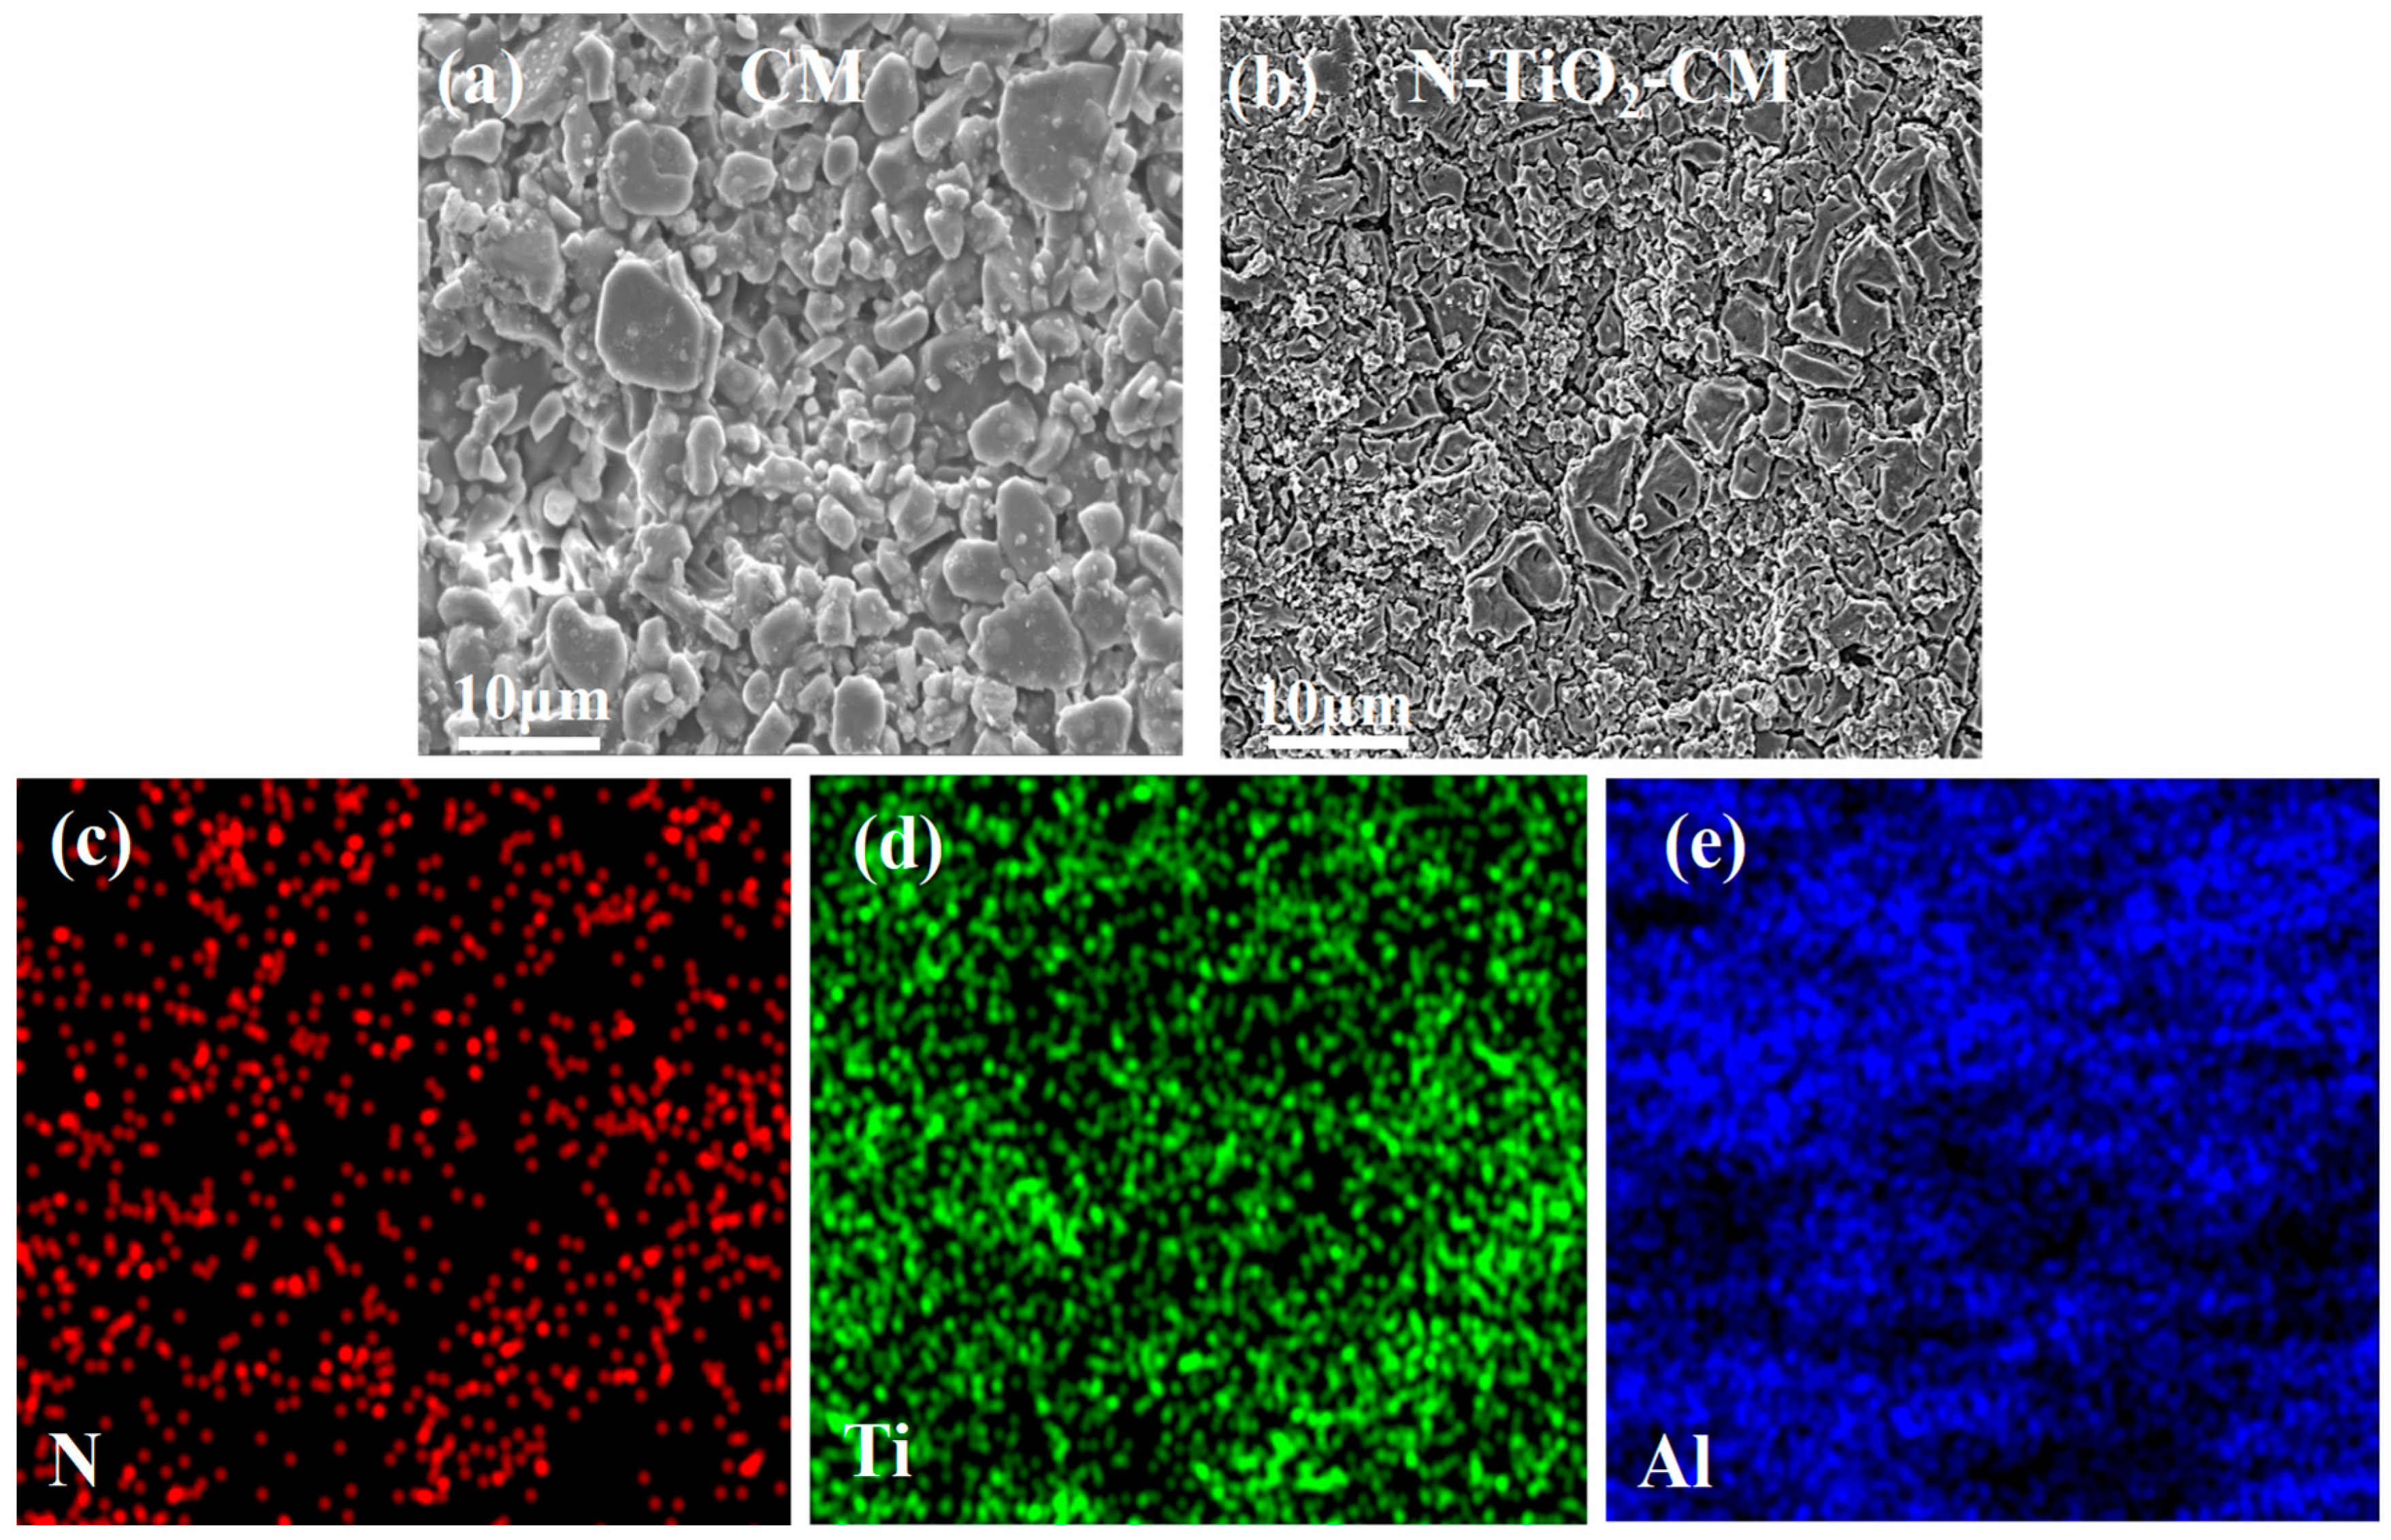
Figure 5a–e are the results of CM (α-Al2O3) and N-TiO2-CM characterized by SEM/EDS. It can be clearly seen from the SEM image of Figure 5a that α-Al2O3 of the ceramic membrane exhibited a lumpy shape and distributed unevenly. Comparatively, blocky films occurred on the surface of the CM because of the loading of N-TiO2 on the CM by the dip-coating method as shown in Figure 5b. The EDS mapping images of Figure 5c,d of the elements of Al in blue, Ti in green, and N in red, indicated that the N-TiO2 was uniformly loaded onto the CM, which successfully formed the N-TiO2-CM.
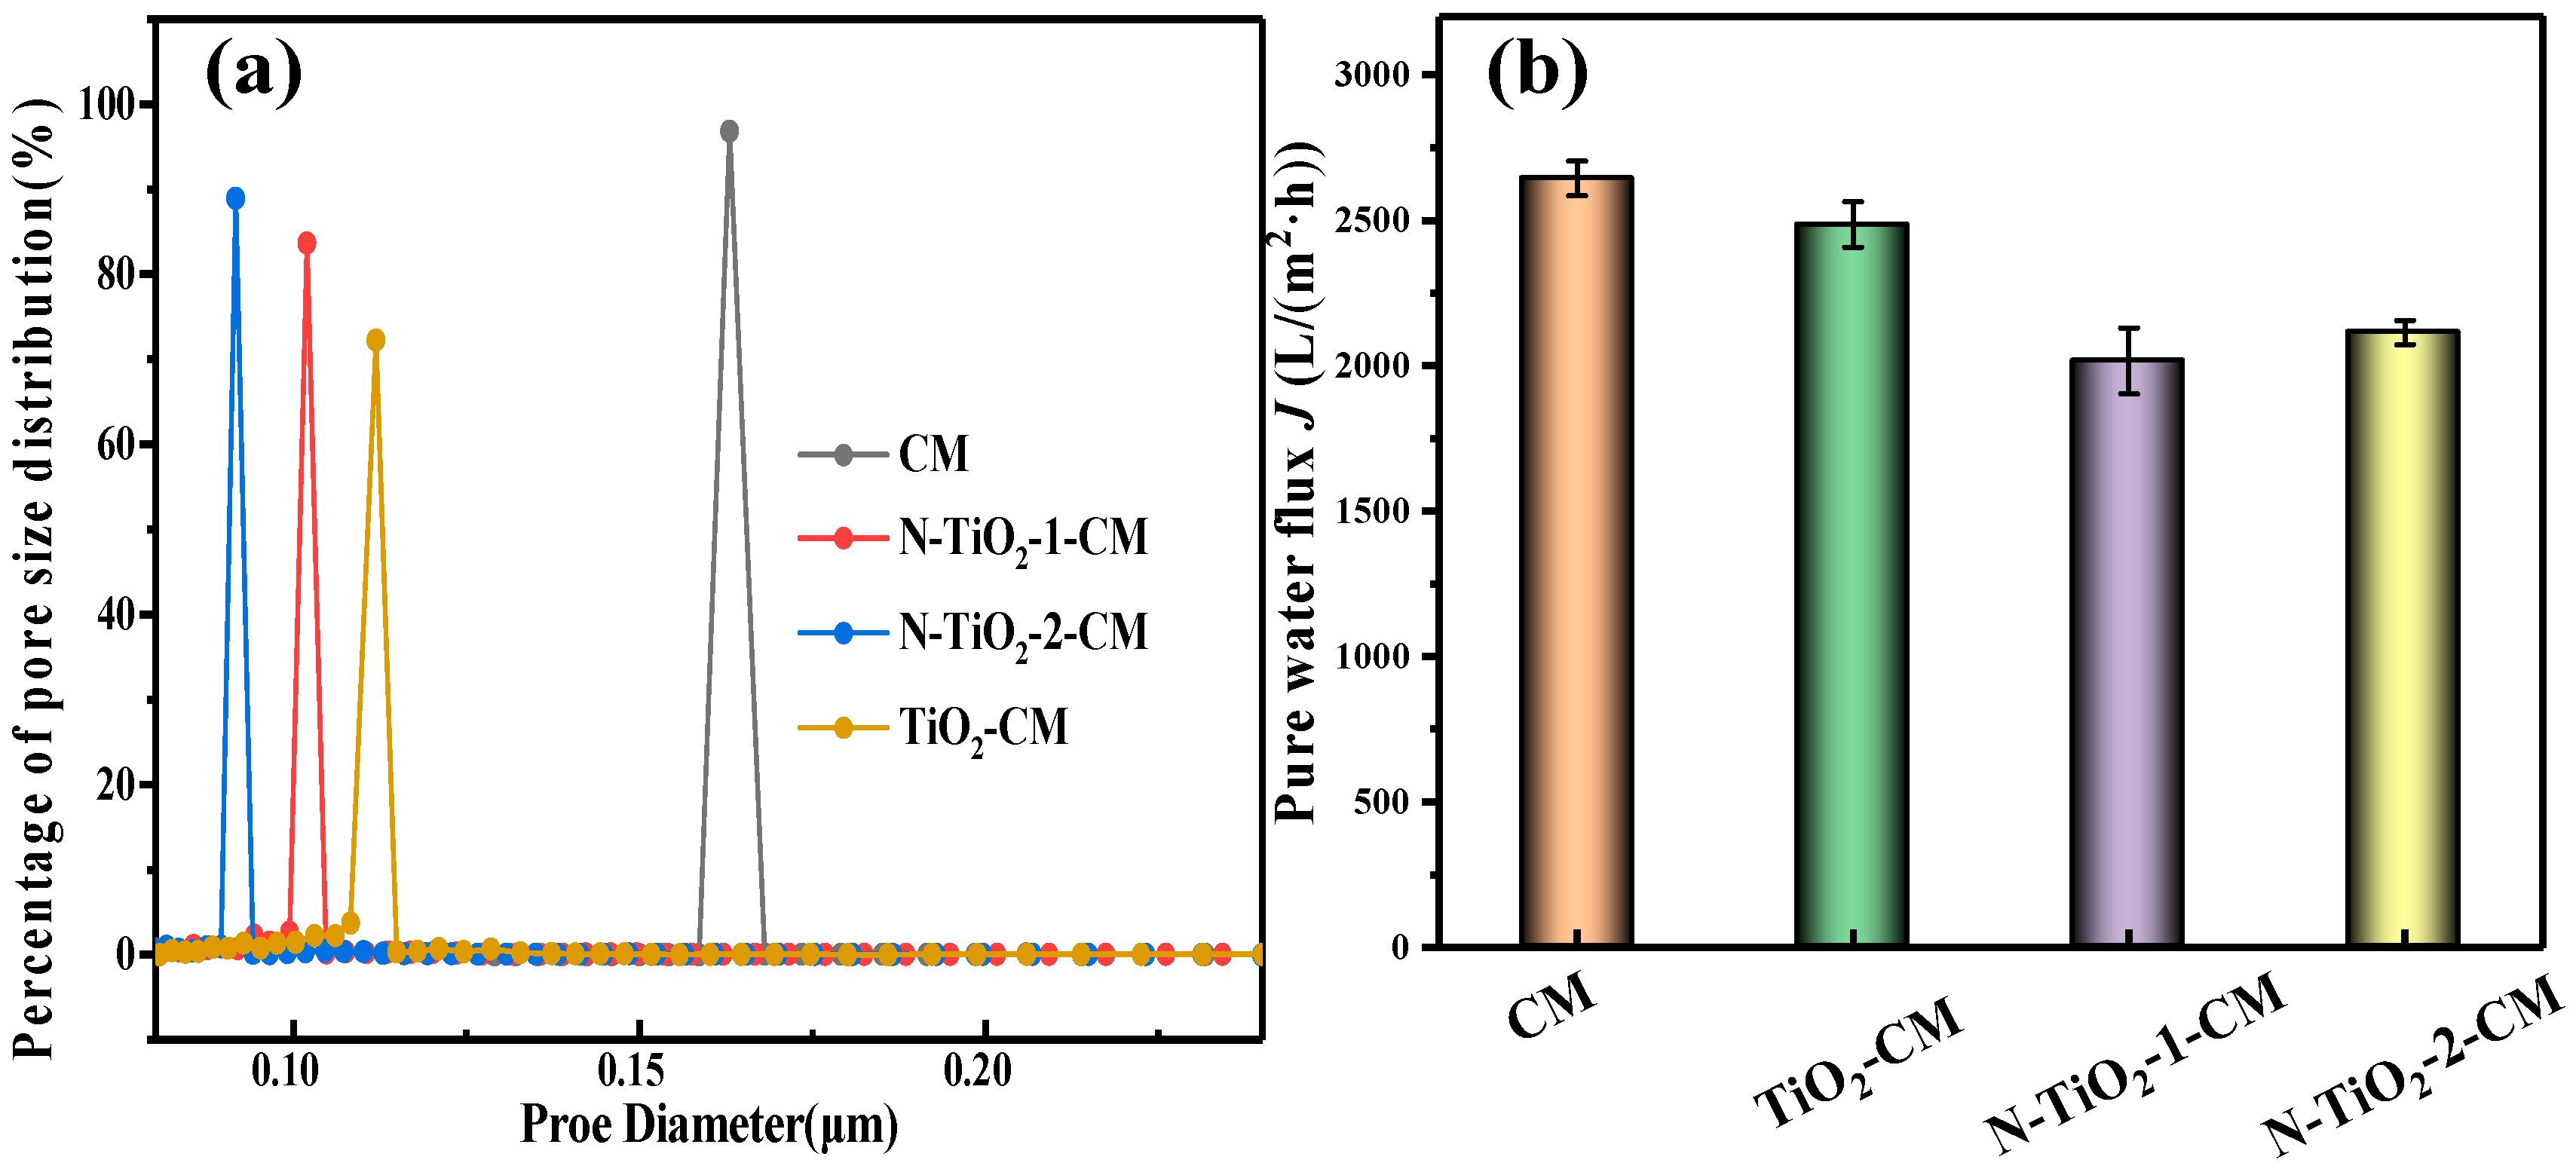
To investigate the influence of supported N-TiO2 catalysts on the pore size distribution of the CM, the pore distribution and pure water flux of CM and PRCM were determined, and the results were summarized in Figure 6a. As displayed in the figure, the pore size of CM is distributed regularly from 0.159 μm to 0.168 μm, which accounts for more than 95% with an average pore diameter of 0.163 μm. Loading photocatalyst on the CM could adversely affect the pore size distribution, and the average pore diameter deceased to TiO2-CM of 0.110 μm, N-TiO2-1-CM of 0.102 μm, and N-TiO2-2-CM of 0.092 μm, respectively. Furthermore, compared with TiO2-CM, the sharper decrease in the pore diameter of N-TiO2-CM is probably attributed to the blocking of the pores of the CM by the urea calcination residues of carbon [46]. To further confirm the blocking effect of the photocatalyst on the CM, the pure water flux of CM and PRCM was detected at room temperature under a trans-membrane pressure (TMP) of −92 kPa. Figure 6b shows the pure water flux of CM was 2644.0 L/(m2 × h), which deceased to TiO2-CM of 2485.2 L/(m2 × h), N-TiO2-1-CM of 2016.2 L/(m2 × h), and N-TiO2-2-CM of 2114.2 L/(m2 × h), respectively. These results are also consistent with pore size distribution results of CM and PRCM, the decrease in pure water flux of PRCM also mainly owing to the covering effect of photocatalyst on the CM [15].

3.3. Performance Evaluation of PRCM

The performance evaluation of PRCM was conducted in a fixed-bed water treatment system shown in Figure 2 for the purification of model MP of TC. Figure 7 and Table S1 illustrate the degradation rate and the first-order kinetics and permeate flux of MP by CM and PRCM. As can be seen in Figure 7, compared with CM without any photocatalyst, the PRCM of TiO2-1-CM, N-TiO2-1-CM, and N-TiO2-2-CM exhibited a much higher degradation rate of TC, and their degradation kinetic constant k was 1.43, 2.33, and 2.57 times as high as that of CM, respectively. Moreover, the removal efficiency of TC by the fixed-bed treatment system of N-TiO2-1-CM and N-TiO2-2-CM could reach 88% and 92% within 270 min. Furthermore, the PRCM also showed a better self-cleaning effect than the CM, and the permeate flux J of the TiO2-CM, N-TiO2-1-CM, and N-TiO2-2-CM was as high as 817.7 L/(m2 × h), 1243.1 L/(m2 × h), and 1286.0 L/(m2 × h), respectively, which is 1.47, 2.23, 2.30 times higher than that of CM of 557.84 L/(m2 × h). These results could be explained by the loading photocatalyst of TiO2, N-TiO2-1, N-TiO2-2 onto CM, the production of active species of hydroxyl radical (•OH), superoxide radical (•O2), etc., in the photocatalysis process that could degrade the TC into small molecule organics, and even into CO2 and H2O, which improved not only the degradation rate of TC but also the permeate flux. Furthermore, the doping of N into the TiO2 could reduce bandgap energy (Eg), improve adsorption of visible light, and lower the recombination of the photogenerated charges, resulting in the higher degradation rate of TC and permeate flux of N-TiO2-x-CM than that of TiO2-CM [47]. Last but not least, the removal efficiency of TC by CM and PRCM in the dark was negligible at no more than 5%; however, under the LED light, the CM exhibited relatively good degradation performance of TC, maybe due to the photocatalytic reaction of its essential component of α-Al2O3 [48].
A comprehensive performance comparison of N-TiO2-x-CM in this work with other PRCM prepared by different methods with different photocatalysts was made, and the results were listed in Table 1. As summarized in the table, the prevailing preparation methods of PRCM include the extrusion method, atomic layer deposition, and dip-coating method by a comparison of PRCM shape and size, pollutants and their initial concentration, water treatment capacity, reaction time, pure water flux, and MP removal efficiency. As compared, the N-TiO2-x-CM prepared in this study exhibited a larger superficial area of 120 cm2 (L × W = 15 × 8 cm), a higher wastewater treatment capacity of 475.8 L/(m2 × h), and pure water flux of 2114.2 L/(m2 × h), and good purification performance of TC with a removal efficiency as high as 92%. Consequently, the N-TiO2-CM in our research reveals obvious advantages of green and facile fabrication, high flux, excellent visible LED light response activity, and easy scale-up for industrial application. The degradation of antibiotics by different treatment processes was compared and listed in Table 2. As noted in Table 2, the PRCM process exhibits higher pollutant removal efficiency, higher treatment capacity, no addition of chemical agents, and a prospect to use solar light, which is more suitable for MP removal at a relatively lower cost than that of other advanced oxidation processes, such as photo-Fenton, ozone oxidation, etc. In addition, PRCM is being developed for the long-term use of solar energy. As a result, the PRCM process is more efficient for the removal of low concentrations of antibiotics.
Table 1. Comprehensive comparison of pollutants treatment performance of the different PRCM.
Membrane TypeLoading MethodPollutantsOther ConditionsShape and Size
of PRCM
Flux of Pure WaterTreatment CapacityReaction TimeRemoval EfficiencyReference
CuO/TiO2-CMExtrusion
method
Ciprofloxacin
(C0 = 0.5 mg/L)
One LED UVA lamp
TMP = 0.2 MPa
4.7 × 10⁻³ m2
Tubular PRCM
(D × L = 1 cm × 15 cm)
218
L/(m2 × h)
25.5
L/(m2 × h)
60 min99.5%[49]
TiO2-CMAtomic layer depositionMethylene blue
(C0 = 1 mg/L)
One UV lights of 365 nm with 10 mW/cm2
TMP = 0.1 MPa
1.8 × 10⁻⁴ m2
Disc PRCM
(D = 1.5 cm)
150
L/(m2 × h)
1666.7
L/(m2 × h)
100 min50%[50]
Ag-TiO2-
CM
Dip-coating methodBisphenol A
(C0 = 10 mg/L)
One 100 W Xe lamp
TMP = 0.2 MPa
1.4 × 10⁻³ m2
Tubular PRCM
(D × L = 1.5 cm × 8 cm)
325
L/(m2 × h)
157.1
L/(m2 × h)
270 min88%[51]
Graphene-TiO2-CMDip-coating methodEstradiol
(C0 = 0.5 mg/L)
One 6 W LED UVA lamp
TMP = 10 MPa
8.8 × 10⁻³ m2
Tubular PRCM
(D × L = 1.4 cm × 20 cm)
90
L/(m2 × h)
90.9
L/(m2 × h)
210 min42.1%[52]
N-TiO2-
CM
Dip-coating methodTetracycline
(C0 = 20 mg/L)
Two 45 W LED UV lamps with 24 µmol/(m2 s)
TMP = −0.092 MPa
1.2 × 10⁻² m2
Planar PRCM
(L × W = 15 × 8 cm)
2114.2
L/(m2 × h)
475.8
L/(m2 × h)
270 min92%This work
Notes: CM refers to ceramic membrane; TMP refers to trans-membrane pressure.

3.4. Photocatalytic Mechanism of PRCM

The types of reactive species promoting TC degradation in the PRCM fixed bed water treatment systems were determined by quenching experiments, in which isopropanol (IPA), ascorbic acid, and disodium ethylenediaminetetraacetic acid disodium salt (EDTA-2Na) were selected as quenching agents for hydroxyl radical (•OH) [57], superoxide radical (•O2), and hole (h+) [58], respectively. As shown in Figure 8, the addition of IPA, ascorbic acid, and EDTA-2Na greatly inhibited the degradation rate of TC, and the k values deceased to 5.4 × 10⁻⁴ min−1, 1.5 × 10⁻³ min−1 and 7.8 × 10⁻⁴ min−1, respectively, and which was 9.8 × 10⁻³ min−1 of that without any quencher. Furthermore, the degradation efficiency of TC of photocatalysis with IPA, and ascorbic acid was only 9.95% and 27.22%, respectively. These results indicated that •OH and •O2- took the main responsibility for the TC degradation in the PRCM system [57,58].
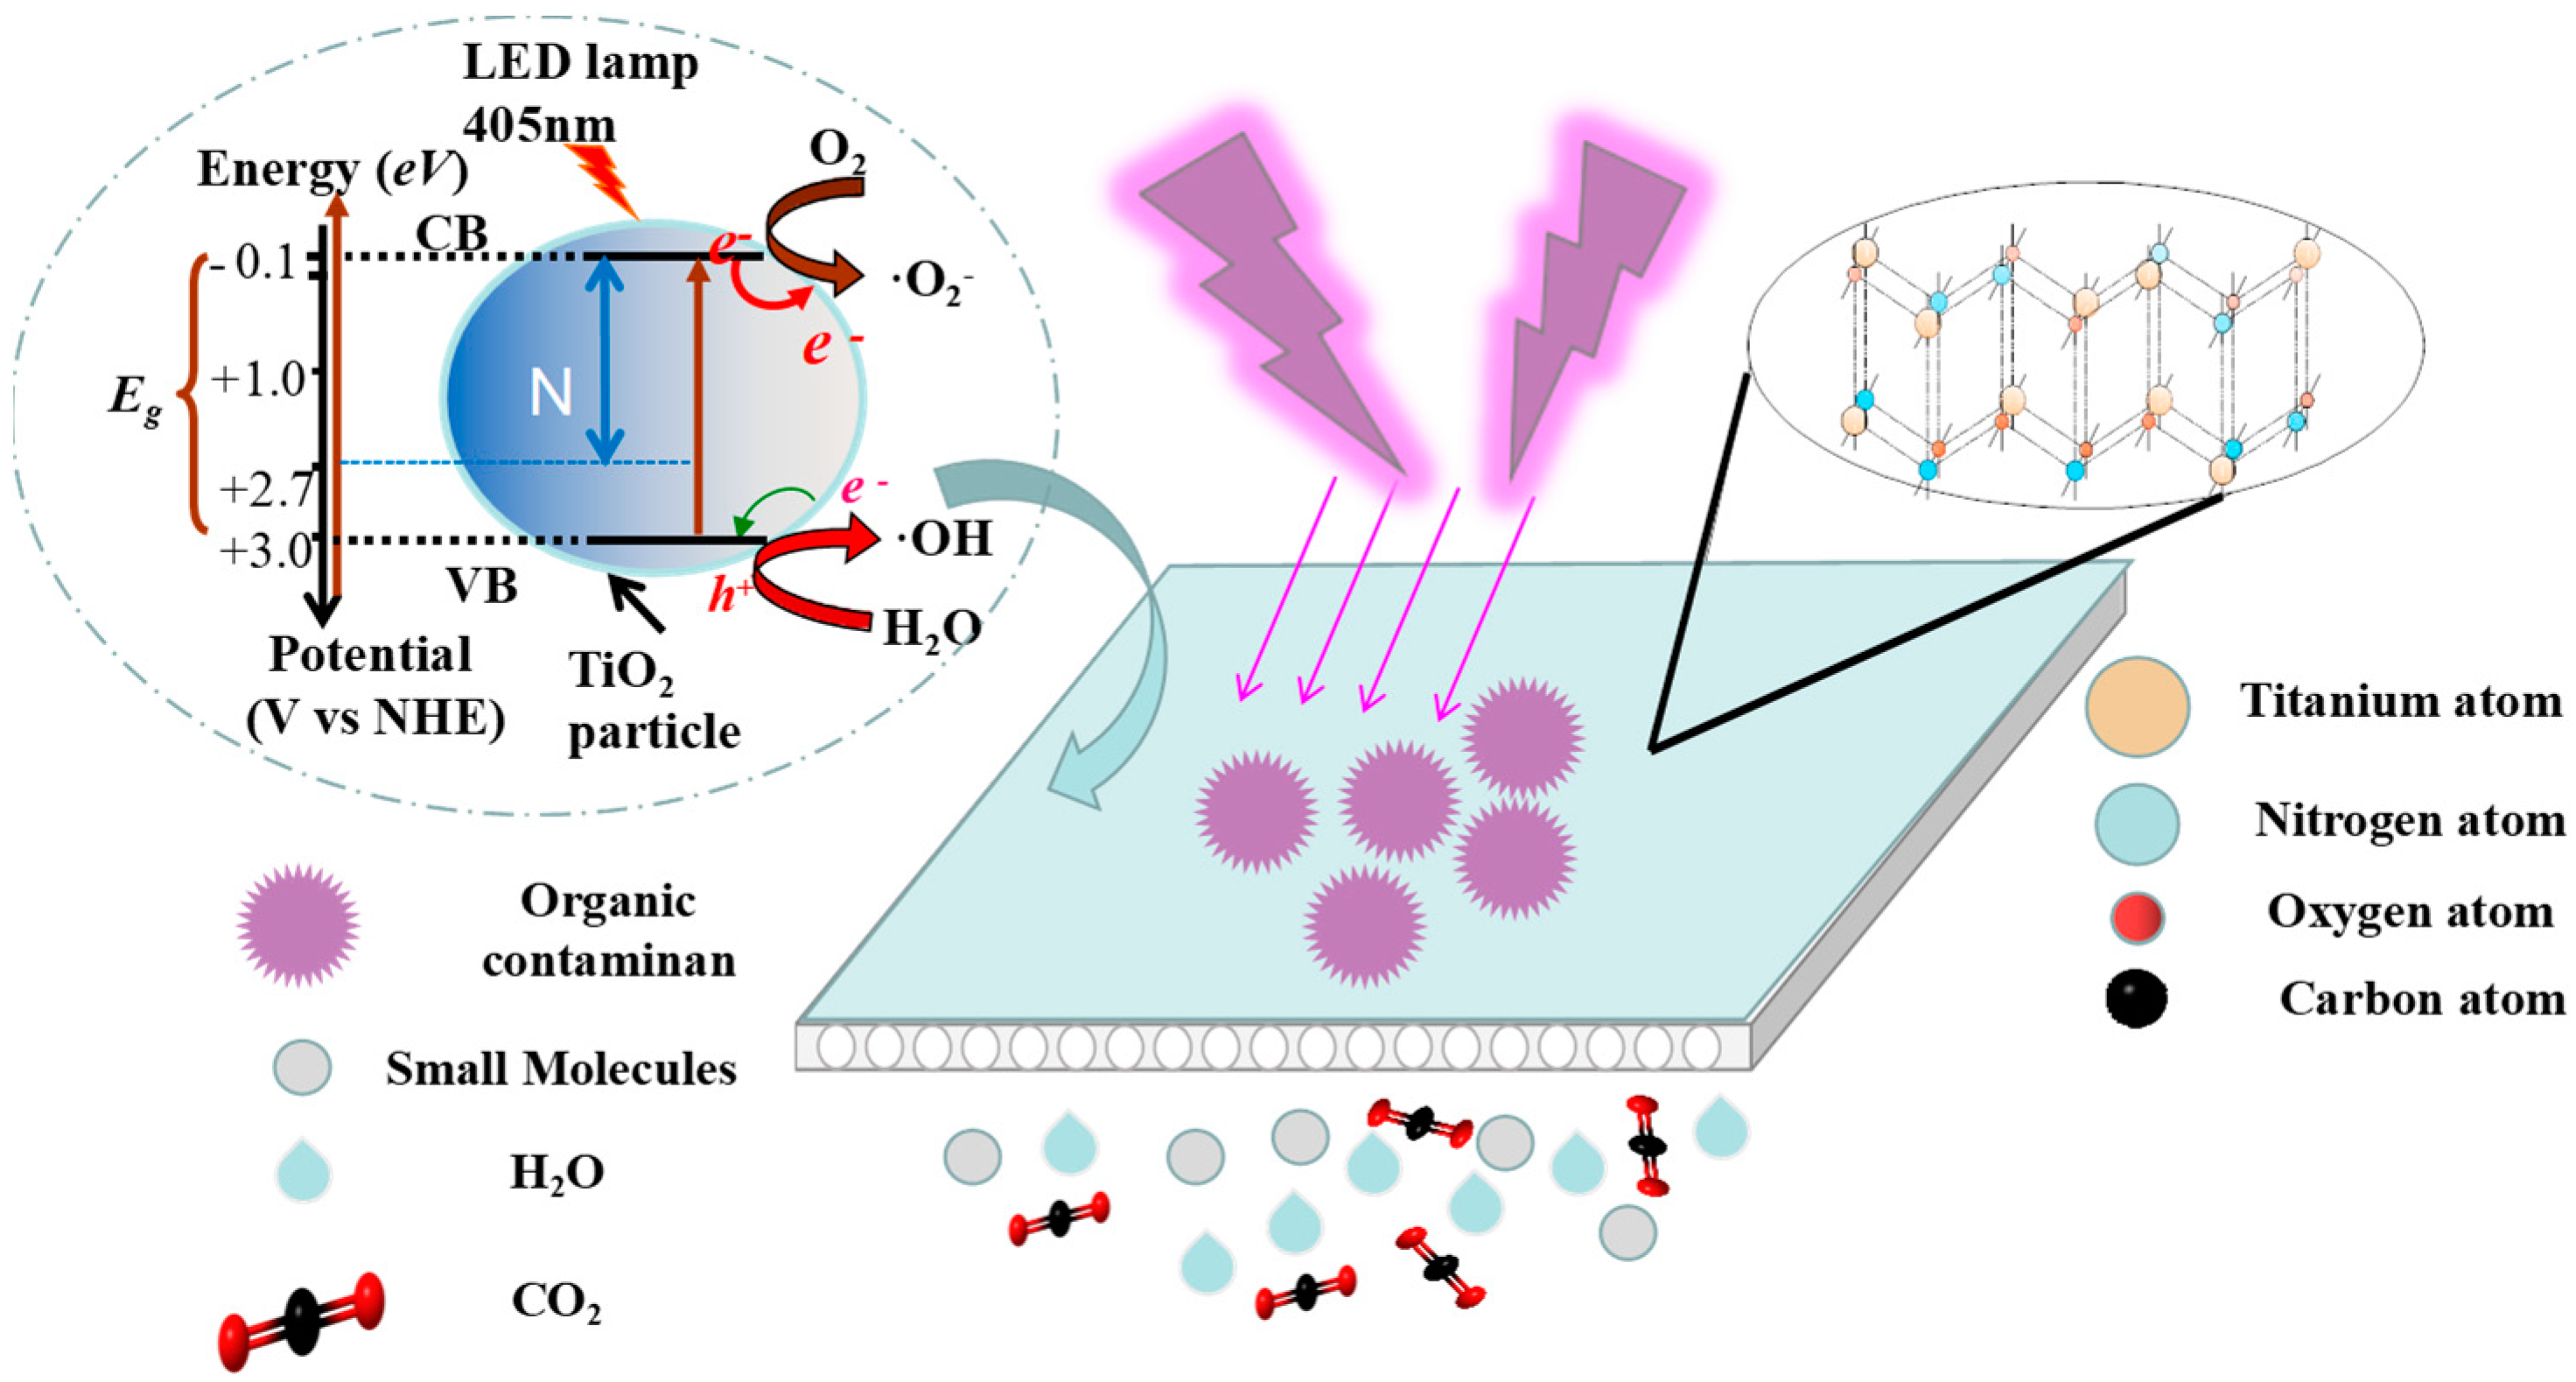
With the help of the above-mentioned quenching experiments, the main reactions of the MP degradation by N-TiO2-x-CM under visible LED light irradiation were summarized as Equations (4)–(8) [46]. In addition, a mechanism diagram for the treatment process was also achieved as shown in Figure 9. The doping of N intoTiO2 lowered its bandgap energy Eg from 3.10 eV to 2.70 eV, which benefits the adsorption of visible LED light to generate more reactive species of •O2 and •OH, etc. [59]. As for the PRCM, the free radicals of •O2 and •OH generated from N-TiO2 photocatalysis could degrade the organic pollutants into small molecule substance, and even mineralize into CO2 and H2O, which improves the permeate flux and reduces the membrane fouling of the CM. Electrostatic attraction or repulsion between the photocatalysts and the organic molecules depends on their surface charge and consequently enhances or inhibits the photodegradation efficiency. It becomes an inhibition of h+ to produce •OH under acidic conditions [60]. Several inorganic ions can improve the photocatalytic activity of N-TiO2 due to its high charge state and small ionic radius [61].
T i O 2 + L E D h T i O 2 + + e T i O 2
O 2 + e T i O 2 · O 2
H 2 O + h T i O 2 + · O H + H +
2 · O H H 2 O 2
· O 2 / · O H + O r g a n i c + O 2 H 2 O + C O 2

3.5. Utilization Proposal of Scale-up N-TiO2-CM

The N-TiO2-CM showed a good visible light response, high catalytic activity, and antipollution performance. According to the laboratory-scale research results of the PRCM in this study, a scale-up design of N-TiO2-CM equipment for organic pollutants treatment was proposed in Figure 10. The pilot application of N-TiO2-CM could be realized by connecting a large number of N-TiO2-CM modules in series and using solar light, which could be used not only in the treatment of MP for drinking water but also in the post-treatment of urban sewage. The prospective research studies in this area are preparation of PRCM with higher utilization efficiency of visible light and better reusable performance. Furthermore, the industrial reactor design and process simulation of the flow field, etc., are urgent.

4. Conclusions

In this work, a large-sized (L × W = 15 cm × 8 cm) planar photocatalytic reactive ceramic membrane (PRCM) with high flux was prepared using a convenient dip-coating method with N-doped TiO2 (N-TiO2-CM). The doping of N into TiO2 reduced its bandgap energy Eg from 3.10 eV to 2.70 eV and benefited the adsorption of visible LED light that improved its photocatalytic activity. The SEM/EDS results indicated that the N-TiO2 was tightly and regularly loaded onto the flat CM, but was averse to its pore size distribution and pure water flux (PWF), and the N-TiO2-CM owned a PWF of 2114.2 L/(m2 × h) under a TMP of −92 kPa. The newly established fixed bed N-TiO2-CM water treatment system with visible LED light (2 × 405 nm) was used for TC removal, and the removal efficiency of TC reached 92% within 270 min with an initial concentration of 20 mg/L. The degradation rate and permeate flux of N-TiO2-CM was 2.57 and 2.30 times as high as that of the CM, indicating its good self-cleaning performance. The quenching experiments suggested that •OH and •O2- were the dominant reactive radicals for TC degradation in the PRCM treatment system. A comprehensive pilot equipment of the PRCM is proposed in this study as a reasonable suggestion for the industrial treatment of water or wastewater and the utilization of solar light.

Supplementary Materials

The following supporting information can be downloaded at: https://www.mdpi.com/article/10.3390/cryst13040651/s1. Figure S1. The removal efficiency (a) and degradation kinetic curve (b) of photocatalysis with TiO2 and N-TiO2 with different doped ratios nanoparticles of Rhodamine B; Figure S2. The effect of coating layers of N-TiO2 on the pure water flux of the PRCM; Table S1. The removal (%), degradation rate constant k and correlation coefficient R2 of degradation performance of TC by the fixed bed treatment system with CM and PRCM loaded with TiO2, N-TiO2-1 and N-TiO2-2.

Author Contributions

X.Z. was responsible for writing original draft, and Z.C. reviewed and revised the manuscript. S.L., X.Z., R.F., Q.X., P.C. and J.X. were responsible for the data collection, analysis and drafting. Z.C., S.L., S.M. and G.F. were responsible for the funding and supervision of the work. All authors contributed to the manuscript. All authors have read and agreed to the published version of the manuscript.

Funding

This research was funded by the Natural Science Foundation of Chongqing, China (cstc2020jcyj-msxmX0308, cstc2020jcyj-msxmX0115), the National Natural Science Foundation of China (51905055), the Youth Project of Science and Technology Research Program of Chongqing Education Commission of China (KJQN202001148), and the Innovation Project of Chongqing University of Technology (gzlcx 20223143, 2022CX108). Here we sincerely thank all the sponsors.

Institutional Review Board Statement

Not applicable.

Data Availability Statement

Not applicable.

Conflicts of Interest

The authors declare no conflict of interest.

References

  1. Kang, W.; Chen, S.; Yu, H.; Xu, T.; Liang, H. Photocatalytic ozonation of organic pollutants in wastewater using a flowing through reactor. J. Hazard. Mater. 2020, 405, 124277. [Google Scholar] [CrossRef] [PubMed]
  2. Peng, F.J.; Emond, C.; Hardy, E.M.; Sauvageot, N.; Appenzeller, B. Population-based biomonitoring of exposure to persistent and non-persistent organic pollutants in the Grand Duchy of Luxembourg: Results from hair analysis. Environ. Int. 2021, 153, 106526. [Google Scholar] [CrossRef] [PubMed]
  3. Martí-Calatayud, M.C.; Heßler, R.; Schneider, S.; Bohner, C.; Yüce, S.; Wessling, M.; de Sena, R.F.; Athayde Júnior, G.B. Transients of micropollutant removal from high-strength wastewaters in PAC-assisted MBR and MBR coupled with high-retention membranes. Sep. Purif. Technol. 2020, 246, 116863. [Google Scholar] [CrossRef]
  4. Egea-Corbacho, A.; Martín-García, A.P.; Franco, A.A.; Quiroga, J.M.; Andreasen, R.R.; Jørgensen, M.K.; Christensen, M.L. Occurrence, identification and removal of microplastics in a Wastewater Treatment Plant compared to an advanced MBR technology: Full-scale pilot plant. J. Environ. Chem. Eng. 2023, 11, 109644. [Google Scholar] [CrossRef]
  5. Vasilachi, I.C.; Asiminicesei, D.M.; Fertu, D.I.; Gavrilescu, M. Occurrence and fate of emerging pollutants in water environment and options for their removal. Water 2021, 13, 181. [Google Scholar] [CrossRef]
  6. Liu, C.; Li, P.; Tang, X.; Korshin, G.V. Ozonation effects on emerging micropollutants and effluent organic matter in wastewater: Characterization using changes of three-dimensional HP-SEC and EEM fluorescence data. Environ. Sci. Pollut. Res. 2016, 23, 20567–20579. [Google Scholar] [CrossRef]
  7. Chavoshani, A.; Hashemi, M.; Amin, M.M.; Ameta, S.C. Pharmaceuticals as emerging micropollutants in aquatic environments. In Micropollutants and Challenges; Elsevier: Amsterdam, The Netherlands, 2020; pp. 35–90. [Google Scholar]
  8. Büning, B.; Rechtenbach, D.; Behrendt, J.; Otterpohl, R. Removal of Emerging Micropollutants from Wastewater by Nanofiltration and Biofilm Reactor (MicroStop). Environ. Prog. Sustain. Energy 2020, 40, 13587. [Google Scholar] [CrossRef]
  9. Ws, A.; Lai, Y.; Hyna, B. Nanofiltration and reverse osmosis processes for the removal of micro-pollutants. In Current Developments in Biotechnology and Bioengineering; Elsevier: Amsterdam, The Netherlands, 2020; pp. 527–552. [Google Scholar]
  10. Amin, M.T.; Alazba, A.A.; Manzoor, U. A review of removal of pollutants from water/wastewater using different types of nanomaterials. Adv. Mater. Sci. Eng. 2014, 2014, 825910. [Google Scholar] [CrossRef] [Green Version]
  11. Zhang, B.; Zhang, R.; Huang, D.; Shen, Y.; Shi, W. Membrane fouling in microfiltration of alkali/surfactant/polymer flooding oilfield wastewater: Effect of interactions of key foulants. J. Colloid Interface Sci. 2020, 570, 20–30. [Google Scholar] [CrossRef]
  12. PhD, A.M.N.; Adam, M.R.; Kamal, S.N.E.A.; Jaafar, J.; Othman, M.H.D. A review of the potential of conventional and advanced membrane technology in the removal of pathogens from wastewater. Sep. Purif. Technol. 2022, 286, 120454. [Google Scholar]
  13. Abdel-Shafy, H.I.; El-Khateeb, M.A.; Mansour, M.S. Treatment of leather industrial wastewater via combined advanced oxidation and membrane filtration. Water Sci. Technol. 2016, 74, 586–594. [Google Scholar] [CrossRef] [PubMed]
  14. Wang, X.; Li, F.; Hu, X.; Hua, T. Electrochemical advanced oxidation processes coupled with membrane filtration for degrading antibiotic residues: A review on its potential applications, advances, and challenges. Sci. Total Environ. 2021, 784, 146912. [Google Scholar] [CrossRef] [PubMed]
  15. Yan, C.; Cheng, Z.; Wei, J.; Xu, Q.; Zhang, X.; Wei, Z. Efficient degradation of antibiotics by photo-Fenton reactive ceramic membrane with high flux by a facile spraying method under visible LED light. J. Clean. Prod. 2022, 366, 132849. [Google Scholar] [CrossRef]
  16. Oliveira, C.; Viana, M.M.; Amaral, M. Coupling photocatalytic degradation using a green TiO2 catalyst to membrane bioreactor for petroleum refinery wastewater reclamation. J. Water Process Eng. 2020, 34, 101093. [Google Scholar] [CrossRef]
  17. Nasrollahi, N.; Ghalamchi, L.; Vatanpour, V.; Khataee, A. Photocatalytic-membrane technology: A critical review for membrane fouling mitigation. J. Ind. Eng. Chem. 2021, 93, 101–116. [Google Scholar] [CrossRef]
  18. Wang, M.; Xu, Z.; Hou, Y.; Li, P.; Sun, H.; Niu, Q.J. Photo-Fenton assisted self-cleaning hybrid ultrafiltration membranes with high-efficient flux recovery for wastewater remediation. Sep. Purif. Technol. 2020, 249, 117159. [Google Scholar] [CrossRef]
  19. Chen, G.; Yu, Y.; Liang, L.; Duan, X.; Wang, S. Remediation of antibiotic wastewater by coupled photocatalytic and persulfate oxidation system: A critical review. J. Hazard. Mater. 2020, 408, 124461. [Google Scholar] [CrossRef]
  20. Scaratti, G.; De Noni Júnior, A.; José, H.J.; de Fatima Peralta Muniz Moreira, R. 1,4-Dioxane removal from water and membrane fouling elimination using CuO-coated ceramic membrane coupled with ozone. Environ. Sci. Pollut. Res. 2020, 27, 22144–22154. [Google Scholar] [CrossRef]
  21. Xu, T.; Cui, L.; Li, H.; Zou, P.; Liang, J. Effects of electrolytic oxidation for mitigating ultrafiltration membrane fouling caused by different natural organic matter fractions. Environ. Sci. Water Res. Technol. 2020, 6, 645–655. [Google Scholar] [CrossRef]
  22. Jiang, Z.; Cheng, Z.; Yan, C.; Zhang, X.; Tian, Y.; Zhang, X.; Quan, X. Simultaneous Removal of Nitrogen and Refractory Organics from a Biologically Treated Leachate by Pulse Electrochemical Oxidation in a Multi-channel Flow Reactor. ACS Omega 2021, 6, 25539–25550. [Google Scholar] [CrossRef]
  23. Le, D.T.; Luong, N.S.; Ngo, V.D.; Tien, N.M.; Dung, T.N.; Nghia, N.M.; Loc, N.T.; Thu, V.T.; Lam, T.D. Highly Visible Light Activity of Nitrogen Doped TiO2 Prepared by Sol-Gel Approach. J. Electron. Mater. 2016, 46, 158–166. [Google Scholar]
  24. Wei, W.A.; Mot, A.; Zsa, B. Nitrogen-doped simple and complex oxides for photocatalysis: A review. Prog. Mater. Sci. 2018, 92, 33–63. [Google Scholar]
  25. Yu, C.; Fan, C.; Meng, X.; Kai, Y.; Cao, F.; Xin, L. A novel Ag/BiOBr nanoplate catalyst with high photocatalytic activity in the decomposition of dyes. React. Kinet. Mech. Catal. 2011, 103, 141–151. [Google Scholar] [CrossRef]
  26. Lecorre, D.; Bras, J.; Dufresne, A. Ceramic membrane filtration for isolating starch nanocrystals-ScienceDirect. Carbohyd. Polym. 2011, 86, 1565–1572. [Google Scholar] [CrossRef]
  27. Biswas, N.K.; Srivastav, A.; Saxena, S.; Verma, A.; Dutta, R. N-TiO2 crystal seeds incorporated in amorphous matrix for enhanced solar hydrogen generation: Experimental & first-principles analysis. Int. J. Hydrogen Energy 2022, 47, 22415–22429. [Google Scholar]
  28. He, Y.; Zhang, X.; Wei, Y.; Chen, X.; Wang, Z.; Yu, R. Ti-MOF derived N-Doped TiO2 nanostructure as visible-light-driven photocatalyst. Chem. Res. Chin. Univ. 2020, 36, 447–452. [Google Scholar] [CrossRef]
  29. Assayehegn, E.; Solaiappan, A.; Chebude, Y.; Alemayehu, E. Fabrication of tunable anatase/rutile heterojunction N/TiO2 nanophotocatalyst for enhanced visible light degradation activity. Appl. Surf. Sci. 2020, 515, 145966. [Google Scholar] [CrossRef]
  30. Mehdizadeh, P.; Tavangar, Z.; Shabani, N.; Hamadanian, M. Visible light activity of nitrogen-doped TiO2 by sol-gel method using various nitrogen sources. J. Nanostruct. 2020, 10, 307–316. [Google Scholar]
  31. Divya, G.; Jaishree, G.; Rao, T.S.; Chippada, M.L.V.P.; Lakshmi, K.V.D.; Supriya, S.S. Improved catalytic efficiency by N-doped TiO2 via sol gel under microwave irradiation: Dual applications in degradation of dye and microbes. Hybrid Adv. 2022, 1, 100010. [Google Scholar] [CrossRef]
  32. Yu, Y.; Xia, J.; Chen, C.; Chen, H.; Geng, J.; Li, H. One-step synthesis of a visible-light driven C@N-TiO2 porous nanocomposite: Enhanced absorption, photocatalytic and photoelectrochemical performance. J. Phys. Chem. Solids 2020, 136, 109169. [Google Scholar] [CrossRef]
  33. Zeng, X.; Sun, X.; Wang, Y. Photocatalytic degradation of flumequine by N-doped TiO2 catalysts under simulated sunlight. Environ. Eng. Res. 2021, 26, 200524. [Google Scholar] [CrossRef]
  34. Berktaş, A.; Kartal, Ö.E. Decolorization of Reactive Black 5 Using N-Doped TiO2. Gazi Univ. J. Sci. 2022, 35, 360–370. [Google Scholar] [CrossRef]
  35. Chng, E.; Sahrin, N.T.; Nawaz, R.; Kait, C.F.; Lee, S.L. Glycerol-assisted sol-gel synthesis of Nitrogen-doped Titanium dioxide for visible light-driven photodegradation of indoor gaseous formaldehyed. Platf. J. Sci. Technol. 2021, 4, 17–31. [Google Scholar]
  36. Yang, X.; Jia, Q.; Pang, J.; Yang, Y.; Zheng, S.; Jia, J.; Qin, Z. Hierarchical porous N-TiO2/carbon foam composite for enhancement of photodegradation activity under simulated sunlight. Diam. Relat. Mater. 2022, 128, 109234. [Google Scholar] [CrossRef]
  37. Zhao, F.; Li, X.; Zuo, M.; Liang, Y.; Qin, P.; Wang, H.; Wu, Z.; Luo, L.; Liu, C.; Leng, L. Preparation of photocatalysts decorated by carbon quantum dots (CQDs) and their applications: A review. J. Environ. Chem. Eng. 2023, 11, 109487. [Google Scholar] [CrossRef]
  38. Yadav, V.; Sharma, H.; Rana, A.; Saini, V.K. Facile synthesis of boron and nitrogen doped TiO2 as effective catalysts for photocatalytic degradation of emerging micro-pollutants. J. Ind. Eng. Chem. 2022, 107, 126–136. [Google Scholar] [CrossRef]
  39. Fazio, E.; Mezzasalma, A.M.; Urso, L.D.; Spadaro, S.; Barreca, F.; Gallo, G.; Neri, F.; Compagnini, G. N-TiO2-x nanocatalysts: PLAL synthesis and photocatalytic activity. J. Nanomater. 2020, 2020, 2901516. [Google Scholar] [CrossRef]
  40. Mhemid, R.K.S.; Salman, M.S.; Mohammed, N.A. Comparing the efficiency of N-doped TiO2 and commercial TiO2 as photo catalysts for amoxicillin and ciprofloxacin photo-degradation under solar irradiation. J. Environ. Sci. Health Part A 2022, 57, 813–829. [Google Scholar] [CrossRef] [PubMed]
  41. Ye, B.; Lee, M.; Chun, S.; Lee, G.; Kim, J.; Jeong, B.; Kim, T.; Hong-Dae, K. Promotional effect of surface treated N-TiO2 as support for VOx-based catalysts on the selective catalytic reduction of NO using NH3. Appl. Surf. Sci. 2021, 560, 149934. [Google Scholar] [CrossRef]
  42. Krishnan, S.; Karim, A.V.; Shriwastav, A. Visible light responsive Cu-N/TiO2 nanoparticles for the photocatalytic degradation of bisphenol A. Water Sci. Technol. 2022, 86, 1527–1539. [Google Scholar] [CrossRef]
  43. Liu, F.; Cao, H.; Xu, L.; Fu, H.; Sun, S.; Xiao, Z.; Sun, C.; Long, X.; Xia, Y.; Wang, S. Design and preparation of highly active TiO2 photocatalysts by modulating their band structure. J. Colloid Interface Sci. 2023, 629, 336–344. [Google Scholar] [CrossRef] [PubMed]
  44. Raza, N.; Raza, W.; Gul, H.; Azam, M.; Kim, K.H. Solar-light-active silver phosphate/titanium dioxide/silica heterostructures for photocatalytic removal of organic dye. J. Clean. Prod. 2020, 254, 120031. [Google Scholar] [CrossRef]
  45. Bensouici, F.; Bououdina, M.; Dakhel, A.A.; Tala-Ighil, R.; Tounane, M.; Iratni, A.; Souier, T.; Liu, S.; Cai, W. Optical, structural and photocatalysis properties of Cu-doped TiO2 thin films. Appl. Surf. Sci. 2017, 395, 110–116. [Google Scholar] [CrossRef]
  46. Ansari, S.A.; Khan, M.M.; Ansari, M.O.; Cho, M.H. Nitrogen-doped titanium dioxide (N-doped TiO2) for visible light photocatalysis. New J. Chem. 2016, 40, 3000–3009. [Google Scholar] [CrossRef]
  47. Nolan, N.T.; Synnott, D.W.; Seery, M.K.; Hinder, S.J.; Van Wassenhoven, A.; Pillai, S.C. Effect of N-doping on the photocatalytic activity of sol-gel TiO2. J. Hazard. Mater. 2012, 211, 88–94. [Google Scholar] [CrossRef] [Green Version]
  48. Pathania, D.; Katwal, R.; Sharma, G.; Naushad, M.; Khan, M.R.; Ala’a, H. Novel guar gum/Al2O3 nanocomposite as an effective photocatalyst for the degradation of malachite green dye. Int. J. Biol. Macromol. 2016, 87, 366–374. [Google Scholar] [CrossRef]
  49. Bhattacharya, P.; Mukherjee, D.; Dey, S.; Ghosh, S.; Banerjee, S. Development and performance evaluation of a novel CuO/TiO2 ceramic ultrafiltration membrane for ciprofloxacin removal. Mater. Chem. Phys. 2019, 229, 106–116. [Google Scholar] [CrossRef]
  50. Berger, T.E.; Regmi, C.; Schfer, A.I.; Richards, B.S. Photocatalytic degradation of organic dye via atomic layer deposited TiO2-ceramic membranes in single-pass flow-through operation. J. Membr. Sci. 2020, 604, 118015. [Google Scholar] [CrossRef]
  51. Shareef, U.; Othman, M.; Ismail, A.F.; Jilani, A. Facile removal of bisphenol A from water through novel Ag-doped TiO2 photocatalytic hollow fiber ceramic membrane. J. Australas. Ceram. Soc. 2020, 56, 29–39. [Google Scholar] [CrossRef]
  52. Presumido, P.H.; Santos, L.; Neuparth, T.; Santos, M.M.; Feliciano, M.; Primo, A.; Garcia, H.; B-Oli, M.; Vilar, V. A Novel ceramic tubular membrane coated with a continuous graphene-TiO2 nanocomposite thin-film for CECs mitigation. Chem. Eng. J. 2022, 430, 132639. [Google Scholar] [CrossRef]
  53. Verinda, S.B.; Muniroh, M.; Yulianto, E.; Maharani, N.; Gunawan, G.; Amalia, N.F.; Hobley, J.; Usman, A.; Nur, M. Degradation of ciprofloxacin in aqueous solution using ozone microbubbles: Spectroscopic, kinetics, and antibacterial analysis. Heliyon 2022, 8, 10137. [Google Scholar] [CrossRef] [PubMed]
  54. Arvaniti, O.S.; Frontistis, Z.; Nika, M.C.; Aalizadeh, R.; Thomaidis, N.S.; Mantzavinos, D. Sonochemical degradation of trimethoprim in water matrices: Effect of operating conditions, identification of transformation products and toxicity assessment. Ultrason. Sonochem. 2020, 67, 105139. [Google Scholar] [CrossRef] [PubMed]
  55. Brito, L.R.D.; Ganiyu, S.O.; Santos, E.V.D.; Oturan, M.A.; Martínez-Huitle, C.A. Removal of antibiotic rifampicin from aqueous media by advanced electrochemical oxidation: Role of electrode materials, electrolytes and real water matrices. Electrochim. Acta 2021, 396, 139254. [Google Scholar] [CrossRef]
  56. Dhawle, R.; Mantzavinos, D.; Lianos, P. UV/H2O2 degradation of diclofenac in a photocatalytic fuel cell. Appl. Catal. B Environ. 2021, 299, 120706. [Google Scholar] [CrossRef]
  57. Zhao, J.; Wang, Y.; Liu, H.; Wu, Y.; Dong, W. Discrepant oxidation behavior of ferric ion and hydroxyl radical on syringic acid and vanillic acid in atmospheric Fenton-like system. Chemosphere 2022, 287, 132022. [Google Scholar] [CrossRef] [PubMed]
  58. Zhou, K.; Liu, Y.; Hao, J. One-pot hydrothermal synthesis of dual Z-scheme BiOBr/g-C3N4/Bi2WO6 and photocatalytic degradation of tetracycline under visible light. Mater. Lett. 2020, 281, 128463. [Google Scholar] [CrossRef]
  59. Xue, L.; An, F.; Yang, Y.; Ma, Y. Synthesis of N-TiO2/BiOI/RGO composites with significantly enhanced visible light photocatalytic activity. J. Mater. Res. 2020, 35, 153–161. [Google Scholar] [CrossRef]
  60. Hadi, H.M.; Wahab, H.S. Visible light photocatalytic decolourization of methyl orange using N-doped TiO2 nanoparticles. Al-Nahrain J. Sci. 2015, 18, 1–9. [Google Scholar] [CrossRef]
  61. Wang, S.Q.; Liu, W.B.; Fu, P.; Cheng, W.L. Enhanced photoactivity of N-doped TiO2 for Cr (VI) removal: Influencing factors and mechanism. Korean J. Chem. Eng. 2017, 34, 1584–1590. [Google Scholar] [CrossRef]
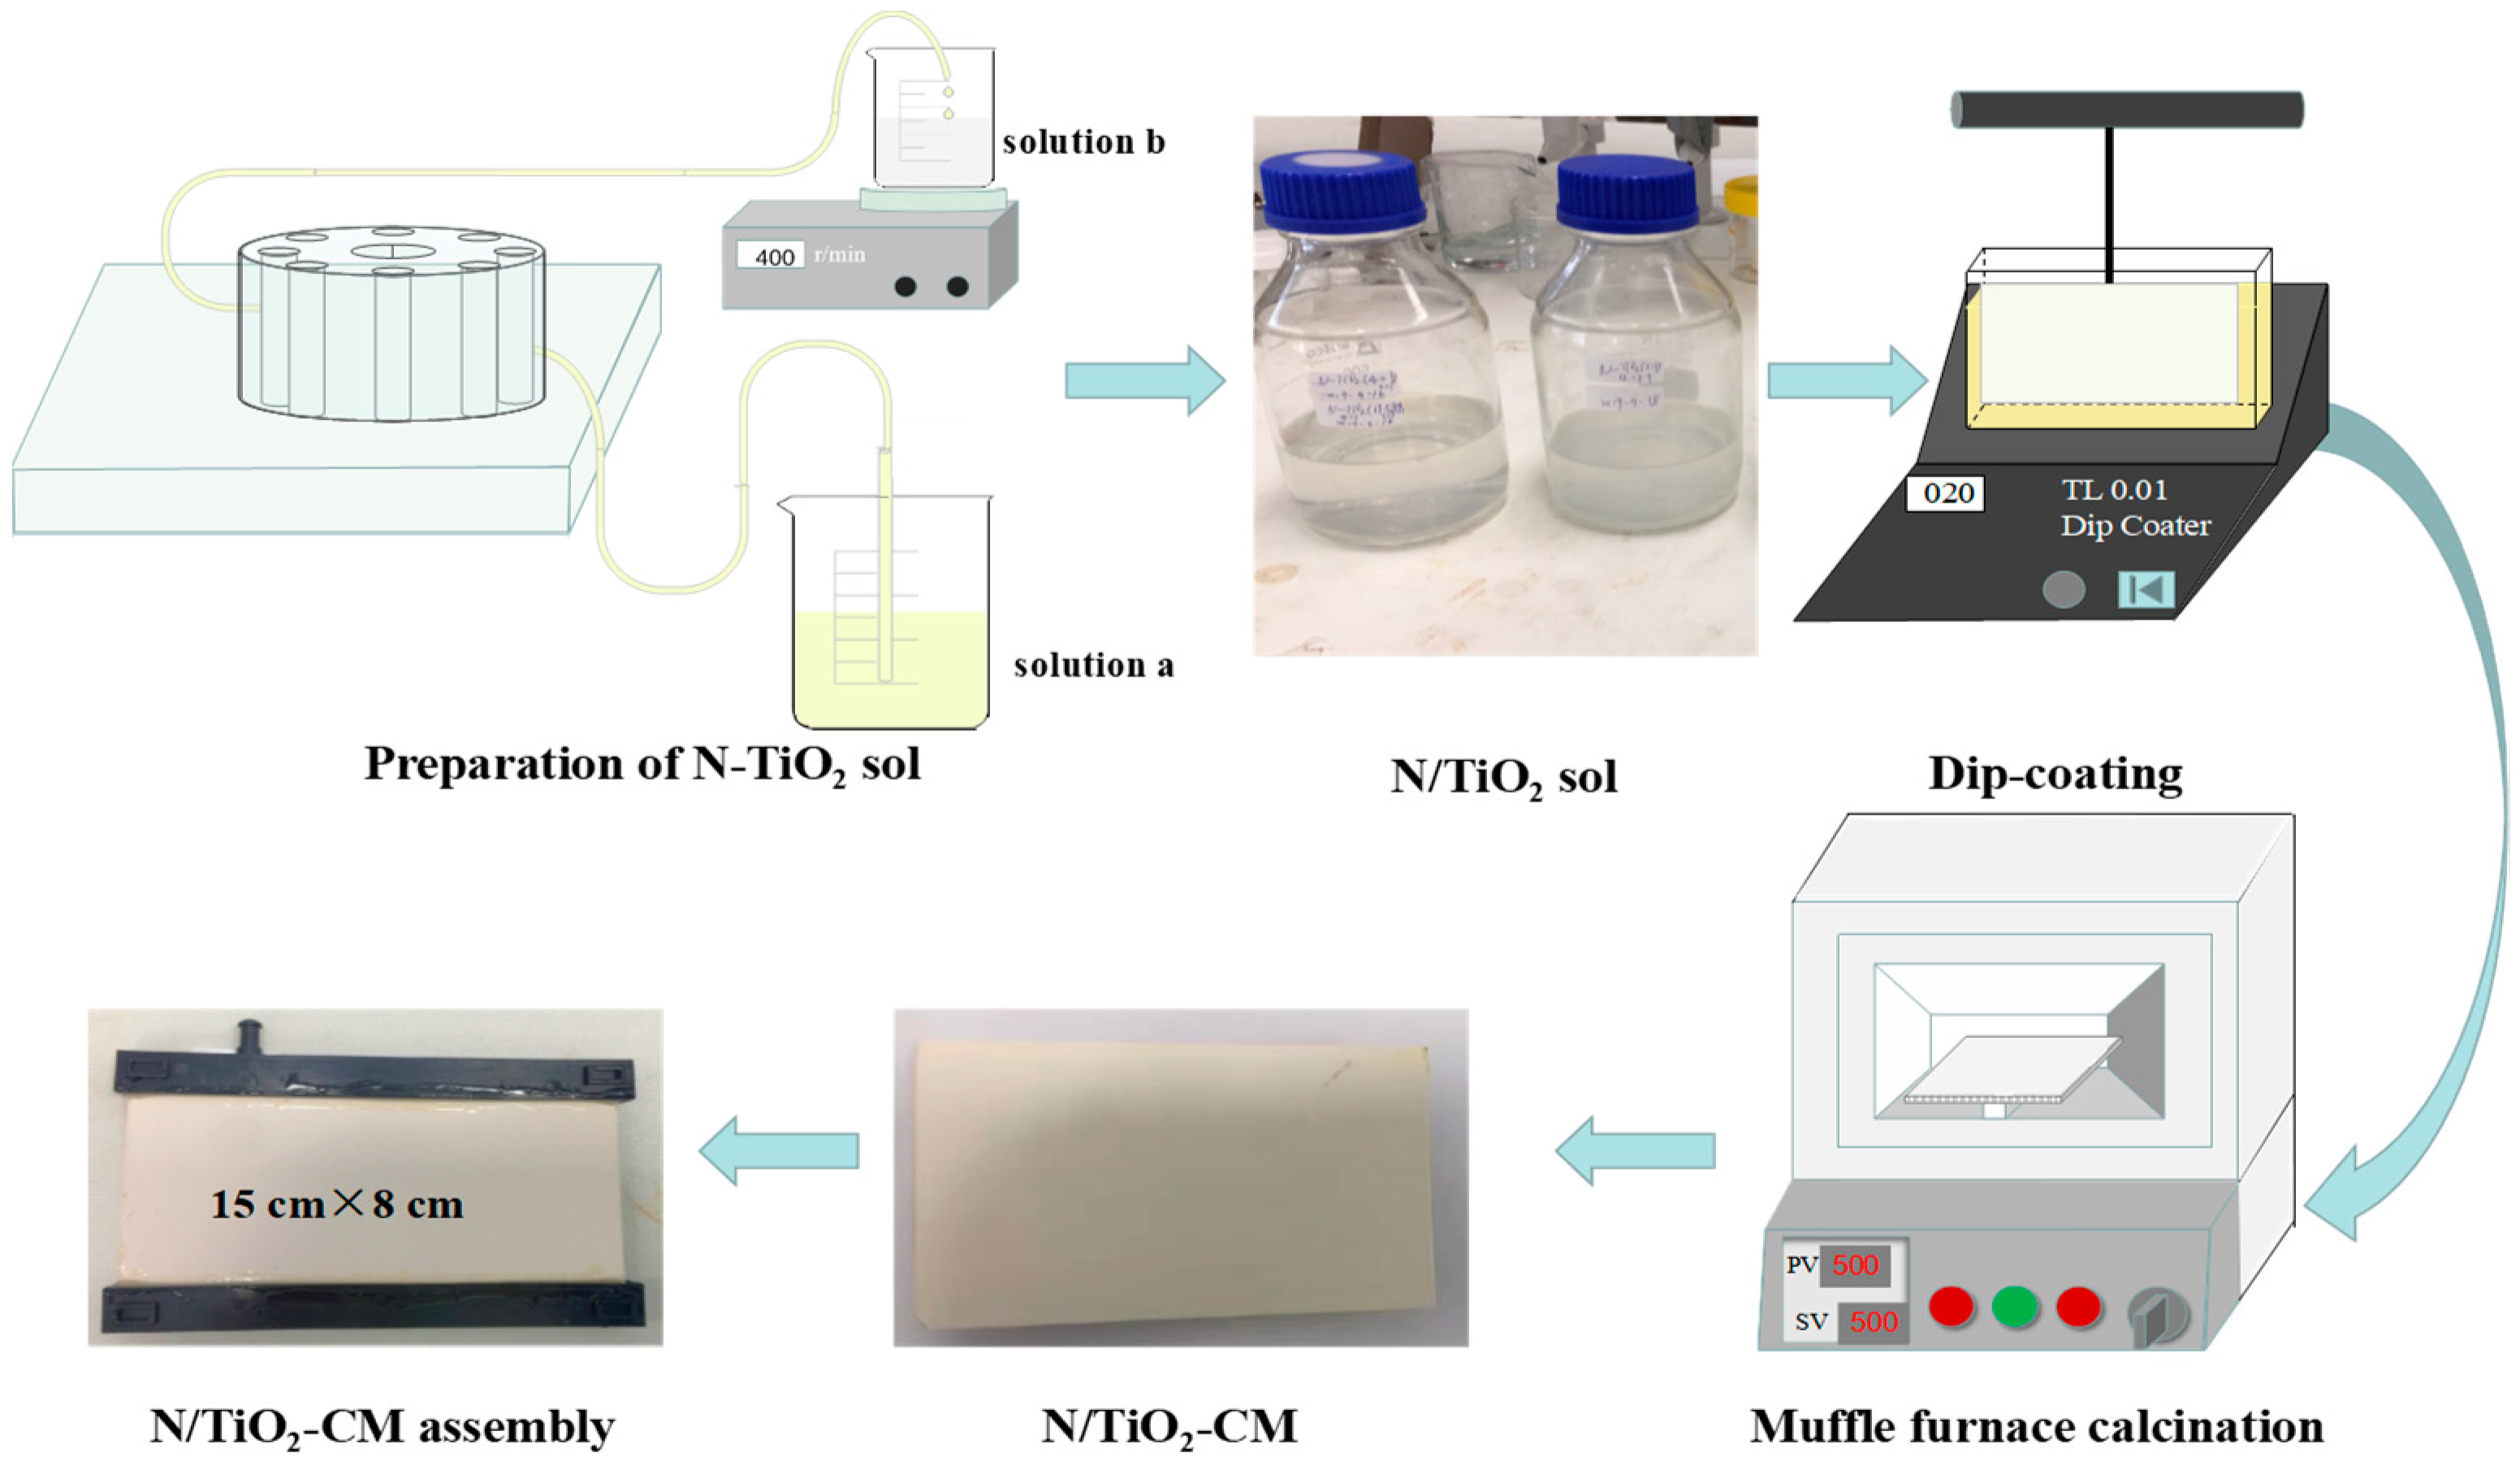
Figure 1. Preparation process of PRCM of N-TiO2-CM.
Crystals 13 00651 g001
Figure 2. Diagram of fixed bed reactor and experimental setup of the PRCM.
Crystals 13 00651 g002
Figure 3. The XRD spectra of TiO2 and N-TiO2 with different doping ratios (a); SEM image (b); TEM images of 100 nm (c); and 5 nm (d) measuring scales of N-TiO2-1 nanoparticles.
Crystals 13 00651 g003
Figure 4. The XPS spectras of N-TiO2-1 (a); Ti 2p (b); N 1s (c); FT-IR pattern of N-TiO2-1 (d); and band gap bandgap energies of different photocatalysts (e).
Crystals 13 00651 g004
Figure 5. The SEM images of the CM (a) and N-TiO2-CM (b). The EDS images of the N (c), Ti (d) and Al (e).
Crystals 13 00651 g005
Figure 6. The pore size distribution (a) and pure water flux (b) of CM and N-TiO2-CM with different loading layers under a TMP of −92 kPa.
Crystals 13 00651 g006
Figure 7. The removal efficiency (a); permeate flux (b); degradation kinetics (c); and kinetic constant k (d) of the TC degradation in the PRCM fixed bed system. (Reaction conditions: C0 = 20 mg/L, reaction volume = 2 L, LED UV lamp (2 × 405 nm) with an intensity 24 µmol/(m2 × s), PRCM loading layers = 3).
Crystals 13 00651 g007
Figure 8. Radical trapping experiments: degradation efficiency of TC in the presence of different radical scavengers (a); the corresponding kinetic curves (b); and reaction rate constant k (c). (Reaction conditions: C(TC) = 20 mg/L, C(IPA) = 0.5 mg/L, C(Ascorbic acid) = 0.025 mg/L, C(EDTA-2Na) = 0.025 mg/L, no light in the first hour, reaction time 240 min, the catalyst content is 5 g/L, LED UV lamp (425 nm) irradiated for 180 min).
Crystals 13 00651 g008
Figure 9. Diagram of reaction mechanism of MP purification by N-TiO2-CM.
Crystals 13 00651 g009
Figure 10. Proposed equipment diagram of photocatalytic ceramic membrane integrated pilot test.
Crystals 13 00651 g010
Table 2. Different advanced oxidation technologies degrade antibiotics.
Treatment MethodsPollutantsRemoval
Efficiency
Treatment
Time
Other ConditionsTreatment
Capacity
Reference
Photo-Fenton
(α-Fe2O3-CM)
20 mg/L
Tetracycline
82%200 minH2O2 concentration 19.4 mmol/L, TMP 8 kPa, LED light 405 nm, light intensity 24 µmol/(m2·s).0.600 L/h[15]
Ozonation10.94 mg/L
ciprofloxacin
84%600 minO3 concentration 1.92 g/L, dissolved O3 concentration in solution 34.56 g/h1.000 L/h[53]
Sonochemistry oxidation0.5 mg/L
Trimethoprim
90%90 minpower density = 36 W/L, pH = 60.133 L/h[54]
Electrochemical oxidation
(Carbon-felt)
164.6 mg/L
Rifampicin
100%360 minCurrent density = 50 mA/cm2, Potentials = 1.36 V,
pH = 6.8, 50 mmol/L Na2SO4
0.025 L/h[55]
UV/H2O2 5.92 × 10⁻⁴ mg/L
Diclofenac
90%90 minH2O2 concentration 0.1 mmol/L, one Xe lamp with 100 mW/cm2, 0.100 L/h[56]
PRCM
(N-TiO2-CM)
20 mg/L
Tetracycline
92%270 minTwo 45 W LED UV lamps with 24 µmol/(m2 s)
TMP = −0.092 MPa
0.571 L/hThis work
Disclaimer/Publisher’s Note: The statements, opinions and data contained in all publications are solely those of the individual author(s) and contributor(s) and not of MDPI and/or the editor(s). MDPI and/or the editor(s) disclaim responsibility for any injury to people or property resulting from any ideas, methods, instructions or products referred to in the content.