Article

Effects of Preparation Atmosphere and Doping Concentration on Scintillation and Photoluminescence Properties of Lu2O3:Eu Scintillation Single Crystals

School of Materials Science and Engineering, Shanghai University, Shanghai 200444, China
*
Author to whom correspondence should be addressed.
Crystals 2023, 13(4), 680; https://doi.org/10.3390/cryst13040680
Submission received: 27 March 2023 / Revised: 10 April 2023 / Accepted: 13 April 2023 / Published: 14 April 2023
(This article belongs to the Special Issue Photoelectric Functional Crystals)

Abstract

:
Lu2O3:1%Eu and Lu2O3:8%Eu series single crystals were grown by optical floating zone method under air, N2, and H2-Ar mixed atmosphere (5 vol%H2 and 95 vol%Ar). The effects of preparation atmosphere and doping concentration on the scintillation and photoluminescence properties have been investigated and discussed. Correlated measurements of afterglow curves, X-ray excited luminescence spectra, photoluminescence excitation and photoluminescence, photoluminescence decay, and thermal stimulated luminescence curves were performed. Although Eu(S6) luminescence can be significantly depressed under oxidizing atmosphere, Lu2O3:8%Eu grown under weak reducing atmosphere presents the lowest afterglow intensity. This phenomenon was explained by different interstitial oxygen atom concentrations in the samples.

1. Introduction

Scintillation materials can convert X-ray, gamma ray, and other high-energy particles into ultraviolet-visible photons [1]. They play an important role in ionizing radiation detection and are used in a wide range of applications in medical imaging, non-destructive testing, nuclear physics, oil well logging, and other fields [1,2,3,4,5]. In the application of scintillation materials, excellent performances, such as high density and high light yield, are required to obtain high X-ray stopping capability and high detection efficiency in X-ray imaging applications [6,7,8]. Europium-doped lutetium oxide, Lu2O3:Eu, has gained attention due to its excellent physical and scintillation properties [9,10,11,12,13,14]. It meets the demand for scintillator requirement for the high spatial resolution MeV X-ray imaging application with high absorption efficiency (density up to 9.42 g/cm)3, high light yield, and good physical and chemical stability [4]. The characteristic emission peak of Lu2O3:Eu scintillation single crystal is mainly located at 611 nm, and the emission wavelengths are well matched to the spectral sensitivity range of the CCD detector [6]. Another important performance parameter of Lu2O3:Eu is its characteristic decay time, and the relatively slow decay time on the order of microseconds is acceptable for radiation applications that do not involve high frame rates [13].
However, Lu2O3:Eu presents relatively strong afterglow [15]. In applications, involving repeated acquisition of imaging data at high frame rates, as well as strong afterglow, may limit the use of this scintillation material. The captured image may be obscured by the afterglow left by the previous frame if the afterglow does not dissipate in the time available between consecutive frames. Therefore, it is of great importance to understand and analyze the afterglow mechanism and impact factors of Lu2O3:Eu in its practical development and application. Eu3+ will occupy two lattice sites (C2 and S6) in its Lu2O3 host. It has been reported that afterglow mainly comes from Eu(S6), where due to the centrosymmetric environment of S6, only the magnetic dipole 4f-4f transitions of Eu3+can be recorded [16,17,18]. Thus, reducing the luminescence proportion of Eu(S6) is one of the effective approaches to decrease the afterglow. According to our previous work, with the increase in Eu doping concentration, the proportion of Eu(S6) in the afterglow decreases with the increase in Eu(S6)→Eu(C2) energy transfer efficiency, and the afterglow of Lu2O3:Eu gradually decreases [16]. In addition, the preparation atmosphere is also an important factor, affecting the scintillation performance. Zych investigated the effect of different atmospheres on the luminescence properties of Lu2O3:Eu ceramics [19]. There are no reports on the effect of growth atmosphere on the luminescence properties of Lu2O3:Eu crystals. Clarification of preparation atmosphere impact on photoluminescence and scintillation properties of Lu2O3:Eu crystals can contribute to the afterglow behavior optimization.
As reported, Lu2O3:Eu, with cubic structure, can be used both in single crystal and transparent polycrystalline ceramics. The advantages of ceramics are relatively low preparation temperature, preparation cost, high homogeneity, and large dimension samples [20,21,22]. Single crystal growth of Lu2O3 is a great challenge due to its super high 2400 °C melting point [23]. Several single crystal preparation methods are adopted to prepare the Lu2O3 single crystal, such as Czochralski (CZ) [23], the heat exchanger method (HEM) [24], the Bridgman method [25], laser-heated pedestal growth (LHPG) [26], the micro-pulling-down (m-PD) method [27], etc. The scintillation single crystal is the essential application form of a scintillator due to its higher transparency and excellent scintillation performance [28,29,30]. In scintillation properties study, a single crystal is preferred compared to ceramics because they eliminate the influence of the grain boundary [31]. In this work, Lu2O3:Eu single crystals were grown by the optical floating zone (FZ) method. The optical floating zone method, using optical heating, has advantages, such as having no crucible, no pollution, and fast growth rate, which show great superiority for some crystals that are difficult to grow (high melt point) or easy to contaminate.
In this paper, Lu2O3:1%Eu and Lu2O3:8%Eu crystals were prepared by the optical floating zone method under air, N2, and H2-Ar mixed atmosphere (5 vol%H2 and 95 vol%Ar), respectively. The effects of the preparation atmosphere and Eu doping concentration on luminescence properties of Lu2O3:Eu scintillation single crystals have been studied. Their photoluminescence excitation (PLE), photoluminescence (PL), PL decay, X-ray excitation luminescence (XEL), and low temperature thermoluminescence (TSL) curves were also measured, and the underlying mechanism of the experimental phenomenon was discussed.

2. Experimental Procedure

2.1. Crystal Preparation

Lu2O3:1%Eu and Lu2O3:8%Eu crystals were prepared by the optical floating zone method under air, N2, and H2-Ar mixed atmosphere (5 vol%H2 and 95 vol%Ar), respectively. The raw materials with 4N purity (Lu2O3 and Eu2O3) were weighted according to the nominal formula, sufficiently blended, and then shaped under the isostatic pressure of 200 MPa in the rubber tube. Polycrystalline rods were obtained after being sintered at 1700 °C for 8 h under air. A crystal growth process was carried out by a floating zone method in a vertical double-ellipsoid mirror furnace, equipped with 6500 W Xe arc lamp as heating source (SciDre HKZ, Dresden, Germany). The crystal preparation atmosphere is controlled by flowing gas into the quartz tube under atmospheric pressure. The light from a Xe arc lamp is focused through the two ellipsoid mirrors on the polycrystalline rods to heat and melt them. The crystal growth process is real-time monitored by a CCD camera, and the growth parameters, such as rotation and growth rates, are controlled by control software. The crystal growth rate is set to 5 mm/h, and the rotation speed of the polycrystalline rods is set to 5 r/min. At the end of crystal growth, the temperature is slowly reduced to room temperature by a cooling program. Due to the high melting point of rare earth sesquioxides (2400 °C), the process requires attention to adjust the growth parameters to keep the melt zone stable. Single crystals with a dimension of Φ5 mm × 1 mm were cut from the boules and polished on both sides, and the following measurements were carried out. The inset of Figure 1c shows the photos of Lu2O3:1%Eu and Lu2O3:8%Eu single crystal samples, where cracks in the samples are caused from the large thermal stress generated by the high temperature during crystal growth. The samples were analyzed by EDS with the line scan method, and the Eu content was found to be consistent with the theoretical value and homogeneously distributed. Lu2O3:1%Eu and Lu2O3:8%Eu samples prepared under air, N2, and H2-Ar mixed atmospheres are numbered as Lu-1-O, Lu-1-N, Lu-1-R, Lu-8-O, Lu-8-N, and Lu-8-R, respectively.

2.2. Measurements

Single crystal samples were grinded to powder to make a X-ray diffraction (XRD) measurement. The phase composition of samples was recorded utilizing Rigaku 18 KW D/MAX2500V+/PC, with Cu Kα1 radiation (λ = 1.54056 Å) in the 2θ reflection angle range of 10–90°, step 0.01°, speed 6°/min. The transmission spectrum over the range from 200 to 800 nm was measured using a Hitachi U-3900H spectrophotometer with a scanning speed of 600 nm/min and a step of 1 nm. A deuterium lamp was used as the light source, and the spectrometer was equipped with a photomultiplier tube (PMT) to detect signals in the UV-VIS wavelength region. The PLE and PL curves were measured on an Edinburg FLS 980 fluorescence spectrometer. The instrument employs time-correlated single photon counting (TCSPC) with a signal-to-noise ratio of 6000:1 and high spectral resolution, and the excitation source is a 450 W continuously operating Xe lamp. The PL decay curves, which were excited by a μF2 lamp under room temperature (RT), were recorded by using the Edinburg FLS 980 fluorescence spectrometer. Emission intensities are corrected according to the quantum efficiency curve of PMT. The XEL curves were recorded by using the XEL accessory in Edinburg FLS 920 fluorescence spectrometer, and the X-ray source is a tungsten X-ray tube operated at 40 kV and 40 μA. Afterglow curves were measured after 500 ms continuous X-ray irradiation provided by a tungsten X-ray tube operated at 15 kV and 15 μA, and the afterglow was collected by Hamamatsu R2059 PMT operated under -1200 V. Wavelength-resolved TSL measurements were performed in the 78–350 K range with a heating rate of 0.2 K/s after irradiation at 77 K (by a Philips 2274 X-ray tube operated at 70 kV and 1.5 mA), with a Jobin-Yvon Spectrum One 3000 CCD detector coupled to a Triax 180 Jobin-Yvon spectrometer operating in the 200–1100 nm interval. All the spectra were corrected for the detection response of the apparatus.

3. Results and Discussions

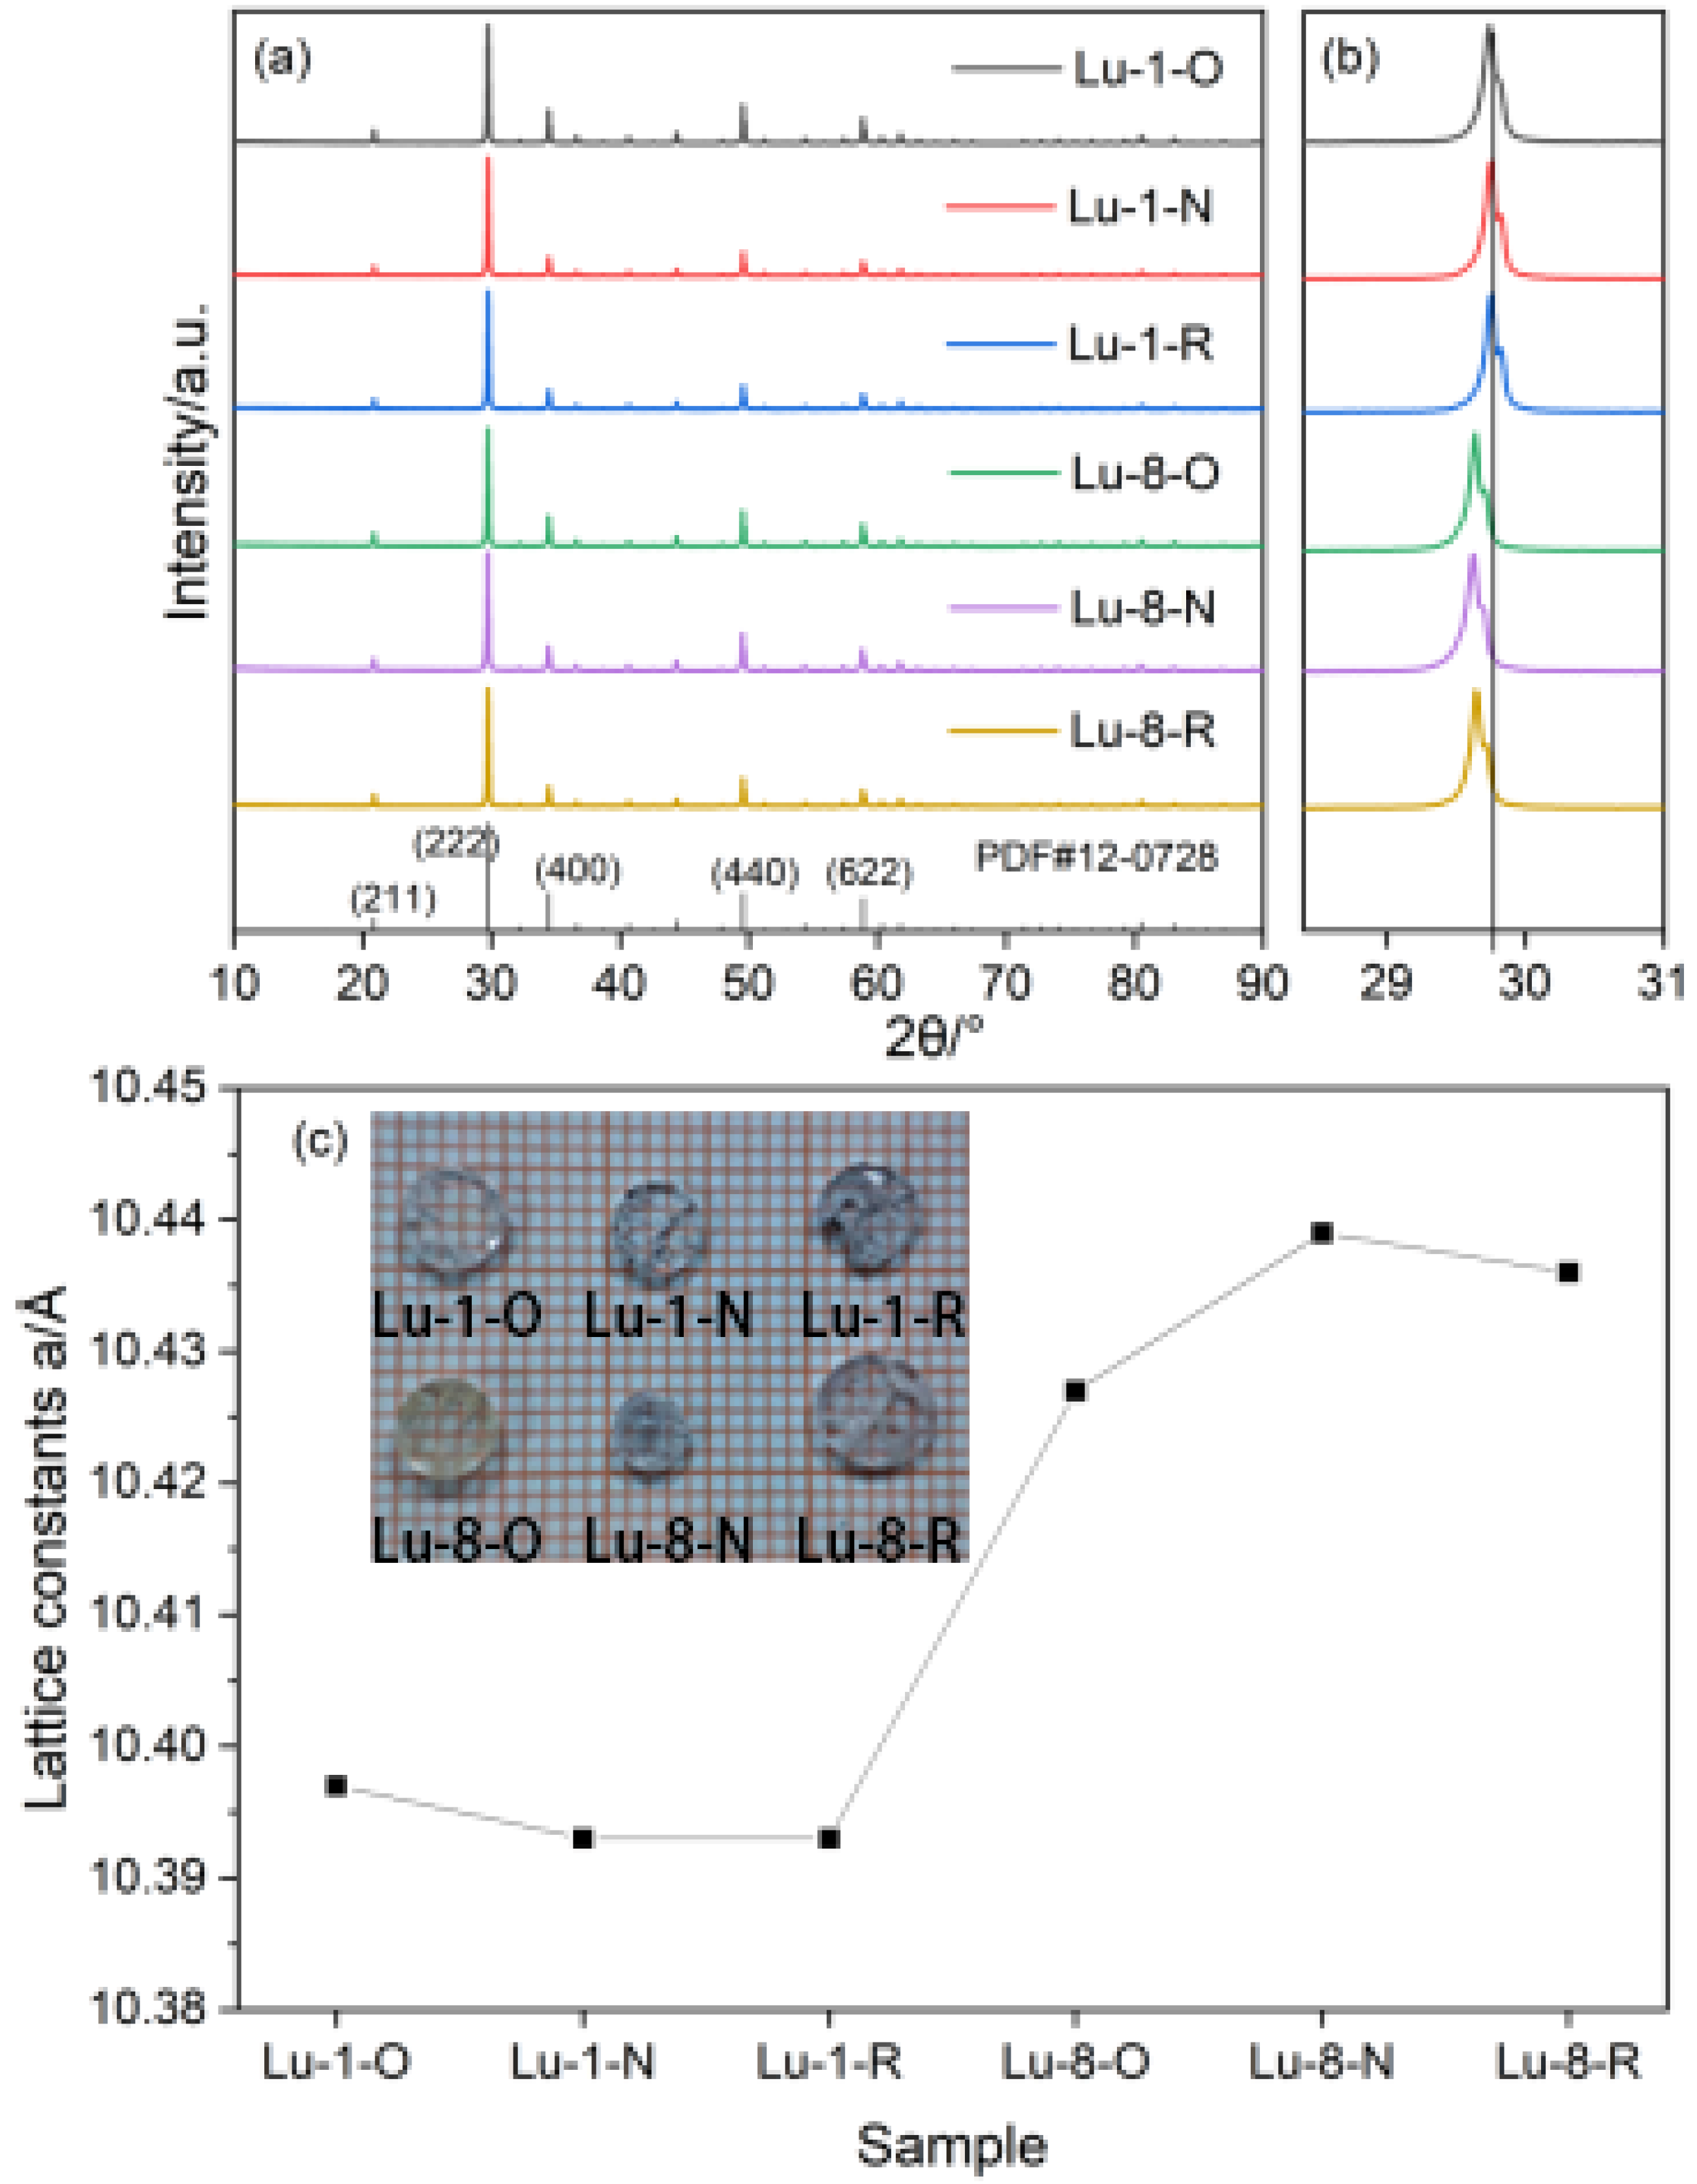
3.1. Sample Phase Identification

Figure 1a displays the XRD patterns of Lu2O3:1%Eu and Lu2O3:8%Eu single crystals grown under different atmospheres. The diffraction peaks of the samples match well compared to the standard Lu2O3 PDF card (PDF#12-0728). 2θ angle diffraction peaks around 20.88, 29.75, 34.49, 49.58, and 58.89 correspond to the Bragg diffraction of Lu2O3 at (211), (222), (400), (440), and (622) crystal faces, respectively. Impurities’ phases were not revealed at the XRD sensitivity limit. It can be demonstrated that the sample is a pure phase with a cubic structure and a space group of Ia3. Figure 1b presents the range of 28–31° for the sake of clarity. A slight shift to smaller 2θ angles for the samples with high doping concentrations of Eu3+ (the position of the highest peak changed from around 29.75 to around 29.63 degree) can be observed. Figure 1c shows the lattice constants of the samples calculated with the Bragg equation. The lattice constants are in the range of 10.39–10.40 Å for Lu2O3:1%Eu and 10.43–10.44 Å for Lu2O3:8%Eu. It is indicated that lattice expansion has occurred, which is due to the fact that Eu3+ ions have entered the host lattice, and the ionic radius of Eu3+ (0.947 Å) is larger than that of Lu3+ (0.861 Å), therefore more substitution of Eu3+ in the Lu3+ position in high concentration-doped samples results in a larger lattice constant.
Figure 1. (a) XRD patterns of Lu2O3:1%Eu and Lu2O3:8%Eu single crystals grown under different atmospheres. (b) Range of 28–31° for the sake of clarity. (c) Photograph of the samples and the calculated lattice constants a of the samples.
Crystals 13 00680 g001
Figure 2 represents the transmittance spectra of Lu2O3:1%Eu and Lu2O3:8%Eu single crystals grown under different atmospheres. The overall features are almost the same in all single crystals. The samples rise sharply between 300 nm and 400 nm, quickly reaching about 60–80% in most visible wavelength regions. The absorption features around 250 nm are due to the charge–transfer (CT) band of electrons transition from O2− 2p orbital to the 4f orbital of Eu3+. The absorption peak of the sample at 350–70 nm may be attributed to the 7F0,15D4 transition of Eu3+ [13]. Absorption peaks at 466 nm and 535 nm are observed for Lu-8-O, Lu-8-N and Lu-8-R, which correspond to the 7F0,15D2 and 7F0,15D1 transitions of Eu3+, respectively. Lu-8-R exhibits the highest optical transmittance of 84% in the visible band, indicating its high crystal quality. The difference in transmittance of samples in the visible range is due to refraction and scattering caused by defects and cracks in the samples.

3.2. PL and Scintillation Properties

Figure 3 presents normalized PLE spectra of Lu2O3:Eu single crystals grown under different atmospheres. Considering that Lu2O3 contains two kinds of cation sites (C2 and S6), the characteristic emission wavelength of Eu3+ is 611 nm for the C2 site and 582 nm for the S6 site [32]. Therefore, the excitation spectra of the single crystals were monitored at 582 nm and 611 nm, as shown in Figure 3. It is presented that the intensity, as well as the position of the excitation peaks, does not change obviously in growth atmospheres. The excitation peaks at 241 nm and 250 nm of Lu2O3:Eu can be clearly observed, which belong to the CT transition of Eu3+. All excitation peaks in the 300-550 nm are attributed to the 4f-4f transition of Eu3+. Peaks around 300, 325, 360, 387, 398, 410, 467, and 533 nm can be assigned to the 7F0,15F2, 7F0,15HJ, 7F0,15D4,5GJ, 7F0,15L6, 7F0,15D3, 7F0,15D2, and 7F0,15D1 transitions of Eu3+, respectively. In addition, the relative intensity of 4f-4f excitation peaks for Eu3+ increase obviously at high Eu3+ doping concentration.
PL curves were measured, and it was found that the luminescence intensity of the sample with 8% Eu doping concentration was significantly higher than that of the sample with 1% Eu doping concentration. Figure 4 shows normalized PL spectra of Lu2O3:1%Eu and Lu2O3:8%Eu series single crystals under 241 nm and 250 nm excitation, respectively. The main emission peak at 611 nm belongs to the 5D07F2 transition in the C2 lattice of Eu3+ [33]. A series of emission peaks in the range of 575–595 nm can be attributed to the 5D07F0,1 transition of Eu3+. The peaks around 650 nm and 720 nm are assigned to the 5D07F3 and 5D07F4 transition of Eu(C2) [34]. As presented in the inserts of Figure 4, the peak around 582 nm belongs to the 5D07F1a transition of Eu(S6), and the peak around 587 nm can be attributed to the 5D07F1a transition of Eu(C2). The relative luminescence intensity is roughly similar for the samples with different preparation atmosphere at the same Eu doping concentrations. As shown in the illustrations of Figure 4c,d, the relative luminescence intensity of Eu(S6) gradually decreases with the enhancement of oxidizing atmosphere. It is observed that the relative intensity of Eu(S6) in Lu-8-O is obviously lower than that of Lu-8-R. The trend is caused by the effect of different preparation atmospheres on the defect state inside the crystal. Due to the oxygen-deficient fluorite structure, there are intrinsic oxygen vacancies around S6 and C2 lattice sites in Lu2O3, which makes it easier for the external oxygen atoms to enter the crystal lattice to form interstitial oxygen. The interstitial oxygen defects exist in the form of hole traps in the Lu2O3 host, and the dramatic temperature gradient during the crystal growth process tends to cause composition bias, which results in a deeper trap depth of hole traps [34,35]. These interstitial oxygen defects prefer to locate around S6 site, considering that the energy level of the S6 site is higher than that of C2 [35]. Some of the holes are bound by the interstitial oxygen atoms during the electron transition, which decrease Eu3+ luminescence of the S6 lattice site. This tendency will be obvious with increasing oxidizing atmosphere.
Figure 5 shows the decay time curves of Lu2O3:Eu single crystals. Figure 5a,c illustrates the characteristic decay curve of Eu(S6). Figure 5b,d illustrates the characteristic decay curve of Eu(C2). The decay curves of Eu(S6) and Eu(C2) are analyzed by mathematical fitting with the following Equations (1) and (2), respectively.
I = A 1 exp ( t / τ 1 ) + A 2 exp ( t / τ 2 ) + A 3 exp ( t / τ 3 )
I = A exp ( t / τ )
P = A j τ j j = 1 ,   2 ,   3 i = 1 3 A i τ i
where A1, A2 and A3 are the parameters, and τ1, τ2 and τ3 are three components of the decay curves, respectively. The fitting results for the decay curves are shown in Table 1. It can be observed that the decay curves of Eu(S6) are fitted to three components of decay time. All samples exhibit a fast decay time component, ranging from 60–80 µs in the characteristic decay curve of Eu(S6), which is the fast relaxation of 5D15D0 energy level [36]. The decay time components in the range of 1 ms and 5 ms are the characteristic decay times of Eu(C2) and Eu(S6), respectively [37]. The relative proportions of the three decay time components were also calculated, using Equation (3), based on the fitting results and are listed in Table 1. It can be found that the samples with high Eu doping concentration have a higher proportion of Eu(C2) decay time components and therefore exhibit faster decay time than the samples with low Eu doping concentration. This resulted from that the Eu(S6)→Eu(C2) energy transfer, which is enhanced after high concentration doping, which eventually leads to the decrease in the luminescence of the S6 site and a shorter decay time. On the other hand, it can be obviously observed that the samples grown under oxidizing atmosphere show the shortest decay time, which is more significant at high doping concentrations of Eu3+. It corresponds to the above inference that the formation of interstitial oxygen defect can inhibit the luminescence of Eu(S6). In addition, it can be observed that the PL decay curves for the Eu(C2) emission can be fitted through single exponential function, and the decay times are very close to each other around 1 ms.
Figure 6 shows the XEL spectra of Lu2O3:Eu single crystals. It is shown that the emission peak patterns under X-ray excitation of Lu2O3:1%Eu and Lu2O3:8%Eu series samples are very similar to those in the PL spectra, and all of them belong to the 4f-4f transition peak of Eu3+, and the strongest peak appears at 611 nm, belonging to the intense red emission peaks of Eu(C2) 5D07F2 transition. The illustrations of Figure 6 show the normalized intensity around 587 nm. It can be observed that the peaks of Eu(S6) around 582 nm grown under oxidizing atmosphere have the lowest luminescence intensity, which is consistent with the results obtained from PL spectra. This phenomenon can be explained by the same mechanism in PL behavior of Lu2O3. When oxidizing a preparation atmosphere environment, an oxygen atom enters the lattice of Lu2O3, and thus interstitial oxygen atom defects are formed, which act as hole traps.
Figure 7 shows the afterglow curves of Lu2O3:1%Eu and Lu2O3:8%Eu single crystals grown under different atmospheres after 500 ms of X-ray irradiation at room temperature. It can be clearly observed that the afterglow level decreases significantly at high Eu doping concentrations. The decrease in the afterglow of Lu2O3:8%Eu is due to the fact that the afterglow mainly comes from the luminescence of Eu(S6), and the energy transfer of Eu(S6)→Eu(C2) is concentration-dependent, and the high efficiency of energy transfer at high concentrations leads to a significant decrease in the afterglow, which is consistent with the results we obtained in our previous work. In addition, different growth atmospheres have an effect on the afterglow of Lu2O3:Eu single crystals. As shown in Figure 6, Lu2O3 single crystals grown under slightly reducing atmosphere present the lowest afterglow level for both high and low concentrations, and the samples grown under air atmosphere also showed the highest afterglow intensity. It is well known that afterglow behavior is closely related to the defect trap state of the sample. TSL curves for the Lu2O3:Eu single crystals grown under air, N2, and H2-Ar mixed atmosphere are recorded and are shown in Figure 8 to investigate the effect of growth atmosphere and europium doping concentration on the defect traps of the Lu2O3:Eu scintillation single crystals.
TSL curves of Lu2O3:Eu single crystals are reported in Figure 8. The general-order kinetics model was adopted to fit the TSL curves (intensity I as a function of temperature T) by using the following simplified equation, Equation (4) [37]:
I T = s n 0 exp ( E t k B T ) × l 1 s β × T × exp E t k B T × k B T E t 2 k B T E t 2 + 6 k B T E t 3 + 1 l / l 1
where n0 is the concentration of trapped charges at t = 0, Et is the energy level of the trap, kB is the Boltzmann constant, l is the kinetic order, s is the frequency factor, and β is the heating rate (0.2 K/s in this measurement). The fitting results of the TSL curves are presented in Table 2. For the three single crystal samples of Lu2O3:1%Eu, a total of five to seven TSL peaks were obtained, with trap depths in the range of 0.22–0.84 eV. For the three single crystal samples of Lu2O3:8%Eu, a total of three to four TSL peaks were obtained, with trap depths in the range of 0.23–0.73 eV. TSL peaks in the ranges of 100–150, 150–225, and 225–300 K are attributed to cation Frenkel, oxygen Frenkel defect, and Schottky defect, respectively [16]. The TSL peak around 243 K of three Lu2O3:8%Eu sample may be due to the defect caused by relatively large lattice expansion under high Eu doping concentration. It is generally accepted that the afterglow of the scintillator mainly comes from the carrier trap, corresponding to TSL peaks around room temperature [16]. As shown in Figure 8a–c, the intensity of TSL peaks around 225–350 K gradually decreases, corresponding to decreasing afterglow intensity of the Lu2O3:1%Eu samples. As for the Lu2O3:8%Eu samples, no peaks in the range of 225–350 K were observed in the TSL plots, which may be related to the lower Schottky defect concentration, corresponding to the lower afterglow intensities compared with Lu2O3:1%Eu samples.
Overall, the decrease afterglow intensity of Lu2O3:1%Eu and Lu2O3:8%Eu samples from oxidizing to weak reducing atmosphere is related to fewer intrinsic defect concentrations. In addition, the afterglow level has been shown to be influenced by the Eu(S6)→Eu(C2) energy transfer, and this effect is also one reason for the different afterglow intensities between Lu2O3 doped with low and high europium concentration.

4. Conclusions

In conclusion, Lu2O3:Eu scintillation single crystals with high(8%) and low(1%) Eu doping concentration under air, N2, and H2-Ar mixed atmosphere were grown by the optical floating zone method. The relative luminescence intensity of Eu(S6) gradually decreases with the enhancement of the oxidizing atmosphere. The characteristic decay time of Eu(C2) is about 1ms. The characteristic decay time of Eu(S6) decreases with increasing oxidizing atmosphere. The Lu2O3:8%Eu sample grown under reducing atmosphere exhibited the lowest afterglow intensity. The high concentration of Eu3+ doping can improve the energy transfer efficiency of Eu(S6)→Eu(C2) to achieve the purpose of afterglow suppression. In addition, the afterglow intensity of Lu2O3:Eu is mainly influenced by internal defect traps. Weakly reducing atmosphere can inhibit the formation of oxygen atom interstitial defects inside the crystal. From the TSL test, it was found that the introduction of reducing atmosphere changed the trap state inside the sample and reduced the afterglow intensity.

Author Contributions

Methodology, Z.X. and H.Y.; Resources, B.L., Q.L., Z.X. and H.Y.; Writing—original draft, W.D.; Writing—review & editing, H.F.; Visualization, W.D.; Project administration, B.L. and Q.L. All authors have read and agreed to the published version of the manuscript.

Funding

This research was funded by the National Natural Science Foundation grant numbers 12175130 and 11875187.

Data Availability Statement

Not applicable.

Conflicts of Interest

The authors declare no conflict of interest.

References

  1. Marton, Z.; Miller, S.R.; Brecher, C.; Kenesei, P.; Moore, M.D.; Woods, R.; Almer, J.D.; Miceli, A.; Nagarkar, V.V. Efficient high-resolution hard X-ray imaging with transparent Lu2O3:Eu scintillator thin films. In Proceedings of the Conference on Medical Applications of Radiation Detectors V, San Diego, CA, USA, 12–13 August 2015. [Google Scholar]
  2. Lempicki, A.; Brecher, C.; Szupryczynski, P.; Lingertat, H. A new lutetia-based ceramic scintillator for X-ray imaging. Nucl. Instrum. Methods Phys. Res. A 2002, 488, 579–590. [Google Scholar] [CrossRef]
  3. Nagarkar, V.V.; Tipnis, S.V.; Miller, S.R.; Lempicki, A. A new X-ray scintillator for digital radiography. IEEE Trans. Nucl. Sci. 2003, 50, 297–300. [Google Scholar] [CrossRef]
  4. Lecoq, P. Development of new scintillators for medical applications. Nulear Insturments Methods Phys. Res. A 2016, 809, 130–139. [Google Scholar] [CrossRef]
  5. Eijk, C.W. Inorganic-scintillator development. Nucl. Instrum. Methods Phys. Res. A 2001, 460, 1–14. [Google Scholar] [CrossRef]
  6. Miller, S.R.; Tipnis, S.V.; Shestakova, I.; Nagarkar, V.V. High performance scintillator screen for medical imaging applications. In Proceedings of the Conference on Penetrating Radiation Systems and Applications VI, Denver, CO, USA, 4–5 August 2004; pp. 133–140. [Google Scholar]
  7. Marton, Z.; Bhandari, H.B.; Brecher, C.; Miller, S.R.; Singh, B.; Nagarkar, V.V. High efficiency microcolumnar Lu2O3:Eu scintillator thin film for hard X-ray microtomography. In Proceedings of the 11th International Conference on Synchrotron Radiation Instrumentation (SRI), Lyon, France, 9–13 July 2012. [Google Scholar]
  8. Babayevskaya, N.V.; Deyneka, T.G.; Mateychenko, P.V.; Matveevskaya, N.A.; Tolmachev, A.V.; Yavetskiy, R.P. Fabrication and characterization of Lu2O3:Eu3+ nanopowders and X-ray films. J. Alloys Compd. 2010, 507, L26–L31. [Google Scholar] [CrossRef]
  9. Cha, B.K.; Yong, S.M.; Lee, S.J.; Kim, D.K.; Bae, J.H.; Cho, G.; Seo, C.W.; Jeon, S.; Huh, Y. Synthesis and scintillation characterization of nanocrystalline Lu2O3 (Eu) powder for high resolution X-ray imaging detectors. J. Instrum. 2012, 7, C03048. [Google Scholar] [CrossRef]
  10. Kopylov, Y.L.; Kravchenko, V.B.; Dulina, N.A.; Lopin, A.V.; Parkhomenko, S.V.; Tolmachev, A.V.; Yavetskiy, R.P.; Zelenskaya, O.V. Fabrication and characterization of Eu3+ doped Lu2O3 scintillation ceramics. Opt. Mater. 2013, 35, 812–816. [Google Scholar] [CrossRef]
  11. Marton, Z.; Bhandari, H.B.; Brecher, C.; Miller, S.R.; Singh, B.; Nagarkar, V.V. Fabrication of High-Resolution Lu2O3:Eu X-Ray Scintillator by Physical Vapor Deposition. IEEE Trans. Nucl. Sci. 2013, 60, 983–987. [Google Scholar] [CrossRef]
  12. Liaparinos, P.F.; Kandarakis, I.S. The imaging performance of compact Lu2O3:Eu powdered phosphor screens: Monte Carlo simulation for applications in mammography. Med. Phys. 2009, 36, 1985–1997. [Google Scholar] [CrossRef]
  13. Cao, M.; Xu, J.; Hu, C.; Kou, H.; Shi, Y.; Chen, H.; Dai, J.; Pan, Y.; Li, J. Fabrication and characterizations of (Lu,Gd)2O3:Eu scintillation ceramics. Ceram. Int. 2017, 43, 2165–2169. [Google Scholar] [CrossRef]
  14. Shi, Y.; Chen, Q.W.; Shi, J.L. Processing and scintillation properties of Eu3+ doped Lu2O3 transparent ceramics. Opt. Mater. 2009, 31, 729–733. [Google Scholar] [CrossRef]
  15. Kappers, L.A.; Bartram, R.H.; Hamilton, D.S.; Brecher, C.; Lempicki, A. Afterglow, low-temperature radioluminescence and thermoluminescence of Lu2O3: Eu ceramic scintillators. Nucl. Instrum. Methods Phys. Res. Sect. Accel. Spectrometers Detect. Assoc. Equip. 2005, 537, 443–445. [Google Scholar] [CrossRef]
  16. Zhuang, L.; Zhang, Z.; Wang, Y.; Wan, H.; Xu, Z.; Mao, R.; Feng, H.; Zhao, J. Afterglow Behavior, Energy Transfer and Trap States in Lu2O3:Eu Single Crystal Scintillator. Ecs J. Solid State Sci. Technol. 2018, 7, R17. [Google Scholar] [CrossRef]
  17. Zych, E.; Karbowiak, M.; Domagala, K.; Hubert, S. Analysis of Eu3+ emission from different sites in Lu2O3. J. Alloy Comp. 2002, 341, 381–384. [Google Scholar] [CrossRef]
  18. Babin, V.; Fukabori, A.; Jary, V.; Beitlerova, A.; Chani, V.I.; Yoshikawa, A.; Nikl, M. Luminescent properties of RE2O3 (RE = Lu, Sc, Y) single crystals and ceramics. Eur. Phys. J. B 2013, 86, 93. [Google Scholar] [CrossRef]
  19. Trojan-Piegza, J.; Zych, E. Afterglow Luminescence of Lu2O3:Eu Ceramics Synthesized at Different Atmospheres. J. Phys. Chem. C 2010, 114, 4215–4220. [Google Scholar] [CrossRef]
  20. Shi, Y.; Shichalin, O.; Xiong, Y.; Kosyanov, D.; Wu, T.; Zhang, Q.; Wang, L.; Zhou, Z.; Wang, H.; Fang, J.; et al. Ce3+ doped Lu3Al5O12 ceramics prepared by spark plasma sintering technology using micrometre powders: Microstructure, luminescence, and scintillation properties. J. Eur. Ceram. Soc. 2022, 42, 6663–6670. [Google Scholar] [CrossRef]
  21. Kosyanov, D.Y.; Yavetskiy, R.P.; Tolmachev, A.V.; Vornovskikh, A.A.; Pogodaev, A.V.; Gridasova, E.A.; Shichalin, O.O.; Kaidalova, T.A.; Kuryavyi, V.G. Fabrication of highly-doped Nd3+:YAG transparent ceramics by reactive SPS. Ceram. Int. 2018, 44, 23145–23149. [Google Scholar] [CrossRef]
  22. Kosyanov, D.Y.; Liu, X.; Vornovskikh, A.A.; Kosianova, A.A.; Zakharenko, A.M.; Zavjalov, A.P.; Shichalin, O.O.; Mayorov, V.Y.; Kuryavyi, V.G.; Qian, X.; et al. Al2O3-Ce:YAG and Al2O3-Ce:(Y,Gd)AG composite ceramics for high brightness lighting: Effect of microstructure. Mater. Charact. 2021, 172, 110883. [Google Scholar] [CrossRef]
  23. Fornasiero, L.; Mix, E.; Peters, V.; Petermann, K.; Huber, G. New oxide crystals for solid state lasers. Cryst. Res. Technol. 1999, 34, 255–260. [Google Scholar] [CrossRef]
  24. Koopmann, P.; Peters, R.; Petermann, K.; Huber, G. Crystal growth, spectroscopy, and highly efficient laser operation of thulium-doped Lu2O3 around 2 μm. Appl. Phys. B 2011, 102, 19–24. [Google Scholar] [CrossRef]
  25. Zheng, J.Q.; Liu, C.J.; Yu, H.H.; Chen, L.; Yang, M.; Zhao, H.Y.; Lu, B.Q.; Yang, F.; Feng, H. Single Crystal Preparation and Luminescent Properties of Lu2O3:Eu Scintillator by Vertical Bridgman Method. Cryst. Res. Technol. 2022, 57, 2100120. [Google Scholar] [CrossRef]
  26. Guzik, M.; Pejchal, J.; Yoshikawa, A.; Ito, A.; Goto, T.; Siczek, M.; Lis, T.; Boulon, G. Structural Investigations of Lu2O3 as Single Crystal and Polycrystalline Transparent Ceramic. Cryst. Growth Des. 2014, 14, 3327–3334. [Google Scholar] [CrossRef]
  27. Yoshikawa, A.; Nikl, M.; Ogino, H.; Lee, J.H.; Fukuda, T. Crystal growth of Yb3+-doped oxide single crystals for scintillator application. J. Cryst. Growth 2003, 250, 94–99. [Google Scholar] [CrossRef]
  28. Xie, W.; Wang, J.; Cao, M.; Hu, Z.; Feng, Y.; Chen, X.; Jiang, N.; Dai, J.; Shi, Y.; Babin, V.; et al. Fabrication and properties of Eu:Lu2O3 transparent ceramics for X-ray radiation detectors. Opt. Mater. 2018, 80, 22–29. [Google Scholar] [CrossRef]
  29. Thor, T.; Rubesova, K.; Jakes, V.; Mikolasova, D.; Prusa, F.; Nadherny, L.; Kucerkova, R.; Nikl, M. Eu:Lu2O3 transparent ceramics prepared by spark-plasma-sintering. In Proceedings of the Optics and Measurement International Conference, Liberec, Czech Republic, 8–10 October 2019. [Google Scholar]
  30. Zeler, J.; Jerzykiewicz, L.; Zych, E. Flux-Aided Synthesis of Lu2O3 and Lu2O3:Eu Single Crystal Structure, Morphology Control and Radioluminescence Efficiency. Materials 2014, 7, 7059. [Google Scholar] [CrossRef]
  31. Nikl, M.; Laguta, V.V.; Vedda, A. Complex oxide scintillators: Material defects and scintillation performance. Phys. Status Solidi B-Basic Solid State Phys. 2008, 245, 1701–1722. [Google Scholar] [CrossRef]
  32. Zych, E. Concentration dependence of energy transfer between Eu3+ ions occupying two symmetry sites in Lu2O3. J. Phys.-Condens. Matter 2002, 14, 5637–5650. [Google Scholar] [CrossRef]
  33. Ping, G.; Wang, X.; Wu, Y.; Qin, L.; Shu, K. Synthesis and luminescent characteristic of Eu3+ doped (Gd,Lu)2O3 nanopowders. Opt. Mater. 2012, 34, 748–752. [Google Scholar] [CrossRef]
  34. Shyichuk, A.; Zych, E. Defect states in cubic lutetium oxide caused by oxygen or lutetium inclusions or vacancies. J. Lumin. 2018, 197, 324–330. [Google Scholar] [CrossRef]
  35. Doherty, T.A.S.; Winchester, A.J.; Macpherson, S.; Johnstone, D.N.; Pareek, V.; Tennyson, E.M.; Kosar, S.; Kosasih, F.U. Performance-limiting nanoscale trap clusters at grain junctions in halide perovskites. Nature 2020, 580, 360–366. [Google Scholar] [CrossRef]
  36. Buijs, M.; Meyerink, A.; Blasse, G. Energy transfer between Eu3+ ions in a lattice with two different crystallographic sites: Y2O3:Eu3+, Gd2O3:Eu3+ and Eu2O3. J. Lumin. 1987, 37, 9–20. [Google Scholar] [CrossRef]
  37. Feng, H.; Zhuang, L.; Huang, S.; Zhang, Z.; Xu, Z.; Mao, R.; Zhao, J. Correlation of afterglow, trap states and site preference in RE2O3:1%Eu (RE=Lu, Y, Sc) single crystal scintillators. J. Lumin. 2019, 209, 232–236. [Google Scholar] [CrossRef]
Figure 2. Optical transmittance spectra of Lu2O3:1%Eu and Lu2O3:8%Eu single crystals.
Crystals 13 00680 g002
Figure 3. Normalized PLE spectra of Lu2O3:1%Eu and Lu2O3:8%Eu single crystals for (a) and (c) Eu(S6) characteristic emission at 582 nm (b), as well as the (d) Eu(C2) characteristic emission at 611 nm emission.
Crystals 13 00680 g003
Figure 4. Normalized PL spectra Lu2O3:1%Eu and Lu2O3:8%Eu single crystals for (a) and (c) Eu(S6) characteristic excitation under 241 nm (b) and (d) Eu(C2) characteristic excitation under 250 nm. The inserts present PL spectra in the range of 578–590 nm.
Crystals 13 00680 g004
Figure 5. PL decay curves of Lu2O3:1%Eu and Lu2O3:8%Eu single crystals for (a,c) 582 nm emission and excitation under 241 nm, for (b,d) 611 nm emission and excitation under 250 nm.
Crystals 13 00680 g005
Figure 6. Emission spectra of Lu2O3:1%Eu and Lu2O3:8%Eu single crystals measured under X-ray excitation. The inserts of (a) and (b) present a normalized intensity for the range of 579–590 nm.
Crystals 13 00680 g006
Figure 7. Afterglow curves of Lu2O3:1%Eu and Lu2O3:8%Eu single crystals.
Crystals 13 00680 g007
Figure 8. (ac) TSL curves and their fitted curves of 1%Lu2O3:Eu single crystals. (df) TSL curves and their fitted curves of 8%Lu2O3:Eu single crystals.
Crystals 13 00680 g008
Table 1. The decay time fitted results of Lu2O3:1%Eu and Lu2O3:8%Eu single crystals.
λex = 241 nm − λem = 582 nmλex = 250 nm − λem = 611 nm
SampleA1τ1/msA2τ2/msA3τ3/msA1τ1/ms
Lu-1-O24,2840.07 (6%)36461.04 (14%)43565.51 (80%)13,5420.95
Lu-1-N24,8850.07 (6%)45141.03 (15%)37935.80 (79%)13,8020.97
Lu-1-R27,4000.08 (6%)22511.09 (8%)46645.96 (86%)14,0130.93
Lu-8-O50700.07 (4%)89421.07 (63%)13333.79 (33%)11,9360.99
Lu-8-N36,0860.06 (9%)59001.19 (34%)24804.85 (57%)11,2031.01
Lu-8-R31,0730.07 (8%)41551.27 (19%)36425.532 (73%)12,2010.99
Table 2. The TSL fitted results of Lu2O3:1%Eu and Lu2O3:8%Eu single crystals.
Lu-1-OLu-1-NLu-1-R
No.Tmax(K)Etrap(eV)Tmax(K)Etrap(eV)Tmax(K)Etrap(eV)
11030.311060.33930.22
21160.371480.441070.31
31360.391780.511250.36
41760.501930.531860.51
51930.532510.722060.56
62580.72
72940.84
Lu-8-OLu-8-NLu-8-R
No.Tmax(K)Etrap(eV)Tmax(K)Etrap(eV)Tmax(K)Etrap(eV)
11670.341030.30970.23
21860.531710.471690.46
32180.691860.521870.53
4 2470.732470.73
Disclaimer/Publisher’s Note: The statements, opinions and data contained in all publications are solely those of the individual author(s) and contributor(s) and not of MDPI and/or the editor(s). MDPI and/or the editor(s) disclaim responsibility for any injury to people or property resulting from any ideas, methods, instructions or products referred to in the content.

