Article

First-Principles Modeling of Bottom-Up Synthesis of Carbon Quantum Dots

by
Danil W. Boukhvalov
1,2,* and
Vladimir Yu. Osipov
3,*
1
College of Science, Institute of Materials Physics and Chemistry, Nanjing Forestry University, Nanjing 210037, China
2
Institute of Physics and Technology, Ural Federal University, Mira 19 Str., Yekaterinburg 620002, Russia
3
Ioffe Institute, Polytechnicheskaya 26, St. Petersburg 194021, Russia
*
Authors to whom correspondence should be addressed.
Crystals 2023, 13(5), 716; https://doi.org/10.3390/cryst13050716
Submission received: 7 April 2023 / Revised: 20 April 2023 / Accepted: 21 April 2023 / Published: 24 April 2023
(This article belongs to the Section Crystal Engineering)

Abstract

:
In this work, we report the results of various scenarios related to the initial stages in the assembly of carbon quantum dots (CQDs) from citric acid (CA) or o-phenylenediamine (OPD). The results of the step-by-step simulations of the synthesis demonstrate that all possible scenarios of CQD assembly are different from those previously proposed. For example, in synthesizing CQDs from citric acid, each addition of a new carbon ring to the growing nanographene leads to the appearance of the carbonyl (C=O) groups on the edges and carboxyl (–COOH) groups in the interior parts of the nanographenes. Even the initial steps of CQD assembly from CA are accompanied by the formation of bushy structures from carboxyl and –CH2–COOH groups on the edges. On the other hand, in manufacturing CQDs from OPD, the formation of flat nanographenes is extremely energetically favorable. This result is in qualitative agreement with a very high yield of synthesized CQDs from OPD. However, the discussed process of nanographene formation proceeds simultaneously with the oxidation of newly formed nanographenes in a medium of superheated water accompanied by the appearance of C–OH bonds in the internal parts of newly formed sp2- carbon species or even in their etching. For both cases, the scenario of eliminating excessive carboxyl or hydroxyl groups by forming interlayer C–C bonds between two adjacent nanographenes is estimated as possible.

1. Introduction

Carbon quantum dots (CQDs) are a material that combines a multiplicity of applications with the abundance and cheapness of the production materials and the relative simplicity of the production methods [1,2,3,4,5,6,7]. The brief list of existing and promising applications includes solar cells and materials for energy conversion [8,9,10], bioimaging, drug delivery, and other medicinal applications [11,12,13,14,15,16,17] due to low cytotoxicity and high biocompatibility [14,15,16,17]. The sources for the fabrication of CQDs are somewhat diverse, from graphite and carbon nanofibers [18] to small organic molecules, such as citric acid and o-phenylenediamine (both discussed in this work), or natural products, such as tea leaves [13], seeds [19], or banana peels [20]. The production of the CQDs does not require high pressures exceeding 30 bar, high temperatures (the usual temperatures for the synthesis are below 230–240 °C), particular reactants, sophisticated and costly equipment, or rare catalysts. For this reason, CQDs can be easily synthesized in steel bench-top laboratory autoclaves without additional protection. Described experimental details explain the widespread interest in their synthesis. Of course, it should not be forgotten that after such a synthesis, the finest fraction of CQDs particles must still be isolated from the treated solution by separating from all other large-sized fractions (co-products) that do not have fluorescent properties. The process can be easily scaled up in a factory environment for small-scale production, such as for fluorescent markers. However, the described bright picture is overshadowed by one problem: after almost two decades with more than thirty thousand publications, the atomic structure of ordered (non-amorphous and non-polymeric) CQDs remains unresolved and still unclear for experts.
Experimental measurements provide essential information to unveil the atomic structure of CQDs. Unfortunately, the results of CQD characterizations by various methods allow for ambiguous interpretations. The powder X-ray diffraction (XRD) patterns demonstrate the presence of graphite-like structures with interlayer distances, which are practically the same (0.34 nm) or larger than in graphite [21,22]. Raman scattering measurements usually display the standard for layered carbon system broad D and G bands, which are significantly superimposed in terms of the nanosized sp2-hybridized particles with crystal size <2 nm and some rate of amorphization [23,24]. The G-band is the critical feature of the sp2 carbon system, as it has aromatic rings arranged with high planarity which are responsible for the corresponding type of carbon atom vibrations leading to the Stokes scattering of light. The origin of the D-band is the presence of structural defects (edges, vacancies, collective defects, intergrain boundaries, pentagon–heptagon clusters, sp3-defects). The widths of these bands (D and G) depend upon the mean crystalline size and disorder induced by structural defects. Note that the Raman spectra of graphite and graphene oxides also contain the same observed D and G bands having the same positions, but the widths depend on their structural perfection and planarity [23,24]. Fourier-transform infrared absorption spectroscopy (FTIR) and X-ray photoelectron spectroscopy (XPS) demonstrate the oxidation of a particular visible number of carbon atoms. [21,25,26,27,28,29,30,31,32,33,34,35,36,37,38,39]. XPS spectra also indicate some contribution from non-oxidized carbon atoms having sp3 hybridization (similar to diamonds) [21,25,26,27,28,29]. Finally, high-resolution transmission electron microscopy (HRTEM) yields images where the presence of some large round disk-like nanoparticles (the size above 2~3 nm and the thickness above 1.2 nm, see for example [13,39,40,41,42]) with regular crystalline fringes is visible. This brief review of experimental results demonstrates that the model of nanographenes of sub-nanometer size standardly used to describe CQDs [43,44] needs to be revised. Another area for improvement of the current approach to CQD simulation is the need for predictive power (see a detailed discussion on our recent work [45]). Various simulations performed within the standard model of CQDs as nanographenes can propose atomic models for CQDs with given optical properties (note that any values of the energy of emitted photons can be associated with several nanographenes of different shapes and sizes but the same values for the energy gaps); however, they cannot predict the atomic structure of final products based on the chemical formulas of precursors or the list of experimental conditions such as temperature and pH [2,3,46,47].
Since the source of optical activity also remains under discussion, in this research, we studied the synthesis of carbon nanodots (CNDs) observed directly under HRTEM studies and characterized by XPS and Raman spectroscopy. In this study, we take the first steps toward simulating the step-by-step growth of experimentally observed CNDs from organic molecules widely used for the bottom-up synthesis of CQDs. Since the size of discussed systems corresponds with the possibility of realizing quantum effects, discussed CNDs could be considered a suitable model for describing CQDs. Two rather popular precursors (citric acid and o-phenylenediamine) were chosen for our modeling. Each section of the paper starts with a brief review of experimental results followed by the simulation of the first step of CND growth.

2. Computational Method

Theoretical modeling was carried out using the SIESTA pseudopotential code [48], previously used for the simulation of the interactions of graphene oxide with various organic species at temperatures of about 200 °C [49]. The generalized gradient approximation (GGA-PBE) [50] for the exchange–correlation potential in a spin-polarized mode has been used. Van der Waals corrections were also considered [51]. A complete optimization of the atomic positions was carried out. The electronic ground state was consistently found using norm-conserving pseudopotentials [52] for cores with a double-ξ-plus polarization basis of the localized orbitals for non-hydrogen atoms and a double-ξ for hydrogen atoms. The forces and total energies were optimized with an accuracy of 0.04 eV Å−1 and 1.0 meV/cell (or less than 0.02 meV/atom), respectively. The estimation of the possible yield of the discussed reactions based on the calculated energies was performed according to the scheme proposed in ref. [49].

3. Formation of Carbon Nanostructures from Citric Acid (CA)

3.1. Review of Experimental Results

In the last decade, citric acid has been the precursor of choice for the bottom-up synthesis of CNDs. Despite hundreds of papers about synthesizing CNDs from CA, just a few reported syntheses from only CA without additional co-precursors [6]. The leading cause of this small number of publications is the low yield of CNDs for synthesis without additional co-precursors [7]. Adding various co-precursors, especially nitrogen-containing molecules, permits synthesizing CNDs with more diverse properties. On the other hand, synthesizing CNDs from citric acid was intensely scrutinized, including an analysis of all the intermediate products from the reactions [25,26]. All experimental studies discussing the synthesis of CNDs from citric acid demonstrate more or less similar patterns of characterization results. XRD patterns usually show the formation of rotationally disordered graphite-like structures with interlayer distances from 0.34 nm [22,52] to 0.4 nm [29]. The spectra of Raman scattering also suggest the formation of layered carbons [53]. Contrary XPS and FTIR data demonstrate that carbon atoms with sp2 hybridization related to graphene and graphite are not the systems’ only type of carbon atoms [21,25,26,27]. Carbon atoms connected with hydroxyl groups (C–OH) and carbonyl groups (C=O) are numerous. In addition, a visible signature from non-oxidized carbon atoms with sp3 hybridization has been reported in the papers mentioned above. We will use this information to evaluate the validity of the following simulation of step-by-step assembly of CNDs from CA.

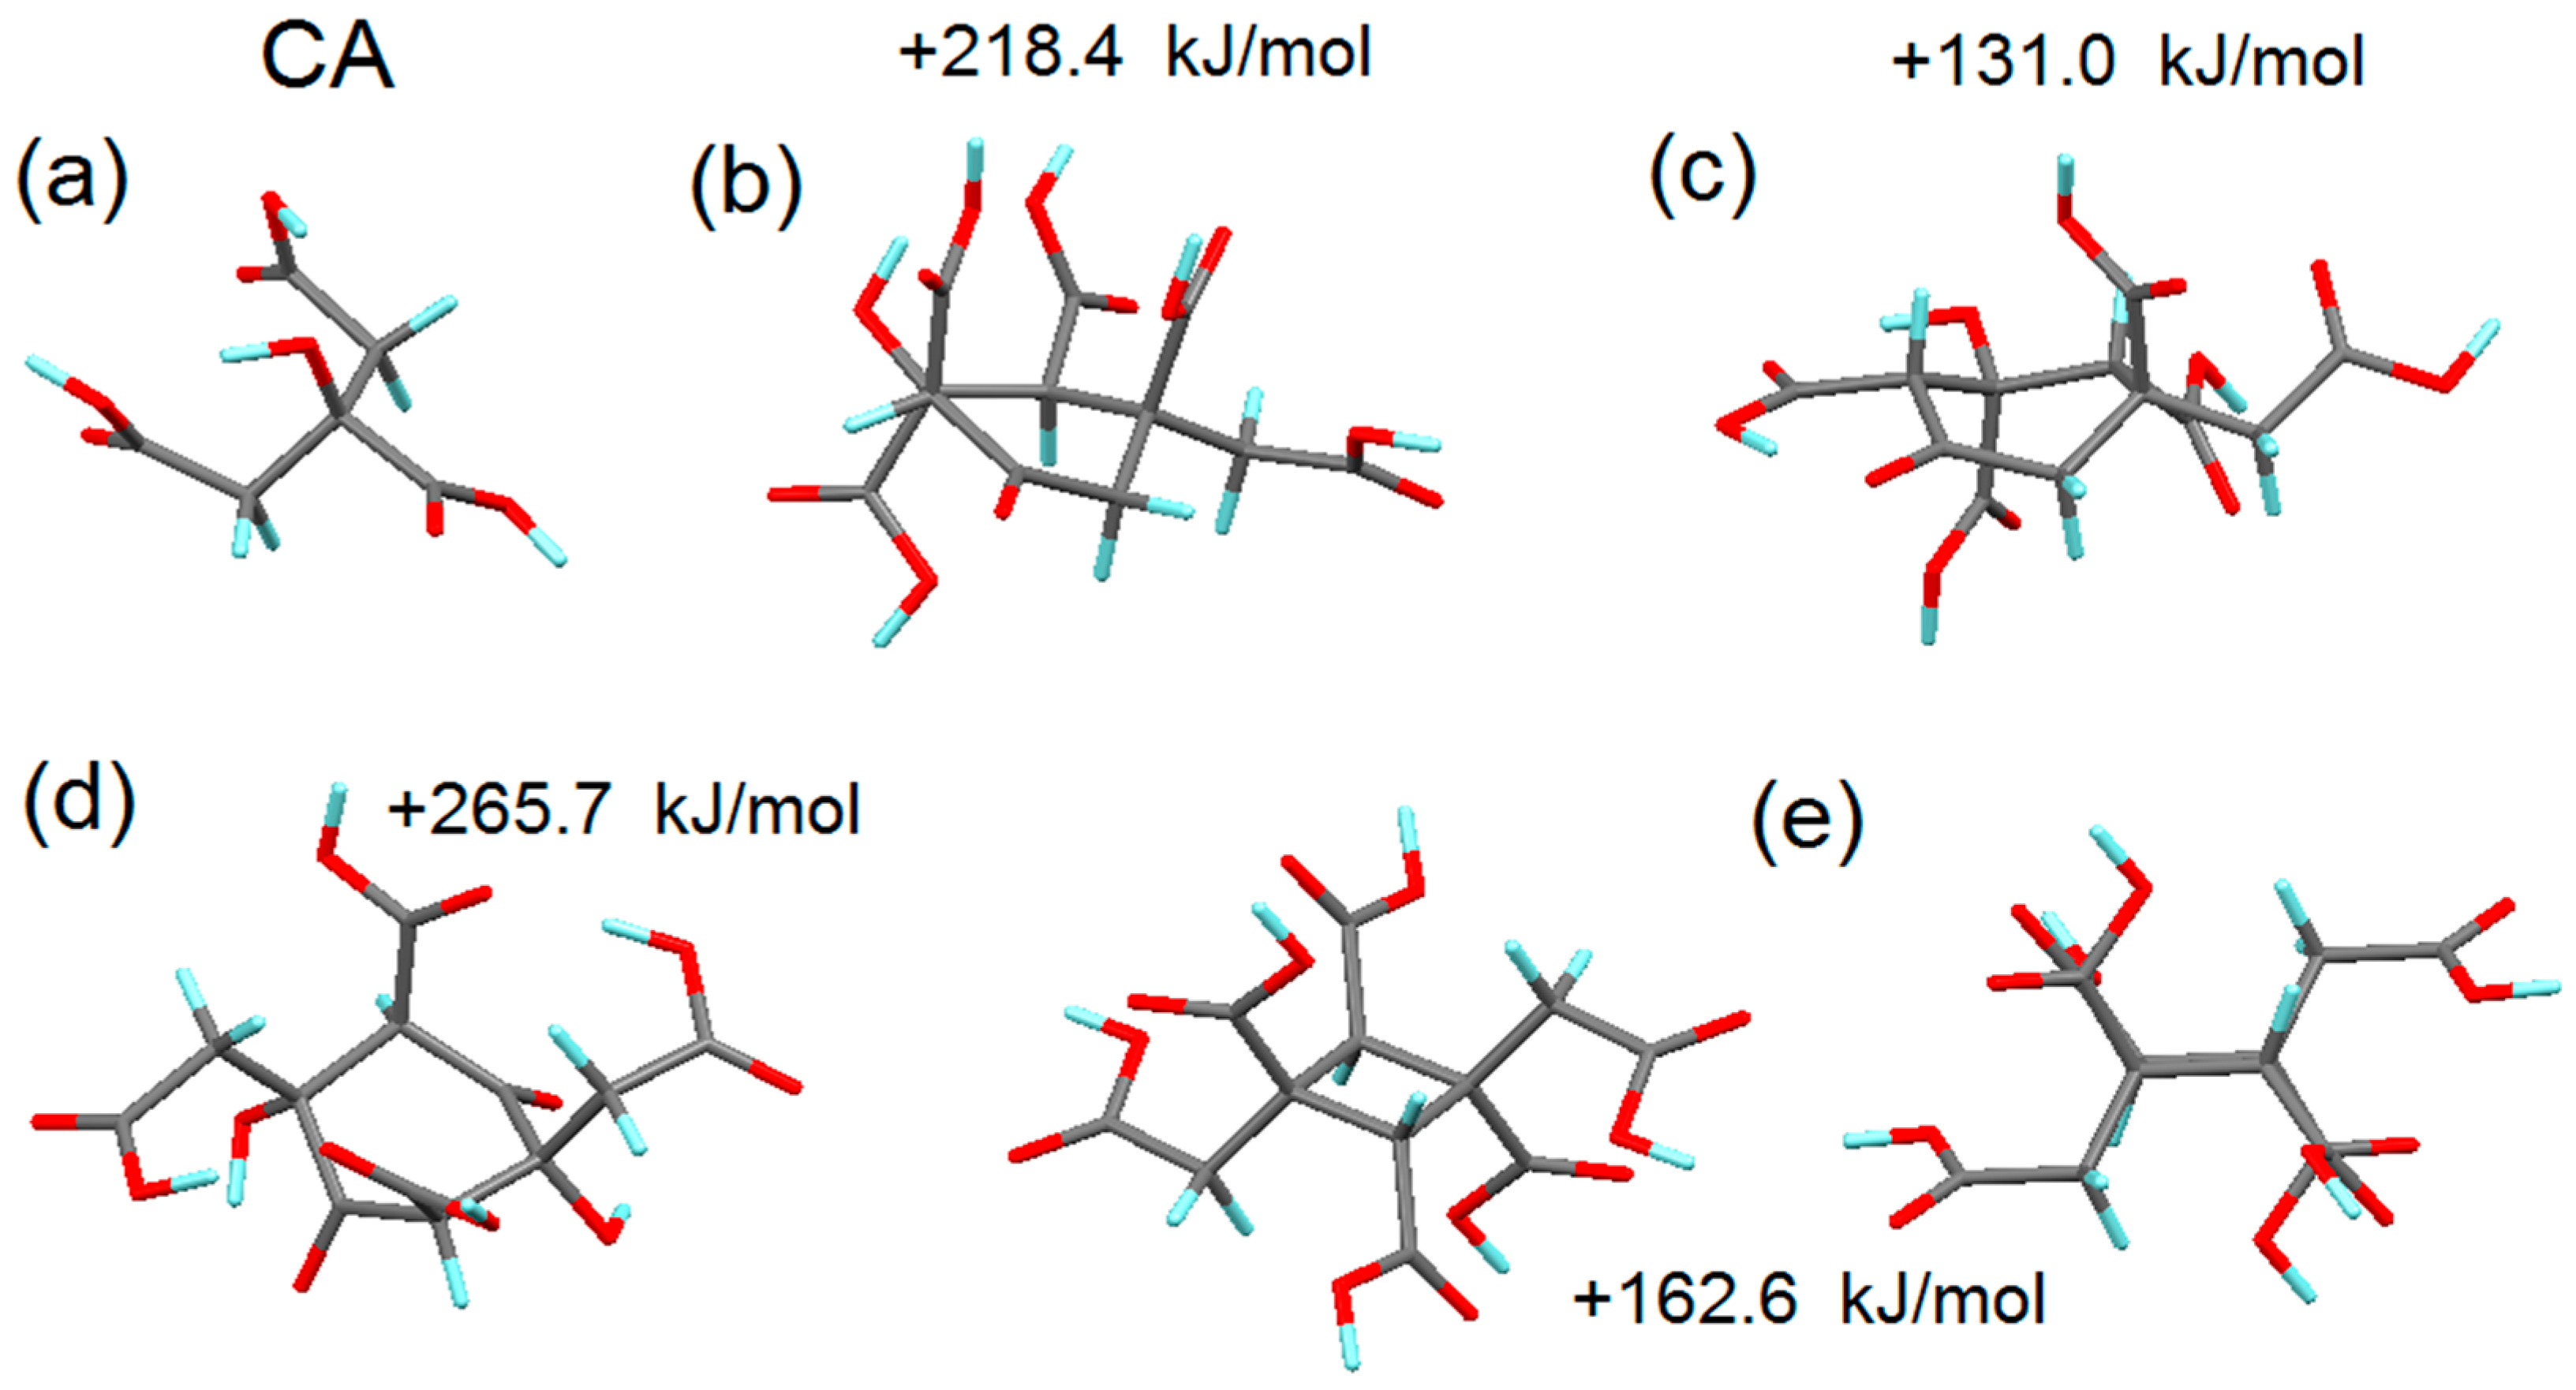
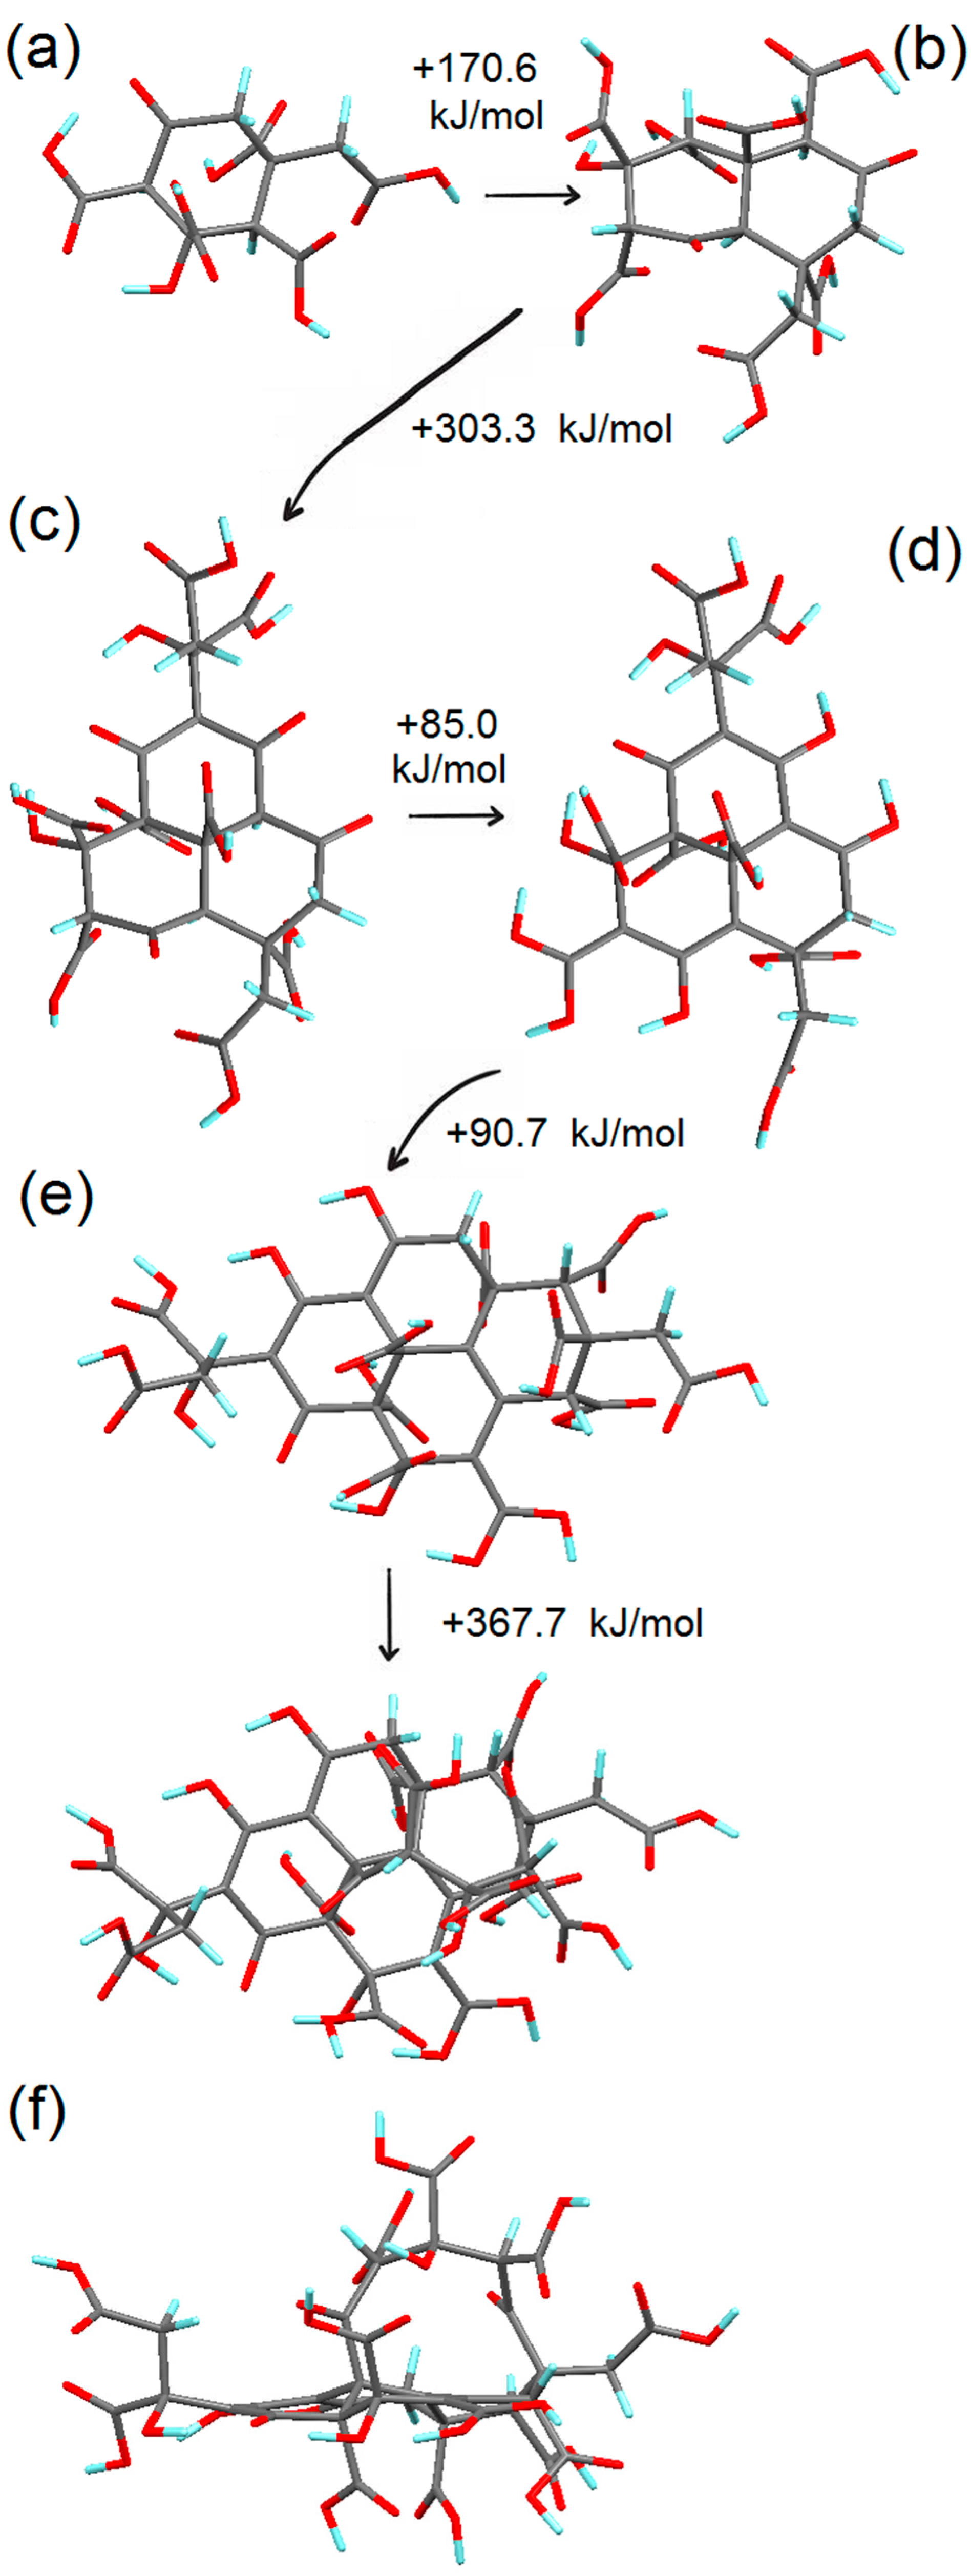
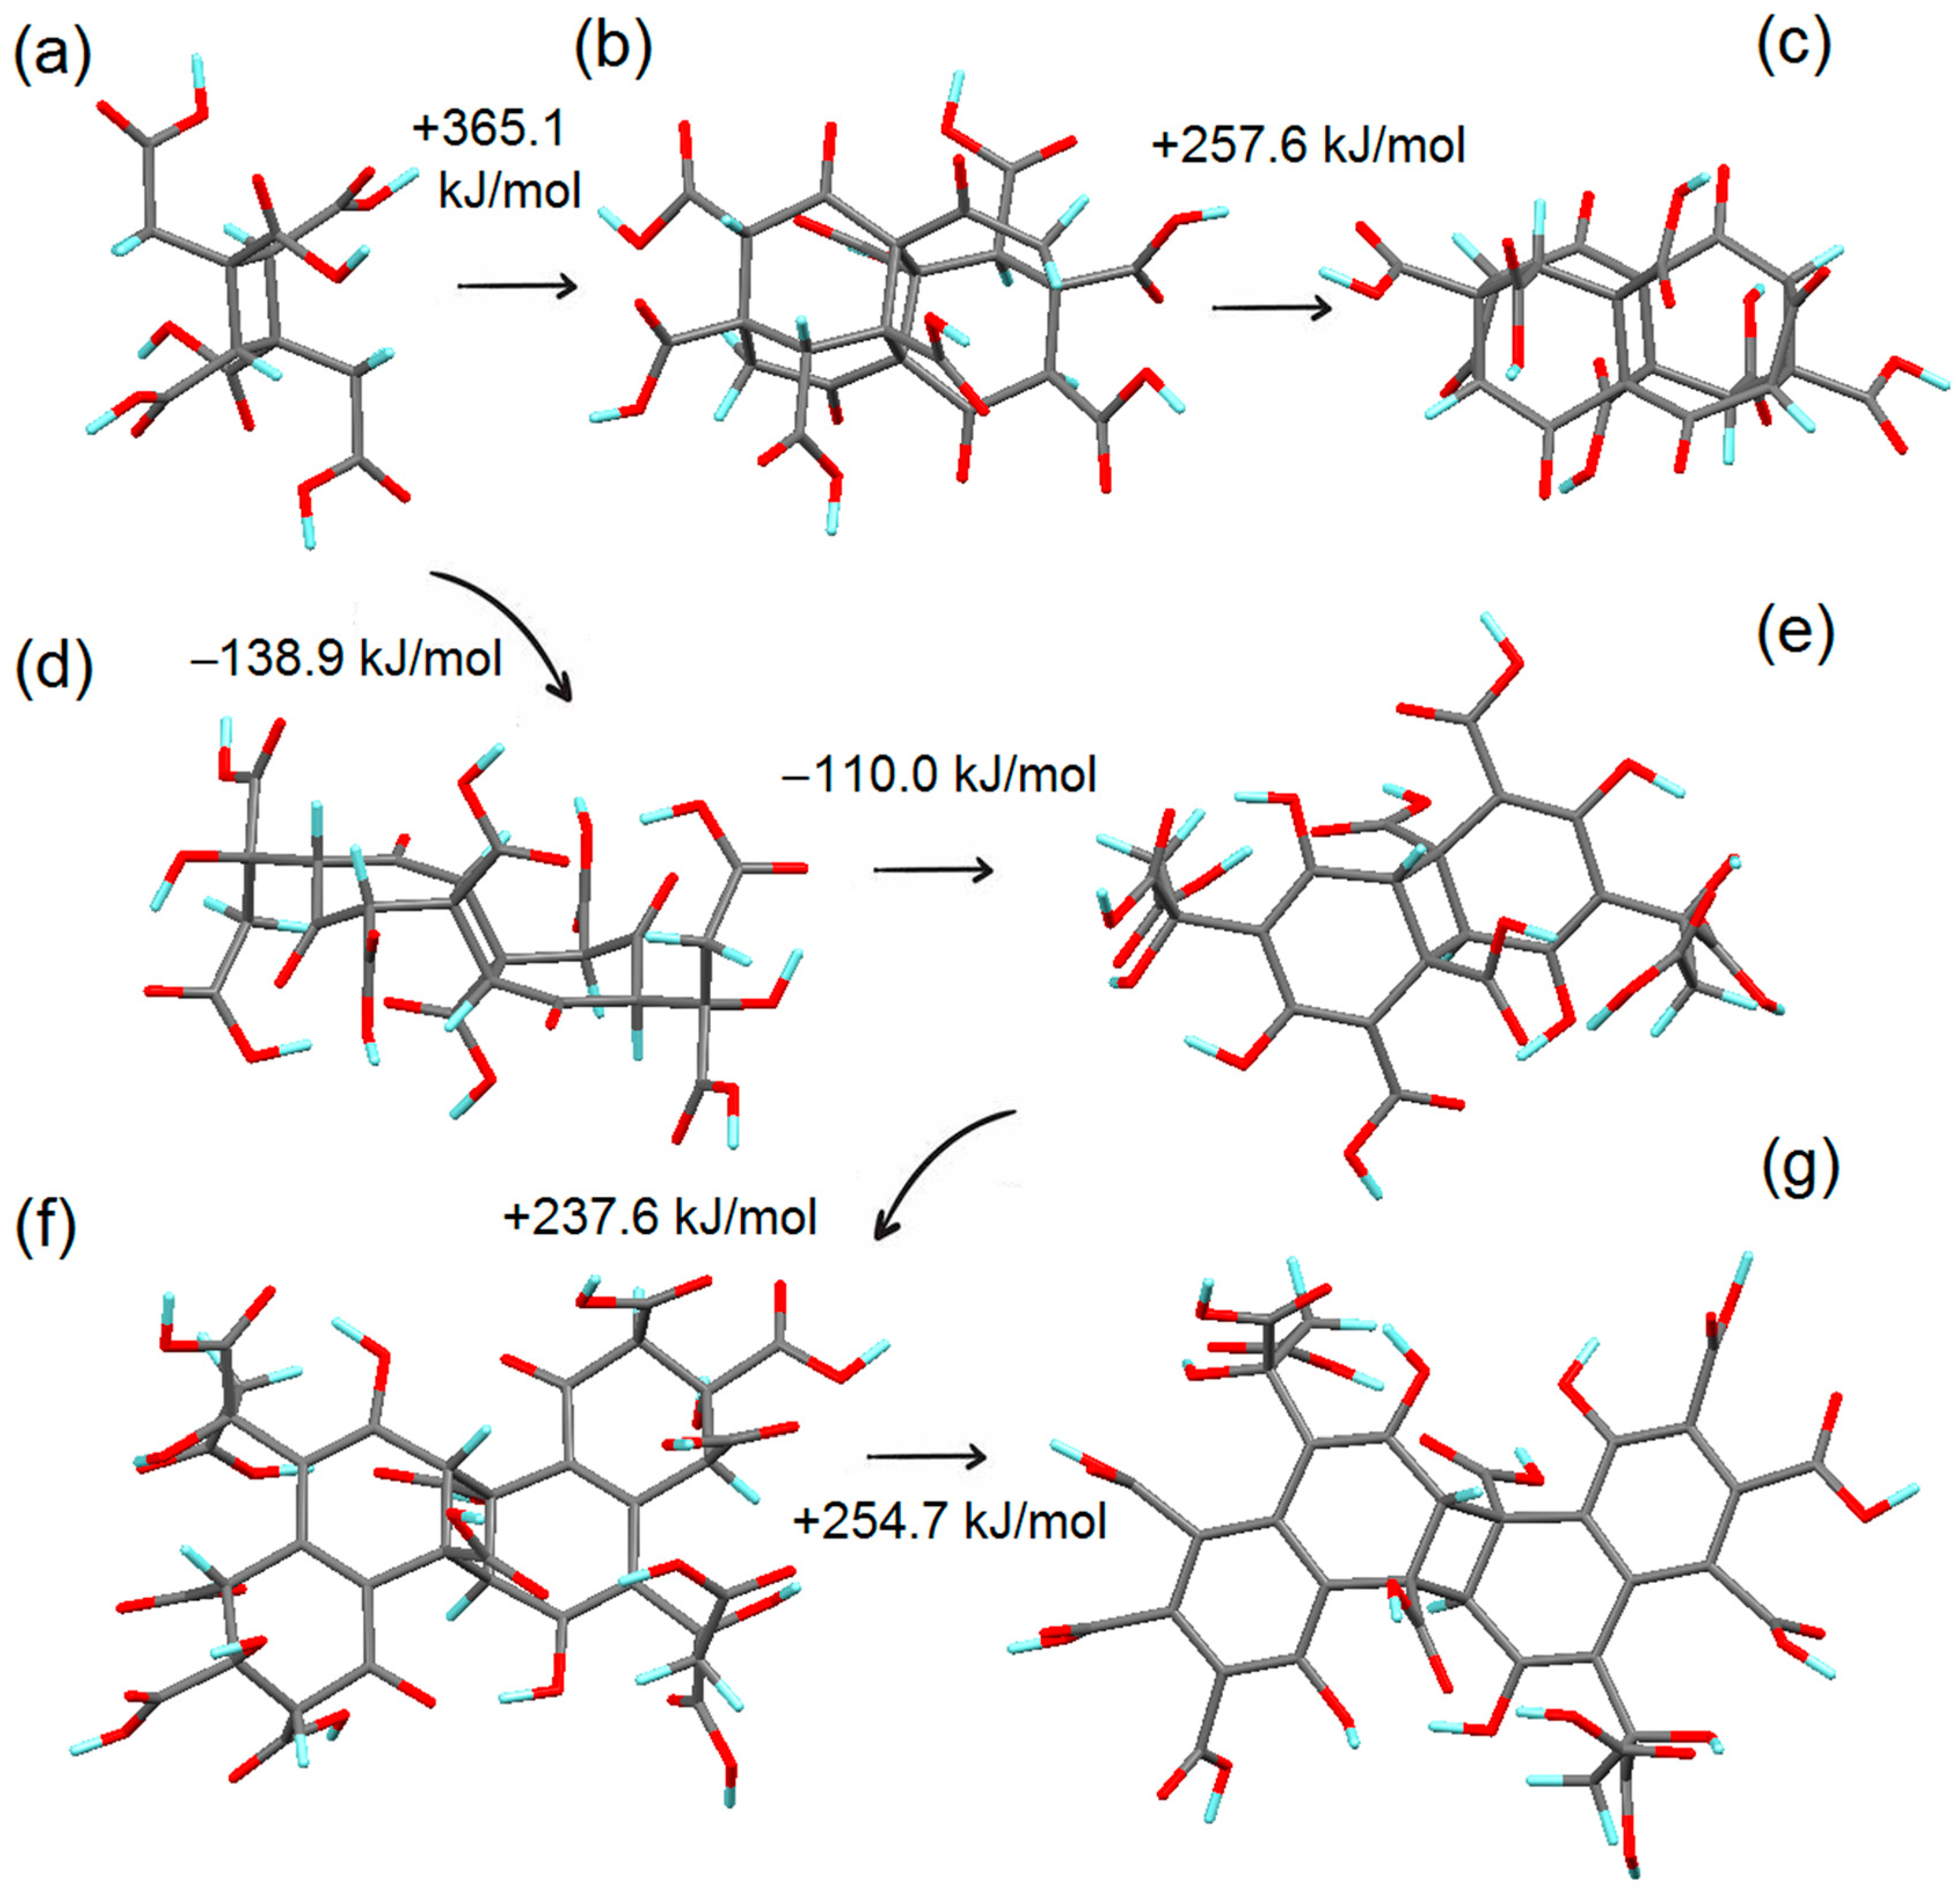
3.2. Simulation of the First Steps of Carbon Dot Assembly from CA

The first step of our modeling is to check the energetics of synthesizing different structures with six-membered carbon rings from two molecules of CA (Figure 1a). The formation of new carbon–carbon bonds can be described by the following equation:
R1–OH + R2–H → R1–R2 + H2O.
Note that in this reaction, –OH groups from carboxyl groups and the hydroxyl group attached to the carbon atoms in central parts of considered systems can participate. The sources of hydrogen are the –CH2– groups. Assembling the rings from two molecules of CA requires two simultaneous reactions described by Equation (1). Four different ring-containing structures can be produced from two molecules of CA. The first two structures correspond with the standard model but with different orientations of the carboxyl groups (Figure 1b,c). The significant difference in the formation energies demonstrates the importance of the contribution from the attraction and repulsion of various groups (–OH, –COOH, –CH2–COOH) on the ring’s edges. In addition to the structures formed by the conventional route, two other structures with carbon rings can be formed (see Figure 1d,e). Note that the enthalpy of the formation structure with four atom rings is only slightly higher than the energy of the most energetically favorable structure shown in Figure 1c (162.6 kJ/mol vs. 130.0 kJ/mol). The difference in the enthalpies of the formation of these structures is much smaller than the energies required for the formation of the other two structures. Thus, we will only consider in the following modeling the structures shown in Figure 1c,e. The formation of all structures shown in Figure 1a–d corresponds with the appearance of C=O groups on the edges of the carbon ring. This result agrees with the experimentally detected appearance of the signatures from these groups in XPS spectra. The calculated energies required for the first step of the formation of CND from CA are positive, and the magnitudes of these energies are not negligible. This result agreed with the experimentally observed low yield of CND when only CA was used as a precursor. Since the first step with the products shown in Figure 1 was realized in the experiments, the calculated values of the enthalpies of the first step will be used as a benchmark to evaluate the possibility for the formation of CNDs in the following stages.
The next step of our work is a step-by-step simulation of the growth of graphenic structures by attachment of the following CA molecules to the most energetically favorable co-product of the first step of the analyzed process (Figure 1c). The addition of the following CA molecule to this structure via the two reactions described by Equation (1) doubles the number of carbon rings in the product (see Figure 2a,b). The energy required for this step is almost the same as that required for the formation of the structure shown in Figure 1e. The attachment of the following CA molecules also leads to the increase in the number of carbon rings in the structure (see Figure 2c). Still, the energy cost of the reaction is almost twice as high as that of the previous step. One of the reasons for this high energy cost is the contribution of the energy cost from the distortion of carbon rings. In the structures shown in Figure 1b–e and Figure 2a–c, all carbon atoms in these rings, except those belonging to carbonyl (C=O) groups, have sp3 hybridization. This hybridization corresponds with the deformation of the rings, which is energetically costly in polycyclic aromatic structures (for a detailed discussion, see Ref. [54]).
Since only hydrogen-containing groups can participate in the reactions described in Equation (1), each step of this reaction provides an unavoidable increase in the number of C=O groups on the edges at each step of the reaction (one in the structure shown in Figure 2a and four in the structure shown in Figure 2c). Thus, after several steps, there will be no suitable spots for the attachment of the following CA molecules. Both described difficulties, i.e., structural distortions and excess of carbonyl groups, can be eliminated through reconstruction of the edges by migrating the proton from the nearest R–H group to the oxygen of the carbonyl group; this leads to the formation of the hydroxyl group suitable for further attachment of the CA molecule. The following equation describes this process:
R1–CR2H2–CO–R3 → R1–CR2=COH–R3.
This process is shown in Figure 2c,d. Since the pH level of the media is an important factor for the favorability of the proton transfer, the change in the pH values must influence the reaction described by Equation (2). Some experimental studies demonstrate the significant influence of pH on reaction yields [2,44,45]. Note that the process shown in Figure 2c,d also converts single C–C bonds to double ones (see Figure S2) and leads to the appearance of carbon atoms in a state of sp2 hybridization. Despite decreasing the structural frustration caused by reaction (2), adsorption of the following CA molecules by increasing the number of carbon rings to four (see Figure 2e) is also energetically costly. To understand the nature of this high energy cost for tiny carbon particle growth, we need to pay attention to the carboxyl groups in the central parts of the graphenic structure. Every step of the assembly corresponds with an increasing number of these groups attached to the edges of the forming nanographenes and connected with carbon atoms in their central parts. The distribution of these carboxyl groups is not ordered and the distance between these groups makes the formation of hydrogen bonds possible. This affects not only the reciprocal reorientation of –COOH parts but also the distortion of the graphenic plane. Another problem with these groups is the impossibility of forming layered structures from graphene with interlayer space close to the graphite, as was recently observed in several experiments [41,42,43], because the ‘height’ of carboxyl groups already exceeds 0.3 nm. On the other hand, these out-of-plane carboxyl groups can also participate in the reaction described by Equation (1). To simulate this scenario, we modeled the attachment of the CA molecule not to the edges of the structure shown in Figure 2e but to the previously discussed out-of-plane carboxyl groups. The simulation results are shown in Figure 2f. Since the calculated enthalpy of the formation of this structure is of the same order as the highest values of enthalpy for the previous steps, we can consider this scenario as possible. The CA molecule attached to out-of-plane carboxyl groups can be the nucleation site for the growth of the next graphenic layer. Since there is a limited number of out-of-plane carboxyl groups and interlayer covalent bonds, the formation of the second layer will not provide diamondization because most of the carbon atoms will be excluded from forming these bonds. The appearance of some number of interlayer C–C bonds agrees with XPS data, where the specific signatures from non-oxidized carbon atoms with sp3 hybridization were also registered.
Since the atomic structures of the systems shown in Figure 1b–d are somewhat similar, the evolution of the structure in Figure 1c discussed in the previous paragraph and shown in Figure 2 can also be realized for the systems in Figure 1b,d. Thus, the last step in our study about the formation of CNDs from CA is the simulation of step-by-step additions of CA molecules to the structures shown on Figure 1e.
Contrary to previously studied systems, the initial structure that sets the growth has the center of symmetry (see Figure 3a); therefore, we simulated the symmetric adsorption of the pairs of CA molecules at each step. The calculation results demonstrate that only two possible scenarios can be realized for this system (Figure 3b,d). Since the formation of the structure shown in Figure 3d corresponds to a negative enthalpy of the formation, we will first discuss this scenario. Despite the presence of the four-membered carbon ring in the center of the system, the overall processes shown in Figure 3c–g is similar to that discussed in previous paragraphs and shown in Figure 2.
The growth of the system also provides an increase in the energy cost of further growth of graphenic planes. Similar to the scenario shown in Figure 2, an increase in the number of carbon rings corresponds to more carboxyl and –CH2–COOH tails at the edges because these structures cannot be easily eliminated by a process such as the one described by Equation (2). On the one hand, these parts of the systems are the sites where the following molecules of CA can be attached. On the other hand, the formation of these bushy structures on the edges decreases the availability of the active site due to the steric repulsion of the reacting parts of the system from neighboring groups on the edges. Note that the formation of the above-described bushy structures on the edges and the negative effect of these structures on the growth of nanographenes were observed with atomic precision in multiple experimental studies devoted to the growth of nanographenes from various precursor organic molecules (see for review Ref. [55]). For this reason, we propose that the formation of two additional rings in the structure shown in Figure 3g is the upper limit for the growth of the nanographene. Note that this nanographene is already distorted and has the square structure of four carbon atoms in the center.
Because the energy cost of the formation of the structures shown in Figure 3f,g is close to the energy cost of the alternative scenario shown in Figure 3b,c, we can propose this pathway as a possible alternative. Reactions discussed previously corresponded with each CA molecule’s participation in forming two covalent bonds between the reactants. However, the system’s structure (shown in Figure 3a) allows one to form three covalent bonds with each attached CA molecule. Contrary to the formation of the flat graphenic structures discussed previously, this route created a closed structure constructed from carbon hexagons (Figure 1b). The reconstruction of the system by the reaction described in Equation (2) leads to the formation of additional carbon–carbon covalent bonds (see Figure 1c). Note that the structure shown in Figure 1c can be described as two graphenic systems with AAA stacking (one hexagon over another) connected by several interlayer carbon–carbon interlayer bonds.

4. Formation of Carbon Nanostructures from o-Phenylenediamine (OPD)

4.1. Review of Experimental Results

The assembling of CNDs from OPD (Figure 4a) is the subject of multiple studies published in recent years. In Table 1, we summarized the results of the characterization of CNDs synthesized from OPD by different groups. Some systems, such as one and seven, are used to synthesize only OPD and water; mainly various acids are used as additional precursors (numbers four, five, and eight). Ethanol is also used as a co-precursor (numbers two and six). Despite the difference in co-precursors used, the overall patterns can be articulated.
Raman measurements reported in all studies demonstrate what is typical for various defective graphenic system D and G wide bands, which are superimposed for small nanoparticles with a certain defectiveness. Sometimes the A-band (at 1500–1520 cm−1) of high intensity related to amorphous carbon is located in the valley between the D and G bands and significantly modifies the spectrum. Almost all studies where HRTEM studies were carried out reported the formation of nanocarbon systems with well-resolved crystalline lattice fringes. Four of them report the observation of regular crystalline patterns with ~0.21 nm distance between the fringes, and two report other values (0.19 and 0.24 nm). XPS studies demonstrate the presence of well-resolved signatures from C–OH bonds not related to carboxyl groups. The reported spectra of N 1s peaks indicate a certain amount of nitrogen atoms in a graphitic position. XPS and FTIR studies report an insignificant number of amino groups (except system number five). The contribution from N–H groups in infrared absorption spectra is usually weak and reported only in two of the nine discussed studies (numbers three and six). Additional completed nuclear magnetic resonance (1H NMR) studies suggest the possible presence of 2,3-diamino phenazine (2,3-DAPN) (Figure 4b) or similar molecules. In the work of C. Ji et al. [41] (number eight), the presence of DAPN-like molecules was discussed due to the decomposition of CNDs. Thus, based on the reported experimental results, we can conclude that synthesis of CNDs from OPD with or without co-precursors leads to the formation of ordered graphene-like systems with oxidation of the central carbon atom part and the presence of various amounts of nitrogen sites in graphitic, pyrazine, or pyridine configurations. Since the production of CNDs by various methods using different co-precursors provides similar results, some general schemes for the fabrication of CNDs from OPD can be derived.

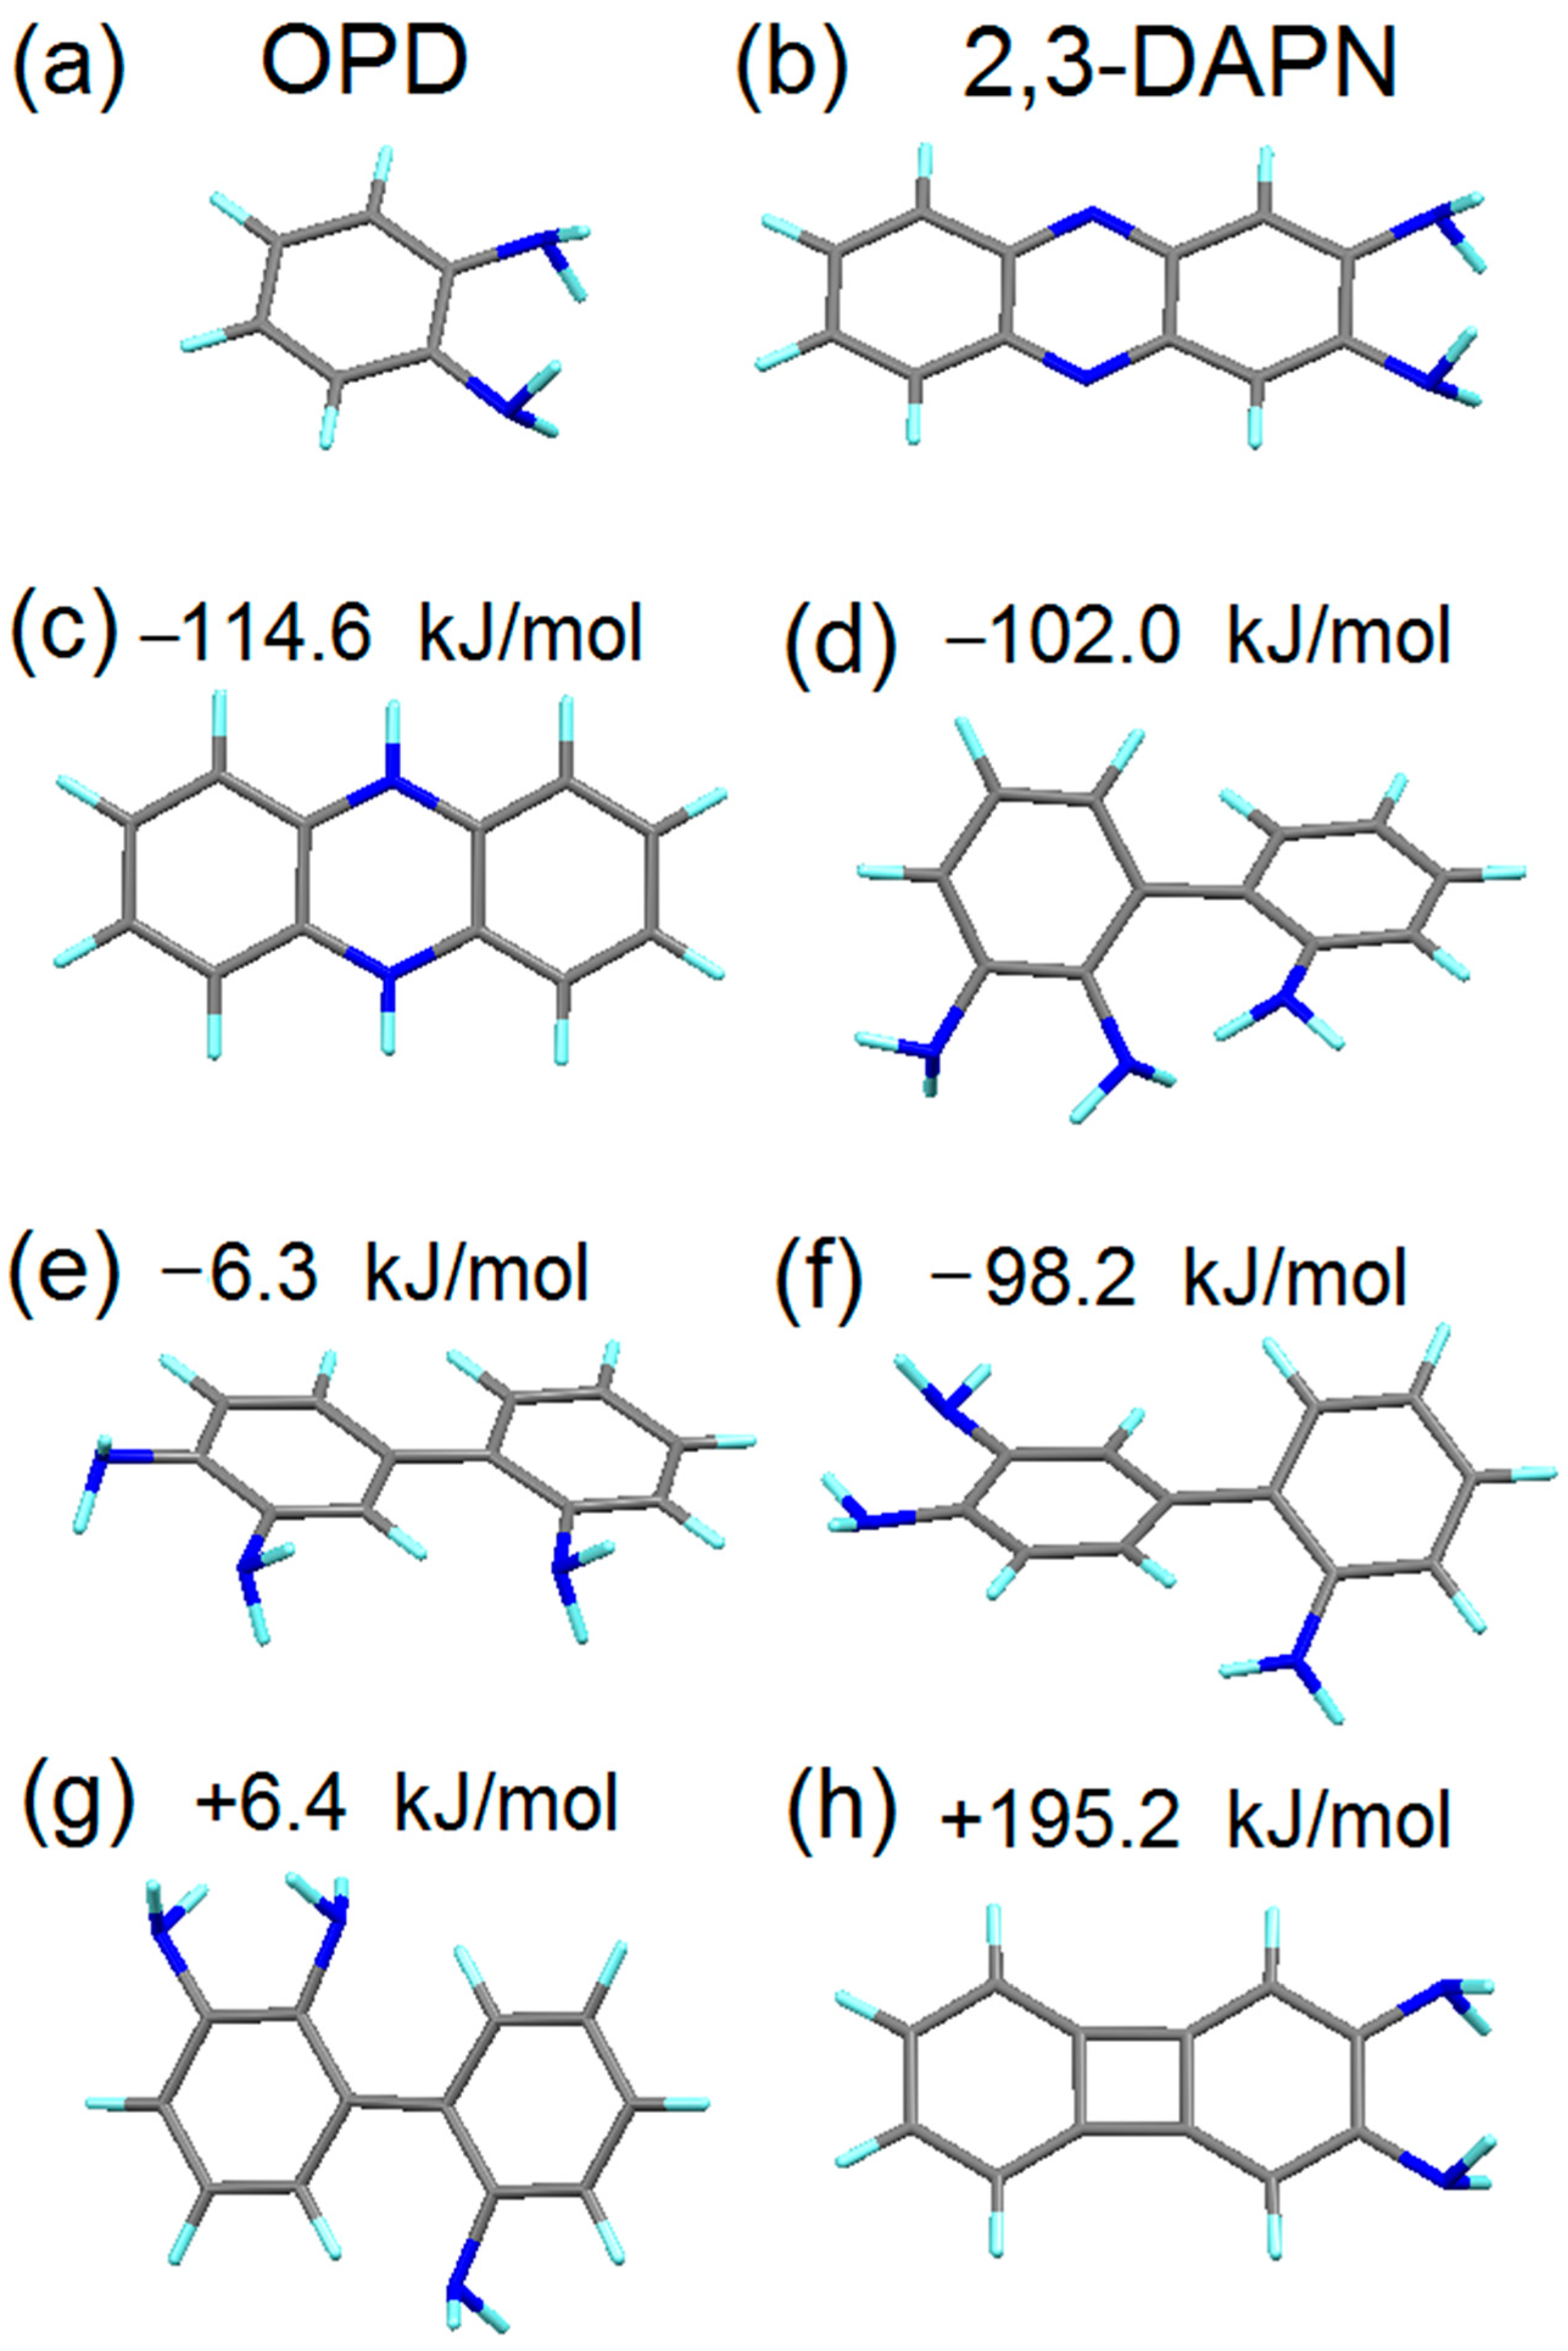
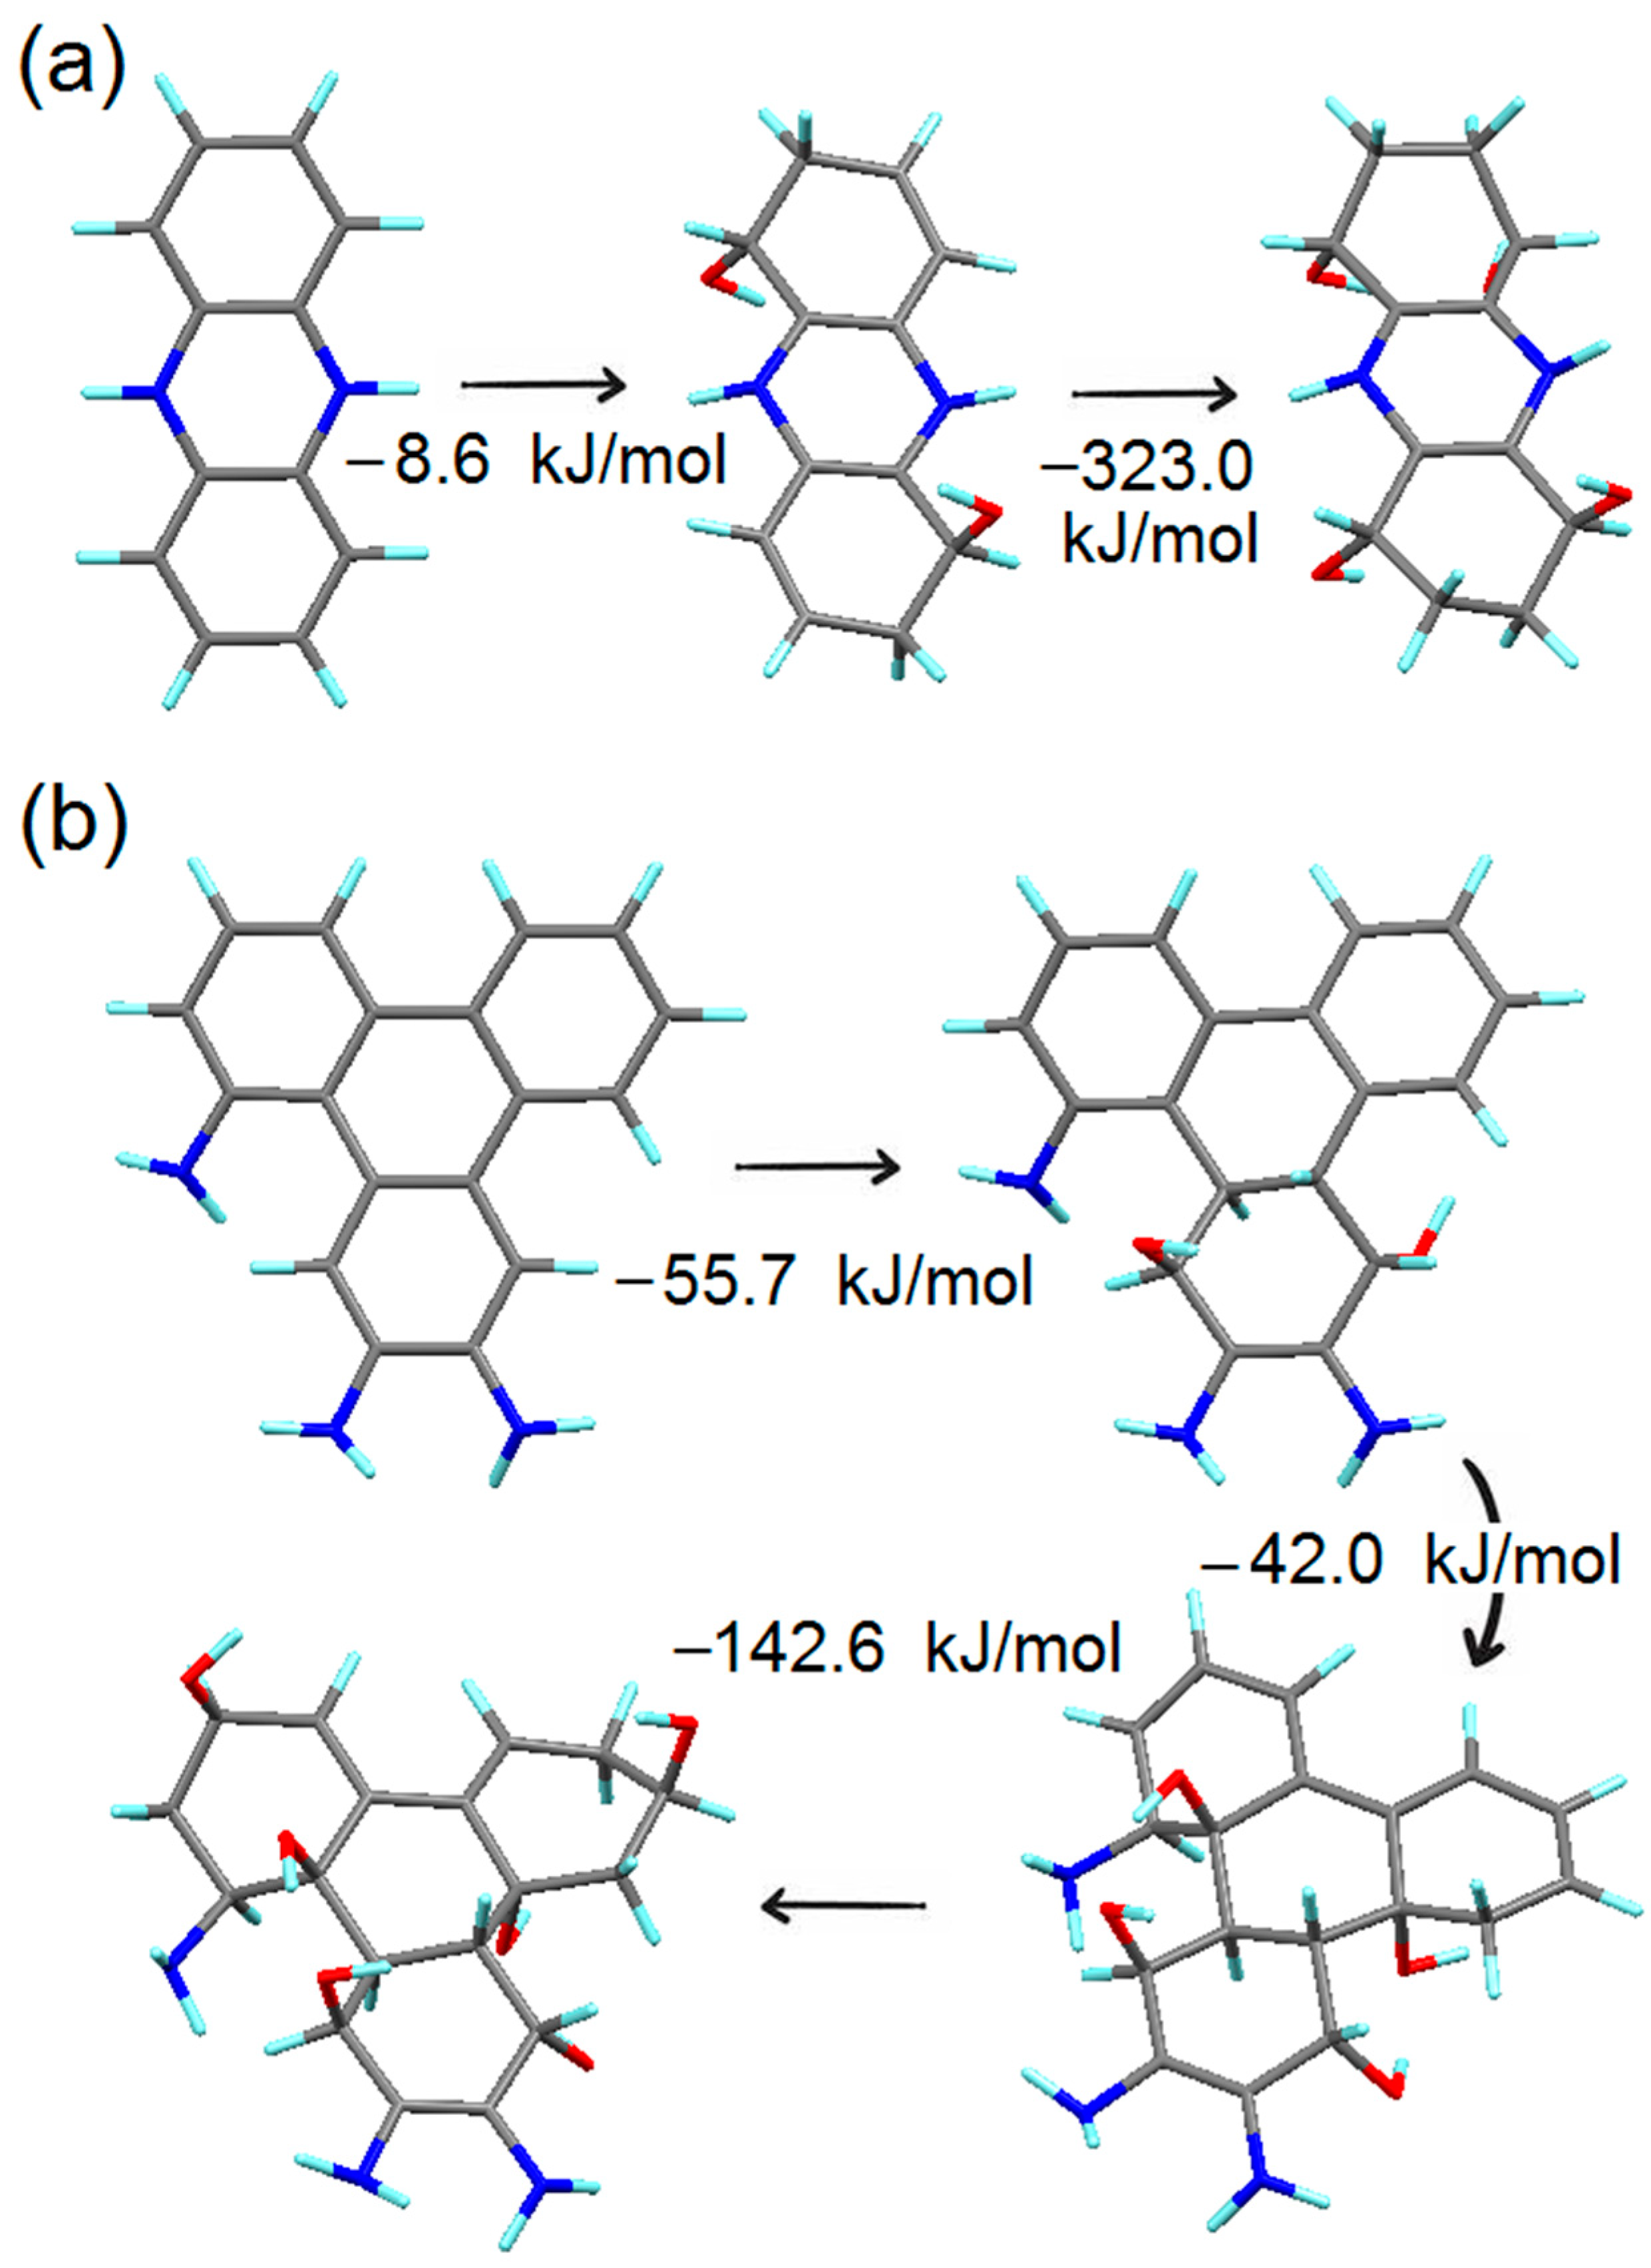
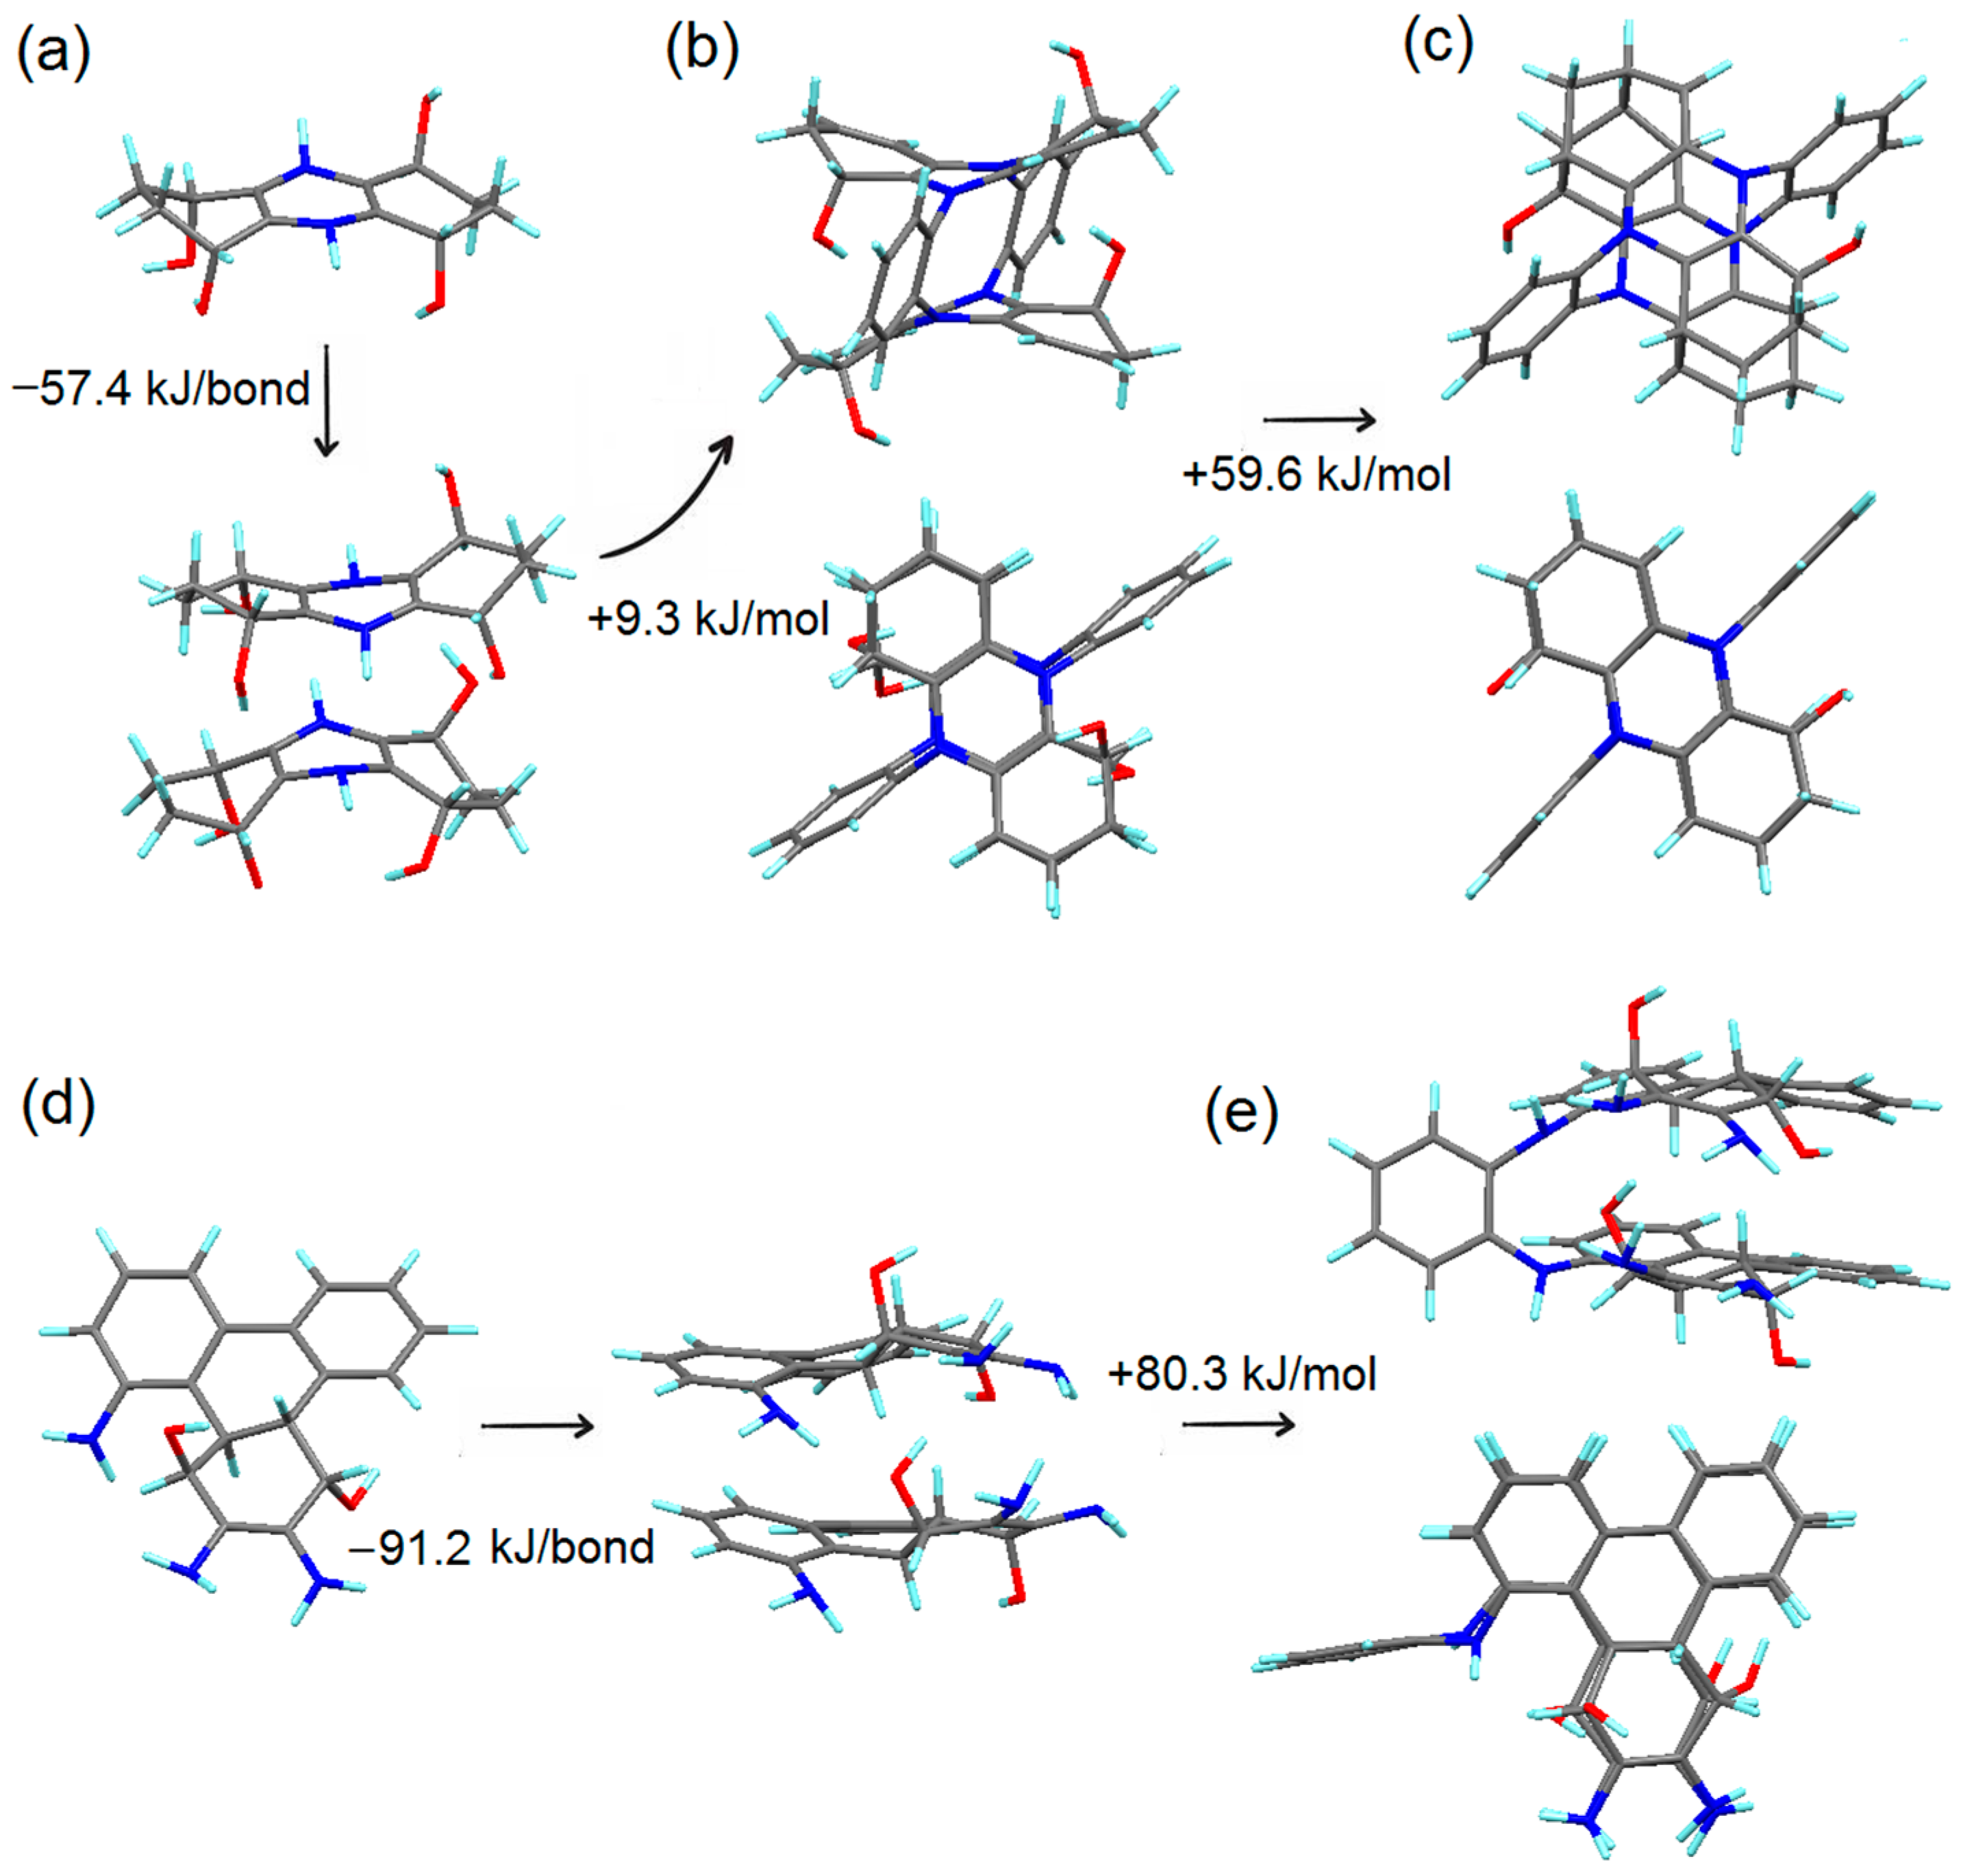
4.2. Simulation of the First Steps of Carbon Dot Assembly from OPD

To reveal general schemes for the formation of CNDs from OPD, we performed a set of simulations of the first steps of the reaction. Experimental results discussed in the previous section demonstrate that different additional precursors significantly affect only the ratio between various nitrogen sites (graphitic, pyridine, pyrazine, and amino). Thus, we will consider assembling CNDs from OPD and water in the following modeling. Furthermore, since this process was reported in work by Qing Zhang et al. [30], we will compare our results with those reported in the mentioned paper.
The first step of our modeling is to check the interaction between two molecules of OPD (Figure 4a). As discussed previously, the primary source of the chemical activity in OP and similar systems are the amino groups [30,32]. The interaction between two molecules of OPD or OPD-based structures with the formation of new covalent bonds can be realized via two different routes:
R1–NH2 + R2–NH2 → R1–NH–R2 + NH3,
R1–NH2 + R2–H → R1–R2 + NH3.
The second route is described by Equation (3) and corresponds to the formation of C–C bonds. Since ODP has two amino groups, the two reactions described by Equations (3) and (4) can coincide. The first route is proposed as the step to synthesizing 2,3-DAPN (see Figure 4b) and similar molecular structures (Figure 4c). The second route corresponds to the polymerization of OPD discussed in several experimental studies [28,33,36]. Such simulations demonstrate that both paths correspond to almost the same enthalpies of the reactions (see Figure 4d,f). Thus, only two alternative pathways for the “graphitization” of OPD-based systems can be proposed. Note that both paths decrease the amount of nitrogen and especially amino groups among the products and co-products of the reactions related to CND formation. Furthermore, the negative signs of the enthalpies of the first steps of CND assembly from OPD are in qualitative agreement with the experimentally reported high synthesis yields of up to 96% [37].
Amino groups of the structure shown in Figure 5d can participate in the reactions described by Equation (3). This reaction is also energetically favorable and increases the number of aromatic rings (see Figure 5a,b). The covalent attachment of the following OPD molecule is also energetically favorable. Still, during this step, the increase in the number of aromatic rings also leads to the formation of a nitrogen-containing pentagonal structure (see Figure 5c). Note that the structure obtained in the process shown in Figure 4a has –NH–, which can participate in the reaction described by Equation (4). Our simulation results demonstrate that for both initial structures, energetically favorable reactions lead to the transformation of –NH– centers to the parts of pentagonal rings (see Figure 5e,f). Note that the enthalpy of simulated reactions is lower than that of almost all reactions corresponding with the polymerization of OPD-based structures (Figure 4e–h). Thus, “graphitization” must be considered not as the reaction following polymerization, as proposed in some studies [36], but as a concurrent process. To estimate the rates of these two processes, we calculated the probabilities of both processes using the Boltzmann equation with energies from Figure 5a–c for graphitization and from Figure 4d,f for polymerization. Results of the calculations demonstrate that at 200 °C, the rates of these processes are almost the same (the estimated ratio of the products of polymerization and graphitization is 0.52:0.48). The attachment of the following OPD molecule near nitrogen-containing pentagons forms carbon heptagons (see Figure 5d,g). Contrary to the previous reaction steps, the enthalpy of the former step is positive, but the magnitude of the enthalpy is moderate. Thus, increasing the temperature of the reaction can provide the formation of the N-containing pentagon–heptagon pairs shown in Figure 5d,g. The effect of the synthesis temperature of CNDs from OPD had been experimentally observed by Yulong An et al. [35]. Note that the similarity between the energies and atomic structures of the products suggest that reactions shown in Figure 5 can be realized at any stage of the formation of graphenic systems from OPDs and explain the valuable amount of graphitic nitrogen centers reported in almost all experimental studies summarized in Table 1. Another conclusion from the similarity between the energies and structures discussed in this paragraph is a possibility for the articulation of the general approach to the prediction of the wireframe atomic structures of CNDs based on the chemical composition of the reactants.
All experimental studies related to the formation of CND from OPD report the remarkable amount of hydroxyl groups in the reaction products even after their separation and purification from adsorbed water (see Table 1). Ethanol or other organic precursors can be proposed as a source of –OH groups in the final synthesized products. On the other hand, a significant amount of these groups was also found in the studies where precursors could not be a source of these groups or where the additional precursors were not used, for example in the work of Qing Zhang et al. [30]. Therefore, water from the autoclave can also be considered a credible source for the appearance of these groups in the final products. To check the possibility of this scenario, we performed a step-by-step simulation of water decomposition on the surfaces of two different systems considered as the most probable products of the initial stages of OPD-based structure graphitization; this is shown in Figure 5c and Figure 6b. The results of the simulation of molecule-by-molecule decomposition of water on considered substrates are shown on Figure 6 and demonstrate strong favorability of these processes for both considered initial systems. Thus, the presence of hydroxyl groups in the XPS and FTIR spectra of CND synthesized from OPD can be discussed as the result of water decomposition at the early stages of the so-called “graphitization” through the rearrangement of molecular fragments.
The next step in our modeling of the early stages of CND fabrication from OPD is to check for the formation of layered structures. Considering the significant amount of hydroxyl groups revealed in spectral data and discussed in the previous paragraph, we simulated the interaction between the systems obtained as intermediate and final products of water decomposition (Figure 7a,b). This step involves modeling the formation of covalent bridges between the neighboring aromatic layers through the reactions described in Equation (3) or Equation (4). These processes correspond to the attachment of an OPD molecule to chemically active sites (–NH2 or –NH–) in both “layers”, as shown in Figure 7b,e. Note that forming these covalent bridges/links is one more route to the appearance of nitrogen in the substitutional graphitic positions. For the structure shown in Figure 7b, we also simulated the formation of additional covalent bridges between the neighboring ‘layers’ (see Figure 7c) by the process described in the following equation:
R1–OH + R2–H → R1–R2 + H2O.
Simulated structures and corresponding formation enthalpies per interacting hydroxyl groups are shown in Figure 7a–c. In almost all cases, the magnitudes of calculated enthalpies of non-covalent interactions are lower than the enthalpy of water vaporization (43 kJ/mol) [56]. Therefore, we propose that forming non-covalent bonds between aromatic layers in water media is an energetically favorable process. The processes shown on Figure 7a,d,e is endothermic. Still, the magnitude of the enthalpy is relatively moderate (below 100 kJ/mol). Therefore, the process can also be realized at the temperatures used for synthesizing CND from OPD (about 200 °C) [49].
Note that the formation of these ‘interlayer’ covalent bridges/links does not lead to the formation of 2D diamonds since only a few atoms in both systems form these bonds. The distance between aromatic planes for these structures remains in the order of 0.28–0.31 nm, which agrees with the presence of some graphite-like structures revealed by XRD and Raman measurements (see previous sub-section). Note that the formation of the covalent bonds between aromatic planes means the strict fixation of one aromatic ring above the other (see Figure 7), which could be proposed as an initial stage in the formation of bilayered graphenic nanostructures with AA stacking. Note that in graphite this structure relates to an experimentally observed pattern of regular crystalline fringes with a period of 0.21 nm [57]. Another outcome from the formation of covalent interlayer bonds shown in Figure 7b,e is the possibility of forming DAP-like structures on the edges of CND, as was discussed in multiple studies based on the results of NMR studies.

5. Conclusions

The simulations of the initial steps in the assembly CNDs from citric acid or o-phenylenediamine demonstrate that some simple general principles for the bottom-up synthesis of CNDs from different molecules may be articulated even at this stage. Below, we present the key conclusions.
The formation of graphenic systems from citric acid corresponds with the appearance of excessive carboxyl groups on the edges and basal planes, even during the early stages of the process when the number of carbon rings in the system is below ten. Different scenarios for eliminating these excessive carboxyl groups lead to the same outcome: forming a layered structure with a visible amount of covalent bonds between the layers. The energy cost of this scenario (about +360 kJ/mol) is in the same order as the energy costs corresponding with scenarios of in-plane growth of nanographenes (about +260~+340 kJ/mol). Rather large values for the energy costs in many of the steps of the reactions discussed in this section correspond with the low yield of CNDs observed in experimental studies, where CNDs were synthesized from CA without any other precursors.
The fabrication of the CNDs from o-phenylenediamine can be described as the combination of in-plane growth of graphenic sheets with nitrogen centers in graphitic positions and concurrent oxidation of these systems by the decomposition of water molecules. Out-of-plane hydroxyl groups can participate in the formation of covalent carbon–carbon bonds between layers. Another source of interlayer covalent bond formation is an attachment of OPD molecules to the active centers of two different graphenic structures composed of OPD molecules.
Thus, based on the results of our simulations, we can claim that the standard model of CQDs (formation path and internal structure) as small ordered nanographenes (<3 nm) is oversimplified. Modeling the early stages of graphenic system assembly from small organic molecules demonstrates a tendency to form a layered system with a certain amount of covalent carbon–carbon bonds between adjacent layers and essential oxidation not only along the edges but also in the basal planes of growing surfaces. Apparently, the lateral growth of these molecular structures stops at some point (until they reach ~1 nm size) due to the abundance of structural defects at the periphery of the quasi-graphene planes due to their saturation with oxygen-containing groups.
The resulting structures from a countable number of atoms are, in fact, nucleation centers and seeds for further growth of few-layer graphene structures with an extension of up to 5–7 nm. In this case, in growing structures, transverse covalent links between layers will also appear in specific amounts, providing topological synchronization and coherence of crystal lattices from neighboring layers according to the AA stacking type. The future direction of work will have to consider the oxidation and etching of growing graphene layers (due to the release of carbon dioxide) during the interaction of carbon atoms of the emerging nanostructure with the products of water pyrolysis.

Supplementary Materials

The following supporting information can be downloaded at: https://www.mdpi.com/article/10.3390/cryst13050716/s1, Figure S1: 2D schemes of the first step of the formation of CNDs from citric acid shown on Figure 1 in the main text. The notations of the panels are corresponding with notation of the structures on Figure 1 in the main text; Figure S2: 2D schemes of the first step of the formation of CNDs from citric acid shown on Figure 1 in the main text. The notations of the panels are corresponding with notation of the structures on Figure 2 in the main text.

Author Contributions

Conceptualization, D.W.B. and V.Y.O.; methodology, D.W.B.; software, D.W.B.; validation, D.W.B. and V.Y.O.; formal analysis, V.Y.O.; investigation, D.W.B.; resources, D.W.B.; data curation, V.Y.O.; writing—original draft preparation, D.W.B.; writing—review and editing, V.Y.O.; visualization, D.W.B.; funding acquisition, D.W.B. and V.Y.O. All authors have read and agreed to the published version of the manuscript.

Funding

D.W.B. acknowledges support from the Russian Science Foundation (Project No 21-12-00392). V.Y.O. acknowledges the support from Ioffe Institute (project no. 0040-2019-0013).

Data Availability Statement

Data available on request due to restrictions e.g., privacy or ethical.

Conflicts of Interest

The authors declare no conflict of interest.

References

  1. Enoki, T.; Takai, K.; Osipov, V.; Baidakova, M.; Vul’, A. Nanographene and Nanodiamond; New Members in the Nanocarbon Family. Chem. Asian J. 2009, 4, 796–804. [Google Scholar] [CrossRef] [PubMed]
  2. Xia, C.; Zhu, S.; Feng, T.; Yang, M.; Yang, B. Evolution and Synthesis of Carbon Dots: From Carbon Dots to Carbonized Polymer Dots. Adv. Sci. 2019, 6, 1901316. [Google Scholar] [CrossRef]
  3. Wang, X.; Feng, Y.; Dong, P.; Huang, J. A Mini Review on Carbon Quantum Dots: Preparation, Properties, and Electrocatalytic Application. Front. Chem. 2019, 7, 671. [Google Scholar] [CrossRef] [PubMed]
  4. Das, R.; Bandyopadhyay, R.; Pramanik, P. Carbon quantum dots from natural resource: A review. Mater. Today Chem. 2018, 8, 96. [Google Scholar] [CrossRef]
  5. Fan, H.; Zhang, M.; Bhandari, B.; Yang, C. Food waste as a carbon source in carbon quantum dots technology and their applications in food safety detection. Trends Food Sci. Technol. 2020, 95, 86. [Google Scholar] [CrossRef]
  6. Ren, J.; Malfatti, L.; Innocenzi, P. Citric Acid Derived Carbon Dots, the Challenge of Understanding the Synthesis-Structure Relationship. C J. Carbon Res. 2021, 7, 2. [Google Scholar] [CrossRef]
  7. Yang, S.; Li, Y.; Chen, L.; Wang, H.; Shang, L.; He, P.; Dong, H.; Wang, G.; Ding, G. Fabrication of Carbon-Based Quantum Dots via a “Bottom-Up” Approach: Topology, Chirality, and Free Radical Processes in “Building Blocks”. Small 2023, 2205957. [Google Scholar] [CrossRef]
  8. Molaei, M.J. The optical properties and solar energy conversion applications of carbon quantum dots: A review. Solar Ener. 2020, 196, 549. [Google Scholar] [CrossRef]
  9. Rasal, A.S.; Yadav, S.; Yadav, A.; Kashale, A.A.; Manjunatha, S.T.; Altaee, A.; Chang, J.-Y. Carbon Quantum Dots for Energy Applications: A Review. ACS Appl. Nano Mater. 2021, 4, 6515. [Google Scholar] [CrossRef]
  10. Sharma, S.; Dutta, V.; Singh, P.; Raizada, P.; Rahmani-Sani, A.; Hosseini-Bandegharaei, A.; Thakur, V.K. Carbon quantum dot supported semiconductor photocatalysts for efficient degradation of organic pollutants in water: A review. J. Clean. Product. 2019, 228, 755. [Google Scholar] [CrossRef]
  11. Singh, A.; Qu, Z.; Sharma, A.; Singh, M.; Tse, B.; Ostrikov, K.; Popat, A.; Sonar, P.; Kumeria, T. Ultra-bright green carbon dots with excitation-independent fluorescence for bioimaging. J. Nanostruct. Chem. 2022, 13, 377–387. [Google Scholar] [CrossRef]
  12. Molaei, M.J. Carbon quantum dots and their biomedical and therapeutic applications: A review. RSC Adv. 2019, 9, 6460. [Google Scholar] [CrossRef] [PubMed]
  13. Yang, Y.; Ding, H.; Li, Z.; Tedesco, A.C.; Bi, H. Carbon Dots Derived from Tea Polyphenols as Photosensitizers for Photodynamic Therapy. Molecules 2022, 27, 8627. [Google Scholar] [CrossRef]
  14. Šafranko, S.; Goman, D.; Stanković, A.; Medvidović-Kosanović, M.; Moslavac, T.; Jerković, I.; Jokić, S. An Overview of the Recent Developments in Carbon Quantum Dots—Promising Nanomaterials for Metal Ion Detection and (Bio)Molecule Sensing. Chemosensors 2021, 9, 138. [Google Scholar] [CrossRef]
  15. Mansuriya, B.D.; Altintas, Z. Carbon Dots: Classification, Properties, Synthesis, Characterization, and Applications in Health Care—An Updated Review (2018–2021). Nanomaterials 2021, 11, 2525. [Google Scholar] [CrossRef] [PubMed]
  16. Dugam, S.; Nangare, S.; Patil, P.; Jadhav, N. Carbon dots: A novel trend in pharmaceutical applications. Ann. Pharm. Fran. 2021, 79, 335–345. [Google Scholar] [CrossRef]
  17. Santonocito, R.; Intravaia, M.; Caruso, I.M.; Pappalardo, A.; Sfrazzetto, G.T.; Tuccitto, N. Fluorescence sensing by carbon nanoparticles. Nanoscale Adv. 2022, 4, 1926–1948. [Google Scholar] [CrossRef]
  18. Shi, W.; Han, Q.; Wu, J.; Ji, C.; Zhou, Y.; Li, S.; Gao, L.; Leblanc, R.M.; Peng, Z. Synthesis Mechanisms, Structural Models, and Photothermal Therapy Applications of Top-Down Carbon Dots from Carbon Powder, Graphite, Graphene, and Carbon Nanotubes. Int. J. Mol. Sci. 2022, 23, 1456. [Google Scholar] [CrossRef]
  19. Jones, S.S.; Sahatiya, P.; Badhulik, S. One step, high yield synthesis of amphiphilic carbon quantum dots derived from chia seeds: A solvatochromic study. New J. Chem. 2017, 41, 13130. [Google Scholar] [CrossRef]
  20. Atchudan, R.; Edison, T.N.J.I.; Shanmugam, M.; Perumal, S.; Somanathan, T.; Lee, Y.R. Sustainable synthesis of carbon quantum dots from banana peel waste using hydrothermal process for in vivo bioimaging. Phys. E Low-Dimens. Syst. Nanostructures 2021, 126, 114417. [Google Scholar] [CrossRef]
  21. Dong, Y.; Shao, J.; Chen, C.; Hao Li, H.; Wang, R.; Chi, Y.; Lin, X.; Chen, G. Blue luminescent graphene quantum dots and graphene oxide prepared by tuning the carbonization degree of citric acid. Carbon 2012, 50, 4738–4743. [Google Scholar] [CrossRef]
  22. Wang, F.; Pang, S.; Wang, L.; Li, Q.; Kreiter, M.; Liu, C.-Y. One-Step Synthesis of Highly Luminescent Carbon Dots in Noncoordinating Solvents. Chem. Mater. 2010, 22, 4528–4530. [Google Scholar] [CrossRef]
  23. Merlen, A.; Buijnsters, J.G.; Pardanaud, C. A Guide to and Review of the Use of Multiwavelength Raman Spectroscopy for Characterizing Defective Aromatic Carbon Solids: From Graphene to Amorphous Carbons. Coatings 2017, 7, 153. [Google Scholar] [CrossRef]
  24. Bokobza, L.; Bruneel, J.-L.; Couzi, M. Raman Spectra of Carbon-Based Materials (from Graphite to Carbon Black) and of Some Silicone Composites. C J. Carbon Res. 2015, 1, 77–94. [Google Scholar] [CrossRef]
  25. Wang, S.; Chen, Z.-G.; Cole, I.; Li, Q. Structural evolution of graphene quantum dots during thermal decomposition of citric acid and the corresponding photoluminescence. Carbon 2015, 82, 304–313. [Google Scholar] [CrossRef]
  26. Ludmerczki, R.; Mura, S.; Carbonaro, C.M.; Mandity, I.M.; Carraro, M.; Senes, N.; Garroni, S.; Granozzi, G.; Calvillo, L.; Marras, S.; et al. Carbon Dots from Citric Acid and its Intermediates Formed by Thermal Decomposition. Chem. Eur. J. 2019, 25, 11963–11974. [Google Scholar] [CrossRef] [PubMed]
  27. Gao, F.; Ma, S.; Li, J.; Dai, K.; Xiao, X.; Zhao, D.; Gong, W. Rational design of high quality citric acid-derived carbon dots by selecting efficient chemical structure motifs. Carbon 2017, 112, 131–141. [Google Scholar] [CrossRef]
  28. Kundu, A.; Jungpyo Lee, J.; Park, B.; Ray, C.; Sankar, K.V.; Kim, W.S.; Lee, S.H.; Cho, I.-J.; Jun, S.C. Facile approach to synthesize highly fluorescent multicolor emissive carbon dots via surface functionalization for cellular imaging. J. Coll. Interf. Sci. 2018, 513, 505–514. [Google Scholar] [CrossRef]
  29. Dhenadhayalan, N.; Lin, K.-C.; Raghupathy Suresh, R.; Ramamurthy, P. Unravelling the Multiple Emissive States in Citric-Acid-Derived Carbon Dots. J. Phys. Chem. C 2016, 120, 1252–1261. [Google Scholar] [CrossRef]
  30. Zhang, Q.; Wang, R.; Feng, B.; Zhong, X.; Ostrikov, K. Photoluminescence mechanism of carbon dots: Triggering high-color-purity red fluorescence emission through edge amino protonation. Nat. Commun. 2021, 12, 6856. [Google Scholar] [CrossRef]
  31. Dong, Y.; Li, T.; Bateer, B.; Wang, H.; Fu, Q.; Zhang, F. Preparation of yellow emissive nitrogen-doped carbon dots from o-phenylenediamine and their application in curcumin sensing. New J. Chem. 2022, 46, 9543. [Google Scholar] [CrossRef]
  32. Li, P.; Xue, S.; Sun, L.; Zong, X.; An, L.; Qu, D.; Wang, X.; Sun, Z. Formation and fluorescent mechanism of red emissive carbon dots from o-phenylenediamine and catechol system. Light Sci. Appl. 2022, 11, 298. [Google Scholar] [CrossRef]
  33. Wang, B.; Wei, Z.; Sui, L.; Yu, J.; Zhang, B.; Wang, X.; Feng, S.; Song, H.; Yong, X.; Tian, Y.; et al. Electron–phonon coupling-assisted universal red luminescence of o-phenylenediamine-based carbon dots. Light Sci. Appl. 2022, 11, 172. [Google Scholar] [CrossRef] [PubMed]
  34. Vedernikova, A.A.; Miruschenko, M.D.; Arefina, I.A.; Stepanidenko, E.A.; Cherevkov, S.A.; Spiridonov, I.G.; Danilov, D.V.; Koroleva, A.V.; Zhizhin, E.V.; Ushakova, E.V. Dual-Purpose Sensing Nanoprobe Based on Carbon Dots from o-Phenylenediamine: pH and Solvent Polarity Measurement. Nanomaterials 2022, 12, 3314. [Google Scholar] [CrossRef] [PubMed]
  35. An, Y.; Lin, X.; Zhou, Y.; Li, Y.; Zheng, Y.; Wu, C.; Xu, K.; Chaib, X.; Liu, C. Red, green, and blue light-emitting carbon dots prepared from o-phenylenediamine. RSC Adv. 2021, 11, 26915. [Google Scholar] [CrossRef]
  36. Song, L.; Cui, Y.; Zhang, C.; Hu, Z.; Liu, X. Microwave-assisted facile synthesis of yellow fluorescent carbon dots from o-phenylenediamine for cell imaging and sensitive detection of Fe3+ and H2O2. RSC Adv. 2016, 6, 17704–17712. [Google Scholar] [CrossRef]
  37. Ji, C.; Han, Q.; Zhou, Y.; Wu, J.; Shi, W.; Gao, L.; Leblanc, R.M.; Peng, Z. Phenylenediamine-derived near infrared carbon dots: The kilogram-scale preparation, formation process, photoluminescence tuning mechanism and application as red phosphors. Carbon 2022, 192, 198–208. [Google Scholar] [CrossRef]
  38. Wu, Z.; Chen, R.; Pan, S.; Liu, H.; Hu, X. A ratiometric fluorescence strategy based on dual-signal response of carbon dots and o-phenylenediamine for ATP detection. Microchem. J. 2021, 164, 105976. [Google Scholar] [CrossRef]
  39. Zammataro, A.; Gangemi CM, A.; Pappalardo, A.; Toscano, R.M.; Puglisi, R.; Nicotra, G.; Sfrazzetto, G.T. Covalently functionalized carbon nanoparticles with a chiral Mn-Salen: A new nanocatalyst for enantioselective epoxidation of alkenes. Chem. Commun. 2019, 55, 5255–5258. [Google Scholar] [CrossRef]
  40. Salman, B.I.; Hassan, A.I.; Hassan, Y.F.; Saraya, R.E.; Batakoushy, H.A. Rapid One-Pot Microwave Assisted Green Synthesis Nitrogen Doped Carbon Quantum Dots as Fluorescent Precursor for Estimation of Modafinil as Post-Covid Neurological Drug in Human Plasma with Greenness Assessments. J. Fluoresc. 2022, 1–10. [Google Scholar] [CrossRef]
  41. Abbasi, A.; Abushad, M.; Khan, A.; Bhat, Z.U.H.; Hanif, S.; Shakir, M. Bare undoped nontoxic carbon dots as a visible light photocatalyst for the degradation of methylene blue and congo red. Carbon Trends 2023, 10, 100238. [Google Scholar] [CrossRef]
  42. Esmail, L.A.; Jabbar, H.S. Violuric acid carbon dots as a highly fluorescence probe for ultrasensitive determination of Zn (II) in tomato paste. Food Chem. 2023, 413, 135638. [Google Scholar] [CrossRef]
  43. Carbonaro, C.M.; Corpino, R.; Salis, M.; Mocci, F.; Thakkar, S.V.; Olla, C.; Ricci, P.C. On the Emission Properties of Carbon Dots: Reviewing Data and Discussing Models. C J. Carbon Res. 2019, 5, 60. [Google Scholar] [CrossRef]
  44. Mocci, F.; de Villiers Engelbrecht, L.; Olla, C.; Cappai, A.; Casula, M.F.; Melis, C.; Stagi, L.; Laaksonen, A.; Carbonaro, C.M. Carbon Nanodots from an In Silico Perspective. Chem. Rev. 2022, 122, 13709–13799. [Google Scholar] [CrossRef] [PubMed]
  45. Boukhvalov, D.W.; Osipov, V.Y.; Hogan, B.T.; Baldycheva, A. A Comprehensive Model of Nitrogen-Free Ordered Carbon Quantum Dots. Nanoscale Res. Lett. 2023, 18, 1. [Google Scholar] [CrossRef] [PubMed]
  46. Lu, S.; Cong, R.; Zhu, S.; Zhao, X.; Liu, J.; STse, J.; Yang, B. pH-Dependent Synthesis of Novel Structure-Controllable Polymer-Carbon NanoDots with High Acidophilic Luminescence and Super Carbon Dots Assembly for White Light-Emitting Diodes. ACS Appl. Mater. Interf. 2016, 8, 4062–4068. [Google Scholar] [CrossRef]
  47. Wongso, V.; Sambudi, N.S.; Sufian, S.; Isnaeni; Abdullah, B. The effect of pH in the synthesis of carbon quantum dots from rice husk on their photoluminescence properties. IOP Conf. Ser. Earth Environ. Sci. 2019, 268, 012087. [Google Scholar] [CrossRef]
  48. Soler, J.M.; Artacho, E.; Gale, J.D.; Garsia, A.; Junquera, J.; Orejon, P.; Sanchez-Portal, D. The SIESTA Method for Ab-Initio Order-N Materials Simulation. J. Phys. Condens. Matter. 2002, 14, 2745. [Google Scholar] [CrossRef]
  49. Boukhvalov, D.W.; Dreyer, D.R.; Bielawski, C.W.; Son, Y.W. A Computational Investigation of the Catalytic Properties of Graphene Oxide: Exploring Mechanisms by using DFT Methods. ChemCatChem 2012, 4, 1844–1849. [Google Scholar] [CrossRef]
  50. Perdew, J.P.; Burke, K.; Ernzerhof, M. Generalized Gradient Approximation Made Simple. Phys. Rev. Lett. 1996, 77, 3865. [Google Scholar] [CrossRef]
  51. Dion, M.; Rydberg, H.; Schröder, E.; Langreth, D.C.; Lundqvist, B.I. Van der Waals density functional for general geometries. Phys. Rev. Lett. 2004, 92, 246401. [Google Scholar] [CrossRef] [PubMed]
  52. Troullier, O.N.; Martins, J.L. Efficient Pseudopotentials for Plane-Wave Calculations. Phys. Rev. B 1991, 43, 1993. [Google Scholar] [CrossRef] [PubMed]
  53. Miao, X.; Qu, D.; Yang, D.; Nie, B.; Zhao, Y.; Fan, H.; Sun, Z. Synthesis of carbon dots with multiple color emission by controlled graphitization and surface functionalization. Adv. Mater. 2018, 30, 1704740. [Google Scholar] [CrossRef] [PubMed]
  54. Boukhvalov, D.W.; Feng, X.; Müllen, K. First-principles modeling of the polycyclic aromatic hydrocarbons reduction. J. Phys. Chem. C 2011, 115, 16001–16005. [Google Scholar] [CrossRef]
  55. Zhu, Y.; Wang, J. Helical Synthetic Nanographenes with Atomic Precision. Acc. Chem. Res. 2023, 56, 363–373. [Google Scholar] [CrossRef]
  56. Haynes, W.M. CRC Handbook of Chemistry and Physics; CRC Press: Boca Raton, FL, USA, 2014. [Google Scholar]
  57. Lee, J.-K.; Kim, J.-G.; Hembram, K.P.S.S.; Kim, Y.-I.; Min, B.-K.; Park, Y.; Lee, J.-K.; Moon, D.J.; Lee, W.; Lee, S.-G.; et al. The Nature of Metastable AA’ Graphite: Low Dimensional Nano- and Single-Crystalline Forms. Sci. Rep. 2016, 6, 39624. [Google Scholar] [CrossRef]
Figure 1. Optimized atomic structures of citric acid (a) and four different products of the reactions between two citric acid molecules with corresponding formation energies in kJ/mol (be). The system on panel (e) is shown from different points of view. The carbon atoms are shown in gray, oxygen in red, and hydrogen in cyan. The corresponding 2D schemes of the reactions are shown in Supplementary Information (Figure S1).
Crystals 13 00716 g001
Figure 2. Optimized atomic structures and corresponding enthalpies of formation for assembling graphenic systems via molecule-by-molecule addition of CA (ac,ef) from the most energetically favorable product of the first step of the process shown in Figure 1c. The structure on panel (f) shown from different points of view. On panel (d) shown the product of the reconstruction of the edges described by Equation (2). The corresponding 2D schemes of the reactions are shown in Supplementary Information (Figure S2).
Crystals 13 00716 g002
Figure 3. Optimized atomic structures and corresponding enthalpies of formation for assembling graphenic systems (ag) via molecule-by-molecule addition of CA to one of the most energetically favorable products of the first step of the process shown in Figure 1e (a).
Crystals 13 00716 g003
Figure 4. Optimized atomic structure of OPD (a), 2,3-DAPN (b), and products of the interaction between two OPD molecules with corresponding values of the enthalpies of the formation (ch). The carbon atoms are shown in gray, nitrogen in dark blue, and hydrogen in cyan.
Crystals 13 00716 g004
Figure 5. Optimized atomic structure of the most energetically favorable compounds obtained at first (a,e) and following steps of graphitization (bd) and (f,g) by molecule-by-molecule attachment of OPD.
Crystals 13 00716 g005
Figure 6. Optimized atomic structures and enthalpies of formation of intermediate and final products for step-by-step water decomposition on the most energetically favorable OPD-based structures (a,b). The oxygen molecules are shown in red color.
Crystals 13 00716 g006
Figure 7. Optimized atomic structures of OPD-based systems before and after the formation of non-covalent bonds between neighboring aromatic layers (a,d), formation of covalent interlayer bonds (b,c,e), and corresponding enthalpies of the processes. Panels (b,c,e) show side and top views of the simulated atomic structures.
Crystals 13 00716 g007
Table 1. Summary of the data obtained in the characterization of CNDs synthesized from OPD. The abbreviation for various nitrogen sites detected by N1s XPS is G—graphitic, P—pyrollic (pyrazine and pyridine), and A—amino.
NumberReferenceCo-PrecursorApproximate Ratio of XPS Peak Intensities for
O1s and N1s Signals
FTIR,
Registered Vibrations from Surface Functional Groups
HRTEM,
Period of Lattice Fringes (nm)
O1s
C=O/C–O
N1s
G:P:A
1[30]water1:4
1:3
1:4:0
1:3:0
–OH, CN, –NH2,
–CH
0.21
2[31]ethanol6:41:2:7–OH0.21
3[32]catecholonly C=O3:1:6–OH, NH, C=N
(C=O), CN, CO, CH
0.24
4[33]acidsfrom 4:1
to 1:1
from 9:0:1
to 4:0:6
8:0:1 to 4:0:6
–OH, C-N=, C=O,
–NH, C–O,
0.206–0.208
5[34]benzoic acid, ureanone1:2:1–OH, –NH2,
C–N, C–H, C=C, imidazole and protonated amines, C=O/N–C
---
6[35]ethanol,
potassium bisulfate
nonenone–OH, N–H, C–H,
C=O, N–H, C–NH–C, aromatic –CH, C–C, C=C
0.19
7[36]water1:55:1:0------
8[37]acids3:2
2:3
1: 2:0–OH, C=C,
C–N=C, C2–N–H
---
9[38]acids------–OH, C–H, O–H,
N–H, C=O,
C–N, C–O
---
Disclaimer/Publisher’s Note: The statements, opinions and data contained in all publications are solely those of the individual author(s) and contributor(s) and not of MDPI and/or the editor(s). MDPI and/or the editor(s) disclaim responsibility for any injury to people or property resulting from any ideas, methods, instructions or products referred to in the content.

