Article

Crystal Structure, Ionic Conductivity, Dielectric Properties and Electrical Conduction Mechanism of the Wyllieites Na1.5Mn3.5(AsO4)3 and Na1.5Mn3Fe0.5(AsO4)3

1
Laboratory of Materials, Crystallochemistry and Applied Thermodynamics, Faculty of Sciences of Tunis, University of Tunis El Manar, Tunis 1068, Tunisia
2
i3N & Department of Physics, University of Aveiro, 3810-193 Aveiro, Portugal
*
Author to whom correspondence should be addressed.
Crystals 2023, 13(8), 1251; https://doi.org/10.3390/cryst13081251
Submission received: 30 June 2023 / Revised: 4 August 2023 / Accepted: 11 August 2023 / Published: 14 August 2023
(This article belongs to the Special Issue Advances in Composite Electrodes Materials)

Abstract

:
Na1.5MnII3MnIII0.5(AsO4)3 and Na1.5MnII3FeIII0.5(AsO4)3 compounds were synthesized via a high-temperature solid-state combustion reaction. The obtained samples were submitted to structural, morphological, and electrical characterizations. X-ray diffraction measurements revealed that both compounds crystallize in the monoclinic system with the space group P21/c. The lattice parameters were determined to be a = 6.78344 Å, b = 12.93830 Å, c = 11.22825 Å, and β = 98.5374° for Na1.5MnII3MnIII0.5(AsO4)3, and a = 6.76723 Å, b = 12.9864 Å, c = 11.256 Å, and β = 98.8636° for Na1.5Mn2+3Fe3+0.5(AsO4)3. The structures consist of octahedral MnII and MnIII or FeIII ions connected by sharing edges, forming infinite chains. These chains are further connected by AsO4 tetrahedra, resulting in a three-dimensional anionic framework with tunnels parallel to the a-direction and cavities according to the c-direction. The structural models were validated using bond valence and charge distribution analyses. In addition to the structural characterization, the electric results depended on the crystal structures, indicating the potential of the studied materials for being used in several applications.

1. Introduction

During the last years, thorough research was performed on phosphate and arsenate metal alkaline materials because of their different properties, such as catalytic and optical characteristics [1,2]. Transition metals, especially iron, played an important role in achieving remarkable magnetic features [3]. Monovalent alkaline ions were responsible for ionic conductivity in open framework structures [4,5,6].
Historically, the mineral wyllieite with the ideal formula Na2FeII2Al(PO4)3 was the first phase described in pegmatites [7]. Later, this type of wyllieite was given the name ferrowyllieiteand. True wyllieite occurs as a MnII variety, namely, Na2MnII FeIIAl(PO4)3 [8]. Its crystal structure has been interpreted as very close to that of Na2MnII (FeII FeIII) [PO4]3 [9].
Several minerals of the wyllieite family have been discovered in the last decades. Among them, only three arsenates, Ag1.09Mn3.46(AsO4)3 [10], Na0.5K0.65Mn3.43(AsO4)3 [11], and Na1.25Co2.187Al1.125(AsO4)3, were synthesized. The conduction pathway study of Na+ in Na1.25Co2.187Al1.125(AsO4)3 showed that a 1D migration of Na+ is possible, suggesting a poor ionic conductivity [12]. However, wyllieites may become a valuable source of alkaline conductive materials due to their crystalline structure, which has been interpreted as very close to allaudites [9].
In this context, wyllieite materials were investigated by synthesizing crystallized powders of new Na1.5MnII3MnIII0.5(AsO4)3 and Na1.5MnII3FeIII0.5(AsO4)3 compounds. Initially, Na+ migration pathways were analyzed using the bond valence sum energy (BVSE) model. The dielectric properties were then examined by complex impedance spectroscopy.

2. Materials and Methods

The crystalline powders of Na1.5MnII3MnIII0.5(AsO4)3 (I), and Na1.5MnII3FeIII0.5 (AsO4)3 (II) were obtained by a high-temperature solid-state combustion reaction. First, mixtures of NaNO3, NH4H2AsO4, MnCO3, and MnC6H9O6.2H2O for (I) and Fe(NO3)3·9H2O for (II) were taken in 1.5:3:3:0.5 stoichiometry. NH4H2AsO4, the precursor reagent for As(V), was synthesized by heating As2O3 in concentrated nitric acid (HNO3) under reflux conditions for three days, following a procedure described in previous work [13]. The resulting solution was then taken to further heating at 100 °C until the evaporation of most of the water and excess HNO3. The resulting H5As3O10 was calcinated at 300 °C for 12 h to yield As2O5. Subsequently, this compound was dissolved in hot water (70 °C) and mixed with an aqueous NH3 solution to adjust its pH to 4.2. The solid NH4H2AsO4 was isolated and confirmed to be phase pure through X-ray diffraction (XRD) analysis using the JCPDS-775 database [14]. The precursors were supplied by Fisher Scientific with a purity percentage of 99%. An amount of 2 g each of the solid mixtures of (I) and (II) were dissolved in 40 mL of water, 10 mL of nitric acid, and 2 g of citric acid. The solutions were placed on a hot plate (maintained at 120 °C), with constant magnetic stirring, to remove excess water. After complete drying, the solid residues were ground manually using an agate vessel and mortar and brought in alumina crucibles at a temperature of 400 °C to promote combustion and remove volatile components. The obtained mixtures of (I) and (II) were then ground for 2 h and brought to 770 °C and 850 °C, respectively, for 24 h.
The data collection of the two materials, Na1.5MnII3MnIII0.5(AsO4)3 and Na1.5MnII3FeIII0.5(AsO4)3, was carried out by a diffractometer of the Bruker D8 Advance type. The powdered samples were evenly distributed on a sample holder and rotated during the measurement, applying a 2θ step = 0.017° for material (I) and a 2θ step = 0.015° for material (II). The indexing of all peaks of the materials was carried out by the TREOR program included in X’Pert HighScore software.
The FTIR spectra of pellets composed of KBr mixed with the powder of each sample, in a weight ratio of 200:1 mg, were registered in transmission mode, between 400 and 4000 cm−1, on a Nicolet Avatar 360 spectrometer. Micro-Raman spectroscopy, using a Jobi Yvon spectrometer, was performed at room temperature in backscattering geometry, with the microscope objective (50×) focusing the exciting light (λ = 532 nm) onto the sample (spot diameter < 0.8 µm). Plasma lines were removed by a filter.
The bond valence site energy (BVSE) calculations were performed by the SoftBV program using Na+ as test ions and 0.1 Å resolution grids [15]. The BVSE isosurfaces were visualized using the VESTA 3 program [16].
To investigate the range of thermal stability of the samples, measurement of thermal gravimetry (TG) and differential thermal analysis (DTA) were performed simultaneously using a Hitachi STA 7300. The measurements were then carried out under a 200 mL/min Nitrogen N50 (99.999%) atmosphere, and the heating rate was set to 10 °C/min [17].
The morphology of the powder grains was observed by scanning electron microscopy (SEM), conducted in a Vega 3 TESCAN SEM microscope. The observed surface of the pellets was previously sputtered with carbon. In order to validate the purity of the two synthesized compounds, the elementary qualitative analysis used an energy dispersion X-ray spectroscopy EDX, using a Bruker system.
In the electrical measurements, the bulk samples had a thickness of 1 mm and a disk shape with a diameter of about 10 mm, prepared by using a steel mold and a uniaxial pressure system applying a pressure of 10 tons for 10 min. The measurements were performed as a function of temperature, in the range of 283 K up to 470 K for the sample Na1.5MnII3MnIII0.5(AsO4)3 and 296 K up to 393 K for the sample Na1.5MnII3FeIII0.5(AsO4)3 and frequency (100 Hz up to 1 MHz) using Agilent 4294A impedance analyzer. The measurements were made in a bath cryostat system, and during the measurements, the samples were in a helium atmosphere [18,19,20].

3. Results and Discussion

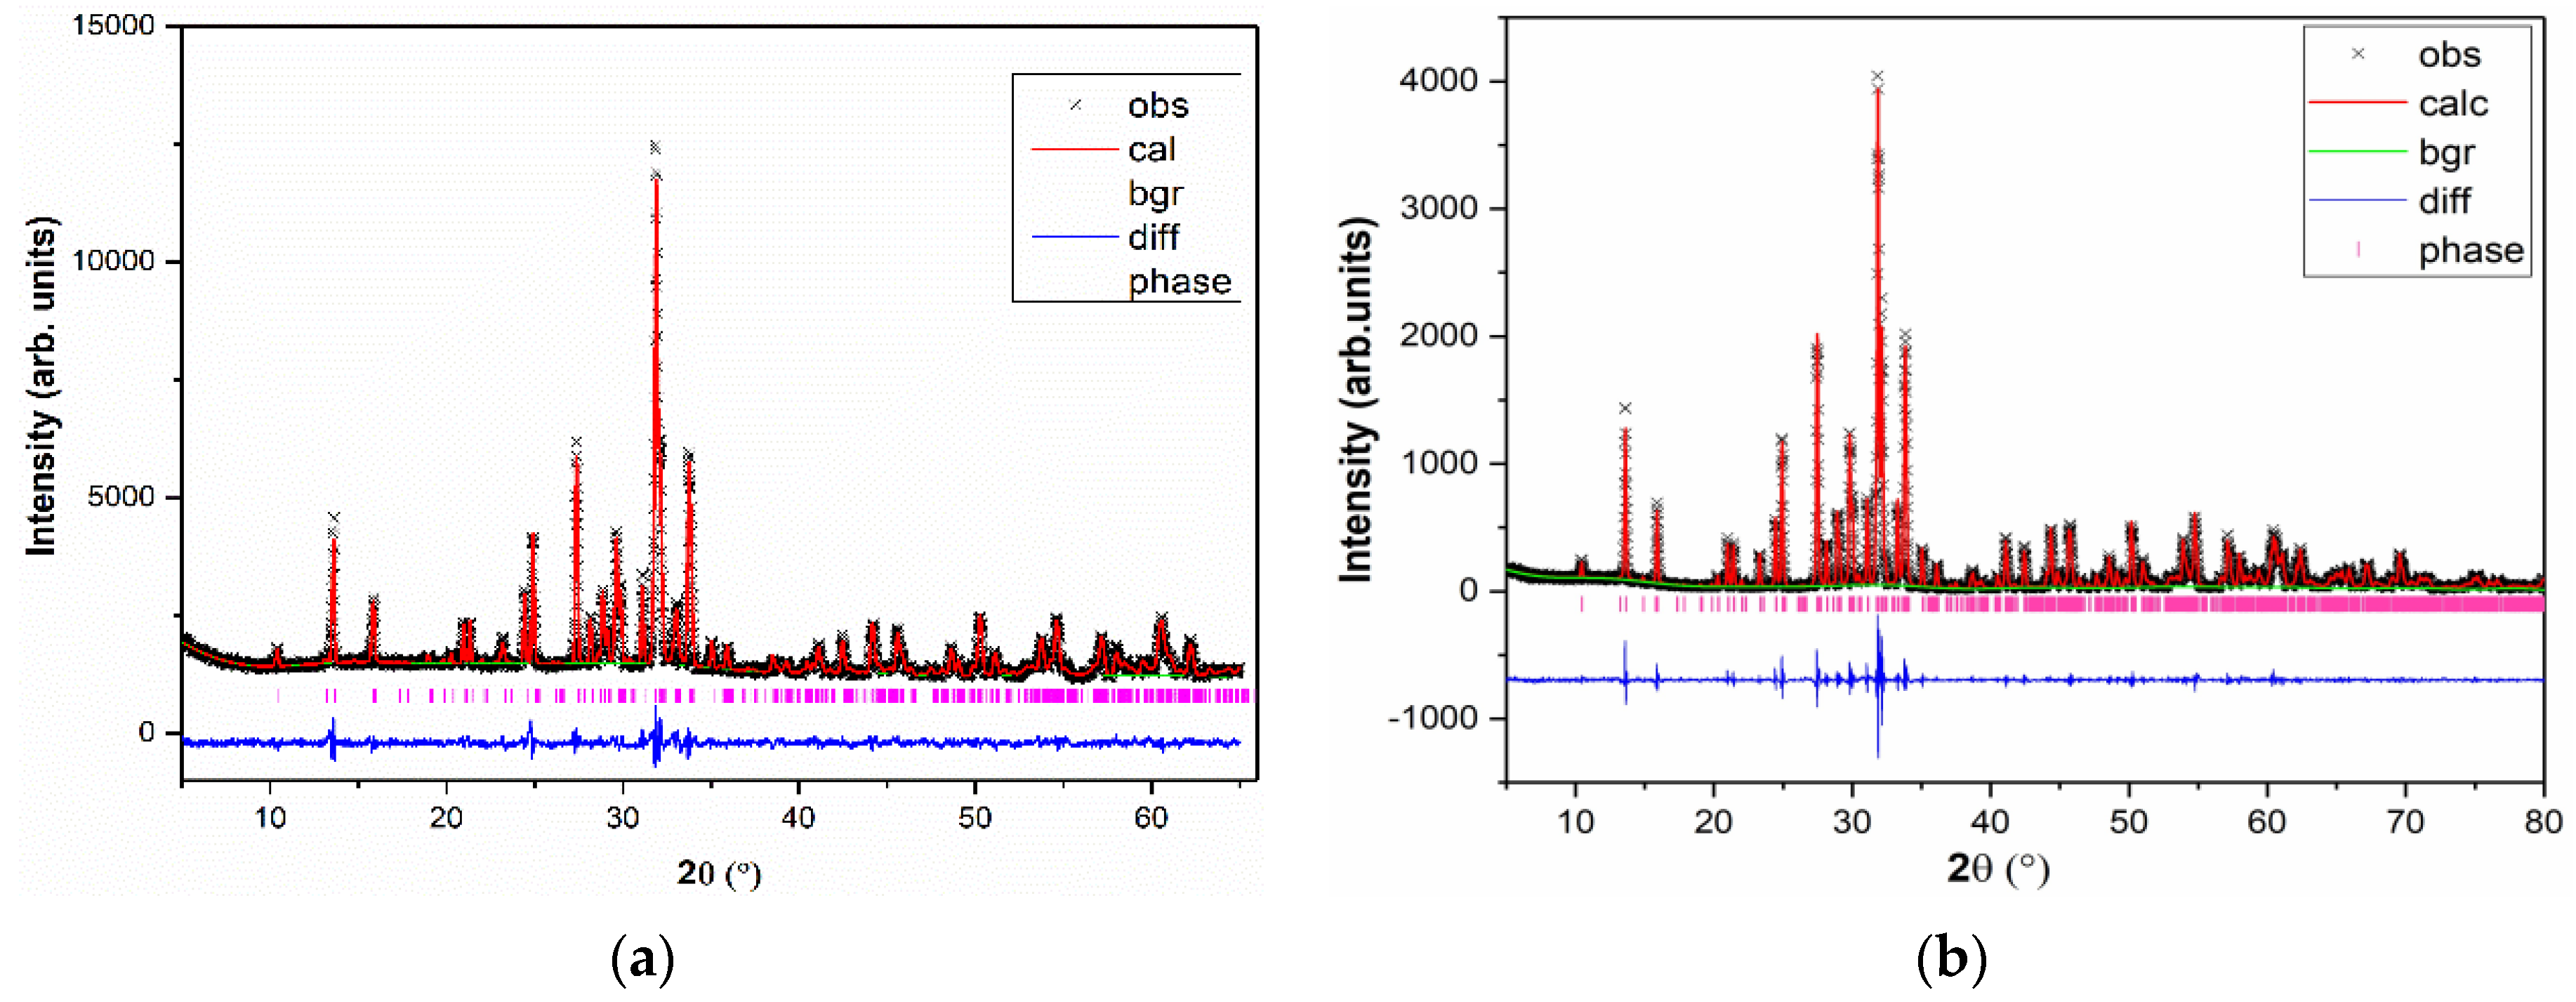
3.1. Resolution and Structure Refinement

Using X’Pert HighScore, it is possible to see that the new phase obtained crystallizes in the monoclinic system P21/c isotype to Ag1.09Mn3.46(AsO4)3 [11]. This structure is then used as a starting model to refine the structure of Na1.5Mn2IIIMnIII0.5 (AsO4)3, by substituting Mn for Fe and fixing the occupations to 1. Structure determination was performed using the GSAS program [21]. When refining the structure, the background noise was treated as a polynomial equation and the line profile as a pseudo-Voigt equation. In the end, the goodness of the refinement, χ 2 = R w p R e x p 2 = 1.464 , is higher and close to 1, revealing that the refinement quality is good [22]. All atomic positions and thermal site factors were refined. All parameters were refined: R p (or R-factor) = 0.022, which is a measure of the difference between the observed diffraction pattern and the pattern calculated from the refined crystal structure, R w p (or weighted R-factor) = 0.029, which is similar to R p but takes into account the weighting of the data points based on their measurement uncertainty, and R e x p (or expected R-factor) = 0.025, which measures the agreement between the observed and calculated diffraction patterns, normalized by the number of independent data points and R(F2)= 0.044, which is a measure of the agreement between the observed and calculated structure factors, which are derived from the diffraction pattern. A good superposition between the experimental diffractogram and the refined one was obtained while respecting the chemical reality of the structural model (Figure 1).
Since the goal was to synthesize the isotype phase of Na1.5MnII3MnIII0.5 (AsO4)3 by substituting MnIII with FeIII, this structure was used as a starting model to determine and refine the structure Na1.5MnII3FeIII0.5 (AsO4)3. Data collection and profile matching were carried out under the same conditions as those for Na1.5MnII3MnIII0.5(AsO4)3. The final results of refinement were χ 2 = 1.440, R p = 0.083, R w p = 0.105, R e x p = 0.088, R(F2) = 0.05682 (Figure 2, Table 1).

3.2. Structures Validation by CHARDI and BVS Analyzes

The two structural models were validated by both analyses: the bond valence (BVS) calculation [23] and the charge distribution method CHARDI [24].
The CHARDI validation model confirms the two structural models obtained. The charge distribution (MnIII/MnII) of the Mn cation in material (I) is featured by the dispersion factor on the cationic charges σcat = 0.079 (Table 2). For material (II), the dispersion factor on the cationic charges is equal to σcat = 0.045 (Table 3). The values of the CHARDI and BVS calculations (Table 4 and Table 5) are in agreement with those observed in the bibliography, presented by the wyllieite Na1.265MnII2.690MnIII0.785(PO4)3 [25].
The effective oxidation numbers of Mn(1) (MnII) and Mn(3) (MnIII) in (I) are 1.87 and 2.74, respectively (Table 2). These values have also been observed in the alliaudyte Na1.72Mn3.28(AsO4)3, where the effective oxidation numbers of MnII and MnIII are equal to 1.80 and 2.69, respectively [26]. Indeed, the deviation of the charges on the cations (MnIII, MnII) in (I) suggests a mixed valence of the trivalent cations MnIII from where the electrons are delocalized in all the three-dimensional networks. However, material (II) did not show any remarkable charge deviations (Table 3).

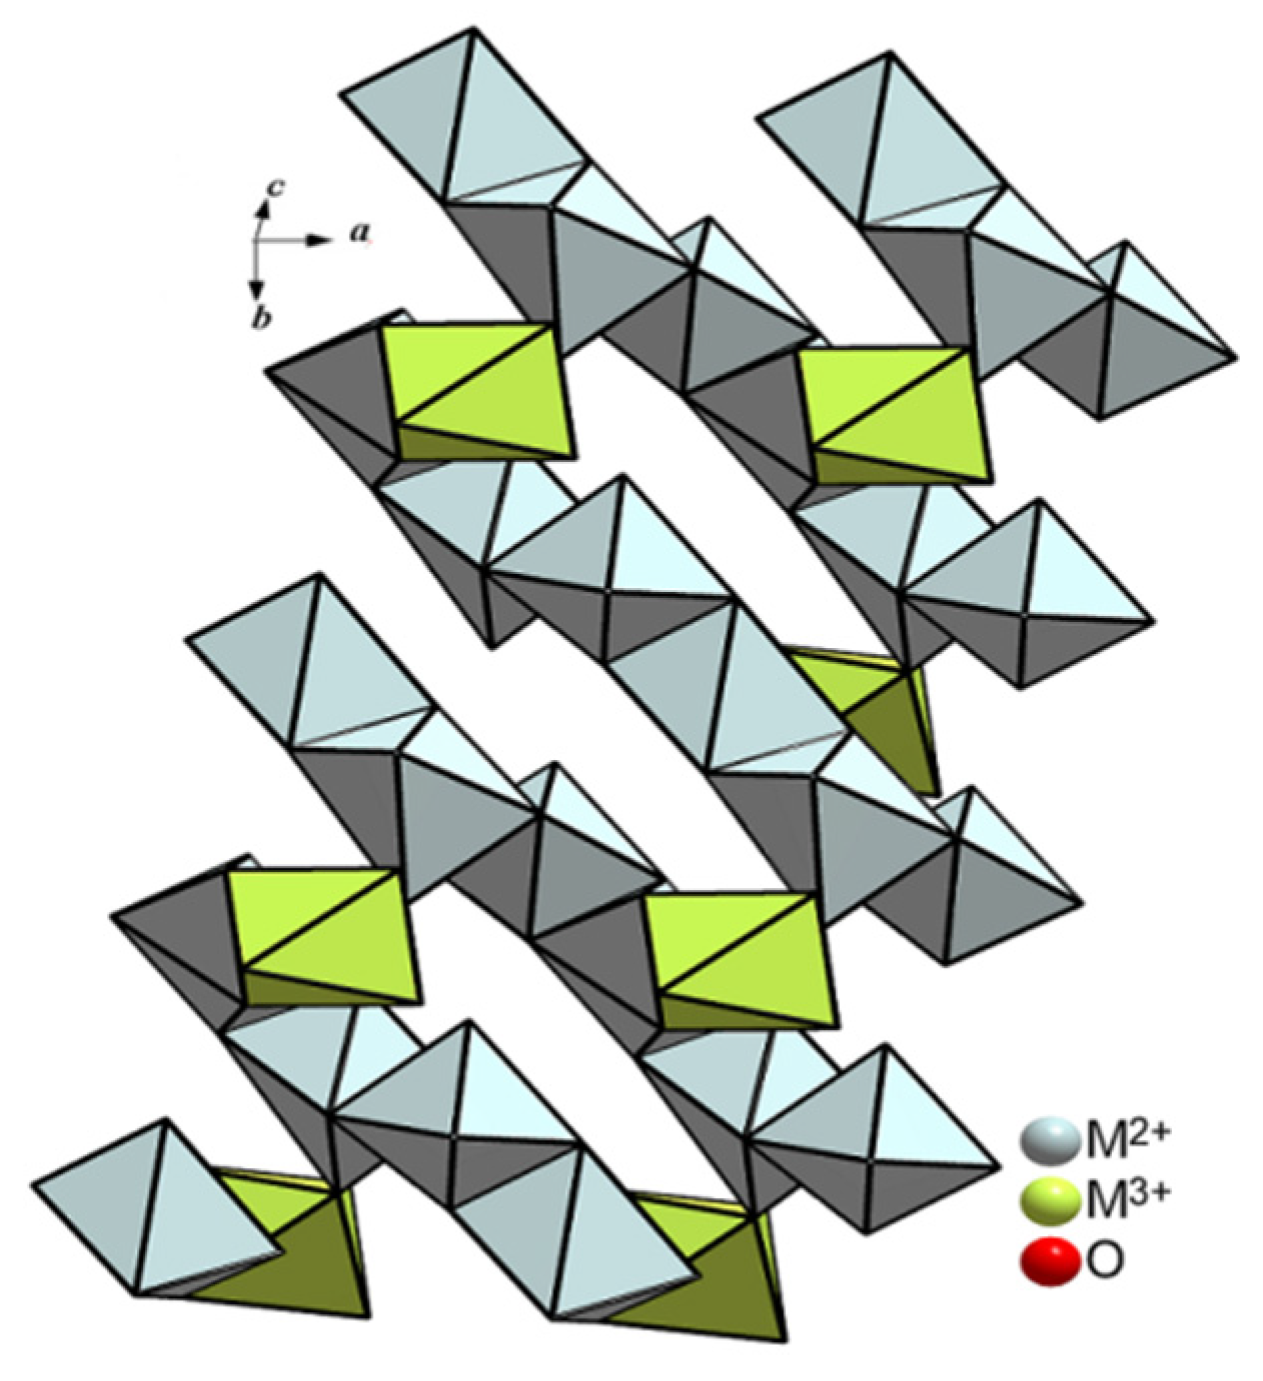
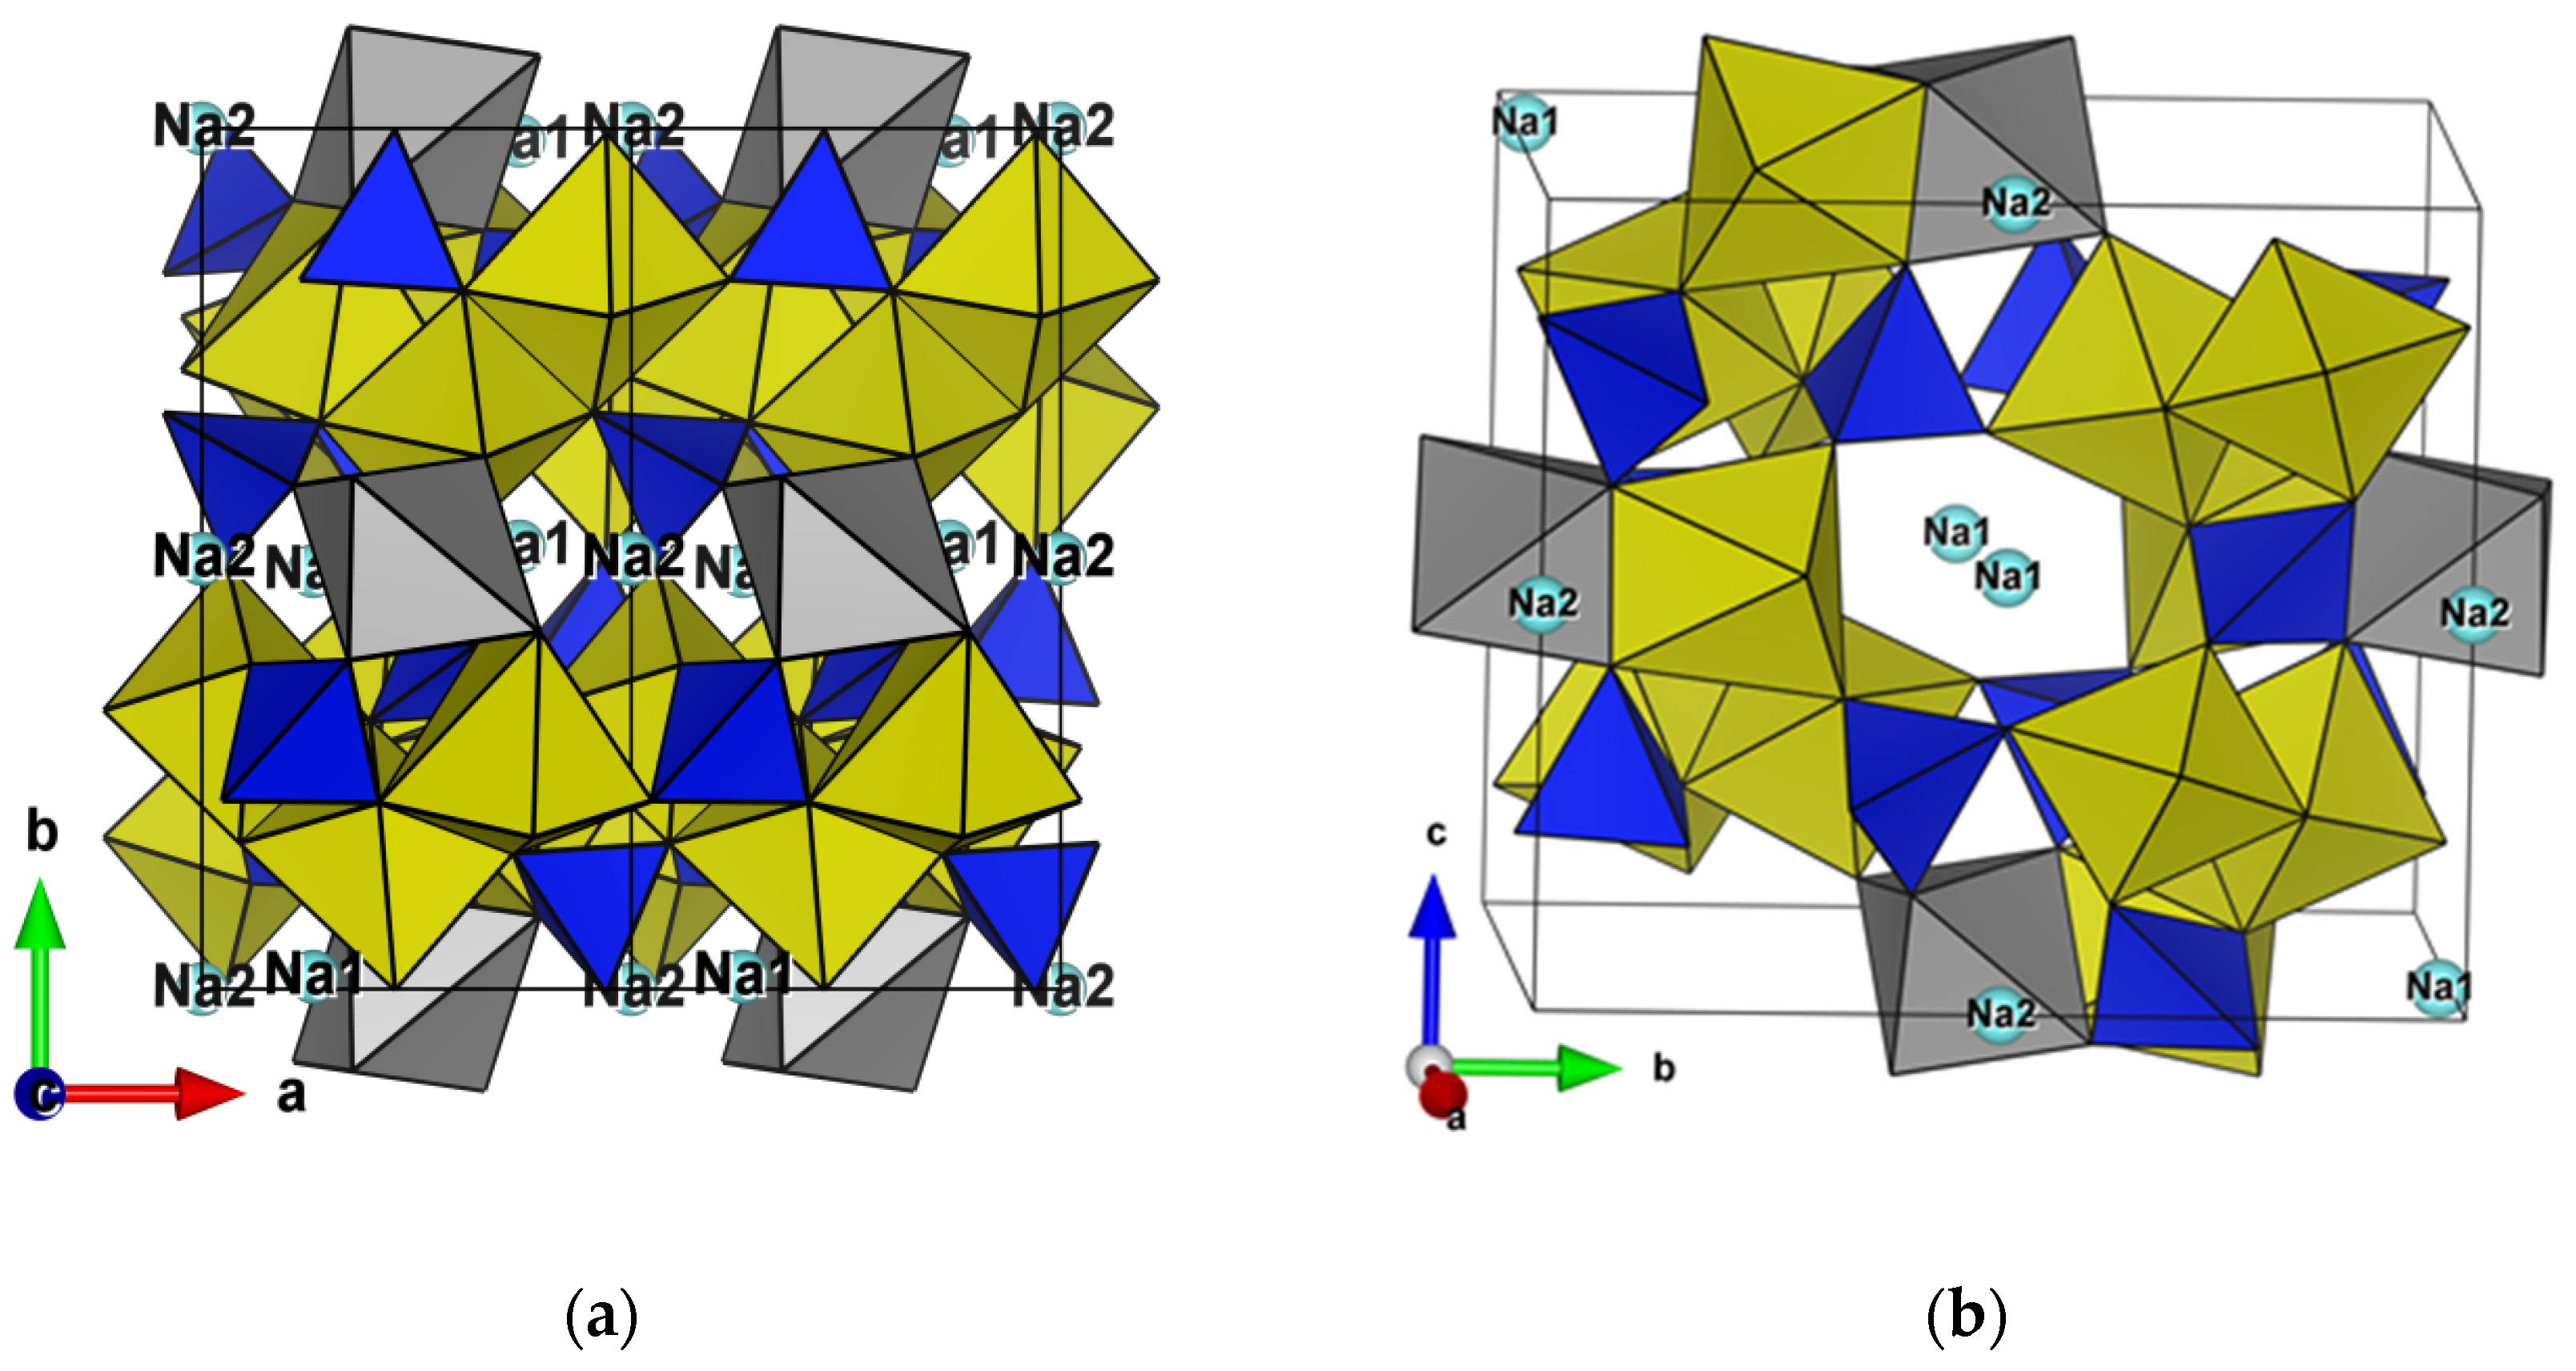
3.3. Structures Description and Discussion

The asymmetric unit of each compound contains three octahedra of the divalent cation MnII, one octahedron of the trivalent cation MIIIO6 (M = Mn or Fe), three tetrahedra AsO4, and two atoms of Na. The entire group is coordinated by twelve crystallographic independent oxygen atoms.
The three MIIO6 octahedra are sharing edges to form the M3O14 group (Figure 2). These groups are connected by sharing edges to form infinite chains in the direction [5,10]. These infinite chains are linked by the tops of the AsO4 tetrahedra and the edges of the MIIO6 octahedra. This arrangement forms a three-dimensional anionic framework containing tunnels parallel to the a-axis and cavities according to the c-direction, where sodium cations are located (Figure 3).
As shown in Table 6, for Mn (1), Mn (2), and Mn (4) in material (I) and Mn (1), Mn (2), and Mn (3) in (II), the MO6 takes typical M-O distances from those observed in the bibliography. For material (I), MnII-O distances range from 1.9270 (1) Å to 2.334(2) Å compared with 2.19 Å, which is the sum of the Shannon crystal for MnII six coordinates (0.97 Å) and O2- three coordinates (1.22 Å), meaning these distances show slight deviations from MnII-O distances, which range from 1.959 (5) Å to 2.256 (6) Å. This distance variation also shows deviations compared with the sum of the Shannon crystal distances (2.08 Å) [27]. These deviations are observed in most wyllieites, especially Na1.265MnII2.690MnIII0.785(PO4)3 [25].
MnIIIO6 octahedra in the two studied materials adopt distortions observed previously in Na1.265MnII2.690MnIII0.785(PO4)3. The MnIII-O distances in (I) range from 2.193 (2) to 2.4489 (19), while the sum of the Shannon crystalline rays for the MnIII six coordinated ions (0.78 Å) and O2- three coordinated ions (1.22 Å) equals 2.00 Å [27]. The Fe3+-O distances in (II) vary from 1.973(2) Å to 2.040(3) Å, while the Shannon Fe3+-O distance is equal to 2.012 Å [27]. The distortion of the MnIII ion is typical of the distortion phenomenon Jahn–Teller observed in the weillyte Na1.265MnII2.690MnIII0.785(PO4)3 [25] and the allyaudite Na1.72Mn3.28(AsO4)3 [28]. The octahedral MIIIO6 has four short and two longer MIIIO distances. The distortion of the MIIO6 octahedra and the Jahn–Teller effect of the trivalent cations are consistent with the BVS calculations. This compromise reinforces the mixed valence of MnII/MnIII.

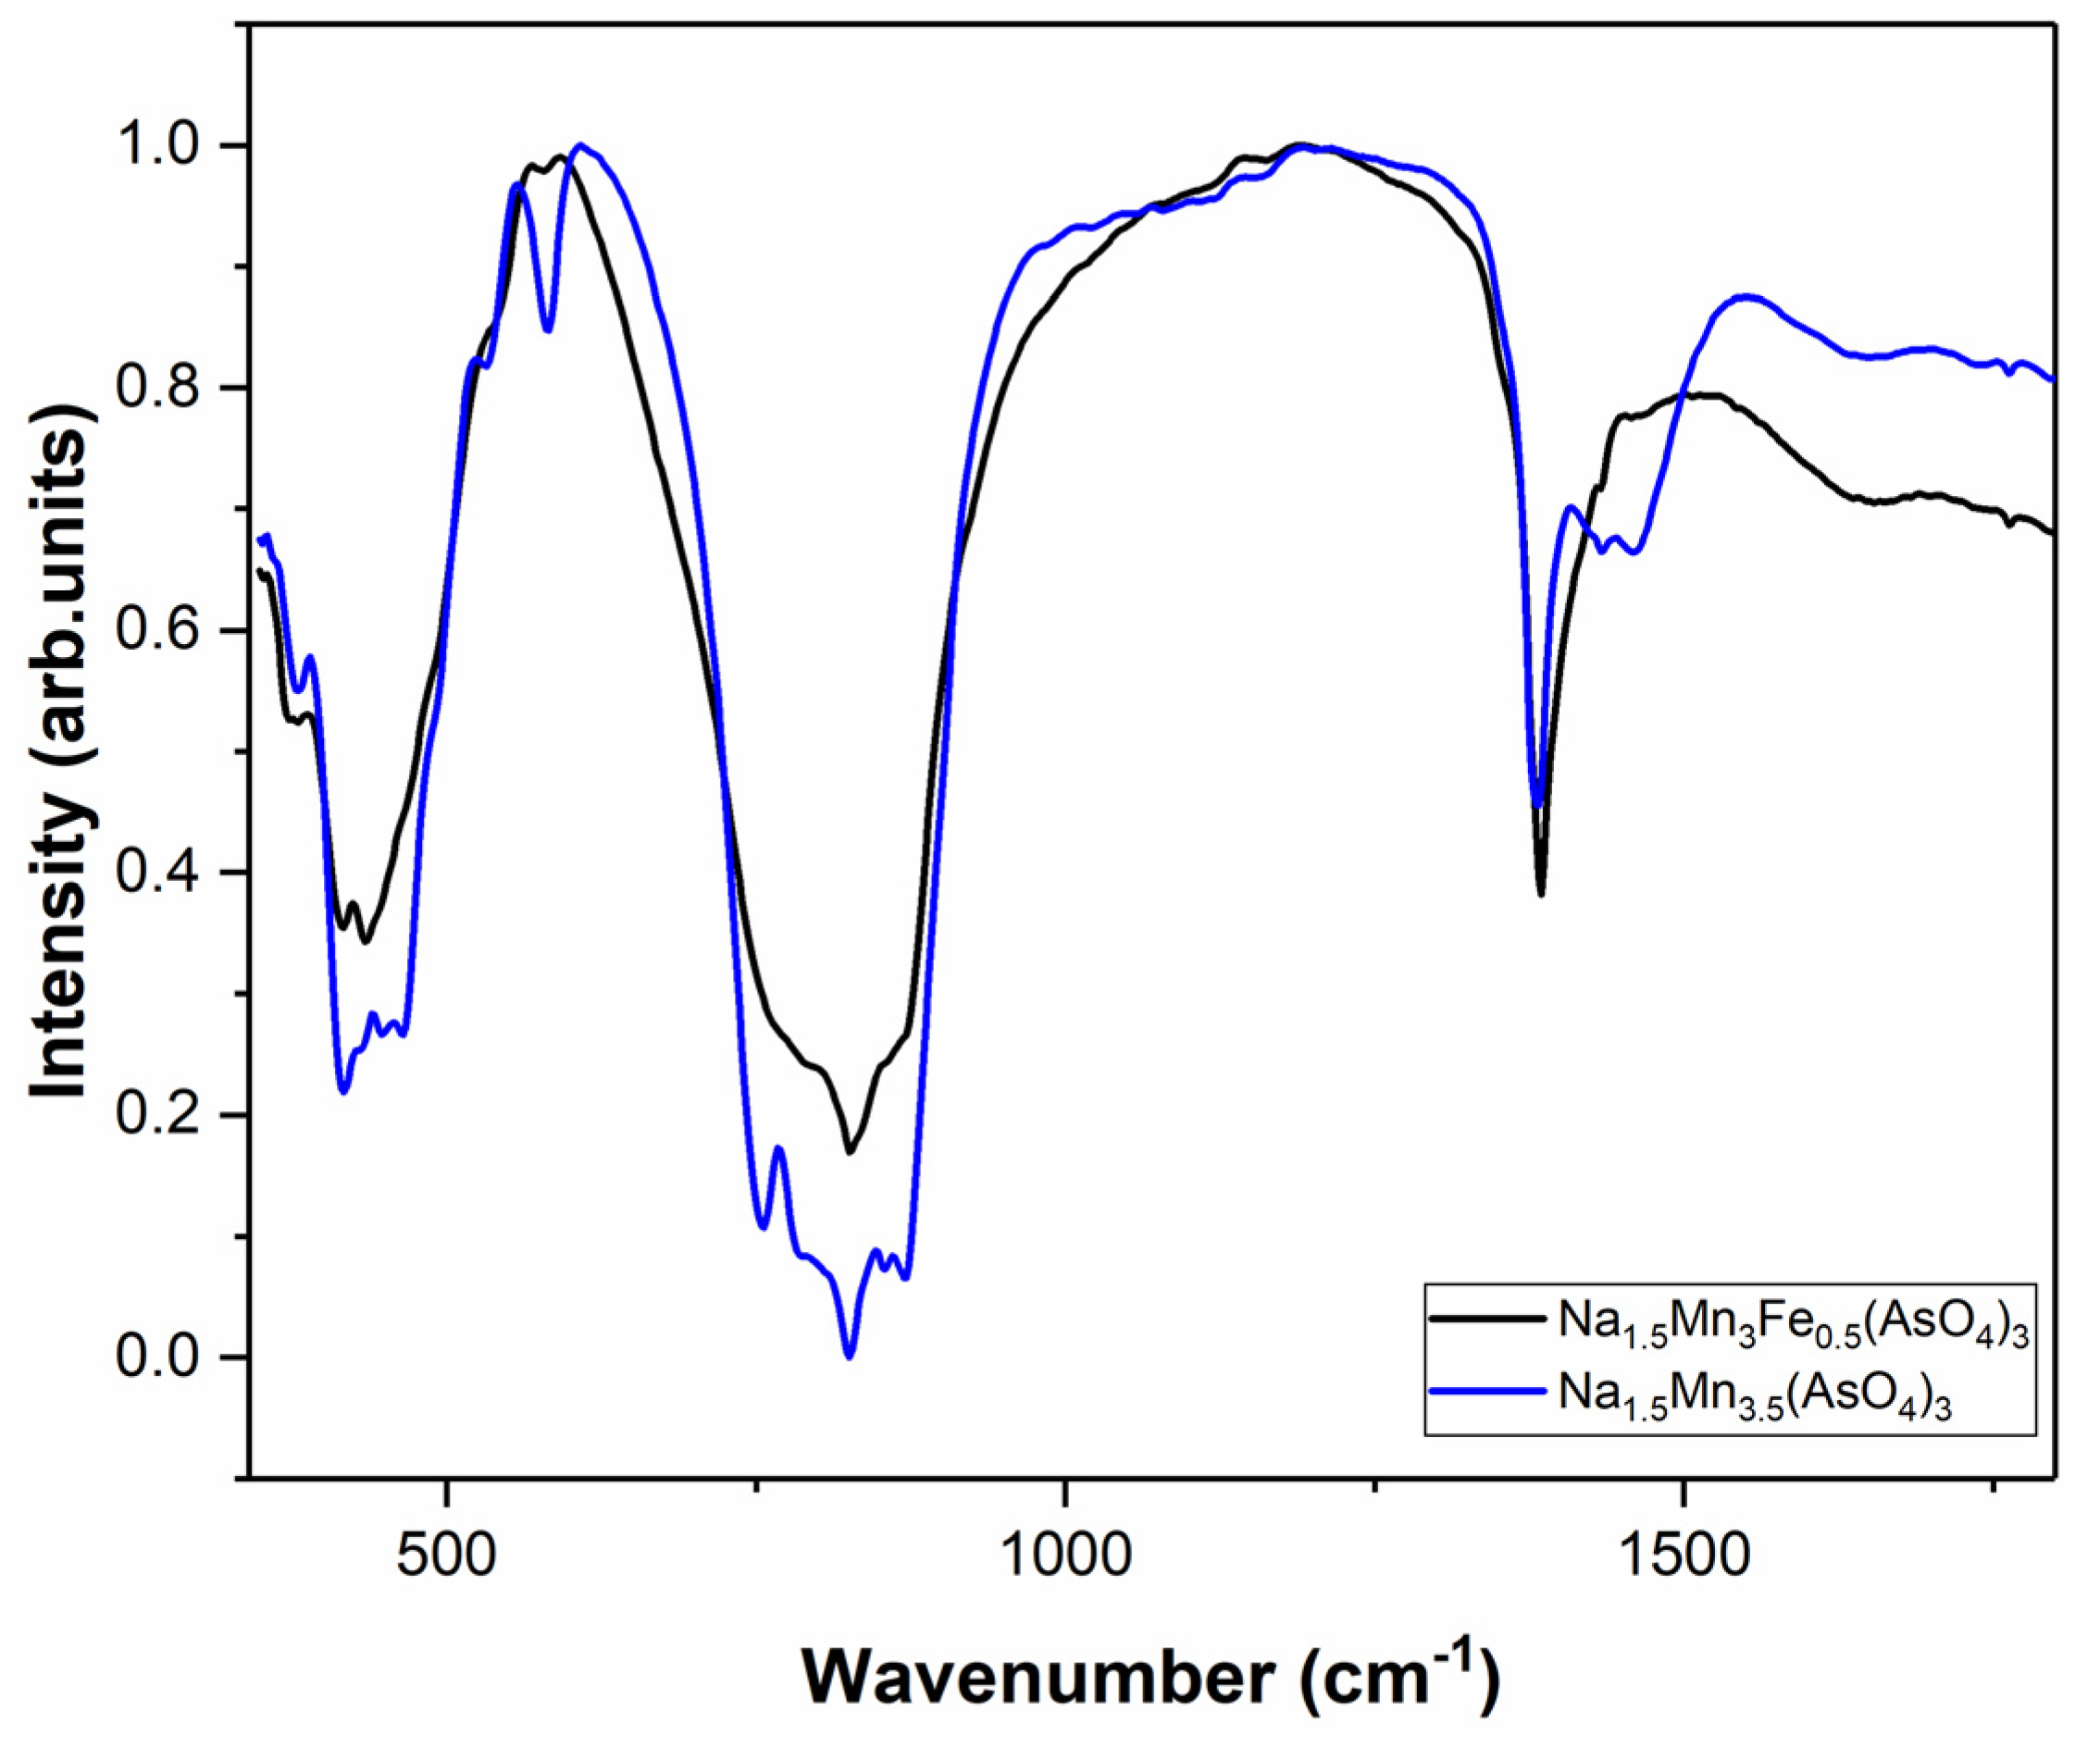
3.4. Infrared Spectroscopy Study

Based on their high intensities and frequencies (Figure 4), the bands around 861 cm−1 and 866 cm−1 can be attributed to the AsO4 group asymmetric valence vibrations ν3 in materials (I) and (II), respectively. Symmetrical valence vibrations ν3 are observed around 820–750 cm−1 for (I) and around 825–889 cm−1 for (II). The asymmetrical deformation vibrations ν4 of the AsO4 group were observed at the lowest wavelengths. These bands are translated into a wide band divided around 436–371 for material (II) and a band that divides in two around 456–426 cm−1 for material (I). The divisions observed in ν1 and ν4 show that the AsO4 tetrahedrons are minimally deformed in the monoclinic network. The Mn-O vibrations are observed around 538–581 cm−1 for (I) and around 583 cm−1 for (II). It is also likely that some MII-O strain vibration bands are coupled to the ν4 vibration modes (Table 7).

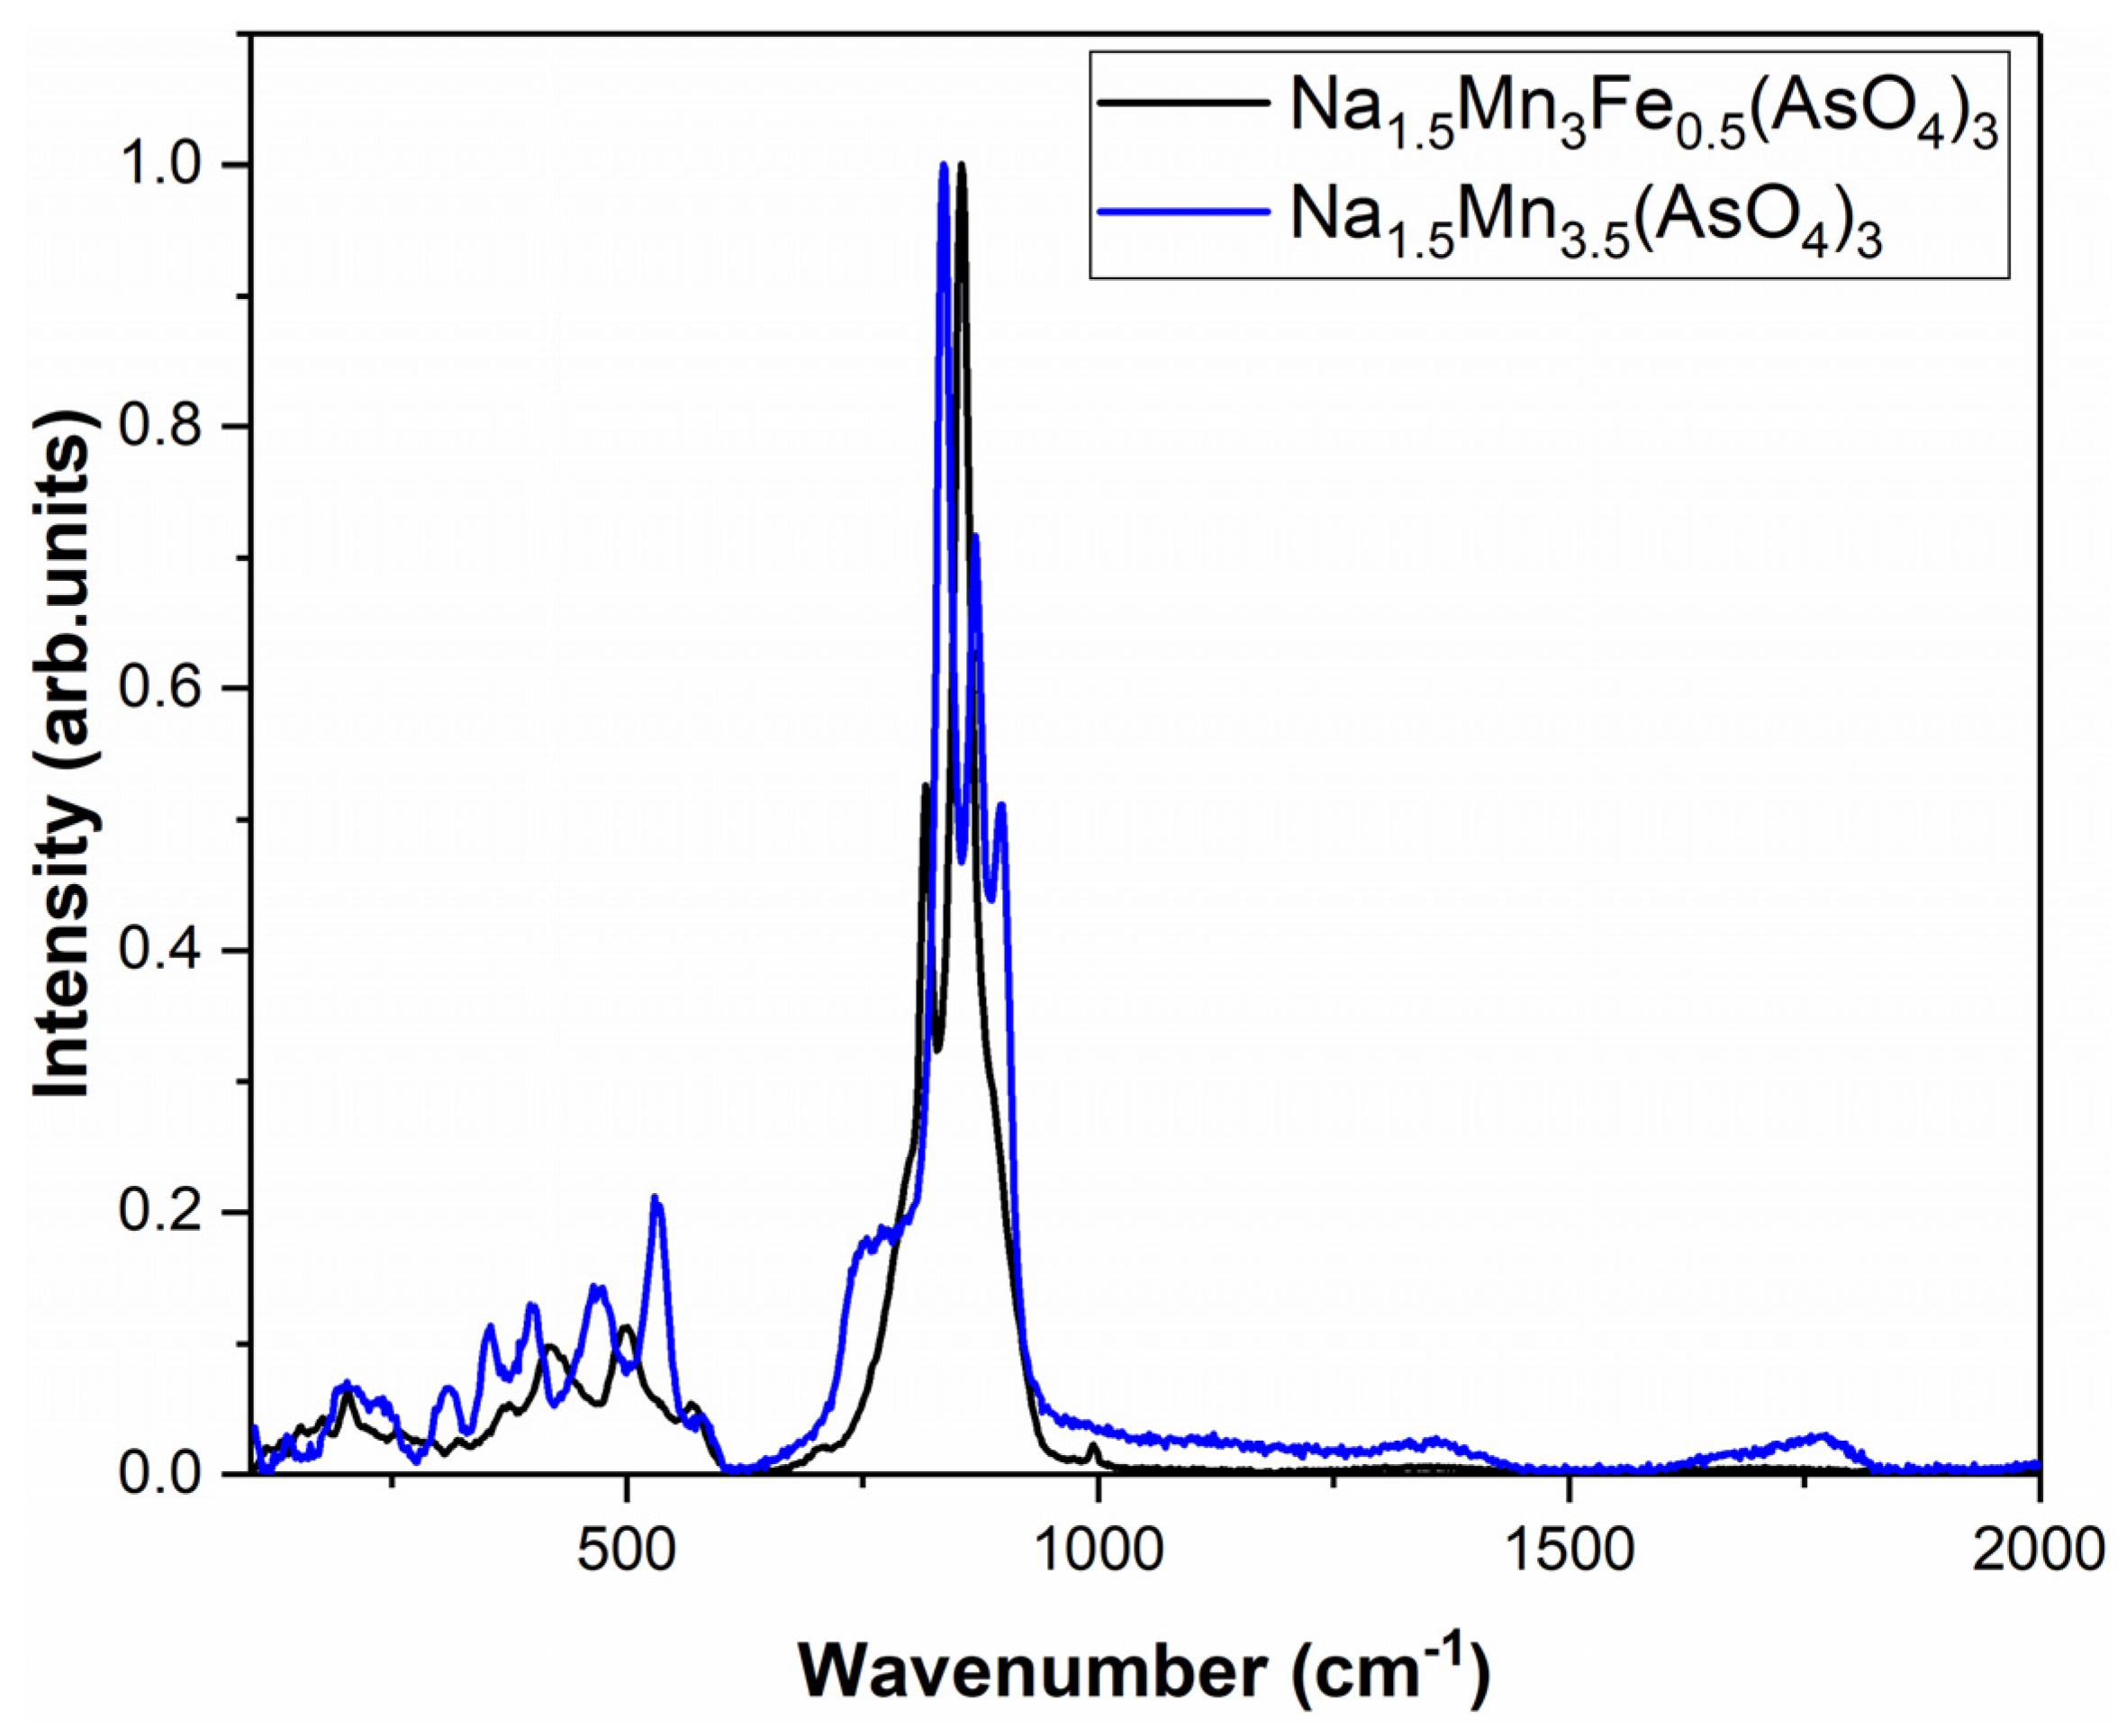
3.5. Raman Spectroscopy Study

The Raman spectra of the two compounds (I) and (II) in the range 100–1400 cm−1 are shown in Figure 5. The Raman spectrum can be understood not only by the determination of the internal vibrations of the AsO4−3 units but also by the determination of the vibrations of the crystalline network. In fact, according to the theory of group factors, a material of space group P21/c shows 30 bands: 14 corresponding to the symmetry Ag and 16 corresponding to the symmetry Bg. On the other hand, the detection of all bands is difficult because these bands can overlap or have lower intensities than those of background noise [34].
Each spectrum is dominated by a very clear intense band at 838 and 854 cm−1 for compounds (I) and (II) respectively. This band corresponds to the symmetrical vibration assignment of the A s O 4 3 group (Table 8). The bands observed at 899 and 1000 cm−1 correspond to the asymmetric vibration of the AsO4−3 group (Table 8). For material (I), five bands of Mn trivalent are observed around 313–358 cm−1 and those of divalent are observed around 230–192 cm−1. For material (II), the bands of Fe and Mn are observed around 374 and 256–206 cm−1 (Table 8). The superposition of the two Raman spectra showed the same number of bands in the region ranging from 100 to 1250 cm−1. Toward the highest frequencies, it is noticed the appearance of the two broadbands, around 1360 and 1770 cm−1, on the Raman spectrum of (I). These two bands can be attributed to both the D and G vibrations of carbon. Citric acid used for combustion synthesis is the only source of carbon traces. This phenomenon was observed in the Na2FePO4F Raman spectrum, which was prepared by the same synthesis method [34].

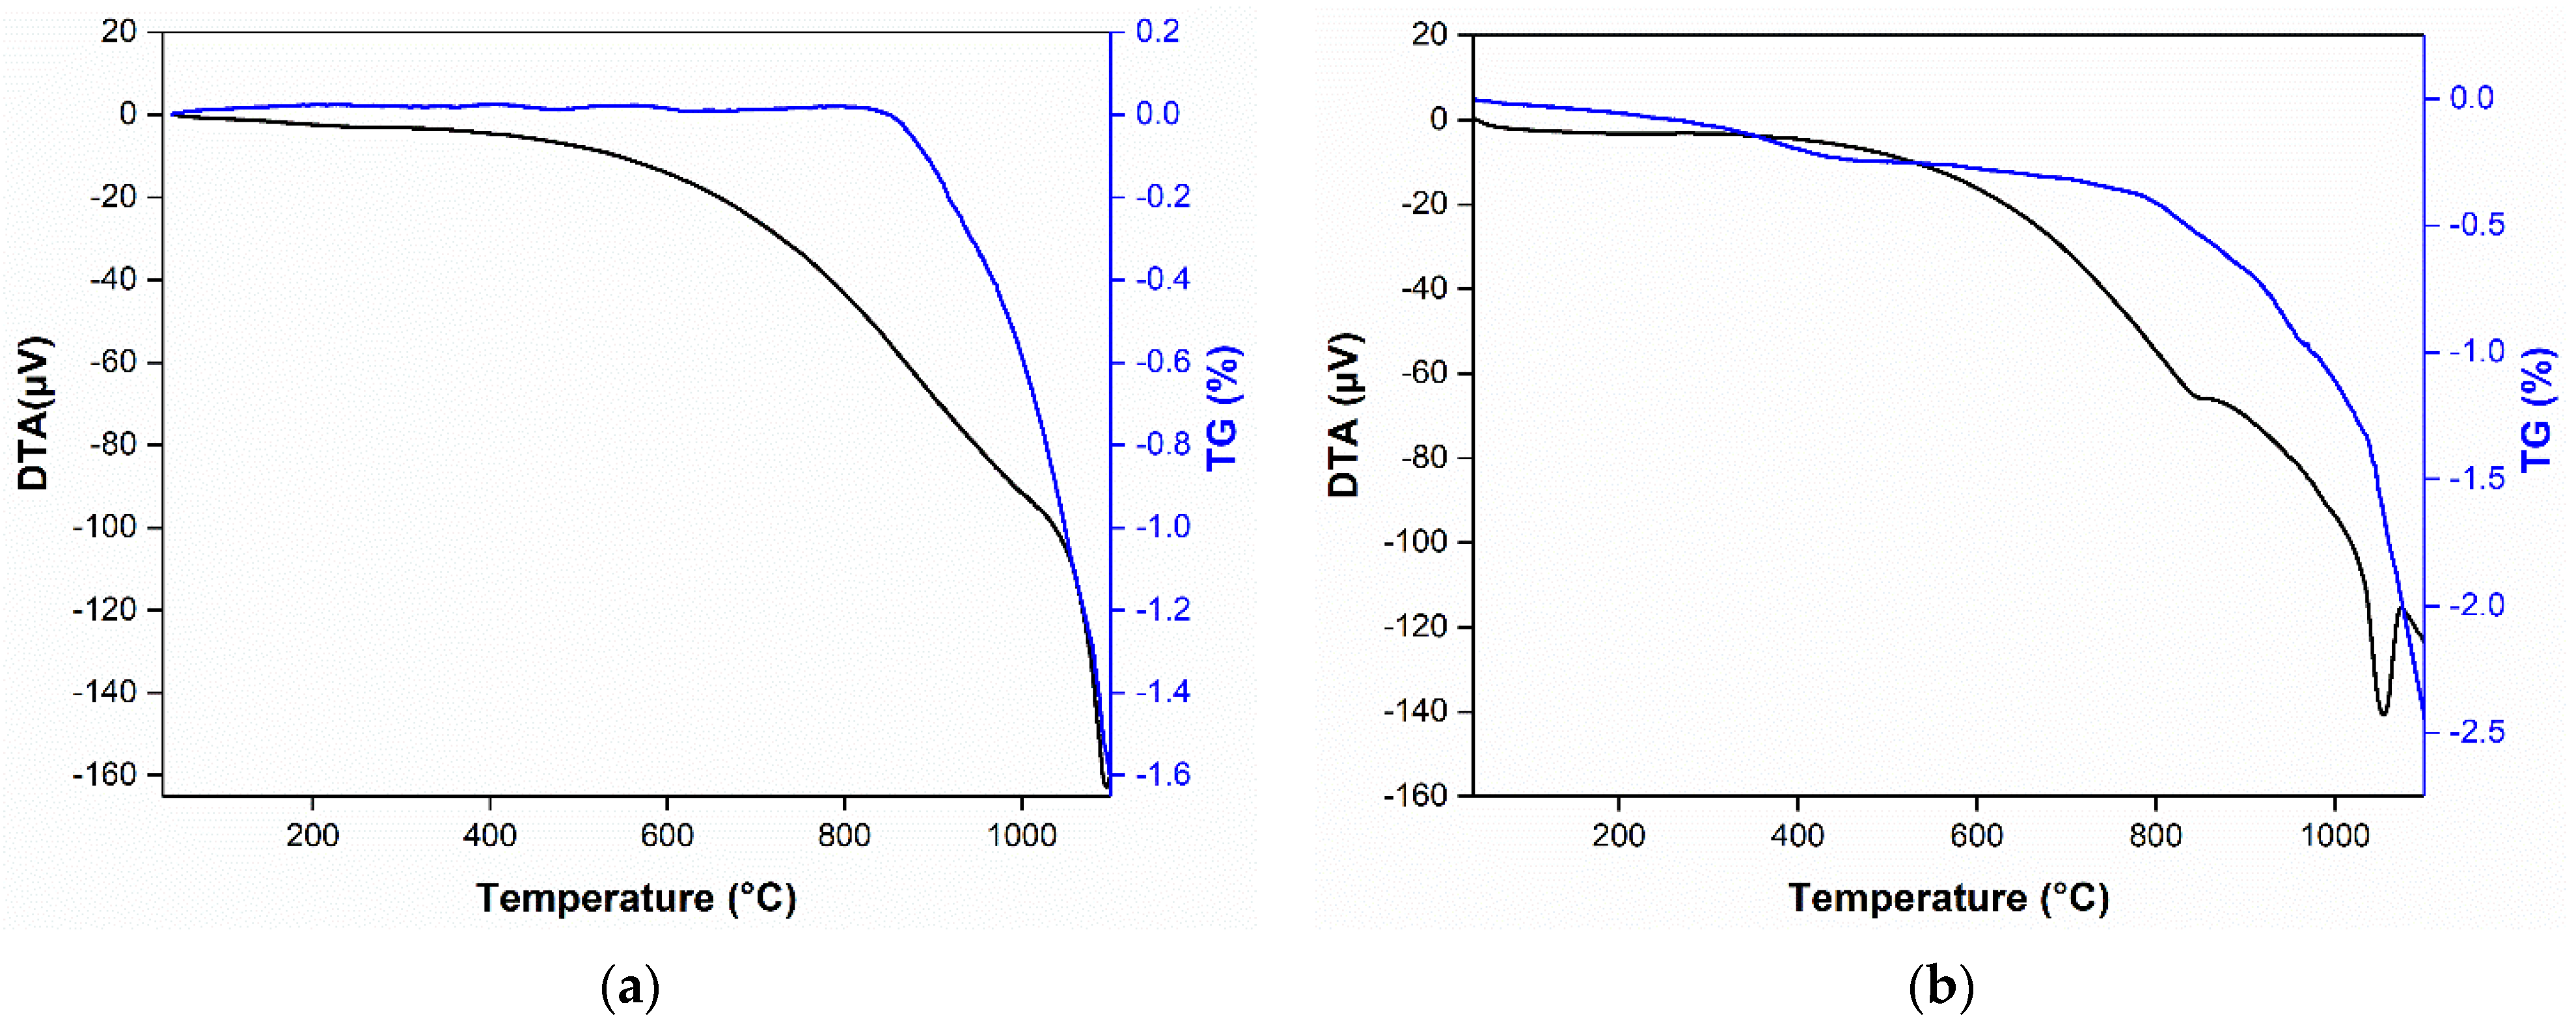
3.6. Thermal Analysis

The thermal behaviors of both samples, for Na1.5MnII3MnIII0.5(AsO4)3 and Na1.5MnII3FeIII0.5(AsO4)3, derived from TG and DTA, are illustrated in Figure 6a,b, respectively. The TGA thermograms show that the compounds are very stable up to 770 °C. The slight loss of mass can be attributed to the thermal volatilization of components. The DTA curves show that both compounds have thermally stable crystal structures. No phase transitions were detected in the range of temperature 50–800 °C. Figure 6b shows a sharp endothermic peak that can be related to the decomposition of the material.

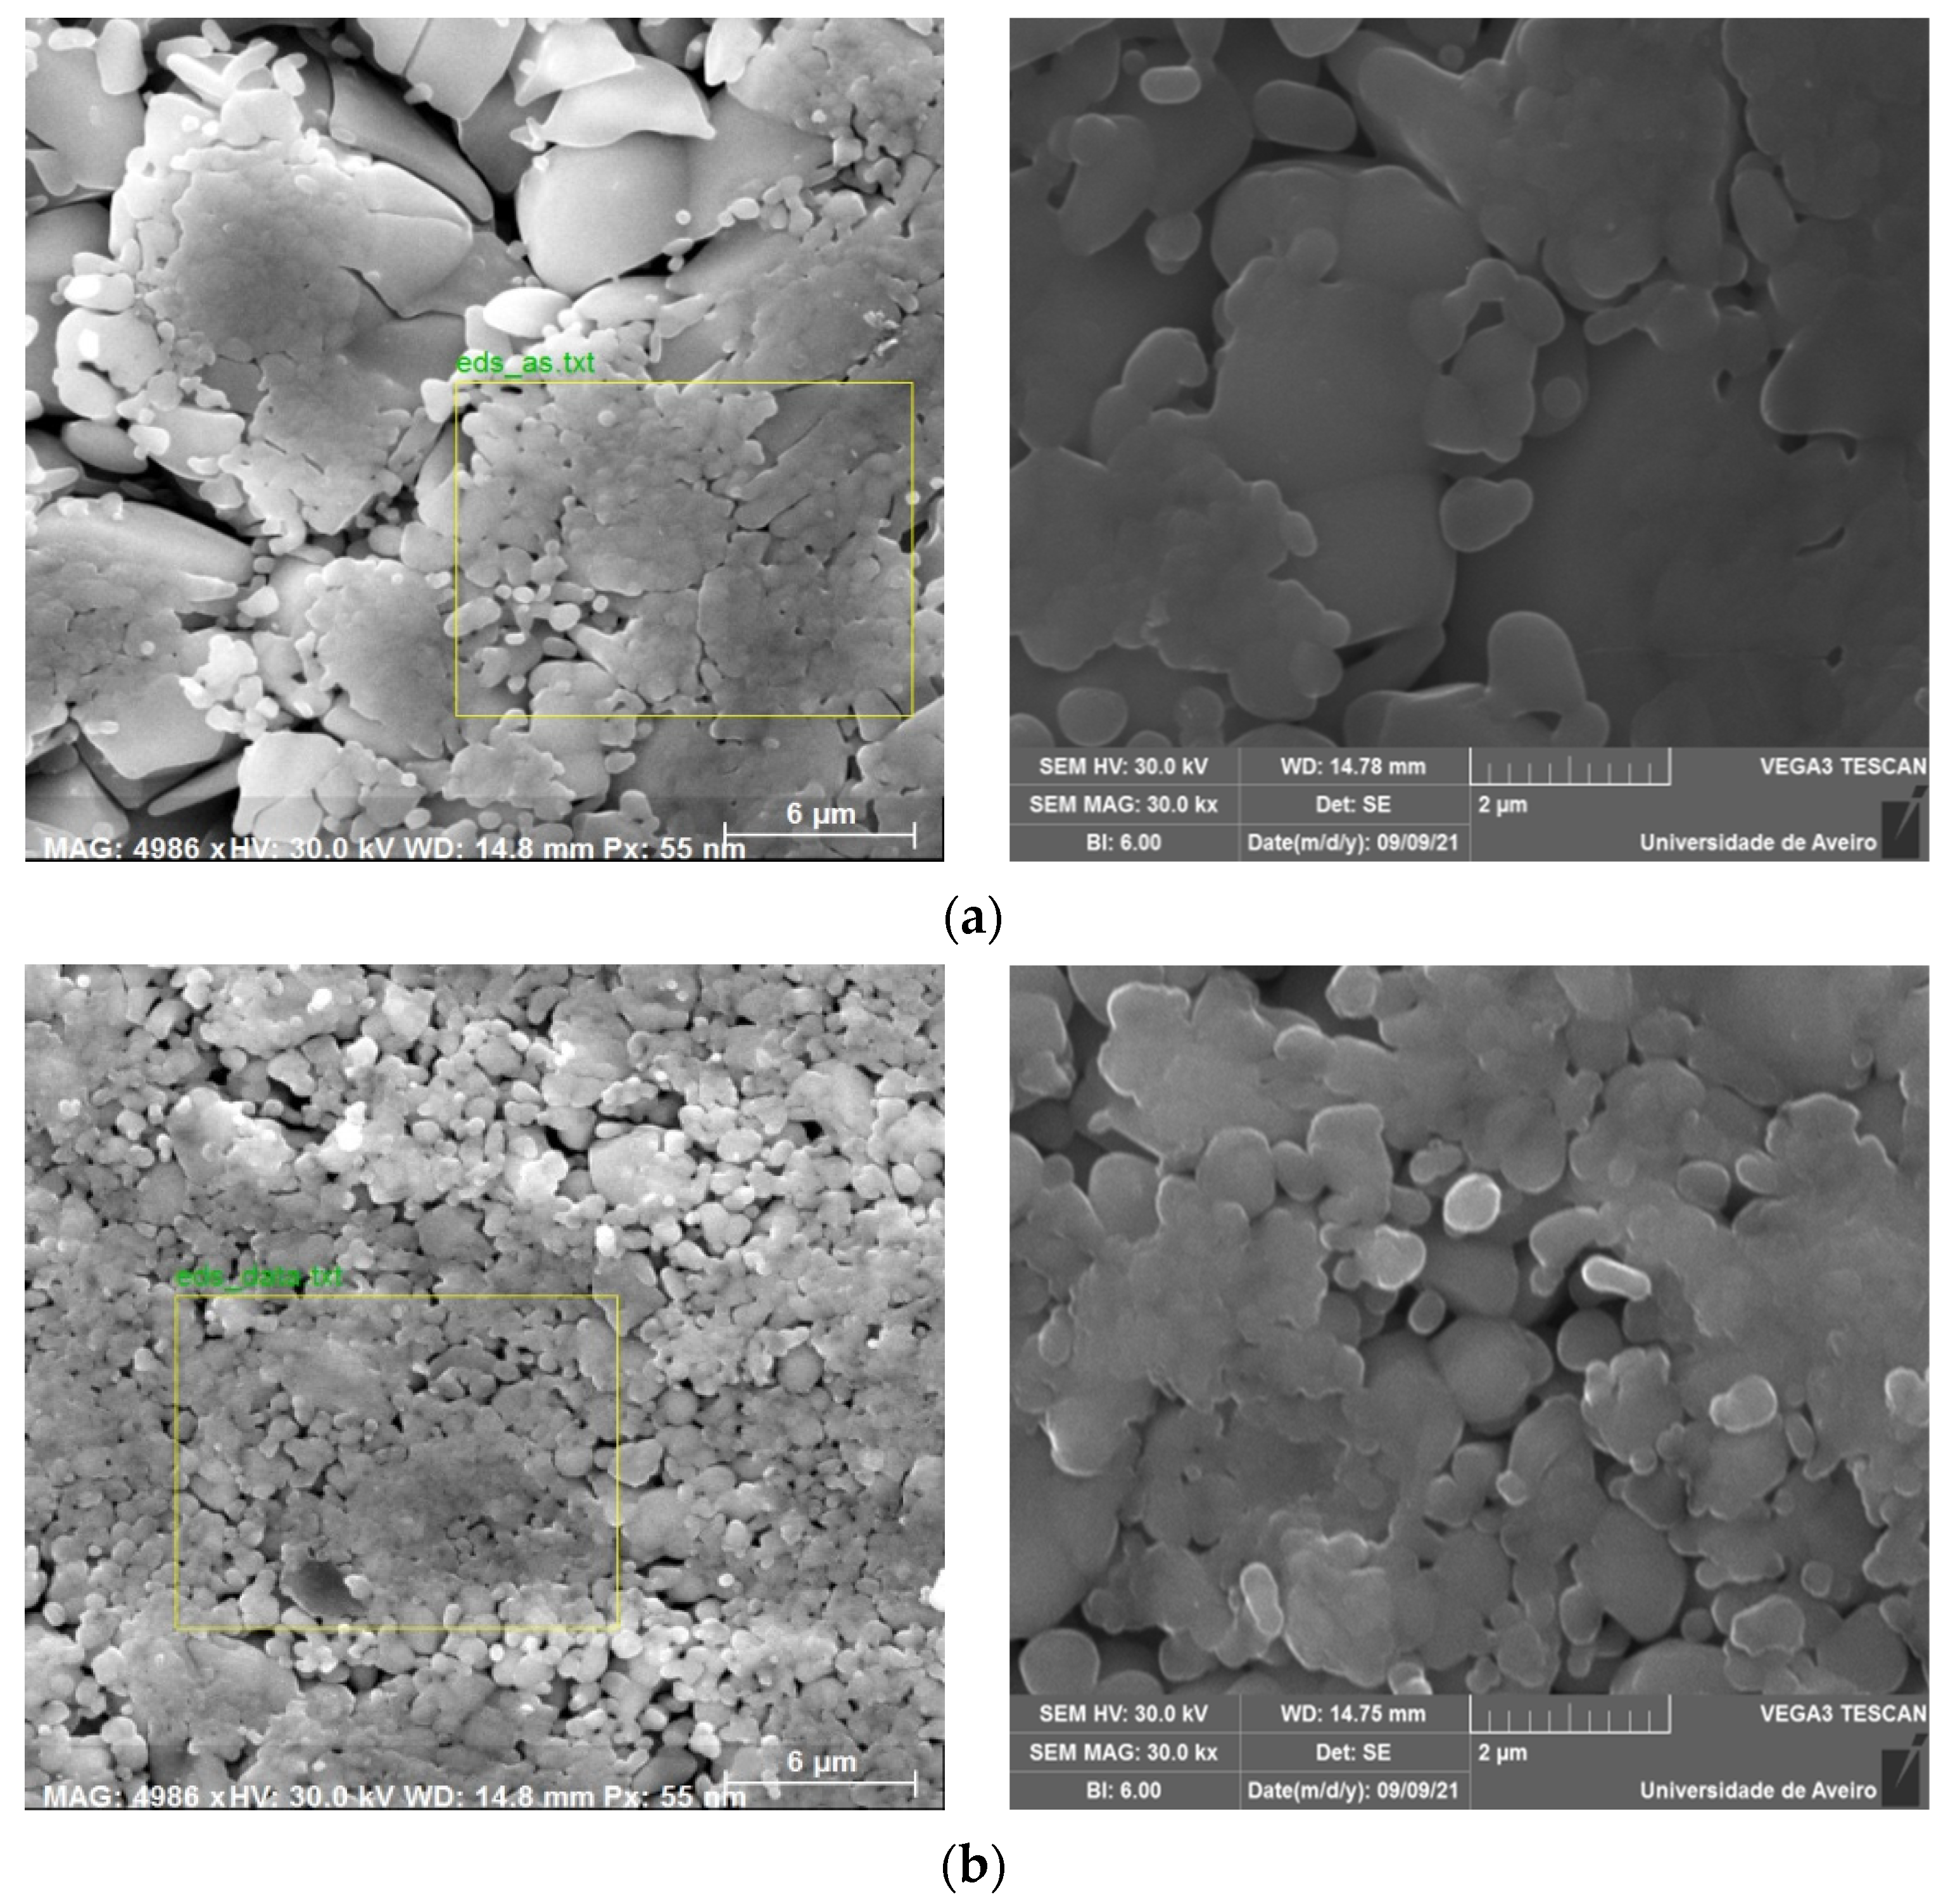
3.7. Morphological Analysis

The morphology of the surface of Na1.5MnII3MnIII0.5(AsO4)3 and Na1.5MnII3FeIII0.5(AsO4)3 was examined by SEM. The microstructure observation of both materials showed a homogenous powder. Further observations of the powders showed spherical grains (Figure 7).
Table 9 shows the elementary composition analysis performed using EDX in both compounds. For compound (I), EDX analysis showed the presence of the elements Na, Mn, As, and O. However, a low-intensity peak was attributed to traces of silicon. The percentages of the detected elements were also in agreement with the crystal structure determined by XRD (Figure 1). For compound (II), Na, Mn, Fe, As, and O elements were detected by EDX analysis. The proportions of the elements detected were consistent with the crystalline structure determined by previous XRD analysis (Figure 1). The source of silicon in material (I) can be attributed to the grinding process using an agate mortar [37].

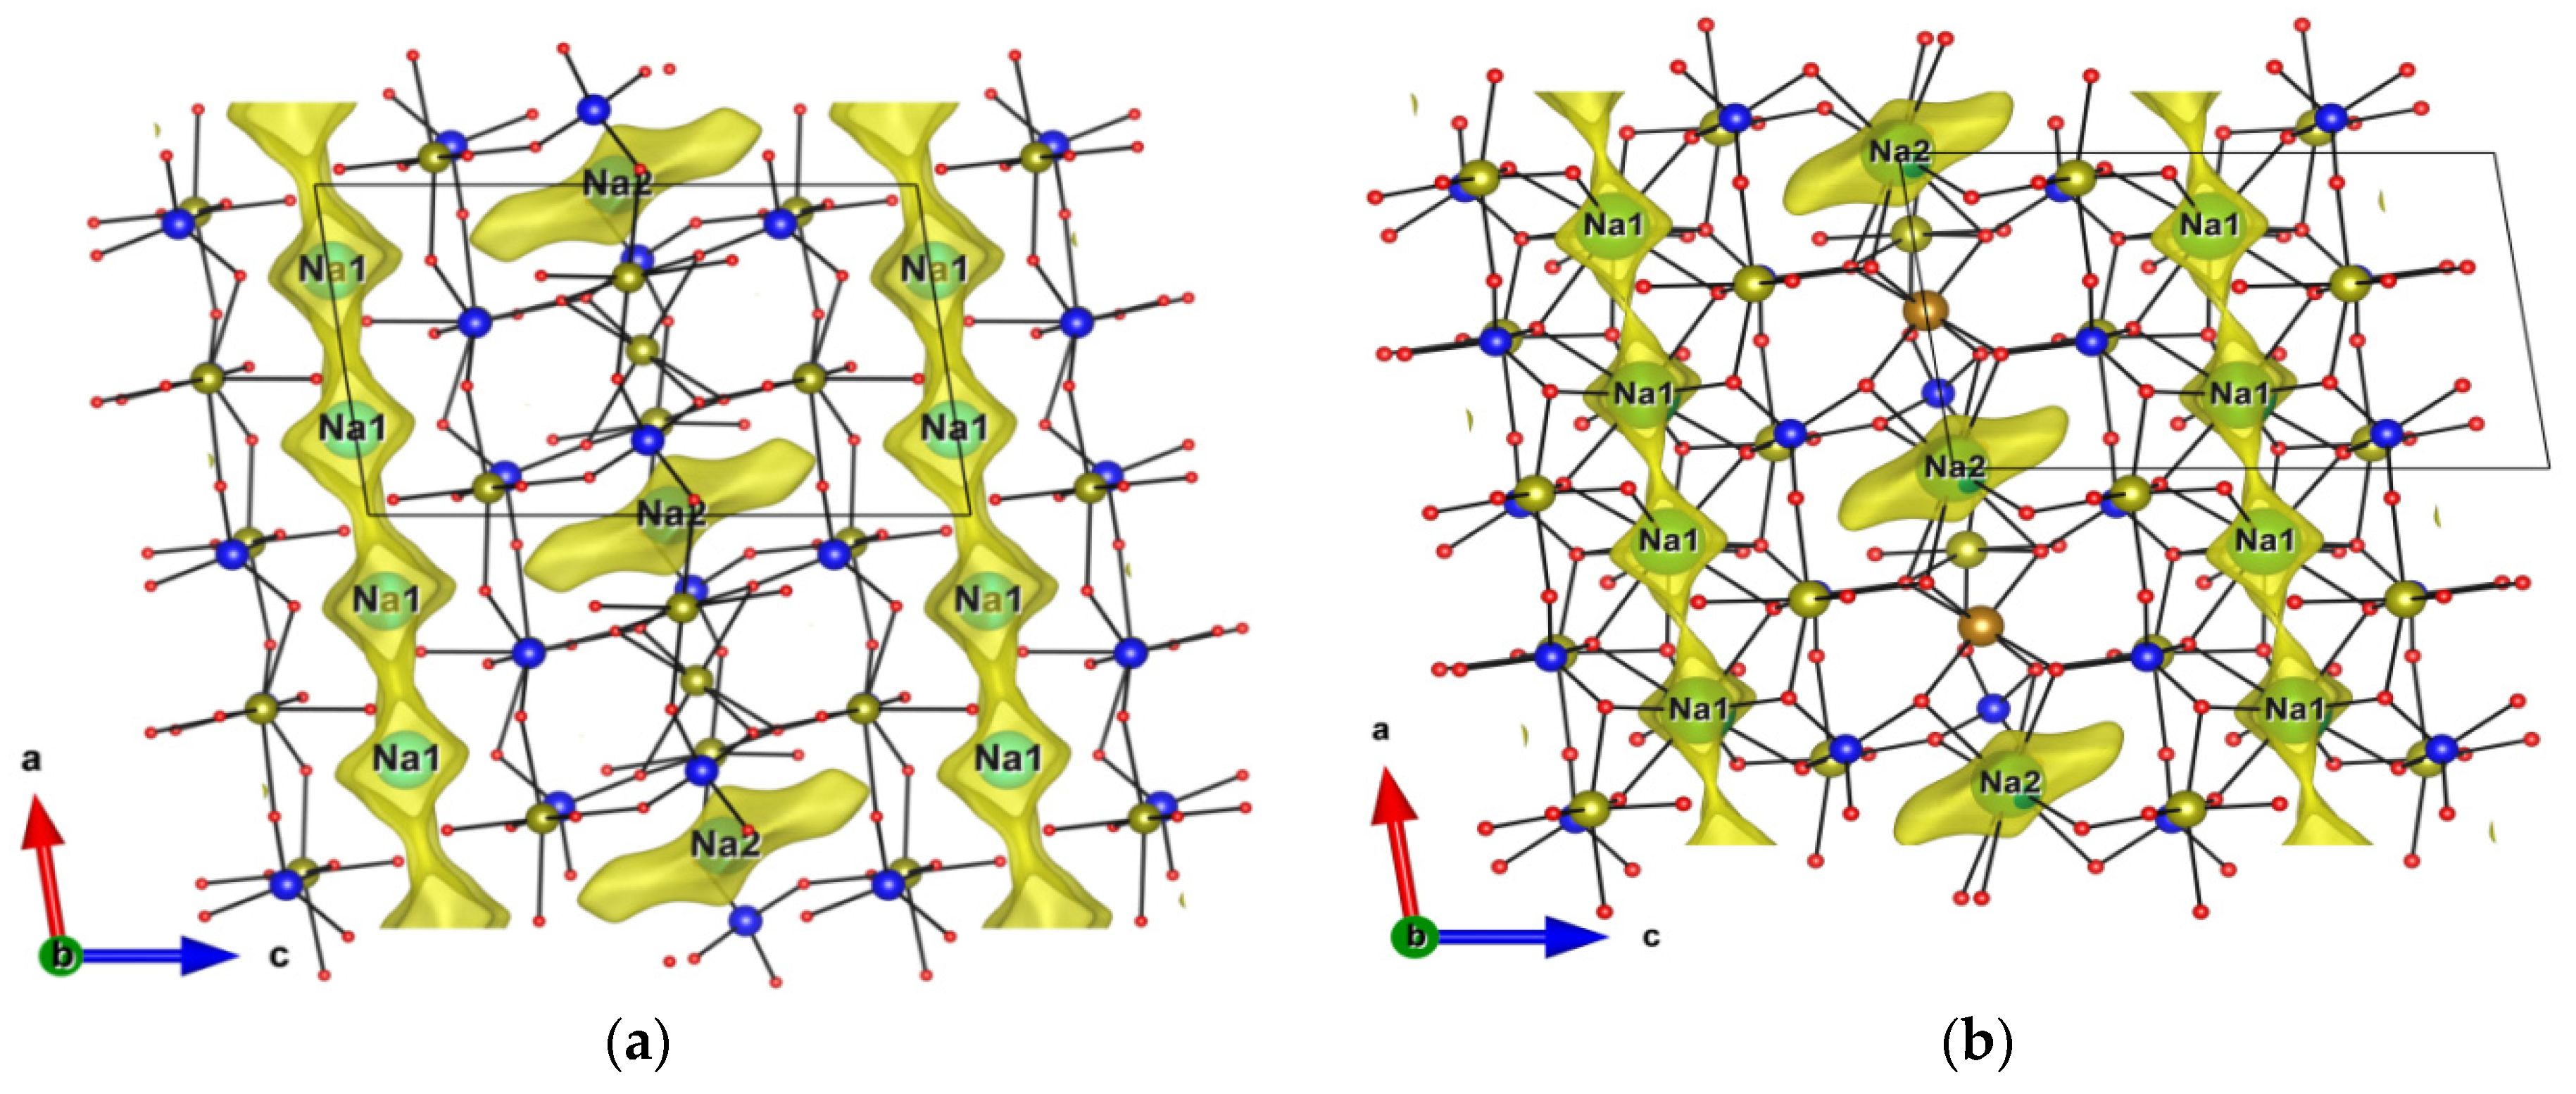
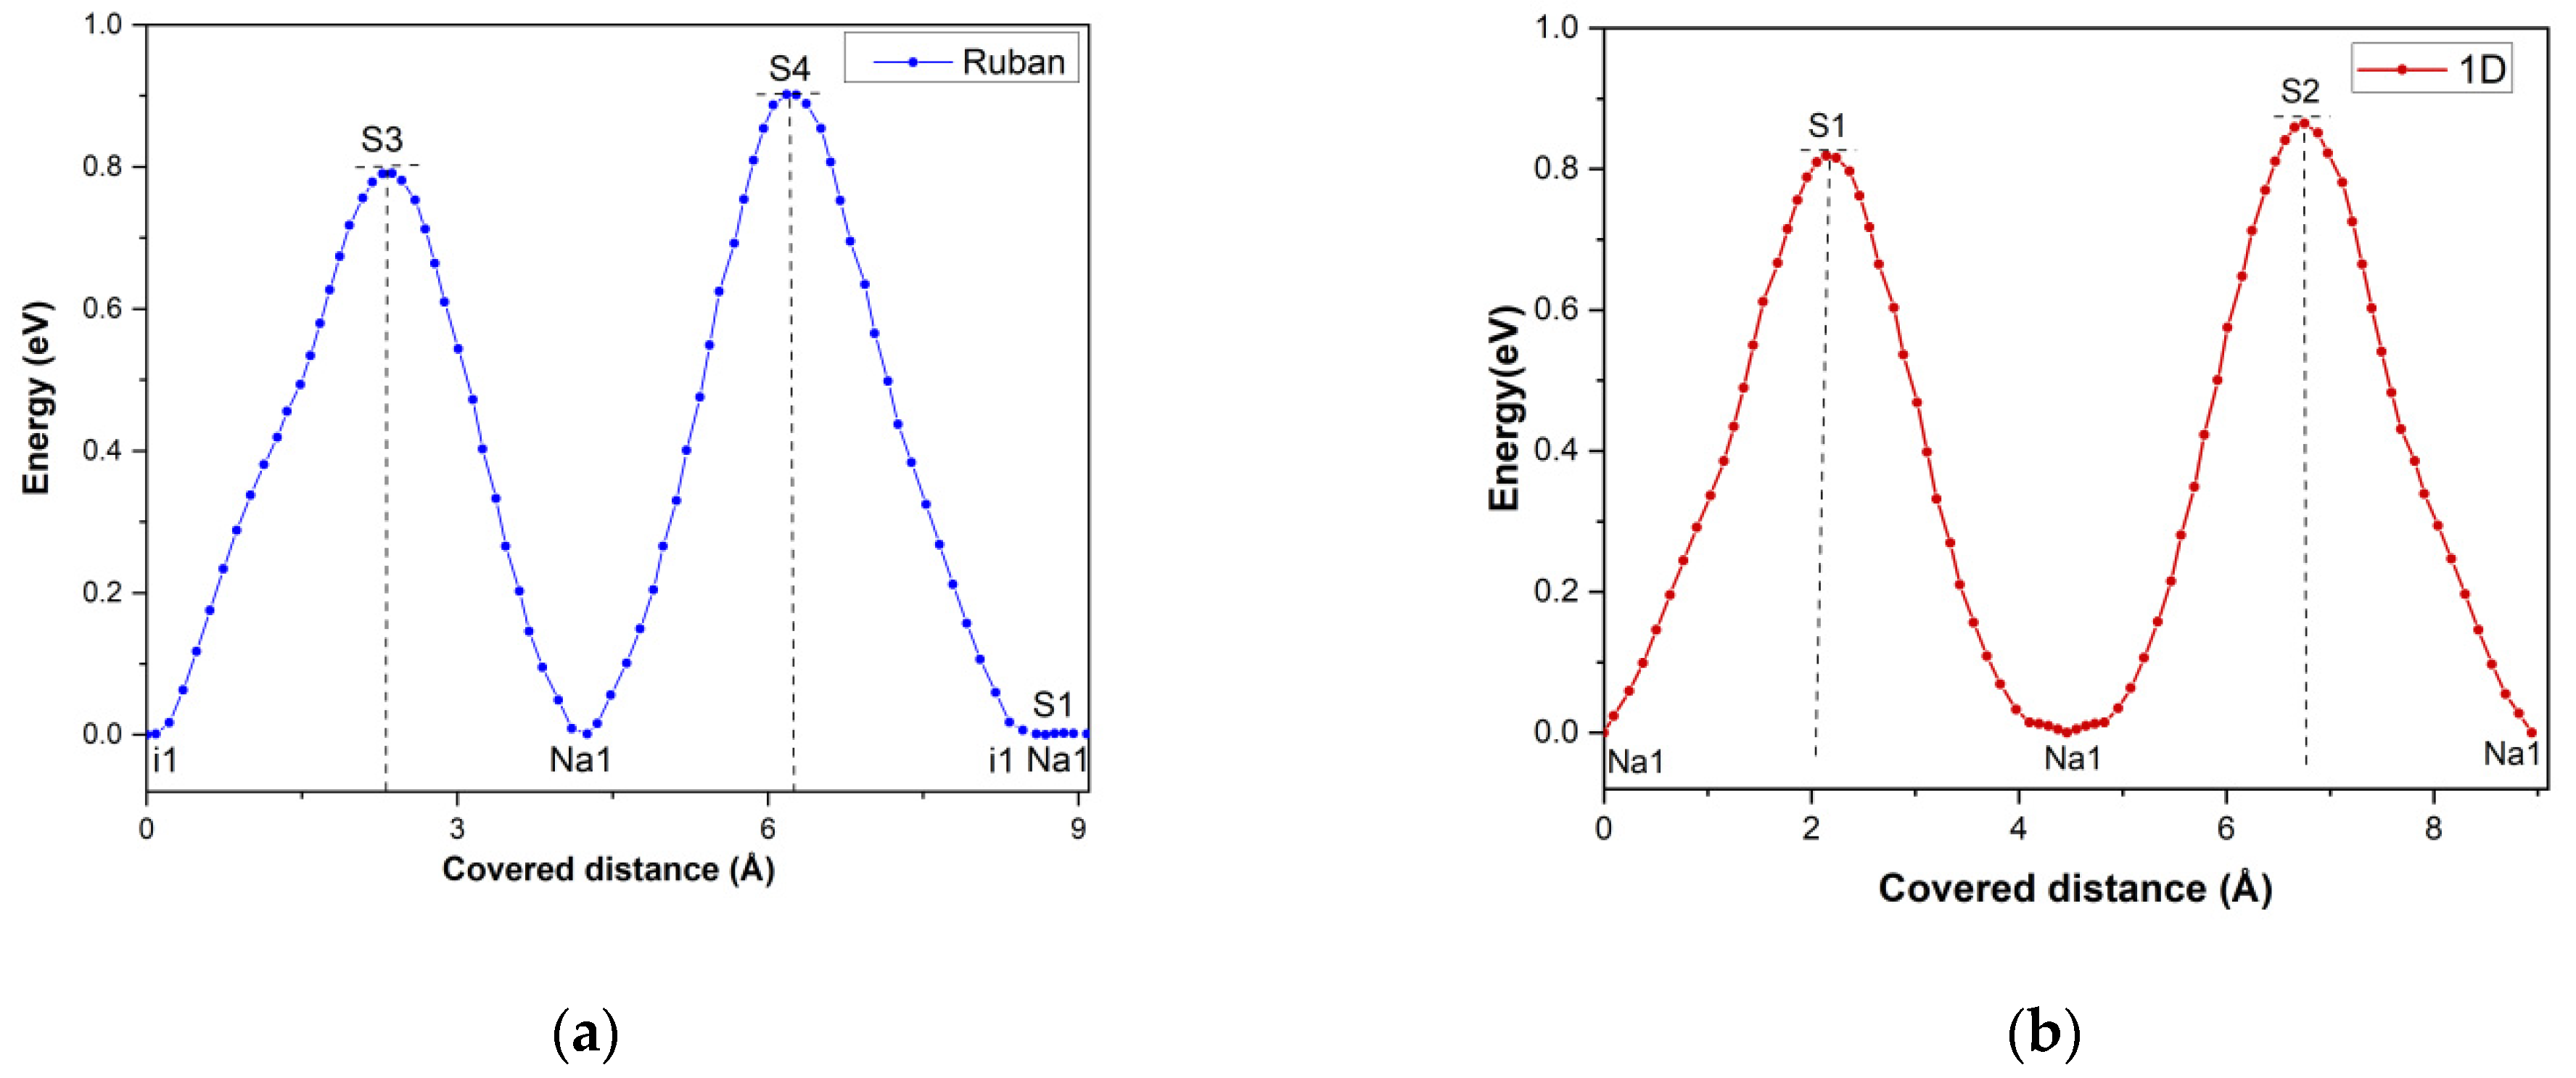
3.8. Na+ Pathways Transport Simulation

According to the BVSE analysis, this structural study allows for determining the directions of migration. The BVS model is used to verify crystal study suggestions and to determine conduction paths that are not visible during the structural study. Thus, to predict the electrical behavior of both materials, the alkaline migration pathways of Na+ were simulated using the BVSE model.
Both structures are characterized by tunnels along the a-axis and smaller windows along the c-direction. The simulation of the sodium ion conduction paths in the ionic frameworks of (I) and (II) showed that Na(1) can migrate infinitely in the direction (100) in ruban with an Emig= 0.901 eV and 1D with an Emig= 0.865 eV, respectively. However, Na(2) cannot migrate along (001) direction (Figure 8 and Figure 9). The weilliyte Na1.25Co2.187Al1.125(AsO4)3 BVSE analysis also showed that sodium migration is possible only along the a-direction but with higher activation energy of 5.54 eV [12]. In fact, for (I), the diameter of the tunnel sections along the a-direction is equal to 4.699 (5) Å, which is slightly less than 4.82 Å, the sum of the diameters of the O2- and Na+ ions. On the other hand, the section size of the windows according to c (3.329 (3) Å) is much smaller than the latter. For (II), the diameter of the tunnel sections is equal to 4.765 (8) Å, which is slightly less than 4.82 Å and the diameter of the tunnel in (II) at the same time. This can explain the higher migration energy of sodium observed in (I). It is noteworthy to point out that the data collection for material (II) involved a greater number of reflections, which enhanced the accuracy of the derived atomic positions of material (I) compared with material (II). For material (I), Na(1) migrated for a 4.257 Å distance from an inertial site i1 to a crystallographic site Na1. At a 2.37 Å distance, Na+ encountered the saddle S3 with migration energy equal to 0.791 eV. A higher migration energy (Emig = 0.901 eV) was required to enable Na(1) to migrate from its crystallographic site to an interstitial site i1, and only an energy of 0.001 eV was required for the migration of Na(1) from i1 to Na1 sites, which enabled Na(1) to migrate a total distance of 9.701 Å. Figure 8b showed two main bottlenecks for material (II) presented by the two saddles, S1 and S2. In fact, Na(1) traveled first for a 2.146 Å distance from a crystallographic site Na1 to another requiring a migration energy equal to 0.819 eV. Then Na(1) traveled for an 8.691 eV distance encountering the highest migration energy of 0.865 eV arriving at the crystallographic site Na1.

3.9. Electrical Measurements

3.9.1. Impedance Analysis

The impedance spectroscopy technique (IS) is frequently employed in experimentation, to explore the electrical characteristics of the ceramic materials. It offers insights into conductivity, relaxation, and permittivity properties. Figure 9 shows the typical complex impedance spectra obtained on heating for Na1.5MnII3MnIII0.5(AsO4) and Na1.5MnII3FeIII0.5(AsO4)3. Based on the observed behavior, it can be inferred that there is a correlation between Z’ and the electrical resistance of the sample. As the frequency and temperature increase, the value of Z’ decreases, which is a typical behavior observed in dielectric materials [38]. Additionally, for the Na1.5MnII3FeIII0.5(AsO4)3 sample, as the frequency increases, the Z’ values at various temperatures converge. This behavior indicates that the energy barrier to be overcome by the charge carriers in this specific experimental condition is very high for the electrical space displacement [37] (Figure 10).
Figure 11 describes the behavior of the imaginary part of impedance Z″ as a function of frequency, for both materials under different temperatures. The plot shows a gradual increase in Z″ with increasing frequency until it reaches a maximum, indicating the presence of a relaxation phenomenon. The peak in Z″ shifts to higher frequencies as the temperature increases, indicating that the resistance of the material is decreasing. At higher frequencies, and for the Na1.5MnII3FeIII0.5(AsO4)3 sample, Z″ merges for all temperatures, suggesting an accumulation of space charge (Figure 11b). The plot also shows a single relaxation peak that increases with the rise in the temperature, following an Arrhenius behavior [39]. At lower temperatures, the plot of Z″ as a function of frequency for Na1.5MnII3MnIII0.5(AsO4)3 shows two peaks, which suggests two relaxation processes. The lower-frequency peak can be associated with the bulk resistance of the material, while the higher-frequency peak can be associated with the grain boundary resistance. At low temperatures, the grain boundary resistance dominates, leading to a broad peak in the Z″ spectrum (Figure 11a). For both materials, the maximum value of Z″ decreases with the increase in temperature. These plots further show the spreading of the relaxation time distribution, indicating a temperature-dependent relaxation. The observed broadening of the Z″ peak, with increasing temperature, suggests a thermally activated relaxation process associated with different species, such as electrons or immobile species at lower temperatures and defects at higher temperatures [39].

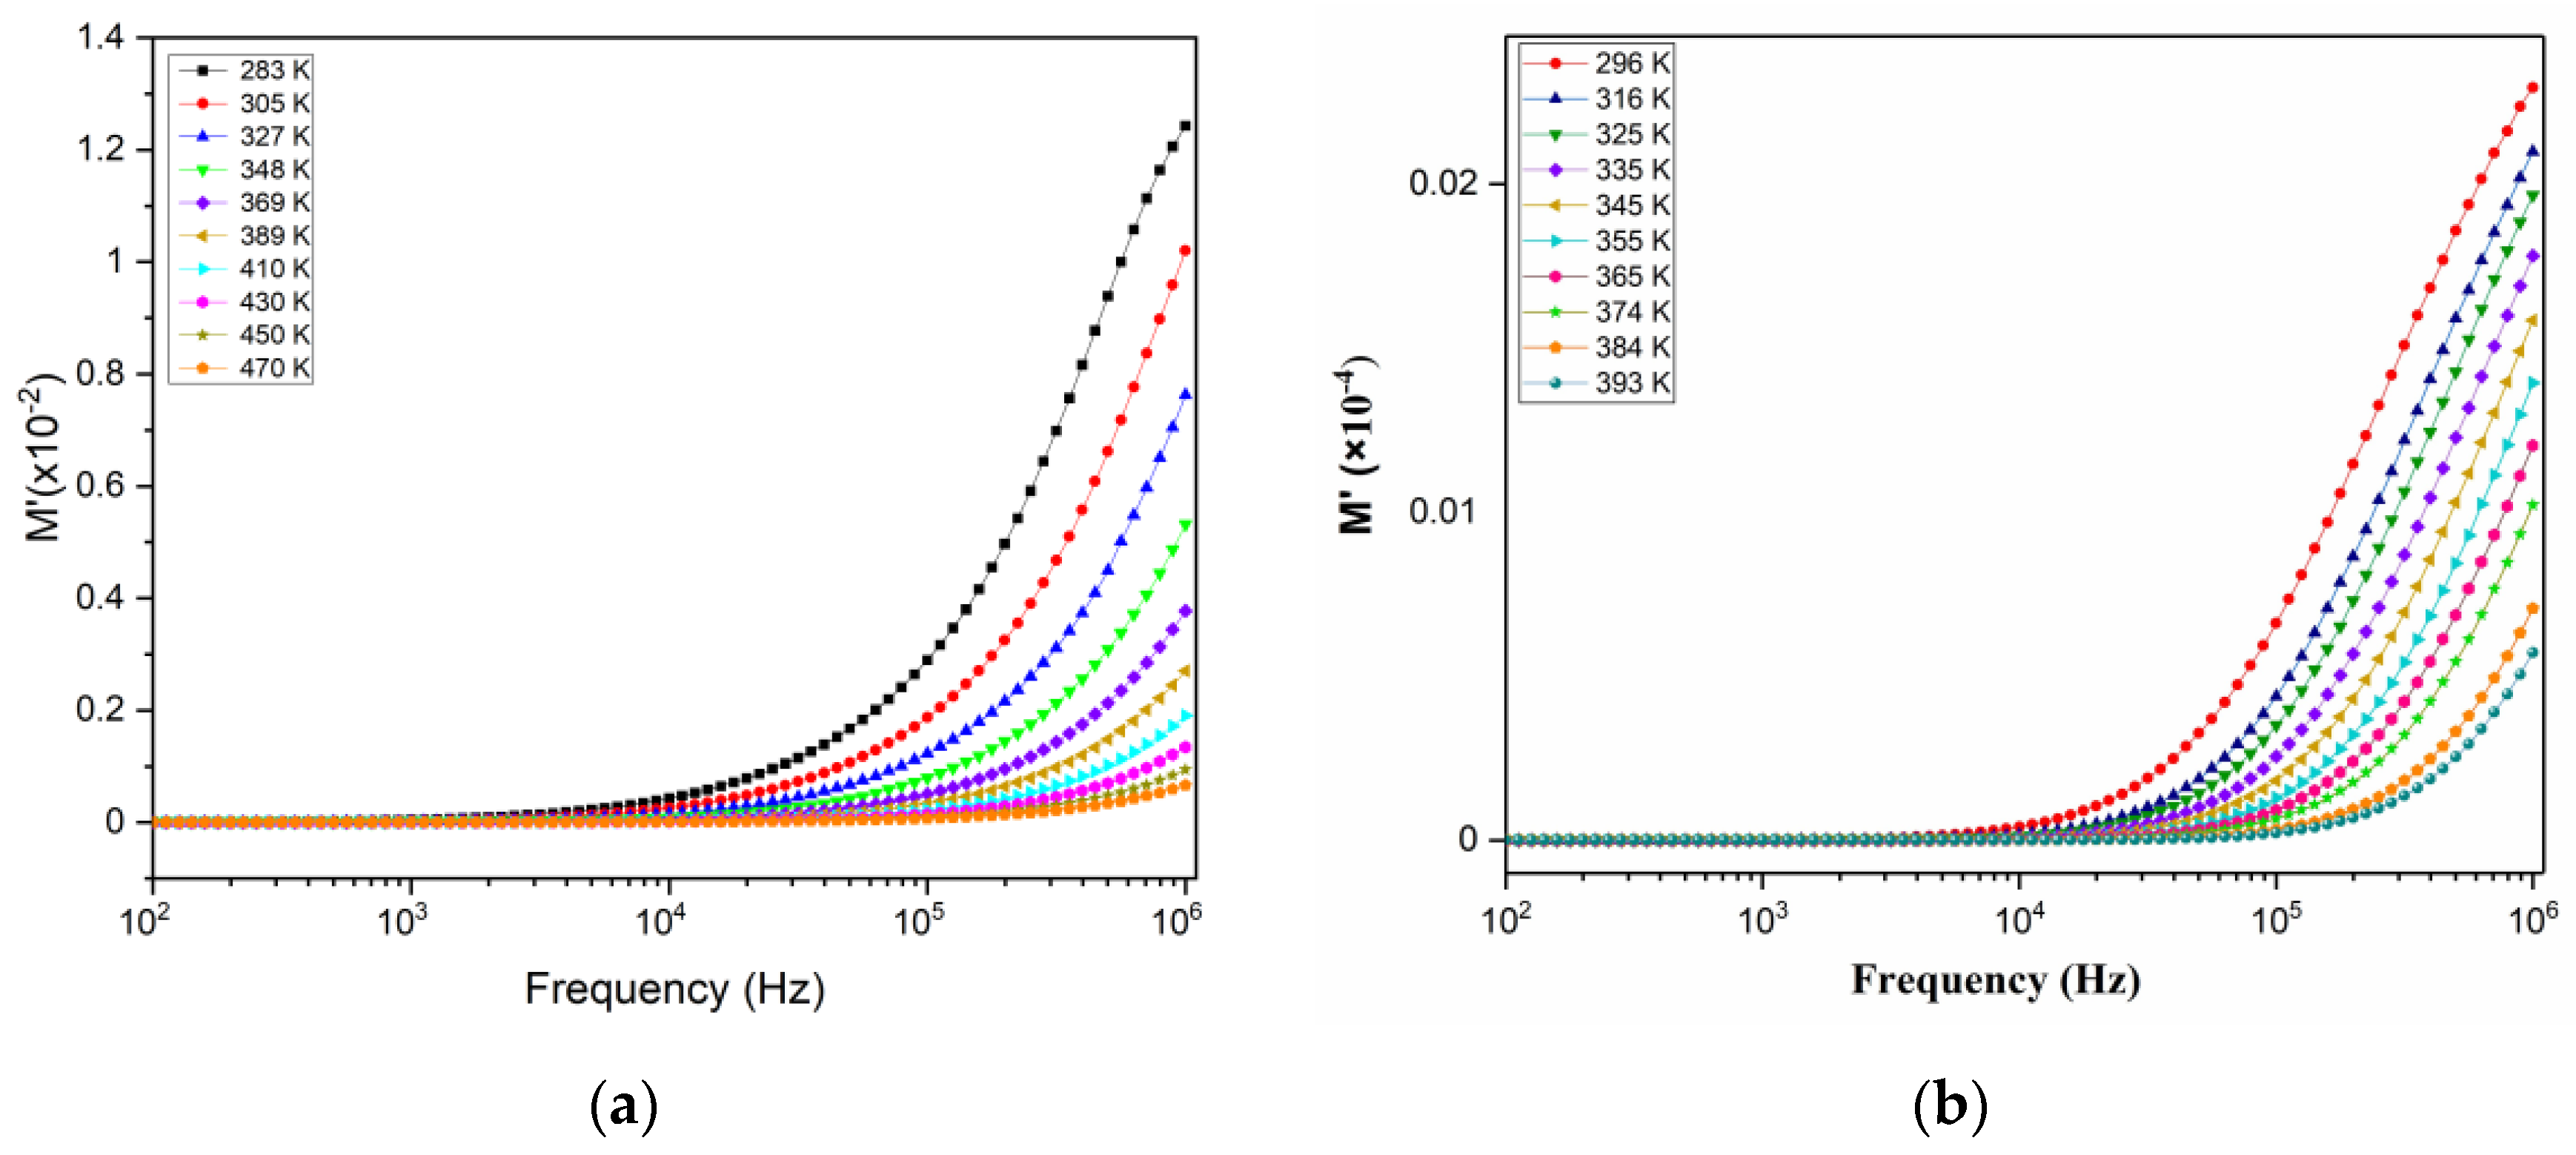
3.9.2. Modulus Analysis

The inverse of the complex dielectric permittivity, ε*, for Na1.5MnII3MnIII0.5(AsO4)3 and Na1.5MnII3FeIII0.5(AsO4)3 is known as the complex electric modulus M*. In order to calculate M*, the impedance data was utilized in the following equation: M* = 1/ε* = M′ + jM″ = (Z″ + Z′ωC)/ωCZ0, where Z′ and Z″ are the real and imaginary parts of the complex impedance Z*, and M′ and M″ are the real and imaginary parts of the complex modulus M*, respectively. Additionally, C0 represents the vacuum capacitance of the measuring cell, which is determined by the permittivity of the vacuum (ε0), the cross-section area (S), and the thickness (L) of the sample.
Figure 12 shows the variation of the real part of the modulus M′ as a function of frequency for both studied materials at different temperatures. As can be seen at low frequencies, M′ remains consistent and is almost zero at all temperatures. This is due to the lack of restoring force leading to long-range transport of load carriers below the applied ac-electric field. At higher frequencies, M′ increases progressively due to the short-range conduction effects of the Na+ ions.
As shown in Figure 13a, the imaginary part of the dielectric modulus of Na1.5MnII3MnIII0.5(AsO4)3, M″, increases continuously with the frequency, indicating that the material has a high capacity for energy storage and low capacity for dissipation. This behavior is due to the ability of the material to undergo molecular rearrangements and deformations in response to the applied electric field. This performance is usually observed in viscoelastic materials, polymers, and ionic liquids [40]. Figure 13b shows the frequency dependence of the imaginary part of the electric modulus M″ of Na1.5MnII3FeIII0.5(AsO4)3. The M″ curve shows a broad peak that rises as the temperature increases until reaching a maximum at 296 K, for a frequency of fmax ≈ 0.5 × 10⁶ Hz, approximately. For higher temperatures, this maximum shifts to higher frequencies. When the frequency is between 102 and 104 Hz, Na+ ions can move across large distances. However, when the frequency is higher than fmax, Na+ ions are limited to their potential well. As temperature rises, the mobility of the charge carriers increases, causing a decrease in the relaxation time and a shift of the relaxation peak, toward higher frequencies. This phenomenon indicates a dielectric relaxation process, predominantly governed by a hopping mechanism of the charge carriers, which is thermally activated [41].

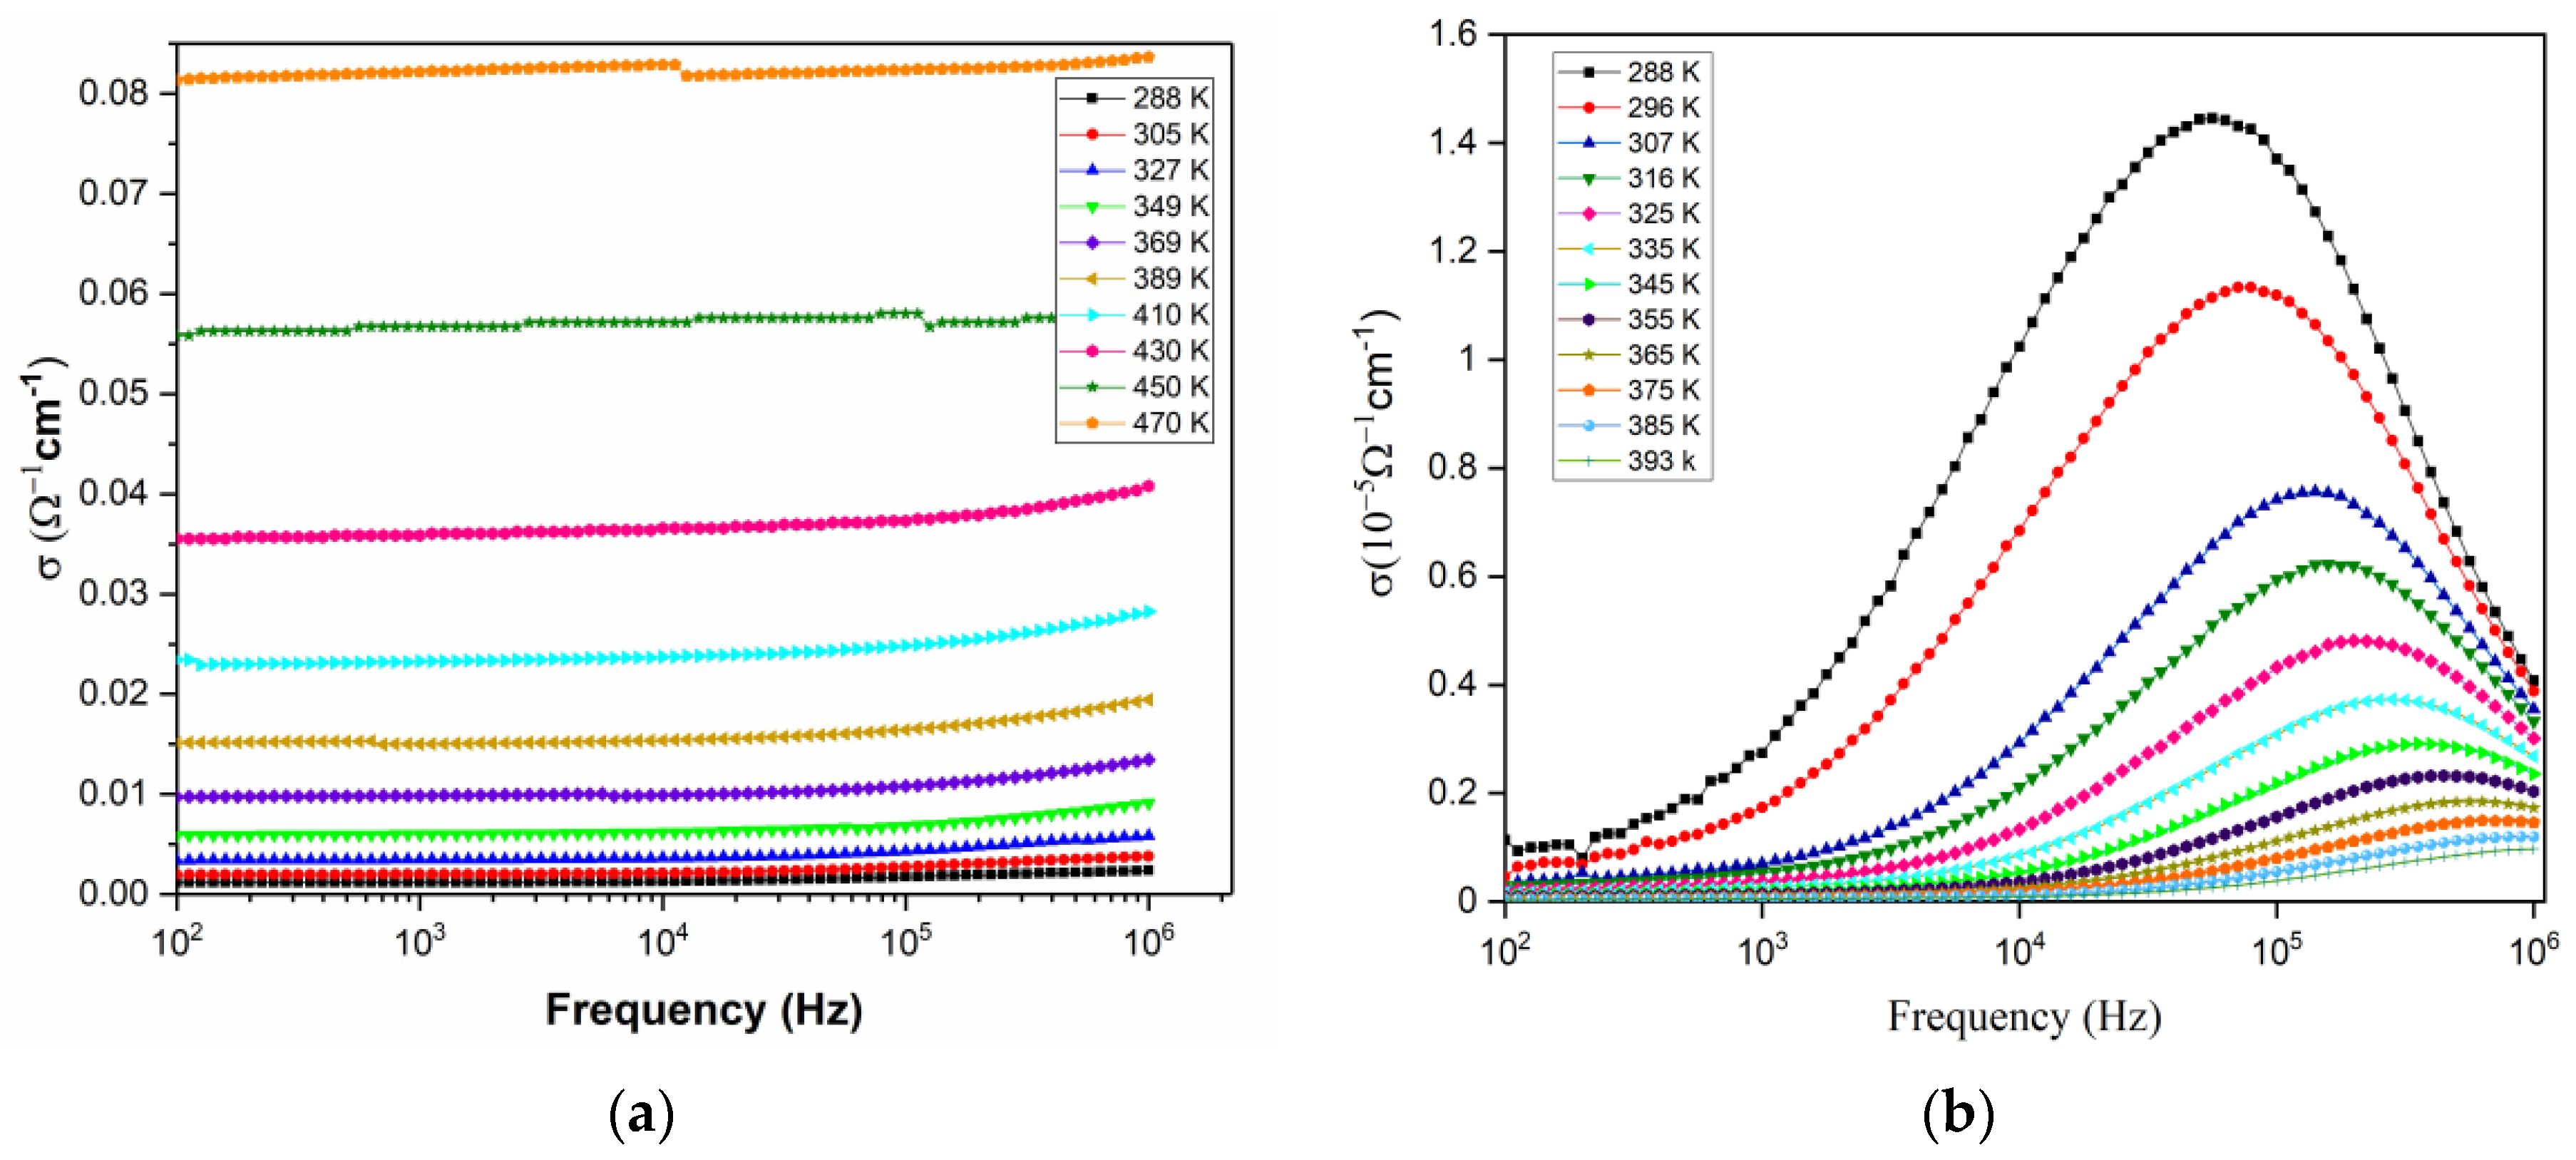
3.9.3. AC Conductivity Study

To analyze the conductivity of both samples, Equation (1) was used to calculate the ac conductivity for each temperature:
σ a c = ε 0 ω ε = ε 0 ω Z C 0 ω Z 2 + Z 2 = L S Z Z 2 + Z 2
The real and imaginary parts of the impedance, Z′ and Z″, were used along with the thickness, L, and cross-section, S, of the sample to derive the conductivity [42,43]. Figure 13 shows the plots of the ac conductivity of Na1.5MnII3MnIII0.5(AsO4)3 and Na1.5MnII3FeIII0.5(AsO4)3 as a function of frequency. An almost frequency-independent behavior is observed for the sample Na1.5MnII3MnIII0.5(AsO4)3. There is a slight dispersion in the higher frequency region, but the most characteristic feature is the increase in the conductivity with the temperature, revealing a thermal activation phenomenon. Figure 14b shows a relaxation phenomenon, which maximally shifts to higher frequencies with the rise of the temperature.

4. Conclusions

The crystal structures of Na1.5MnII3MnIII0.5(AsO4)3 and Na1.5MnII3FeIII0.5(AsO4)3 have been successfully determined and refined. Both compounds crystallize in the monoclinic system with the space group P21/c. The structural models were validated using bond valence calculations and charge distribution analysis, confirming their accuracy. The analysis revealed that the MnII and MnIII ions exhibit deviations in their charges, indicating a mixed valence and electron delocalization within the three-dimensional network. The obtained structures consist of interconnected chains of MnII and MnIII or FeIII octahedra, with AsO4 tetrahedra connecting them, forming a three-dimensional anionic framework. The presence of tunnels and cavities within the structure allows for the localization of Na+ cations. The electrical properties were investigated using impedance spectroscopy measurements. The impedance study showed a relaxation phenomenon and a decrease in resistance with increasing temperature. The dielectric modulus (M*) and the AC conductivity were also analyzed, providing insights into the conduction and energy storage properties of the materials.

Author Contributions

Conceptualization, E.R., N.O. and M.P.F.G.; methodology, E.R., S.R.G., J.P.F.C. and S.S.T.; software, E.R. and J.P.F.C.; validation, N.O., M.P.F.G. and S.S.T.; formal analysis, M.P.F.G. and S.S.T.; investigation, E.R., N.O. and M.P.F.G.; resources, M.P.F.G.; data curation, S.R.G. and S.S.T.; writing—original draft preparation, E.R.; writing—review and editing, S.R.G., M.P.F.G. and S.S.T.; visualization, E.R.; supervision, M.P.F.G.; project administration, M.P.F.G.; funding acquisition, N.O. and M.P.F.G. All authors have read and agreed to the published version of the manuscript.

Funding

The authors extend their appreciation to the FEDER funds through the COMPETE 2020 Program and National Funds through FCT—Portuguese Foundation for Science and Technology under the project LISBOA-01-0247-FEDER-039985/POCI-01-0247-FEDER-039985, LA/P/0037/2020, UIDP/50025/2020, and UIDB/50025/2020 of the Associate Laboratory Institute of Nanostructures, Nanomodelling, and Nanofabrication—i3N., UCIBIO (UIDP/04378/2020 and UIDB/04378/2020) and Associate Laboratory i4HB (LA/P/0140/2020). S.R. Gavinho acknowledge FCT—Portuguese Foundation for Science and Technology for the PhD grant (SFRH/BD/148233/2019).

Institutional Review Board Statement

Not applicable.

Informed Consent Statement

Not applicable.

Data Availability Statement

Not applicable.

Acknowledgments

The authors extend their appreciation to the FEDER funds through the COMPETE 2020 Program and National Funds through FCT—Portuguese Foundation for Science and Technology under the projects LISBOA-01-0247-FEDER-039985/POCI-01-0247-FEDER-039985, LA/P/0037/2020, UIDP/50025/2020, and UIDB/50025/2020 of the Associate Laboratory Institute of Nanostructures, Nanomodelling, and Nanofabrication—i3N. S.R. Gavinho acknowledges FCT—Portuguese Foundation for Science and Technology for the PhD grant (SFRH/BD/148233/2019).

Conflicts of Interest

The authors declare no conflict of interest.

References

  1. Imai, H.; Kamiya, Y.; Okuhara, T. Selective Oxidation of N-Butane over Nanosized Crystallites of (VO)2P2O7 Synthesized by an Exfoliation-Reduction Process of VOPO4·2H2O in a Mixture of 2-Butanol and Ethanol. J. Catal. 2007, 251, 195–203. [Google Scholar] [CrossRef] [Green Version]
  2. Jouini, A.; Gâcon, J.C.; Ferid, M.; Trabelsi-Ayadi, M. Luminescence and Scintillation Properties of Praseodymium Poly and Diphosphates. Opt. Mater. 2003, 24, 175–180. [Google Scholar] [CrossRef]
  3. Herle, P.S.; Ellis, B.; Coombs, N.; Nazar, L.F. Nano-Network Electronic Conduction in Iron and Nickel Olivine Phosphates. Nat. Mater. 2004, 3, 147–152. [Google Scholar] [CrossRef] [PubMed]
  4. Daidouh, A.; Durio, C.; Pico, C.; Veiga, M.L.; Chouaibi, N.; Ouassini, A. Structural and Electrical Study of the Alluaudites (Ag1 − xNax)2FeMn2(PO4)3 (x = 0, 0.5 and 1). Solid State Sci. 2002, 4, 541–548. [Google Scholar] [CrossRef]
  5. Bdey, S.; Savvin, S.N.; Bourguiba, N.F.; Núñez, P. Synthesis, Crystal Structure and Na+ Transport in Na3La(AsO4)2. J. Solid State Chem. 2022, 305, 122644. [Google Scholar] [CrossRef]
  6. Masquelier, C.; Patoux, S.; Wurm, C.; Morcrette, M. Polyanion-Based Positive Electrode Materials. In Lithium Batteries; Springer: Boston, MA, USA, 2009; ISBN 978-0-387-92675-9_15. [Google Scholar]
  7. Moore, P.B.; Ito, J. Wyllieite, Na2Fe2+ 2Al[PO4]3, a New Species. Mineral. Rec. 1973, 4, 131–136. [Google Scholar]
  8. Moore, P.B.; Ito, J. Alluaudites, Wyllieites, Arrojadites: Crystal Chemistry and Nomenclature. Miner. Mag. 1979, 43, 227–235. [Google Scholar] [CrossRef]
  9. Yang, H.; Downs, R.T.; Gu, X.; Xie, X.; Kobsch, A. Fupingqiuite, IMA 2016-087. CNMNC Newsletter No. 35. Miner. Mag. 2017, 81, 209–213. [Google Scholar]
  10. Frigui, W.; Zid, M.F.; Driss, A. Wyllieite-Type Ag1.09Mn3.46(AsO4)3. Acta Crystallogr. Sect. E Struct. Rep. Online 2012, 68, i40–i41. [Google Scholar] [CrossRef] [Green Version]
  11. Frigui, W.; Zid, M.F.; Driss, A. Synthesis and Physico-Chemical Study of Na0.5K0.65Mn3.43(AsO4)3 Compound. Jordan J. Chem. 2011, 6, 295–305. [Google Scholar]
  12. Marzouki, R.; Ben Smida, Y.; Avdeev, M.; Alghamdi, M.M.; Zid, M.F. Synthesis, Structure and Na+ Migration Pathways of New Wylleite-Type Na1.25Co2.187Al1.125(AsO4)3. Mater. Res. Express 2019, 6, 126313. [Google Scholar] [CrossRef]
  13. Bdey, S.; Bourguiba, N.F.; Savvin, S.N.; Núñez, P. Na3Bi(AsO4)2: Synthesis, Crystal Structure and Ionic Conductivity. J. Solid State Chem. 2019, 272, 189–197. [Google Scholar] [CrossRef]
  14. Degen, T.; Sadki, M.; Bron, E.; König, U.; Nénert, G. The High Score Suite. Powder Diffr. 2014, 29, S13–S18. [Google Scholar] [CrossRef] [Green Version]
  15. Chen, H.; Wong, L.L.; Adams, S. SoftBV—A Software Tool for Screening the Materials Genome of Inorganic Fast Ion Conductors. Acta Crystallogr. Sect. B Struct. Sci. 2019, 75, 18–33. [Google Scholar] [CrossRef]
  16. Momma, K.; Izumi, F. VESTA 3 for Three-Dimensional Visualization of Crystal, Volumetric and Morphology Data. J. Appl. Crystallogr. 2011, 44, 1272–1276. [Google Scholar] [CrossRef]
  17. Teixeira, S.S.; Graça, M.P.F.; Lucas, J.; Valente, M.A.; Soares, P.I.P.; Lança, M.C.; Vieira, T.; Silva, J.C.; Borges, J.P.; Jinga, L.I.; et al. Nanostructured LiFe5O8 by a Biogenic Method for Applications from Electronics to Medicine. Nanomaterials 2021, 11, 193. [Google Scholar] [CrossRef]
  18. Graça, M.P.F.; Ferreira da Silva, M.G.; Sombra, A.S.B.; Valente, M.A. Electric and Dielectric Properties of a SiO2-Na2O-Nb2O5 Glass Subject to a Controlled Heat-Treatment Process. Phys. B Condens. Matter 2007, 396, 62–69. [Google Scholar] [CrossRef]
  19. Graça, M.P.F.; Prezas, P.R.; Costa, M.M.; Valente, M.A. Structural and Dielectric Characterization of LiNbO3 Nano-Size Powders Obtained by Pechini Method. J. Solgel. Sci. Technol. 2012, 64, 78–85. [Google Scholar] [CrossRef]
  20. Graça, M.P.F.; Ferreira da Silva, M.G.; Valente, M.A. NaNbO3 Crystals Dispersed in a B2O3 Glass Matrix—Structural Characteristics versus Electrical and Dielectrical Properties. Solid State Sci. 2009, 11, 570–577. [Google Scholar] [CrossRef]
  21. Toby, B.H. EXPGUI, a Graphical User Interface for GSAS. J. Appl. Crystallogr. 2001, 34, 210–213. [Google Scholar] [CrossRef] [Green Version]
  22. Toby, B.H. R Factors in Rietveld Analysis: How Good Is Good Enough? Powder Diffr. 2006, 21, 67–70. [Google Scholar] [CrossRef] [Green Version]
  23. Adams, S. Structural Science Relationship between Bond Valence and Bond Softness of Alkali Halides and Chalcogenides. Acta Crystallogr. Sect. B Struct. Sci. 2001, B57, 278–287. [Google Scholar] [CrossRef]
  24. Brown, I.D.; Shannon, R.D. Empirical Bond-strength–Bond-length Curves for Oxides. Acta Crystallogr. Sect. A 1973, 29, 266–282. [Google Scholar] [CrossRef]
  25. Yakubovich, O.V.; Massa, W.; Gavrilenko, P.G.; Dimitrova, O.V. The Crystal Structure of a New Synthetic Member in the Wyllieite Group: Na1.265Mn2+2.690Mn3+0.785(PO4)3. Eur. J. Mineral. 2005, 17, 741–748. [Google Scholar] [CrossRef]
  26. Ayed, B.; Krifa, M.; Haddad, A. Na1.72Mn3.28(AsO4)3. Acta Crystallogra. Sect C Cryst. Struct. Commun. 2002, 58, i98–i100. [Google Scholar] [CrossRef]
  27. Shannon, R.D.; Prewitt, C.T. Effective Ionic Radii in Oxides and Fluorides. Acta Crystallogr. Sect. B Struct. Sci. 1969, 25, 925–946. [Google Scholar] [CrossRef]
  28. Ouaatta, S.; Assani, A.; Saadi, M.; El Ammari, L. Crystal Structure of a New Tripotassium Hexanickel Iron Hexaphosphate. Acta Crystallogr. Sect. E Struct. Rep. Online 2019, 75, 402–404. [Google Scholar] [CrossRef]
  29. Nakamoto, K. Infrared and Raman Spectra of Inorganic and Coordination Compounds Part B: Applications in Coordination, Organometallic, and Bioinorganic Chemistry, 6th ed.; Wiley: Hoboken, NJ, USA, 2009; ISBN 978-0-471-74493-1. [Google Scholar]
  30. Augsburger, M.S.; Juri, M.A.; Pedregosa, J.C.; Mercader, R.C. Crystal Data and Spectroscopic Studies of NaNiFe2(AsO4)3. J. Solid State Chem. 1992, 101, 66–70. [Google Scholar] [CrossRef]
  31. Frost, R.L.; Čejka, J.; Sejkora, J.; Plášil, J.; Bahfenne, S.; Palmer, S.J. Raman Microscopy of the Mixite Mineral BiCu6(AsO4)3(OH)6·3H2O from the Czech Republic. J. Raman Spectrosc. 2009, 41, 566–570. [Google Scholar] [CrossRef]
  32. Khorari, S.; Rulmont, A.; Cahay, R.; Tarte, P. Structure of the Complex Arsenates NaCa2M2+2(AsO4)3 (M2+ = Mg, Ni, Co): First Experimental Evidence of a Garnet-Alluaudite Reversible Polymorphism. J. Solid State Chem. 1995, 118, 267–273. [Google Scholar] [CrossRef]
  33. Khorari, S.; Rulmont, A.; Tarte, P. Alluaudite-Like Structure of the Arsenate Na3In2(AsO4)3. J. Solid State Chem. 1997, 134, 31–37. [Google Scholar] [CrossRef]
  34. Kawabe, Y.; Yabuuchi, N.; Kajiyama, M.; Fukuhara, N.; Inamasu, T.; Okuyama, R.; Nakai, I.; Komaba, S. Synthesis and Electrode Performance of Carbon Coated Na2FePO4F for Rechargeable Na Batteries. Electrochem. Commun. 2011, 13, 1225–1228. [Google Scholar] [CrossRef]
  35. Rajah, F.; Graia, M.; Mhiri, T. Synthesis, Crystal Structure, and Characterization of Na7Cu4(AsO4)5. Phosphorus Sulfur Silicon Relat. Elem. 2013, 188, 1244–1253. [Google Scholar] [CrossRef]
  36. Priestner, M.; Singer, G.; Weil, M.; Kremer, R.K.; Libowitzky, E. Synthesis, Structural, Magnetic and Thermal Properties of Mn2As2O5, the First Pyro-Arsenite of a First-Row Transition Metal. J. Solid State Chem. 2019, 277, 209–215. [Google Scholar] [CrossRef]
  37. Behera, B.; Nayak, P.; Choudhary, R.N.P. Impedance Spectroscopy Study of NaBa2V5O15 Ceramic. J. Alloys Compd. 2007, 436, 226–232. [Google Scholar] [CrossRef]
  38. Costa, M.M.; Pires, G.F.M.; Terezo, A.J.; Graa, M.P.F.; Sombra, A.S.B. Impedance and Modulus Studies of Magnetic Ceramic Oxide Ba2Co2Fe12O22(Co2Y) Doped with Bi2O3. J. Appl. Phys. 2011, 110, 034107. [Google Scholar] [CrossRef]
  39. Sohn, R.S.T.M.; Macêdo, A.A.M.; Costa, M.M.; Mazzetto, S.E.; Sombra, A.S.B. Studies of the Structural and Electrical Properties of Lithium Ferrite (LiFe5O8). Phys. Scr. 2010, 82, 055702. [Google Scholar] [CrossRef]
  40. Kumar, A.; Singh, B.P.; Choudhary, R.N.P.; Thakur, A.K. Characterization of Electrical Properties of Pb-Modified BaSnO3 Using Impedance Spectroscopy. Mater. Chem. Phys. 2006, 99, 150–159. [Google Scholar] [CrossRef]
  41. Lily; Kumari, K.; Prasad, K.; Choudhary, R.N.P. Impedance Spectroscopy of (Na0.5Bi0.5)(Zr0.25Ti0.75)O3 Lead-Free Ceramic. J. Alloys Compd. 2008, 453, 325–331. [Google Scholar] [CrossRef]
  42. Lu, W.; Jiang, S.; Zhou, D.; Gong, S. Structural and Electrical Properties of Ba(Sn,Sb)O3 Electroceramics Materials. Sens. Actuators A 2000, 80, 35–37. [Google Scholar] [CrossRef]
  43. Iben Nassar, K.; Rammeh, N.; Teixeira, S.S.; Graça, M.P.F. Physical Properties, Complex Impedance, and Electrical Conductivity of Double Perovskite LaBa0.5Ag0.5FeMnO6. J. Electron. Mater. 2022, 51, 370–377. [Google Scholar] [CrossRef]
Figure 1. Rietveld plot of the powder X-ray diffraction pattern of (a) Na1.5MnII3MnIII0.5(AsO4)3 and (b) Na1.5MnII3FeIII0.5(AsO4)3 samples.
Crystals 13 01251 g001
Figure 2. The anionic three-dimensional network formed by octahedral MIIO6 and MIIIO6.
Crystals 13 01251 g002
Figure 3. Projection of the structure (a) showing tunnels according to the a-axis, (b) showing cavities according to the c-direction.
Crystals 13 01251 g003
Figure 4. Infrared analysis spectra of compounds (I) and (II).
Crystals 13 01251 g004
Figure 5. Raman analysis spectra of compounds (I) and (II).
Crystals 13 01251 g005
Figure 6. TG-DTA curves of (a) Na1.5MnII3MnIII0.5(AsO4)3 and (b) Na1.5MnII3FeIII0.5(AsO4)3 samples.
Crystals 13 01251 g006
Figure 7. SEM micrographs (left figures) and magnifications (right figures) of samples: (a) material (I) and (b) material (II).
Crystals 13 01251 g007
Figure 8. (a) Migration paths of Na+ cations in (I) at Emig = 0.901 eV; (b) Migration paths of Na+ cations in (II) at Emig = 0.865 eV.
Crystals 13 01251 g008
Figure 9. Traveled distance variation of Na (1) as a function of migration energy: (a) in (I), (b) in (II).
Crystals 13 01251 g009
Figure 10. The frequency dependence of the real (Z′) part of the complex electrical impedance at several measurement temperatures for (a) sNa1.5Mn2+3Mn3+0.5(AsO4)3 and (b) Na1.5Mn2+3Fe3+0.5(AsO4)3.
Crystals 13 01251 g010
Figure 11. The frequency dependence of the imaginary (Z″) part of the complex electrical impedance at several measurement temperatures of (a) for Na1.5MnIII3MnII0.5(AsO4)3 and (b) Na1.5MnII3FeIII0.5(AsO4)3.
Crystals 13 01251 g011
Figure 12. Frequency dependence of the real part of electric modulus (a) for Na1.5Mn2+3Mn3+0.5(AsO4)3 and (b) for Na1.5Mn2+3Fe3+0.5(AsO4)3 at different temperatures.
Crystals 13 01251 g012
Figure 13. Frequency dependence of the imaginary part of electric modulus for (a) Na1.5MnII3MnIII0.5(AsO4)3 and (b) Na1.5MnII3FeIII0.5(AsO4)3 at different temperatures.
Crystals 13 01251 g013
Figure 14. Frequency dependence of the AC conductivity for (a) Na1.5MnII3MnIII0.5(AsO4)3 and (b) Na1.5MnII3FeIII0.5(AsO4)3 at different temperatures.
Crystals 13 01251 g014
Table 1. Data collection conditions of Na1.5MnII3MnIII0.5(AsO4)3 and Na1.5MnII3FeIII0.5(AsO4)3.
Crystal Data
FormulaNa1.5MnII3MnIII0.5(AsO4)3Na1.5MnII3FeIII0.5(AsO4)3
Molar mass (g/mol)643.53643.98
Cristal system, S.G, ZMonoclinic, P21/c, 4
a, b, c (Å) ;
β (°)
6.78344 (9), 12.93830 (15), 11.22825 (19); 98.5374 (19)6.76723 (12), 12.9864 (3), 11.256; 98.8636 (13)
V (Å3)974.54 (2)977.46 (4)
Dx (g·cm−3)4.3864.376
Radiation; λ (Å)Cu Kα (1.54059)
Data Collection
Temperature (K)298(2)
DiffractometerD8 Bruker
Reflection number46131190
2θ (°)5.028–64.9845–80
Refinement Results
R p 0.0220.083
R w p 0.0290.105
R e x p 0.0250.088
R(F²)0.044070.05682
χ 2 1.4641.440
Table 2. Fractional atomic coordinates, isotropic or equivalent isotropic displacement parameters (Å 2), and Wyckoff positions of material (I).
AtomxyzUiso*/UeqWyckoff Positions
As10.5824 (3)0.11275 (14)0.22827 (18)0.0277 (6)*4 e
As20.8817 (3)0.39458 (14)0.26305 (18)0.0313 (6)*4 e
As30.2272 (3)0.28982 (14)−0.01591 (18)0.0114 (6)*4 e
Mn10.4139 (3)0.35341 (14)0.26964 (18)0.0216 (6)*4 e
Mn20.7199 (3)0.23080 (14)0.49625 (18)0.0092 (6)*4 e
Mn30.50.00.50.0491 (6)*2 d
Mn40.0827 (3)0.16419 (14)0.20656 (18)0.0217 (6)*4 e
Na10.7403 (3)−0.01431 (14)0.00492 (18)0.0139 (6)*4 e
Na20.00.50.00.0084 (6)*2 c
O10.5503 (3)0.00107 (14)0.15914 (18)0.0787 (6)*4 e
O20.7718 (3)0.17622 (14)0.17308 (18)0.0301 (6)*4 e
O30.6496 (3)0.09540 (14)0.37900 (18)0.0835 (6)*4 e
O40.3917 (3)0.18877 (14)0.19837 (18)0.0217 (6)*4 e
O50.0884 (3)0.33029 (14)0.26194 (18)0.0381 (6)*4 e
O60.2138 (3)−0.08500 (14)0.38092 (18)0.0405 (6)*4 e
O70.0582 (3)0.00566 (14)0.15275 (18)0.0405 (6)*4 e
O80.7251 (3)0.34213 (14)0.35173 (18)0.0746 (6)*4 e
O90.4129 (3)0.21657 (14)−0.04974 (18)0.0217 (6)*4 e
O100.1149 (3)0.12330 (14)0.37710 (18)0.0884 (6)*4 e
O110.3420 (3)0.38209 (14)0.07948 (18)0.0217 (6)*4 e
O120.0472 (3)0.21869 (14)0.04507 (18)0.0242 (6)*4 e
Table 3. Fractional atomic coordinates, isotropic or equivalent isotropic displacement parameters (Å 2), and Wyckoff positions of material (II).
AtomxyzUiso*/UeqWyckoff Positions
As10.5977 (4)0.1126 (6)0.2306 (6)0.0084 (6)4 e
As20.890 (1)0.3943 (5)0.2631 (5)0.0228 (5)4 e
As30.2385 (2)0.2885 (5)−0.0033 (1)0.0138 (1)4 e
Mn10.4150 (3)0.3469 (3)0.2808 (1)0.0043 (1)4 e
Mn20.7426 (2)0.2310 (1)0.4986 (2)0.0117 (1)4 e
Fe30.500.50.075252 d
Mn40.0797 (8)0.1575 (5)0.20960.0168 (9)4 e
Na10.7676 (2)−0.0130 (3)−0.0003 (6)0.00944 e
Na200.500.049982 c
O10.5563 (4)0.0035 (5)0.1576 (7)0.0502 (4)4 e
O20.75590.1705 (6)0.1537 (4)0.0816 (5)4 e
O30.6380 (5)0.0966 (1)0.3870.0184 (6)4 e
O40.4055 (6)0.1882 (8)0.2151 (4)0.00924 e
O50.0942 (6)0.3214 (8)0.2731 (1)0.0336 (5)4 e
O60.2627 (7)−0.0861 (9)0.3781 (4)0.0636 (7)4 e
O70.0497 (3)−0.0014 (5)0.1586 (2)0.0086 (9)4 e
O80.7278 (9)0.3342 (5)0.3435 (9)0.003 (2)4 e
O90.4240 (7)0.2137 (9)−0.0331 (4)0.0242 (6)4 e
O100.1413 (9)0.1352 (8)0.3901 (8)0.0089 (4)4 e
O110.3623 (9)0.3826 (7)0.0789 (7)0.0991 (6)4 e
O120.0632 (9)0.2151 (9)0.0513 (6)0.0015 (2)4 e
Table 4. CHARDI and BVS analysis for cations in Na1.5MnII3MnIII0.5(AsO4)3. Notes: q(i) = formal oxidation number; Q(i) = computed charge; sof(i) = site occupation factor; CNs = coordination number; ECoN(i) = number of effective coordination.
BVS AnalysisCHARDI Analysis
Cationq(i).sof(i)Q(i)CN(i)ECoN(i)
Na111.0255.03
Na211.0165.53
As15.004.9943.92
As25.005.2143.92
As35.004.8343.95
Mn12.001.8765.81
Mn22.002.0265.81
Mn33.002.7465.29
Mn42.002.1865.43
Table 5. CHARDI and BVS analysis for cations in Na1.5MnII3FeIII0.5(AsO4)3. Notes: q(i) = formal oxidation number; Q(i) = computed charge; sof(i) = site occupation factor; CNs = coordination number; ECoN(i) = number of effective coordination.
BVS AnalysisCHARDI Analysis
Cationq(i).sof(i)Q(i)CN(i)ECoN(i)
Na110.9155.18
Na211.0466.39
As15.004.9843.87
As25.005.0243.86
As35.004.9243.94
Fe3.003.1965.72
Mn12.001.9465.88
Mn22.001.8865.85
Mn32.002.2265.28
Table 6. M(II)-O and M(III) example distances encountered in weilleytes and alliaudites.
FormulaS.GM(II)-O (Å)M(III)-O (Å)Ref.
Na1.5Mn3Fe0.5(AsO4)3P21/c1.959 (5)–2.256 (6)1.973 (2)–2.040 (3)*
Na1.265MnII2.690MnIII0.785(PO4)31.893 (2)–2.334 (2)2.171 (6)–2.648 (5)[25]
Na1.5Mn3Mn0.5(AsO4)31.9270 (1)–2.341 (4)2.193 (2)–2.4489 (19)*
Na1.25Co2.187Al1.125(AsO4)31.928–2.1512.170–2.184[12]
Na2Fe2IIAl(PO4)32.089–2.2251.973[7]
Ag1.09Mn3.46(AsO4)32.105 (4)–2.413 (5)1.915 (5)–2.186 (6)[10]
Na0.5K0.65Mn3.43(AsO4)32.113 (5)–2.46 (5)1.954 (5)–2.178 (6)[11]
NaMnII2.5FeIII0.5 Al0.5(PO4)3P21/n2.103–2.2451.956–2.025[8]
K1.5Ni3 Fe0.5(PO4)3C2/c2.0153 (14)–2.2241 (13)2.016 (2)–2.0490 (13)[28]
Na1.72Mn3.28(AsO4)32.218 (9)–2.360 (8)1.990 (12)–2.193 (11)[26]
* This work
Table 7. FTIR vibration frequencies (cm−1) attributed to AsO4 tetrahedrons and M-O bonds of some arsenates found in the literature. * This work.
CompoundValence VibrationsDeformationVibration M-ORef.
ν1ν3ν2ν4
(AsO4)(III)837878349463-[29]
Na0.5K0.65Mn3.43(AsO4)3822880-443564; 420; 669[11]
BiCu6(AsO4)3(OH)6.3H2O848814; 797390; 311553; 529; 494-[30]
NaNiFe2(AsO4)3860; 901820; 789; 700447496; 474 [31]
NaCa2Mg2(AsO4)3950; 750550; 300-[32]
Na3In2(AsO4)3866934342398 [33]
Na1.5MnII3MnIII0.5(AsO4)3820; 750861-456; 426538; 581*
Na1.5MnII3FeIII0.5(AsO4)3825; 889767-436; 371583*
Table 8. Raman vibration frequencies (cm−1) attributed to AsO4 tetrahedrons and M-O bonds of some arsenates found in the literature (s= symmetric, as = asymmetric).
Compoundν1
s
ν3
as
ν2
s
ν4
as
ν5 M(III)ν5 M(II)Ref.
Na1.5Fe0.5Mn3(AsO4)3854–848–8161000417–496578–569(Fe) 374(Mn)
256–206
*
Na1.5Mn3.5(AsO4)3838–867–759899403–475529–580(Mn)
358–313
(Mn)
230–192
*
Na7Cu4(AsO4)5813–880902480–485511–527(Cu)
403
334
-[35]
Mn2As2O5820 900440580 - [36]
* This work.
Table 9. EDS semi-quantification results for the elementary atomic percentages.
MaterialNa1.5MnII3MnIII0.5(AsO4)3Na1.5MnII3FeIII0.5(AsO4)3
ElementExperimentalTheoreticalExperimentalTheoretical
Manganese20.27%17.5%16.75%15%
Arsenic16.34%15%17.28%15%
Silicon1.38%---
Sodium9.33%7.5%8.42%7.5%
Oxygen52.67%60%54.55%60%
Iron--3%2.5%
Disclaimer/Publisher’s Note: The statements, opinions and data contained in all publications are solely those of the individual author(s) and contributor(s) and not of MDPI and/or the editor(s). MDPI and/or the editor(s) disclaim responsibility for any injury to people or property resulting from any ideas, methods, instructions or products referred to in the content.

