Article

Phase Structure and Electrical Properties of 0.28PIN-0.32PZN–(0.4-x) PT-xPZ Piezoelectric Ceramics

1
State Key Laboratory of Solidification Technology, School of Materials, Northwestern Polytechnical University, Xi’an 710072, China
2
The No. 771 Institute, China Aerospace Science and Technology Corporation, Xi’an 710065, China
*
Authors to whom correspondence should be addressed.
Crystals 2023, 13(9), 1362; https://doi.org/10.3390/cryst13091362
Submission received: 11 August 2023 / Revised: 1 September 2023 / Accepted: 8 September 2023 / Published: 10 September 2023
(This article belongs to the Special Issue Research Progress of Perovskite Ferroelectric Materials)

Abstract

:
Piezoelectric constant and Curie temperature are two important parameters of piezoelectric materials, but currently most piezoelectric materials have the problem of obtaining both high piezoelectric coefficient and Curie temperature. In this work, quaternary piezoelectric ceramics of 0.28Pb(In1/2Nb1/2)O3-0.32Pb(Zn1/3Nb2/3)O3–(0.4-x)PbTiO3-xPbZrO3 (x = 0~0.25) were designed and prepared by a solid-phase method, and the phase structure, dielectric, piezoelectric and ferroelectric properties of 0.28PIN-0.32PZN-(0.4-x)PT-xPZ piezoelectric ceramics were investigated by regulating the Zr/Ti ratio. The results show that the selected compositions are located in the MPB region, and the ceramic samples of each component display high density, the piezoelectric constant (d33) and the electromechanical coupling coefficient (kp) increase and then decrease with the increase of x. The optimum piezoelectric properties are found in compositions at x = 0.1, which showed a high piezoelectric coefficient d33 of 450 pC/N and high Curie temperature Tc of 272 °C. It is promising for use in high-temperature piezoelectric transducers.

1. Introduction

Piezoelectric materials are widely used in transducers [1,2], actuators [3] and piezoelectric sensors [4] due to their excellent electrical properties, and how to enhance the electrical properties of piezoelectric materials has caused extensive concern. It has been found that, in conventional lead zirconate titanate (PZT) piezoelectric ceramics [5], the performance of piezoelectric ceramics can be effectively improved when the components are in the vicinity of the morphotropic phase boundary (MPB), where the tripartite and tetragonal phases coexist, and thus the multiplexed piezoelectric ceramics based on the MPB have attracted a deep interest. Finding the MPB of PZT by adding ferroelectrics with various perovskite structures to it became the main method to obtain high-performance piezoelectric ceramics. Lead niobium-magnesate Pb(Mg1/3Nb2/3)O3 (PMN) [6], lead niobium-nickelate Pb(Ni1/3Nb2/3)O3 (PNN) [7], lead niobium-zincate Pb(Zn1/3Nb2/3)O3(PZN) [8], lead niobium-ferrite Pb(Fe1/2Nb1/2)O3 (PFN) [9] and lead antimony-manganate Pb(Mn1/3Sb2/3)O3(PMS) [10], etc. and PZT form a ternary or even quaternary piezoelectric ceramic solid solution system, the MPB is also extended from a definite point to a line or even a surface with a certain area, which can be adjusted to a larger range of the component so as to obtain a multifaceted piezoelectric ceramic materials with comprehensive and superior performance. Wang et al. [11] investigated PIN-PMN-PT ternary polycrystalline ceramics and found that the MPB composition with the best performance was 0.36PIN-0.30PMN-0.34PT, with a dielectric constant (εr) of 2970, a piezoelectric constant (d33) of 450 pC/N, a planar electromechanical coupling coefficient (kp) of 0.49 and a Curie temperature (Tc) of 245 °C. Wu et al. [12] optimized the ternary Pb(In1/2Nb1/2)O3-Pb(Mg1/3Nb2/3)O3-PbTiO3 and obtained a quasi-isotropic phase boundary material component by adjusting the content of PIN, which gave the piezoelectric properties of the material as d33 = 505 pC/N when the content of PIN was 0.16, but the Curie temperature was only 199 °C. In addition to lead-based piezoelectric ceramics, lead-free piezoelectric ceramics have also been widely studied and achieved good results. The BNT-BT ceramic prepared by Hussain et al. [13] achieved the best piezoelectric performance when doped with 0.15 Mn, with d33 at 211 pC/N and Tc at 335 °C. The KNN ceramic studied by Jiang et al. [14] not only has a d33 of 340 pC/N, but also has a Curie temperature of 317 °C. Although the performance of some lead-free piezoelectric ceramics can already be comparable to traditional lead-based piezoelectric ceramics, there are still some difficult problems to solve, such as difficulty in sintering, poor repeatability, unstable piezoelectric performance and high cost. Lead-based piezoelectric ceramics have advantages such as low cost, good performance and stable performance. The commercial production of lead-free piezoelectric ceramics in a short period of time still faces certain difficulties. Therefore, our research still focuses on lead-based piezoelectric ceramics.
Researchers have shown that the piezoelectric constants (d33) of most of the current multicomponent system piezoelectric ceramics are in the range of 300–800 pC/N, and the Curie temperatures (Tc) are in the range of 100–350 °C. It is common that there is a difficulty in combining high Curie temperatures and high piezoelectric constants, which limits their applications in high-temperature fields.
In the composite perovskite structure material system, the Curie temperature of Pb(Mg1/3Nb2/3)O3 is −12 °C, and the Curie temperature of Pb(Zn1/3Nb2/3)O3 is 140 °C. If the PMN in the PIN-PMN-PT material is replaced by the PZN with a higher Curie temperature and PbZrO3 is added to regulate the composition of the MPB, then multi- piezoelectric ceramics combing high Curie temperature and high piezoelectric performance are expected. Therefore, in this work, 0.28Pb(In1/2Nb1/2)O3-0.32Pb(Zn1/3Nb2/3)O3-(0.4-x)PbTiO3-xPbZrO3(PIN-PZN-PZT)tetrahedral piezoelectric ceramic materials are designed and the effect of PbZrO3 content on the microstructure and electrical properties of the materials are investigated. The aim of this study is to pave the way to obtaining piezoelectric ceramic with high Curie temperature and high piezoelectric coefficient.

2. Experimental Procedure

The composition was 0.28Pb(In1/2Nb1/2)O3-0.32Pb(Zn1/3Nb2/3)O3-(0.4-x)PbTiO3-xPbZrO3 (referred as PIZZT), where x took the values of 0, 0.05, 0.1, 0.15, 0.2 and 0.25, and the samples were labeled sequentially as 0 PZ, 0.05 PZ, 0.1 PZ, 0.15 PZ, 0.2 PZ and 0.25 PZ. Ceramic samples were prepared by a two-step solid phase method. PbO(AR), ZnO(CP), Nb2O5(AR), In2O3(AR), ZrO2(AR) and TiO2(AR) were used as raw materials. Firstly, ZnNb2O6 and InNbO4 precursors were prepared by calcining ZnO, Nb2O5 and In2O3 at 1000 °C and 1100 °C for 6 h. The prepared ZnNb2O6 and InNbO4 were mixed with PbO, ZrO2 and TiO2 for ball milling for 24 h. After drying, the mixture was calcined at 850 °C for 4 h, and then there was a second ball milling procedure for 24 h. The obtained powders were subjected to uniaxial compression at a pressure of 100 MPa in a steel mold with a size of Ф12 mm × 1 mm. The green bodies were placed into an alumina crucible and sintered at 1100–1200 °C 2 h. Sintered ceramics were polished and coated with silver electrodes. The samples were poled at 120 °C for 30 min under an electric field of 3 kV/mm in silicone oil. The piezoelectric properties were measured after 24 h of aging at room temperature.
The density of the piezoelectric ceramics was measured by Archimedes’ method and the phase structure of the ceramics was analyzed by X-ray diffractometry (Panalytical, Cu Kα1 Radiation) in the 2θ range from 20° to 60°. The microstructure of the ceramics was studied by scanning electron microscopy (SEM, Gemini SEM 500, Carl Zeiss, Aalen, Germany). Dielectric constant (εr) and dielectric loss (tanδ) were measured using an LCR analyzer (HP 4284A, Hewlett-Packard, Palo Alto, Santa Clara, CA, USA). The piezoelectric constant (d33) was measured using a quasi-static d33 tester (CAS ZJ-3A, China). The electromechanical coupling factor (kp) and the electromechanical quality factor (Qm) were determined by the resonance and anti-resonance technique using a precise impedance analyzer (Model HP4294A, Hewlett-Packard, San Jose, CA, USA). Hysteresis loops, current-voltage curves (I-V) and strain–electric field (S-E) curves of PIZZT ceramics were performed by using radiant precision workstation ferroelectric testing system (TF2000FE, Germany).

3. Results and Discussion

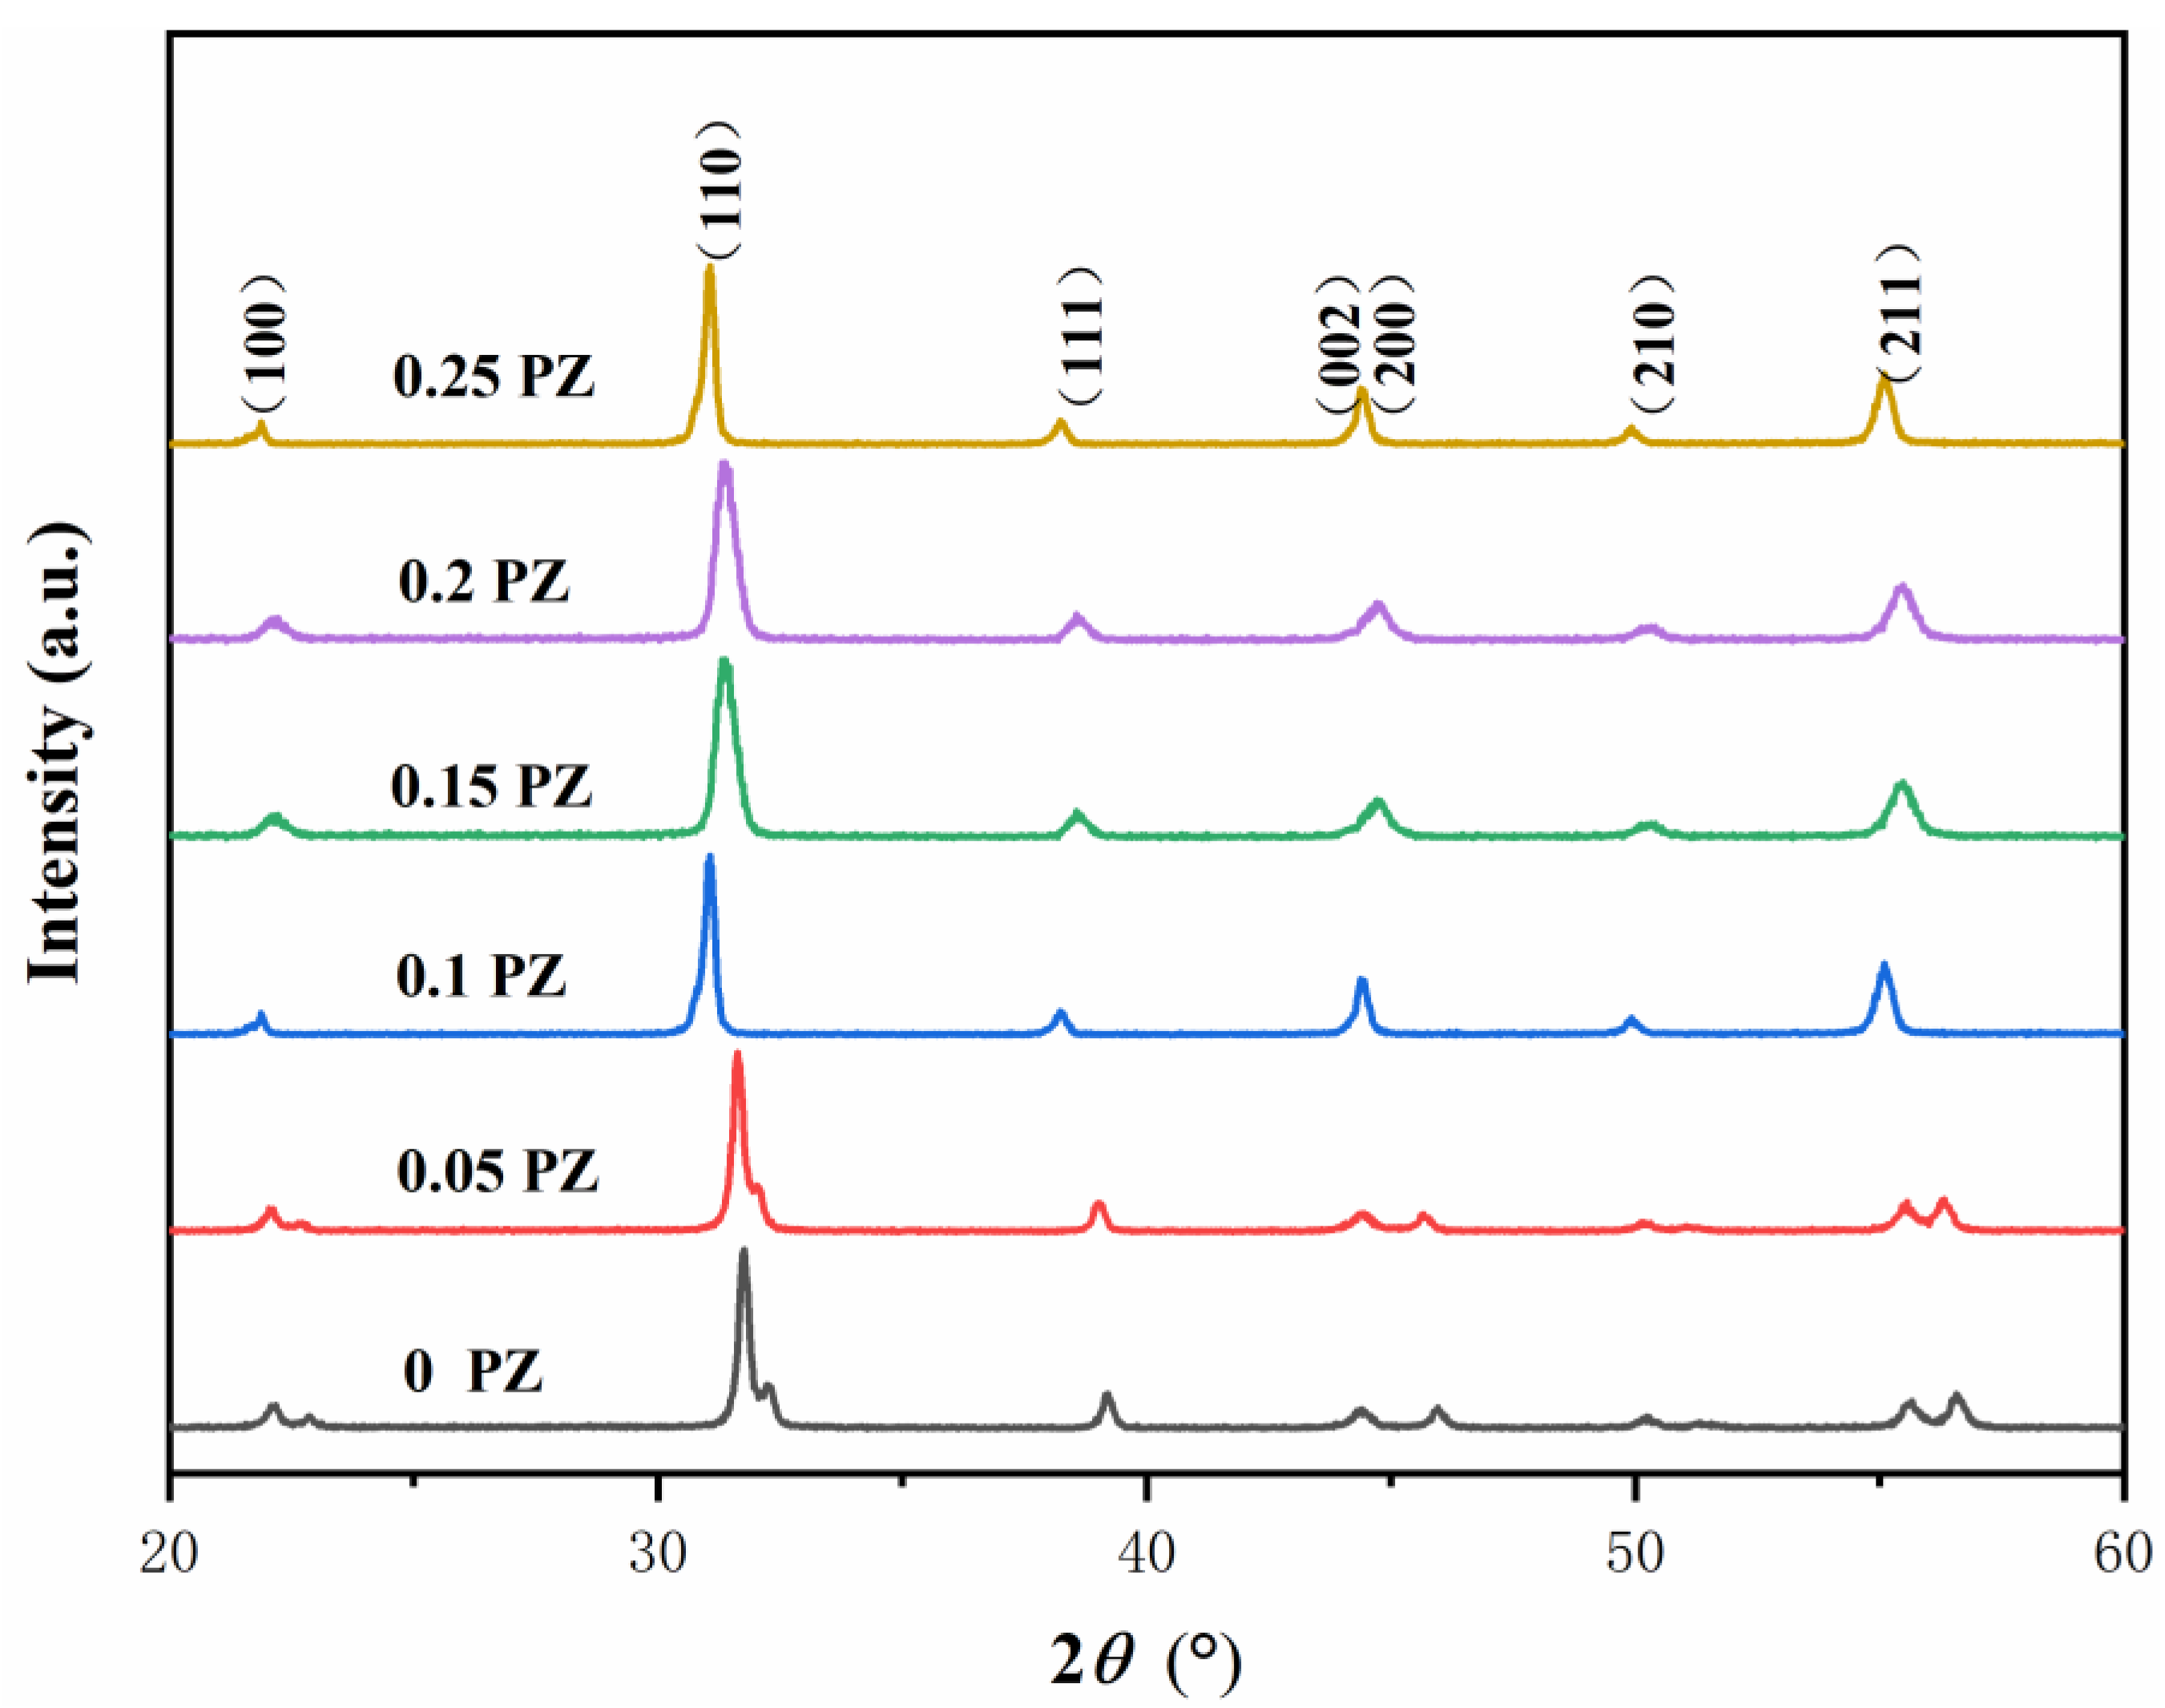
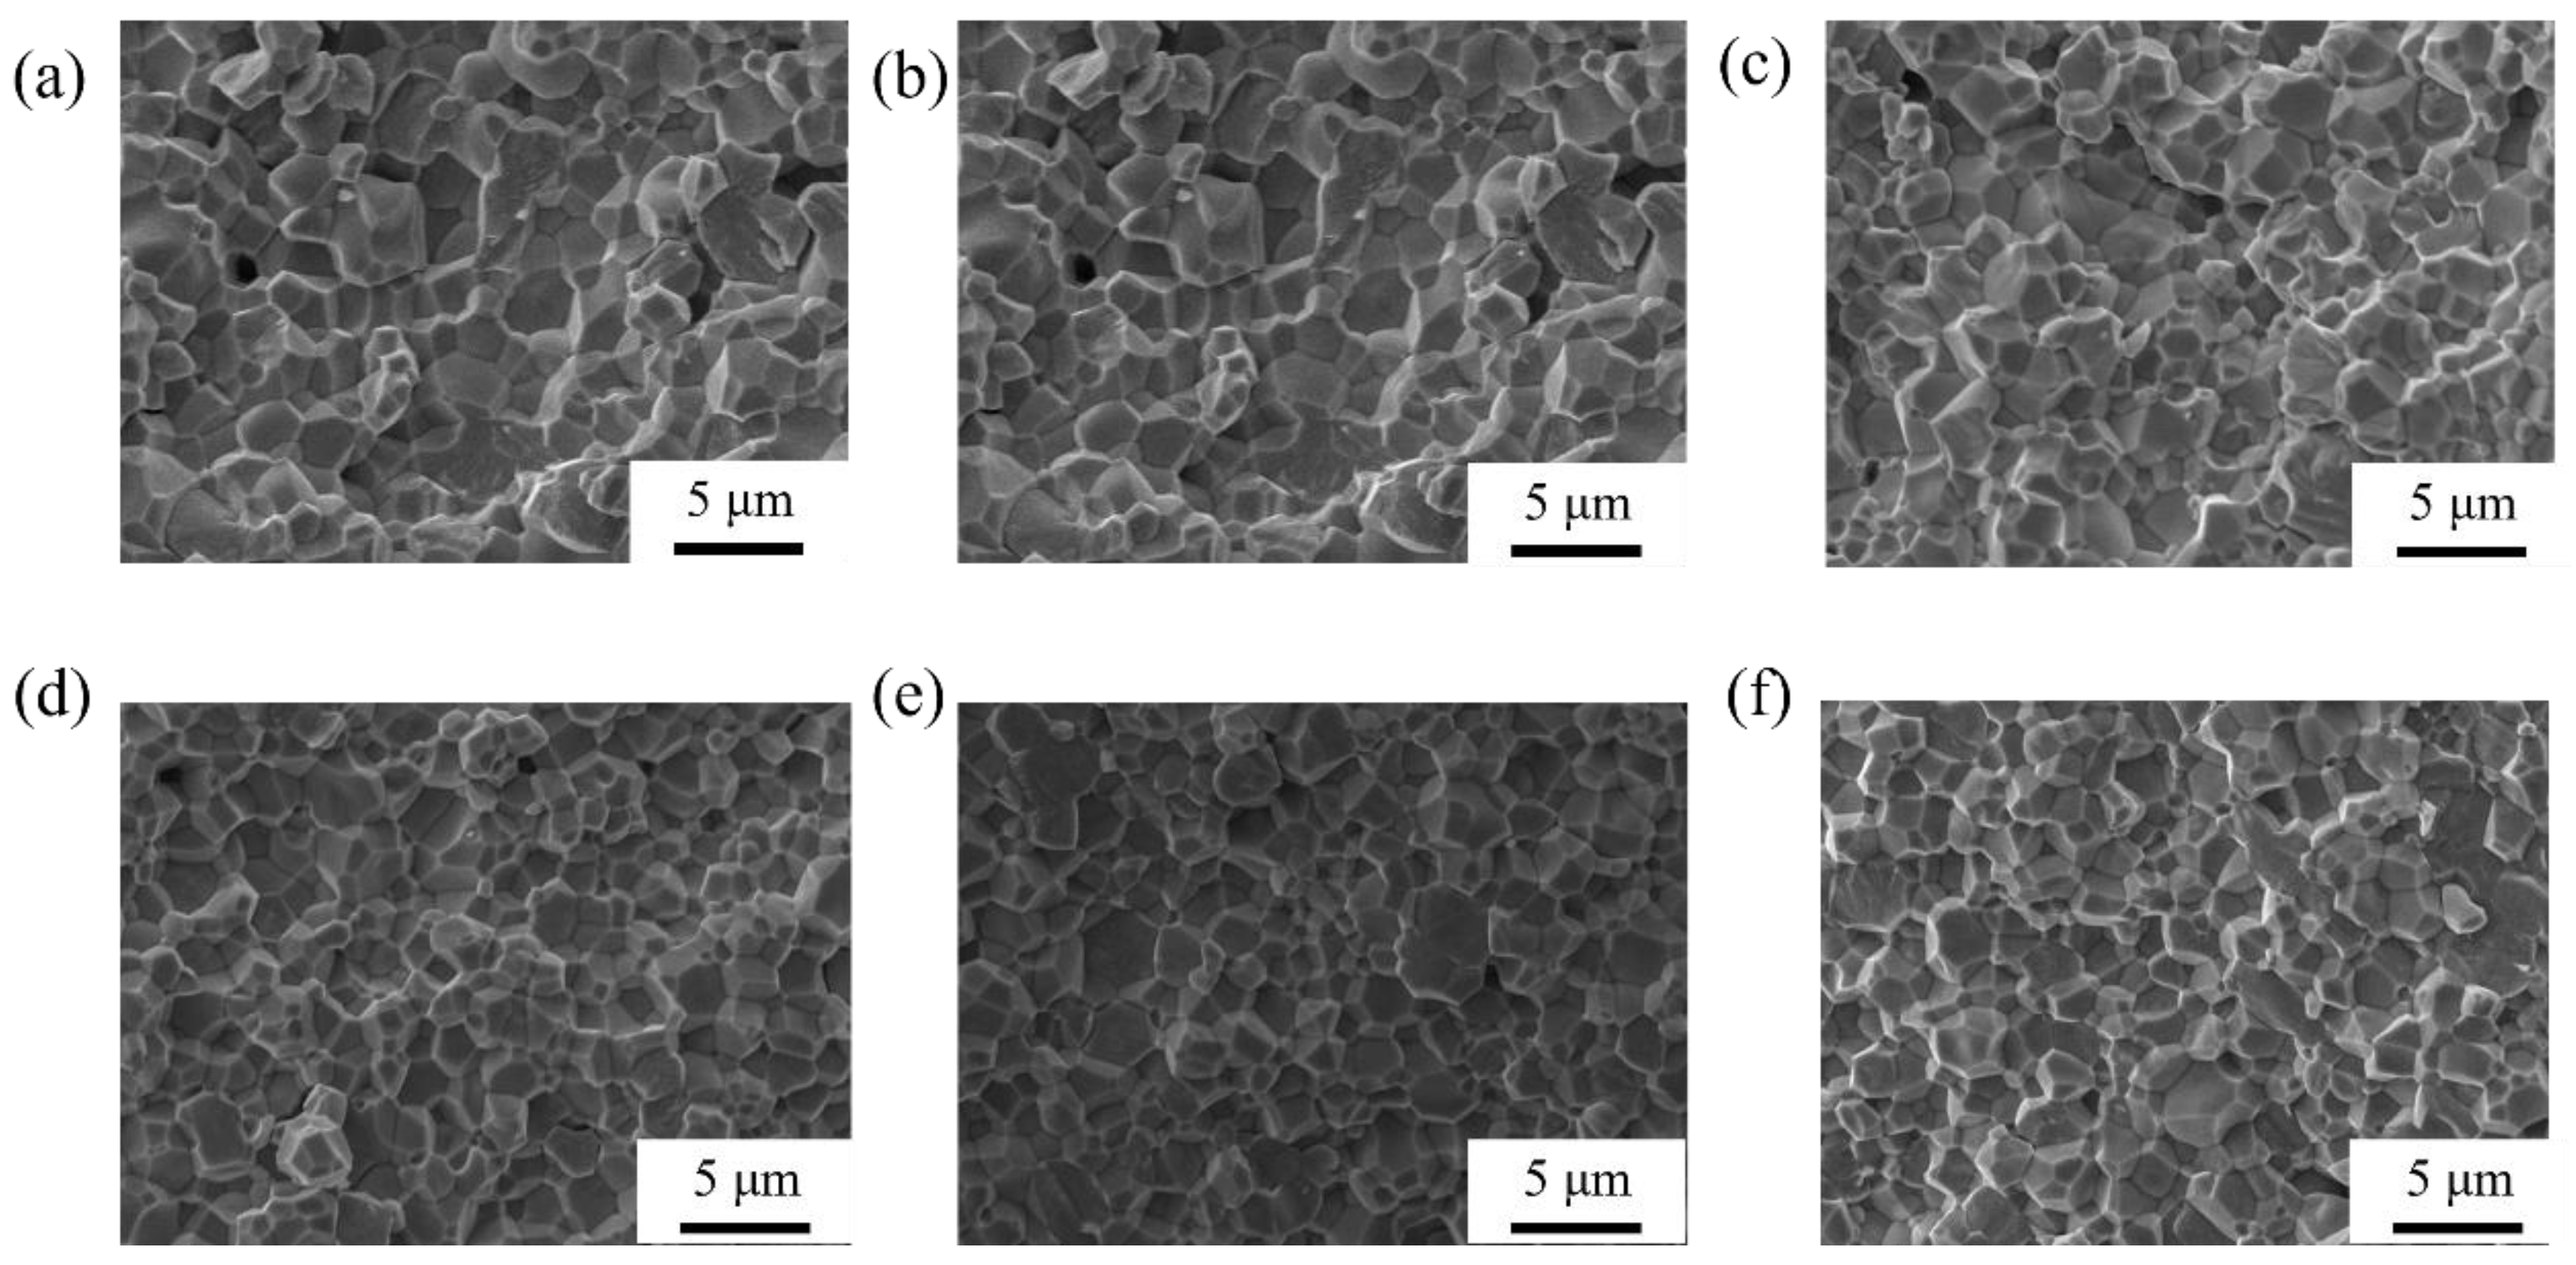
3.1. Microstructure of Ceramics

Figure 1 shows the SEM images of 0.1 PZ ceramics at different sintering temperatures. It can be clearly observed that there are many pores and poor density in the sample when the sintering temperature is 1100 °C. At 1200 °C, the sample exhibits obvious oversintering behavior with a glass-like morphology, and the grain boundaries have become unclear. When the sintering temperature is 1150 °C, the sample has good compactness and no obvious voids. Figure 2 shows the density of 0.1 PZ samples sintered at different temperatures. The results in the graph are consistent with SEM analysis. The samples have the highest density and relative density at a sintering temperature of 1150 °C, with values of 8.075 g/cm3 and 97.5%, respectively.
Figure 3 shows the XRD patterns of PIZZT piezoelectric ceramics sintered at 1150 °C, from which it is obvious that all ceramics formed a pure perovskite phase and no pyrochlore second phase was generated. As the PZ content increases, the diffraction peak gradually shifts towards a smaller angle, which is because the ion radius of Zr4+ is greater than that of Ti4+ (RZr4+ = 80 Å, RTi4+ = 68 Å). As the PZ content increases, Zr4+ increases, resulting in lattice distortion, increased crystal plane spacing and diffraction peaks shifting towards lower angles. With the increase of PZ content, the diffraction peaks of the individual samples gradually become narrower, indicating the transformation of the ceramics from the tetragonal phase to the rhombohedral phase. The shift in phase structure can generally be recognized by the change in the (200) diffraction peak at 2θ = 45°, where it can be seen that the 0 PZ is a clear double peak, while the 0.25 PZ is a single peak, and that there is a coexistence of tetragonal and rhombohedral phases in between these two components.
When analyzing the content of the two phases in the sample, the (200) diffraction peaks can be fitted into three peaks: (200)T, (200)R and (002)T, by using a Gaussian function, where (200)T and (002)T represent the characteristic peaks of the tetragonal phase, and (200)R represents the characteristic peaks of the rhombohedral phase. The relative contents of the rhombohedral and tetragonal phases can be calculated by Equation (1) [15].
T/R = [I(200)T + I(002)T]/I(200)R
The calculated results are shown in Table 1. In addition, Figure 4 shows the XRD peak fitting results of ceramic samples in the 2θ = 45° part of the spectrum; the tetragonal phase content of 0.88 and the rhombohedral phase content of 0.12 were obtained for the 0 PZ sample. It is clear that the tetragonal phase content is much larger than the rhombohedral phase. For 0.25 PZ samples, the tetragonal phase content is 0.17, the rhombohedral phase content is 0.83 and the tetragonal phase content is much smaller than that of the tetragonal phase. In the four samples of 0.05 PZ, 0.1 PZ, 0.15 PZ and 0.2 PZ, it is obvious that the tetragonal and rhombohedral phases coexist, and the content of the rhombohedral phases increases with the increase of the PZ content. It is deduced that the material composition of 0.1 PZ and 0.15 PZ is located at the morphotropic phase boundary.
Figure 5 shows the SEM images of the PIZZT ceramics. All the samples have well-grown grains, presenting an obvious equiaxial crystalline morphology, tight grain bonding with grain sizes of 1–3 μm. All samples showed high densities, more than 95% of which demonstrated that PIZZT ceramics were well sintered under 1150 °C.

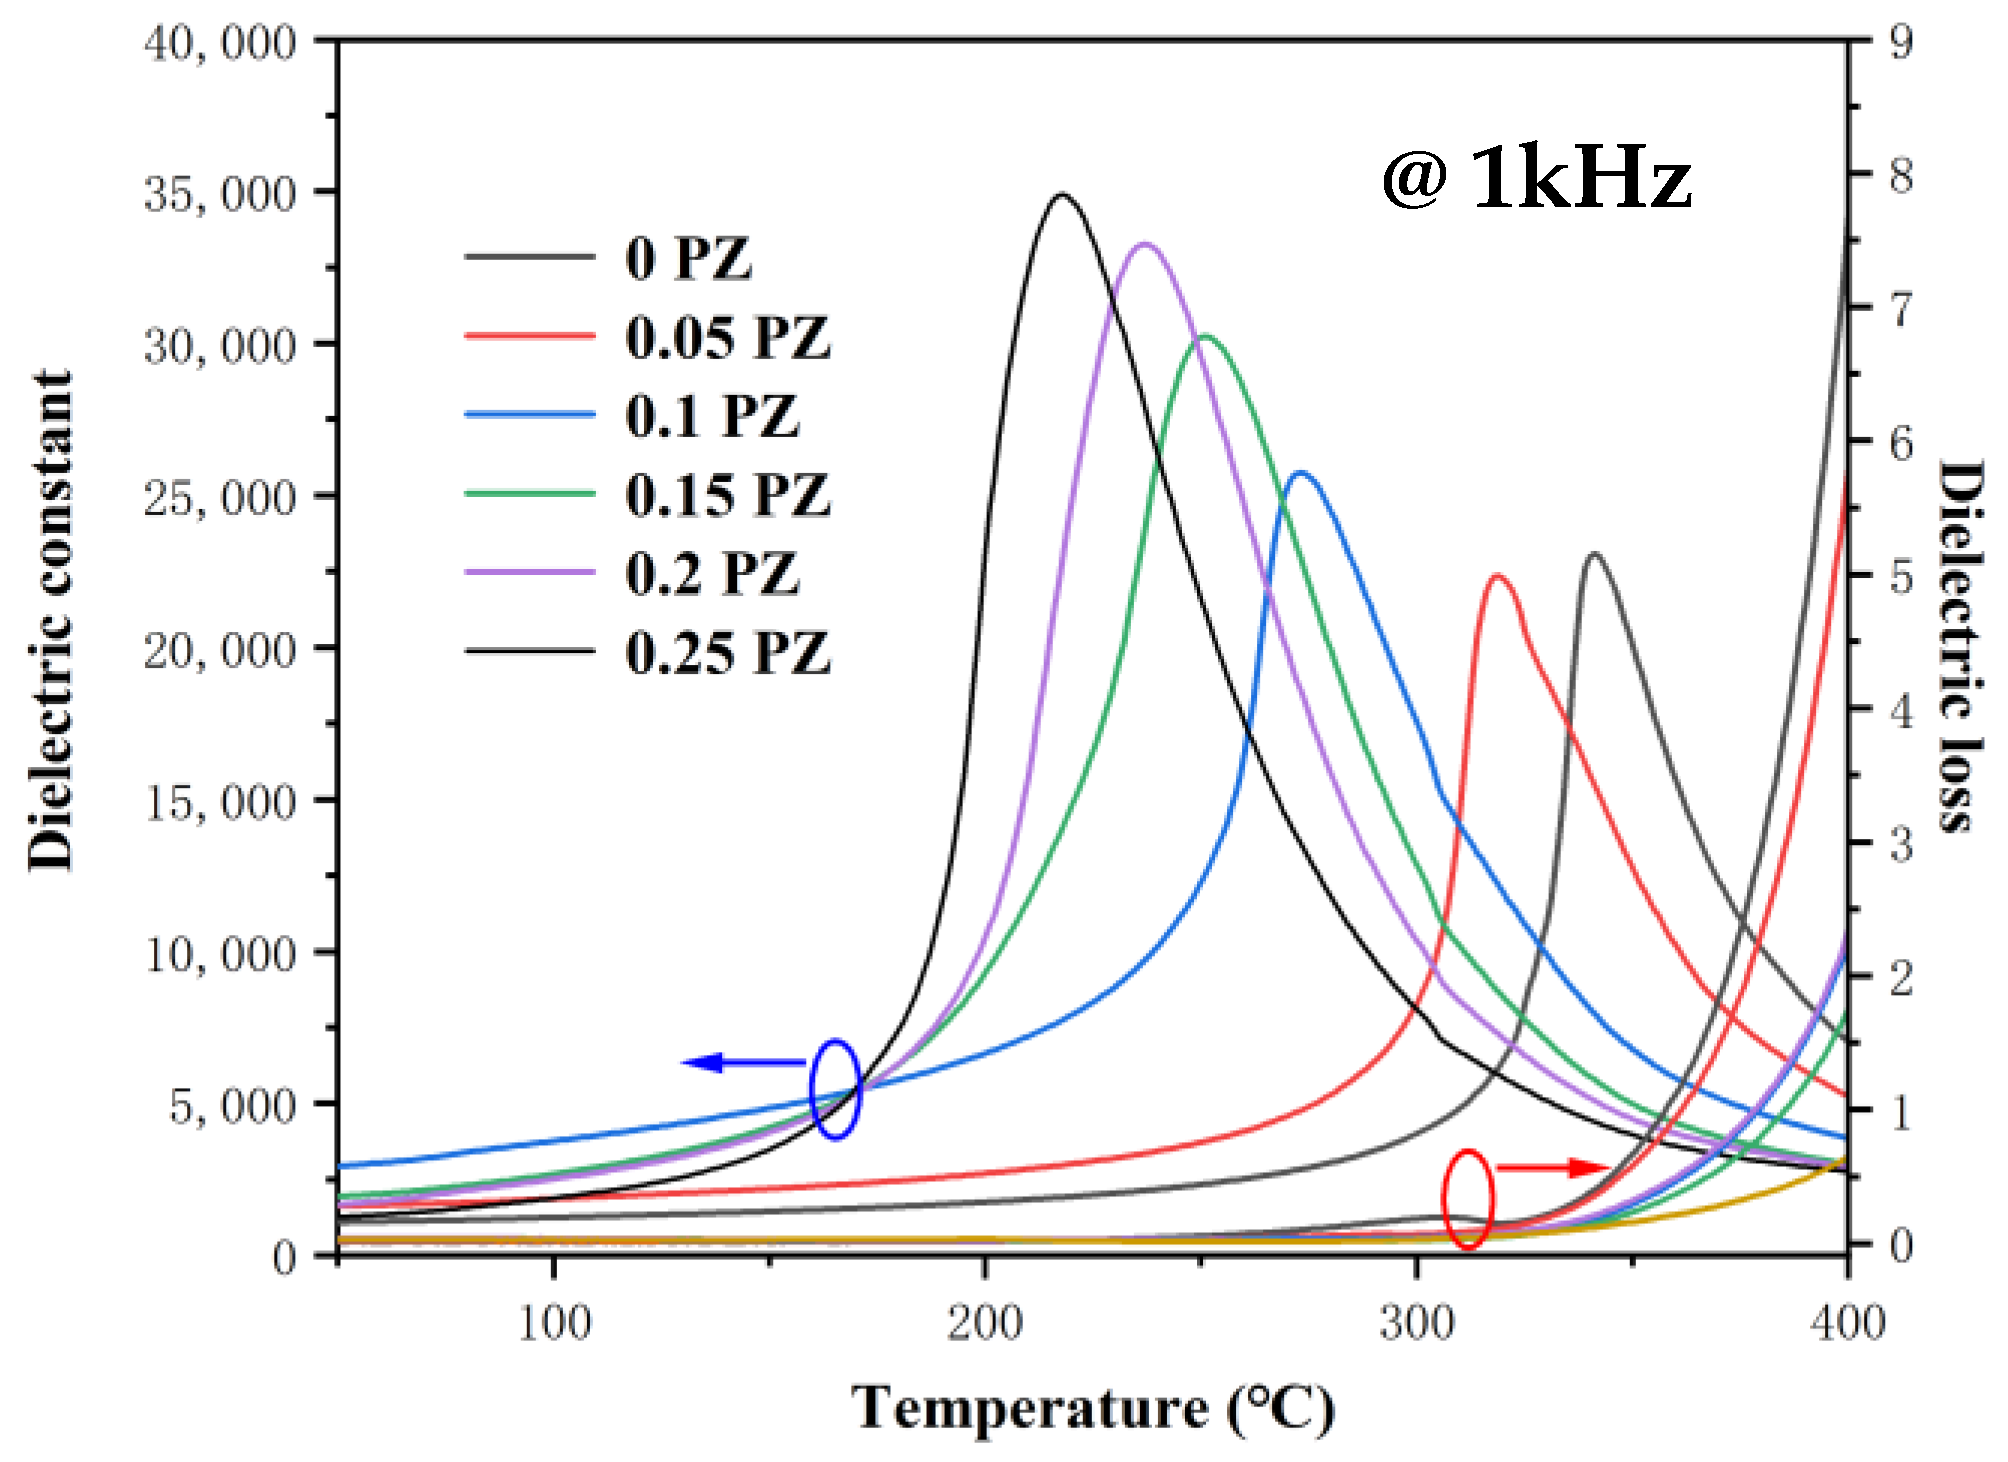
3.2. Dielectric Properties of Ceramics

Figure 6 shows the curves of the dielectric constant and loss of PIZZT piezoelectric ceramics with respect to temperature. It shows that, as the PZ content increases, the dielectric peak of the sample gradually shifts towards the low-temperature direction, and the temperature corresponding to the peak is the Curie temperature of the sample. Figure 7 shows the curie temperature (Tc) and dielectric constant of PIZZT piezoelectric ceramics with respect to the components. It shows that the Tc of piezoelectric ceramics with different components decreases with the increase of PZ content, from 320 °C to 218 °C, which is mainly due to the fact that the Curie temperature of PZ is 230 °C and that of PT is 490 °C [16]. In addition, increasing the PZ content leads to an increase in the rhombohedral phase and a decrease in the tetragonal phase, and the tetragonal phase has a clamping effect relative to the lattice phase transition. Therefore, in PZT systems, the higher the tetragonal phase content, the higher the Curie temperature. Therefore, the increase of PZ content is synchronously accompanied by a decrease in PT content, and thus the Curie temperature Tc continuously decreases. The dielectric constant of the sample increases with the increase of PZ content, reaching a maximum value of 2402 at x = 0.1, and then begins to decrease with the increase of x.
The dielectric constant and loss of PIZZT piezoelectric ceramics before and after polarization were tested and the results are shown in Figure 8. When the PZ content is less than 0.1, the dielectric constants of the 0 PZ, 0.05 PZ and 0.1 PZ ceramic samples after polarization are larger than those of the pre-polarization samples. Whereas, when the PZ content is greater than 0.15, the dielectric constants of the 0.15 PZ, 0.2 PZ and 0.25 PZ ceramic samples after polarization are smaller than those of the pre-polarization ones. This phenomenon occurs in relation to the percentage of rhombohedral and tetragonal phases in the sample. It has been shown that the crystalline phase state in which the material is located affects the change in dielectric constant before and after polarization [17,18,19], when the piezoelectric ceramic material is in a tetragonal phase structure, the dielectric constant after polarization is greater than that before polarization; when the piezoelectric ceramic material is in a rhombohedral phase structure, the dielectric constant after polarization is smaller than that before polarization. This is mainly due to the fact that the rhombohedral phase has only six possible orientations compared to the eight possible orientations for spontaneous polarization of the tetragonal phase, and thus its post-polarization samples are easier oriented under a weak electric field, with a higher permittivity after polarization than before polarization, while the opposite is true for the rhombohedral phase. The above results indicate that the tetragonal phase is dominant in the 0 PZ, 0.05 PZ and 0.1 PZ samples while the rhombohedral phase is dominant in the 0.15 PZ, 0.2 PZ and 0.25 PZ samples, which is in agreement with the results of the split-peak fitting in Figure 2, indicating that the MPB composition of the PIZZT ceramics is located in the range of x = 0.1 to 0.15.

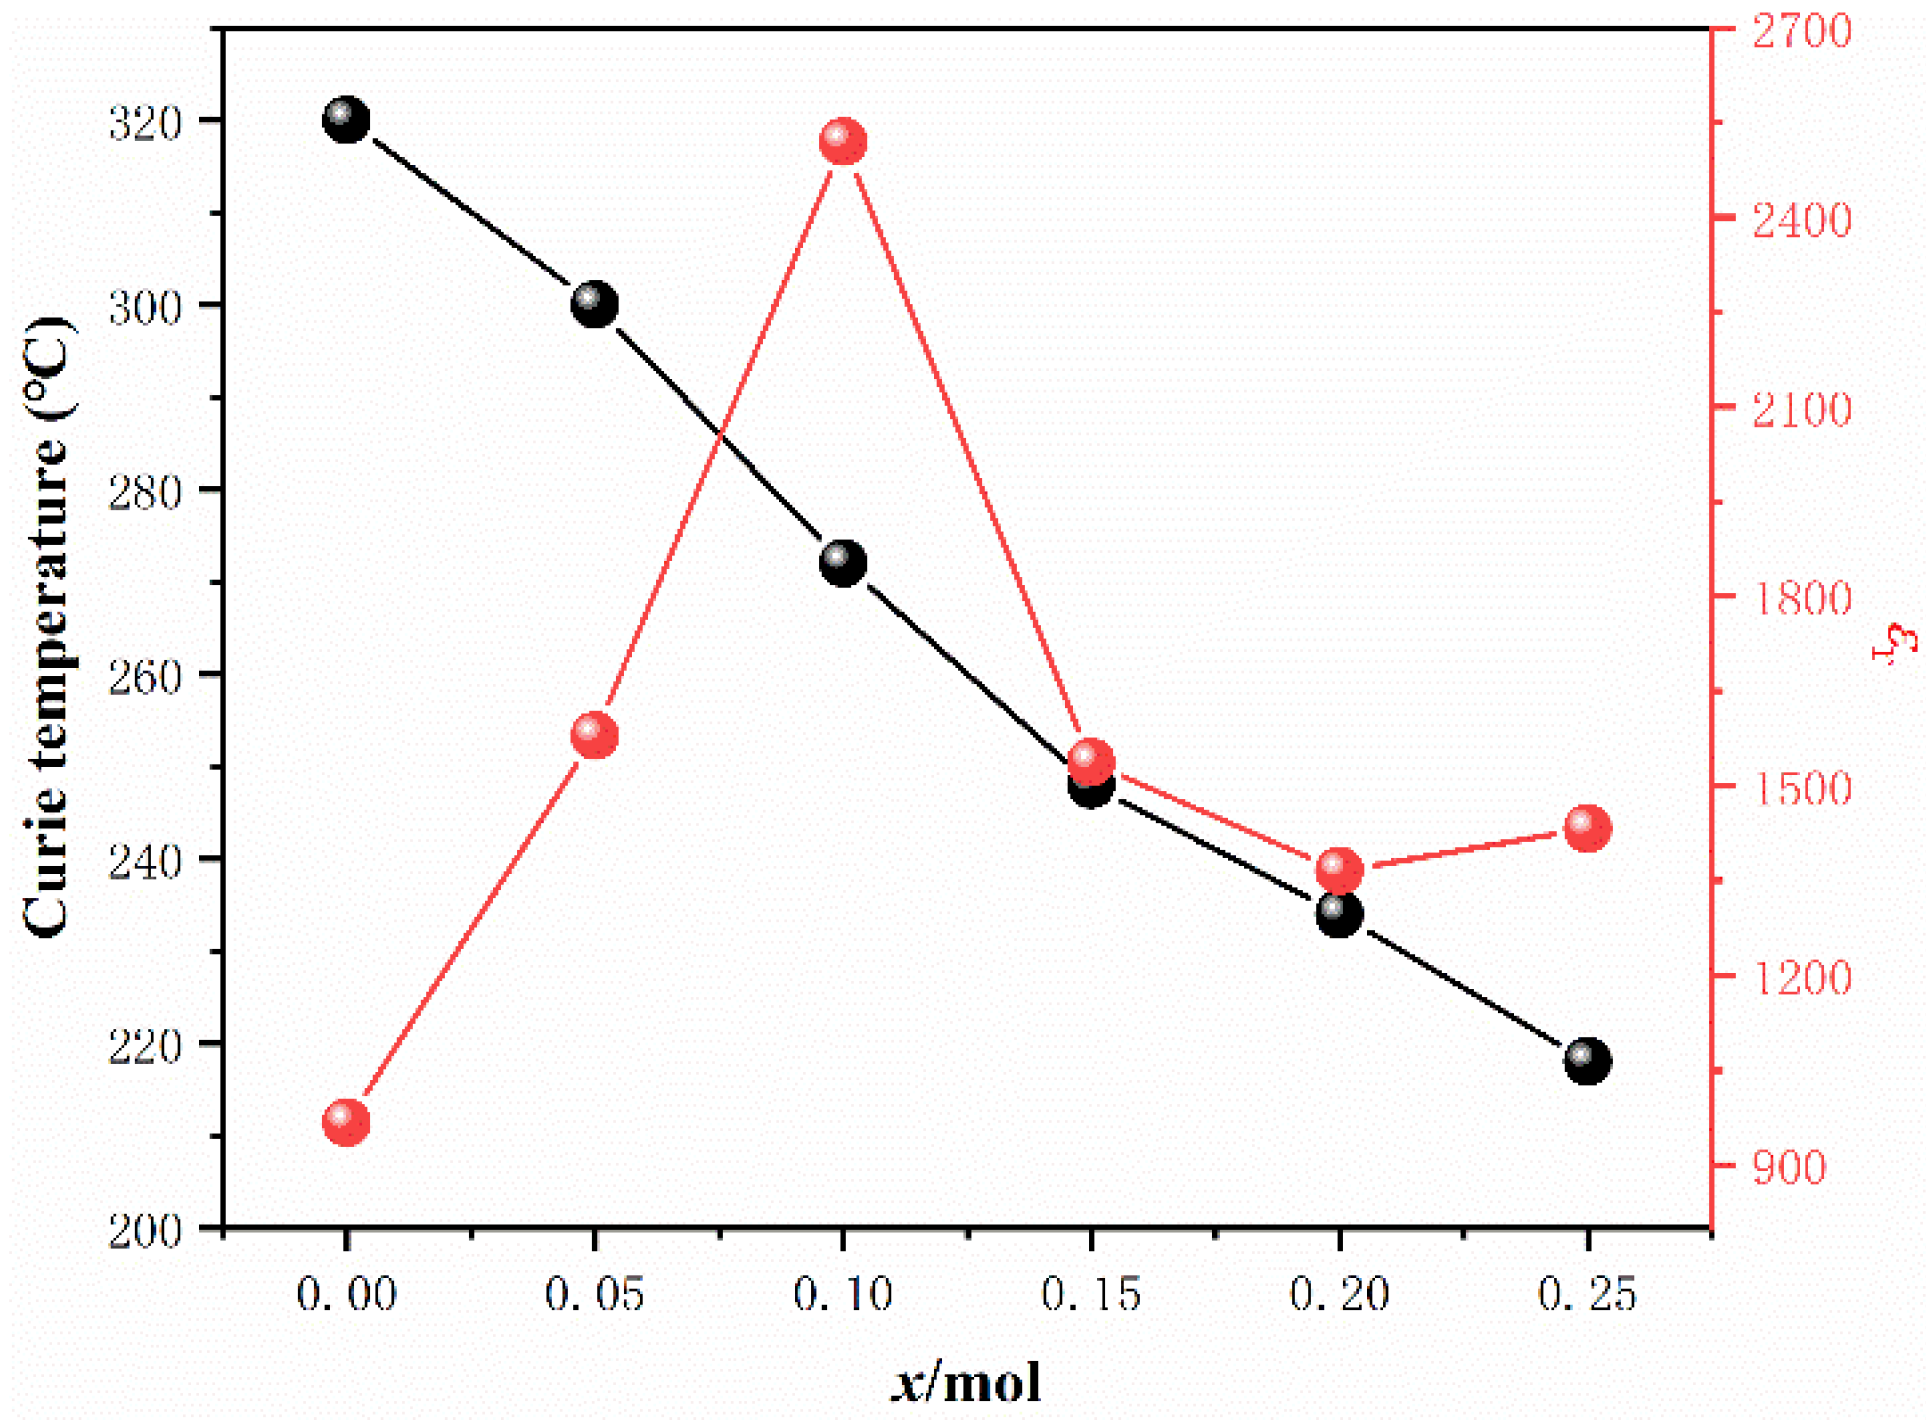
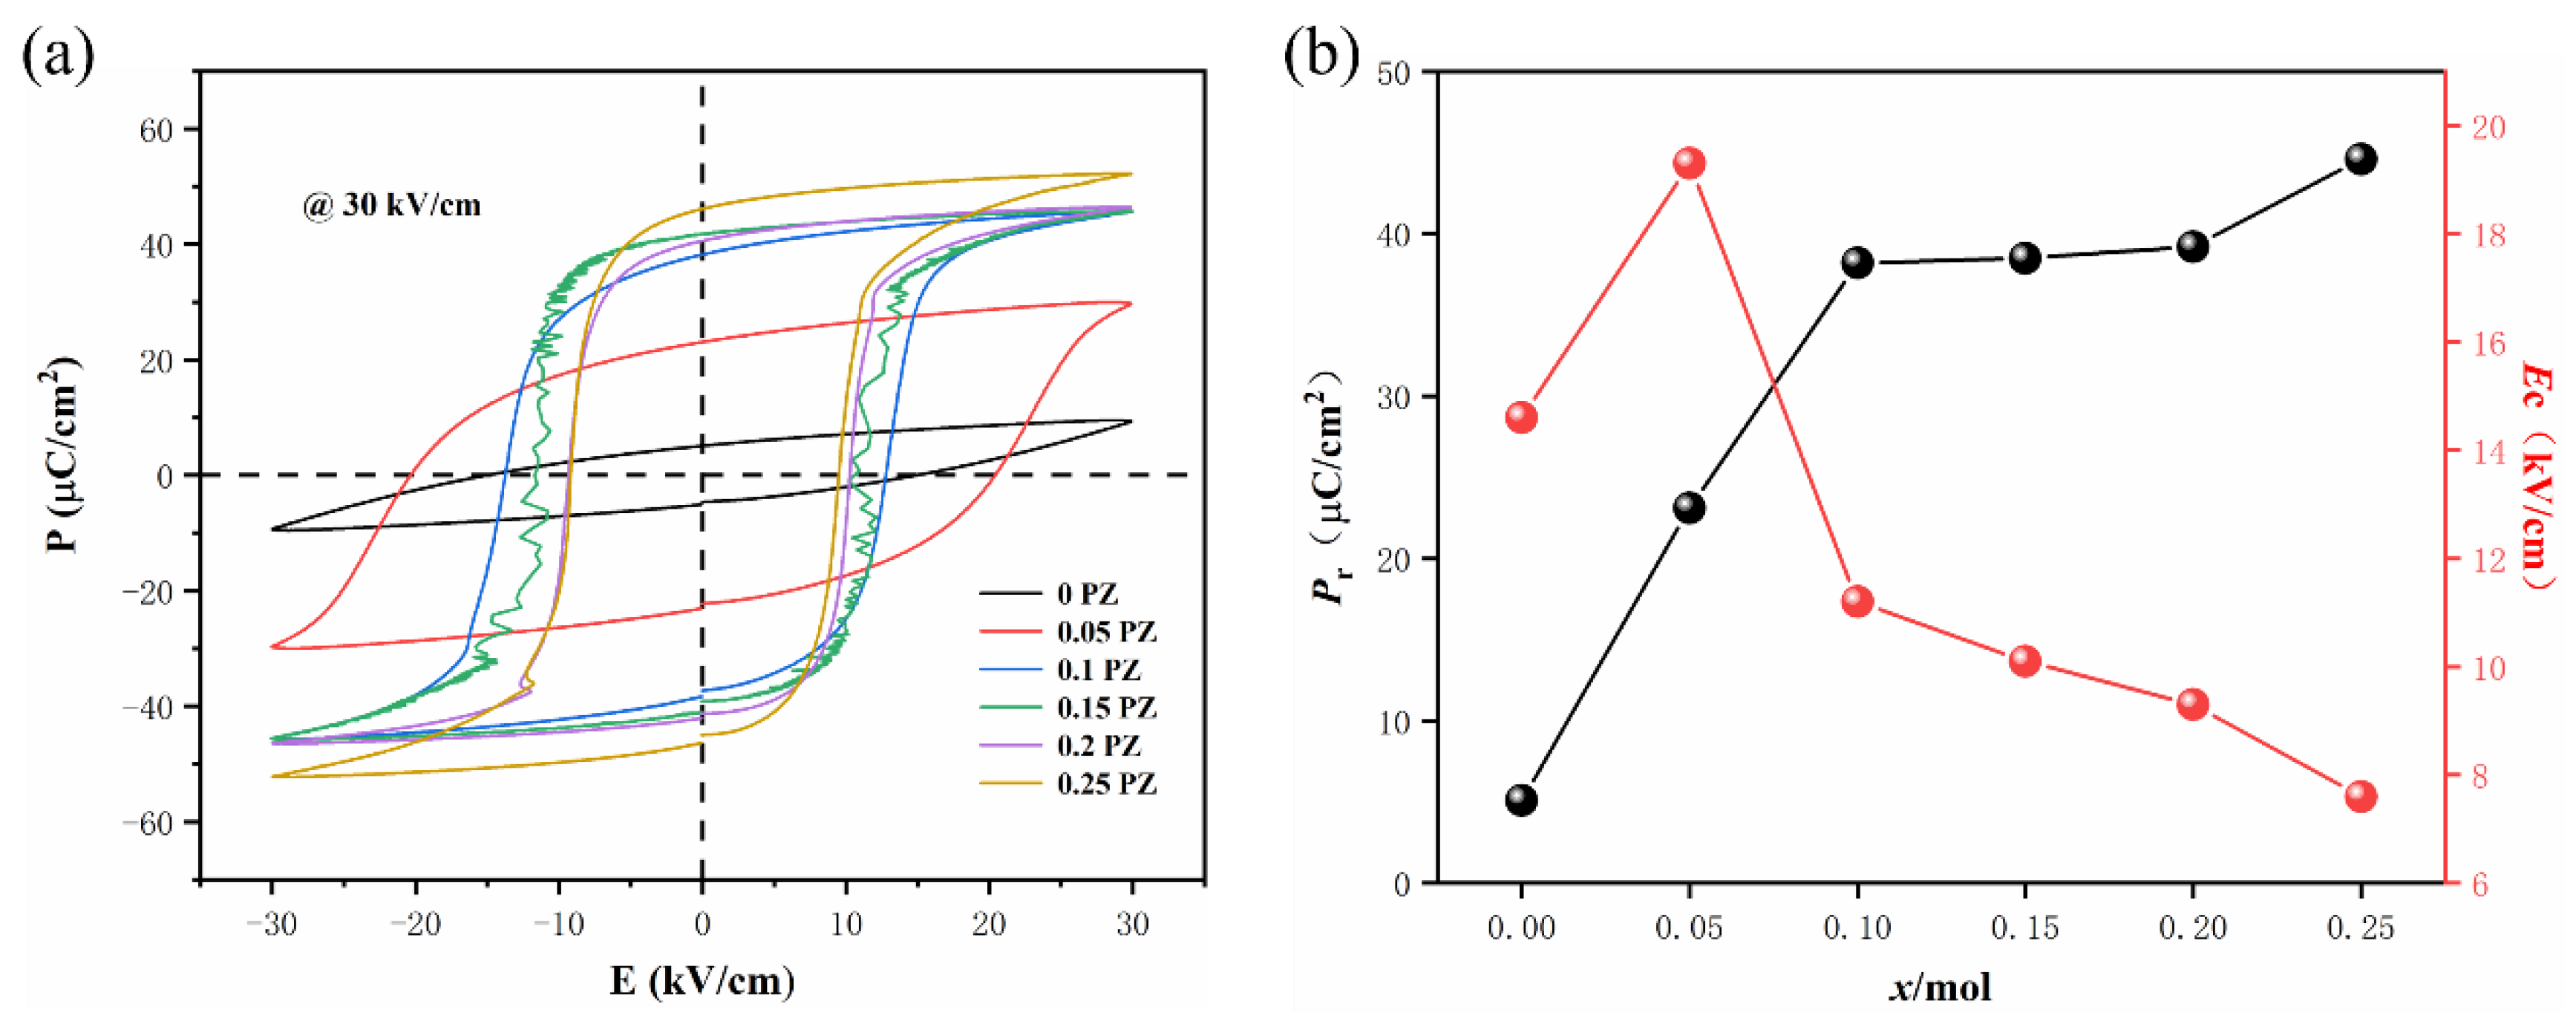
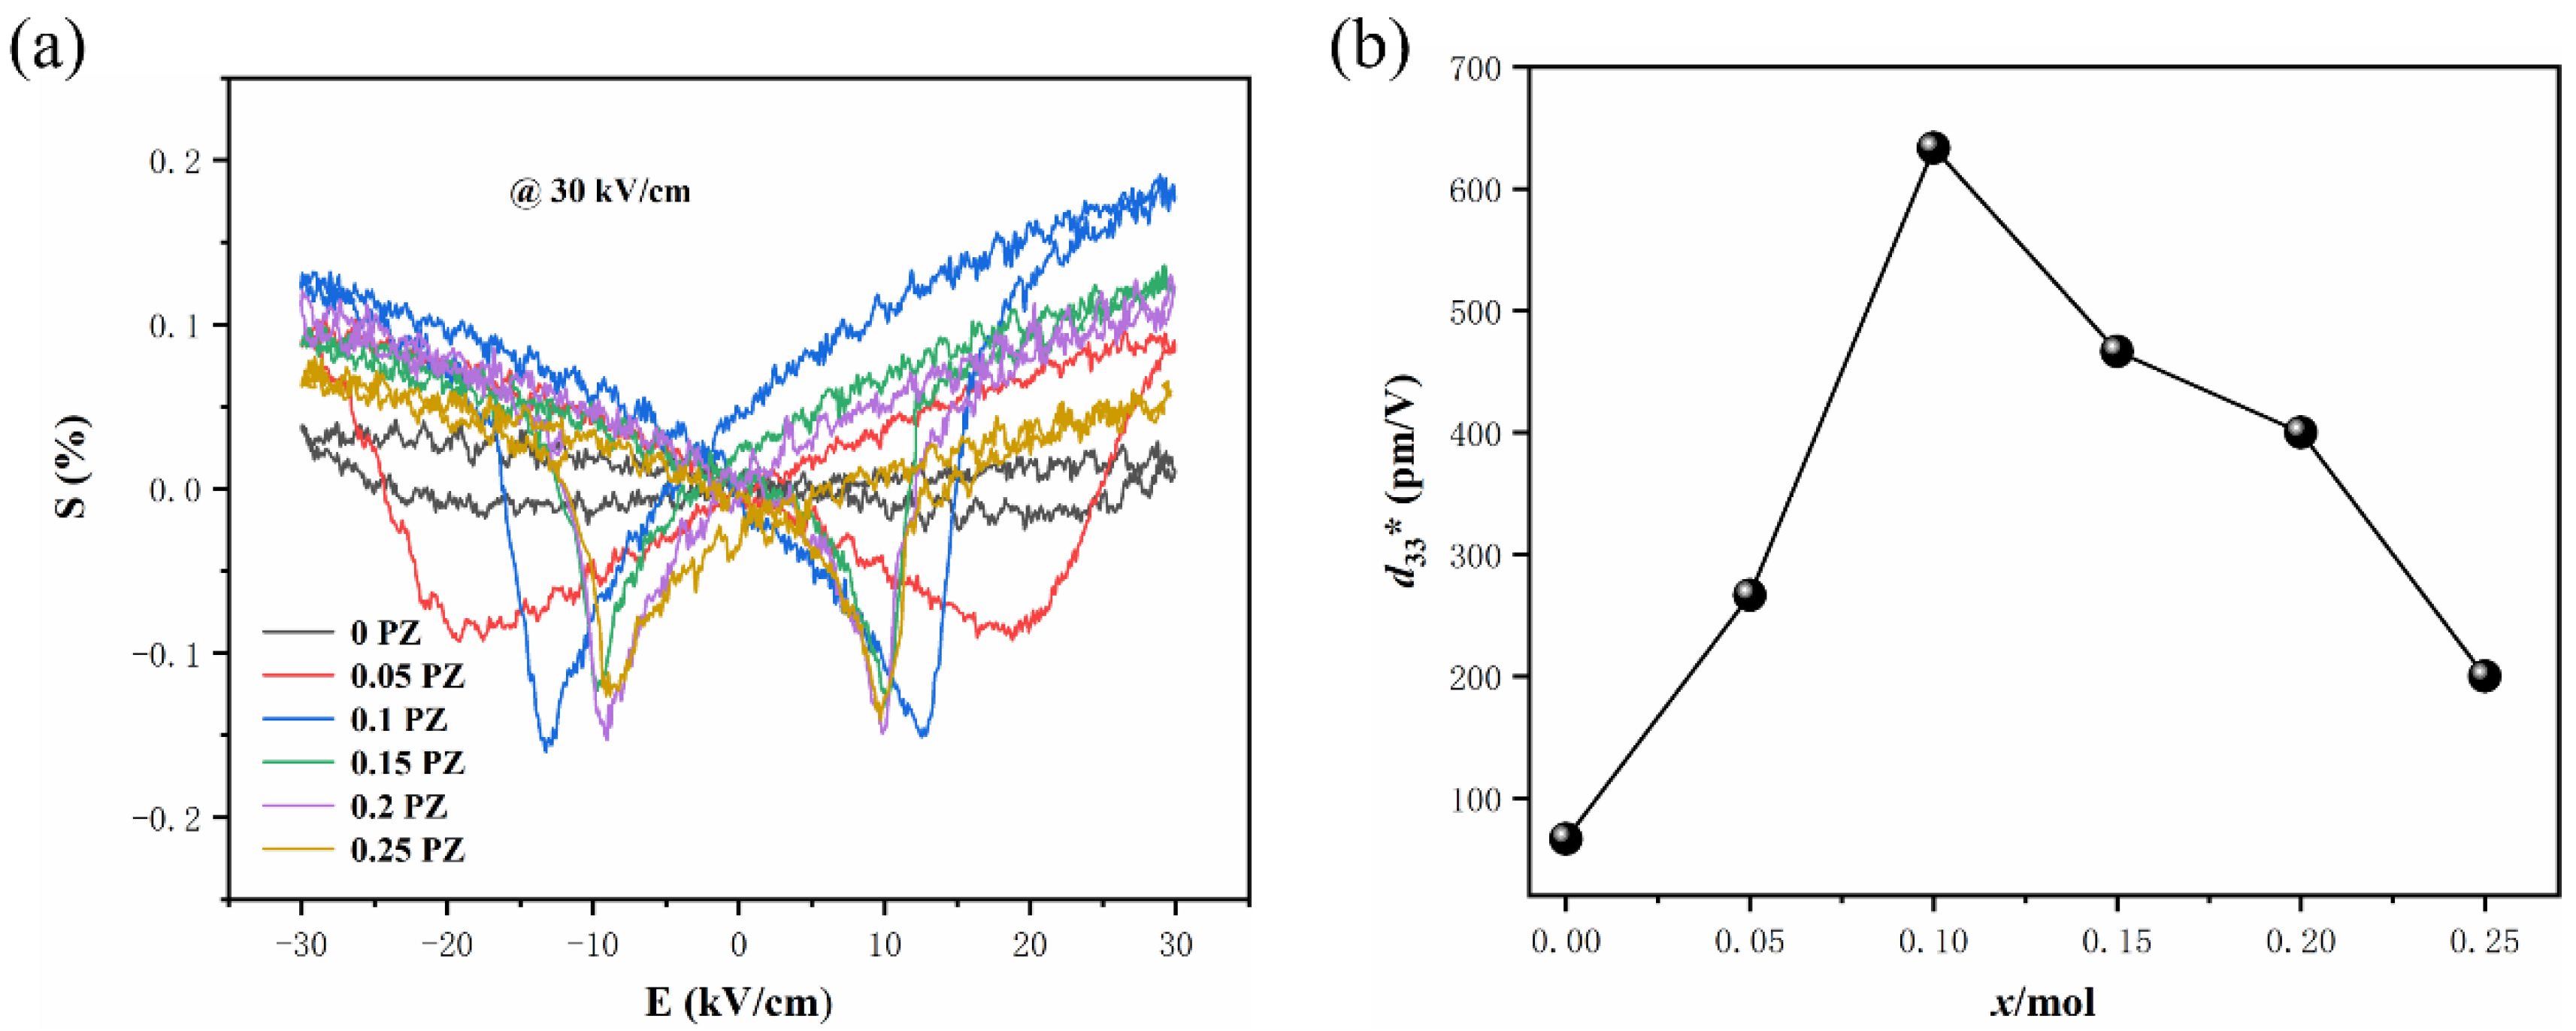
3.3. Ferroelectric and Piezoelectric Properties of Ceramics

Figure 9a shows the P-E hysteresis loops of 0.28PIN-0.32PZN-(0.4-x)PT-xPZ ceramic samples, from which it can be observed that, with the increase of the PZ content, the hysteresis loops become more and more saturated from the unsaturated state of the 0 PZ samples, and the hysteresis loops of the 0.1 PZ samples show the most saturated state. This may be due to the fact that, the higher the PZ content, the higher the proportion of the rhombohedral phase in the sample, and thus the content of the tetragonal phase decreases. Due to the increase of the rhombohedral phase and the clamping of the domain wall, a larger electric field is required to obtain a saturated ferroelectric hysteresis [20]. The relationship between the remnant polarization Pr and the coercive field Ec of the samples as a function of PZ content is shown in Figure 9b. It can be seen that the remnant polarization Pr increases with the increase of PZ content, and when the PZ content is less than 0.1, the increase of Pr is very large, from 5.1 μC/cm2 to 38.2 μC/cm2; when the PZ content is greater than 0.1, the change of Pr is very small. This is due to the fact that an increase in PZ content is accompanied by a decrease in the tetragonal phase content, which leads to a decrease in lattice distortion (c/a) and easier domain inversion in the ceramics [21].
Piezoelectric ceramics have a positive and inverse piezoelectric effect, the measurement of the electrostriction curve in piezoelectric ceramics is based on the inverse piezoelectric effect, and the electrostriction curve can reflect the inverse piezoelectric effect of the samples. The inverse piezoelectric coefficient d33* can be calculated by Equations (2) and (3):
Save = (Spos + Sneg)/2
d33* = Save/Emax
where d33* denotes the average strain per unit of electric field in picometres per volt during the cycle, Spos is the positively polarized strain, Sneg is the negatively polarized strain and Emax is the corresponding applied electric field. Figure 10a shows the S-E plots of the PIZZT ceramic samples. It can be seen that all the curves show a butterfly shape under the influence of ferroelectric domains and domain wall motion. From the figure, it is observed that the strain increases gradually with the increase of PZ content and the maximum value (0.19%) is obtained for the 0.1 PZ sample and then the strain decreases monotonically. Figure 10b shows the plot of d33* versus component for PIZZT ceramic samples. It can be seen that the maximum inverse piezoelectric coefficient d33* (633 pm/V) is obtained when the PZ content is 0.1.
Figure 11 shows the piezoelectric properties of PIZZT ceramics. It can be seen that the piezoelectric constant (d33) and the electromechanical coupling coefficient (kp) increase and then decrease with the increase of the PZ content. The 0.1 PZ sample has the maximum values, which are 450 pC/N and 0.53, respectively. The change of Qm is the opposite to that of d33 and kp, and it firstly decreases and then increases with the increase of the PZ content.
Table 2 lists the electrical properties of the 0.28PIN-0.32PZN-(0.4-x)PT-xPZ piezoelectric ceramics prepared in this work. It can be seen that, when the PZ content is 0.1, the 0.28Pb(In1/2Nb1/2)O3-0.32Pb(Zn1/3Nb2/3)O3–0.3PbTiO3-0.1PbZrO3 ceramics combine high piezoelectricity and high Curie temperature with optimal piezoelectric properties: d33 = 450 pC/N, kp = 0.53, Ɛr = 2402, tanδ = 0.015 and Tc = 272 °C.
Table 3 lists the piezoelectric properties of the reported multicomponent lead-based piezoelectric ceramics. It can be seen that, the higher the piezoelectric constant (d33) is, the lower its Curie temperature (Tc) is. Although the piezoelectric constant of the Sm-PMN-PT piezoelectric ceramics reaches as high as 1510 pC/N, its Curie temperature is only 89 °C. In recent years, with the further expansion of the application range of piezoelectric materials, new challenges have been posed to the service performance of piezoelectric ceramics in some high-temperature environments, such as the fuel injection piezoelectric valves used in internal combustion engines and the high-temperature piezoelectric acceleration sensors used in the aerospace field. These require piezoelectric ceramics to have high piezoelectric constants and high Curie temperatures. The piezoelectric ceramics prepared in this work show relatively high piezoelectric constants (d33 = 450 pC/N) accompanying high Curie temperatures (Tc = 270 °C), making them promising for application in high-temperature piezoelectric transducers.

4. Conclusions

The 0.28Pb(In1/2Nb1/2)O3-0.32Pb(Zn1/3Nb2/3)O3–(0.4-x)PbTiO3-xPbZrO3 tetragonal piezoelectric ceramics have been designed and prepared by regulating the Zr/Ti ratio, and the sample compositions are located at the morphotropic phase boundary when x = 0.1 and 0.15. The variation of dielectric constant before and after polarization shows a gradual increase in the rhombohedral phase content and a decrease in the tetragonal phase in the samples with the increase of the PZ content. The piezoelectric constant (d33) and electromechanical coupling coefficient (kp) increase first and then decrease with the increase of PZ, and the Curie temperature (Tc) decreases accordingly. The 0.28Pb(In1/2Nb1/2)O3-0.32Pb(Zn1/3Nb2/3)O3–0.3PbTiO3-0.1PbZrO3 ceramics have the optimum piezoelectric properties with d33 = 450 pC/N, kp = 0.525, Ɛr = 2402, tanδ = 0.015 and Tc = 272 °C, which combine a high piezoelectric constant and high Curie temperature and are expected to be used in high-temperature piezoelectric transducers.

Author Contributions

X.X.: Conceptualization, Methodology, Survey, Data Compilation, Formal Analysis, Writing—Original Draft. X.F. and M.L.: Methodology, Data Management, Formal Analysis. L.Z., H.W. and B.Y.: Methodology, data organization. C.C. and J.X.: Data Planning, Writing Review and Editing. H.M. and F.G.: Conception, Supervision, Funding, Writing, Review, Editing. All authors have read and agreed to the published version of the manuscript.

Funding

This work has been supported by National Natural Science Foundation of China (No. 52272123, 52072301), the National Science and Technology 173 Program of China (No. 2022-JC-JQ-JJ-0015) and the ‘111’ Project (No. B20028). We thank the Analysis and Test Center of Northwestern Polytechnical University for measuring the XRD and SEM images.

Data Availability Statement

No new data were created or analyzed in this study. Data sharing is not applicable to this article.

Conflicts of Interest

The authors declare no conflict of interest.

References

  1. Zhou, Q.; Xu, X.; Gottlieb, E.; Sun, L.; Cannata, J.; Ameri, H.; Humayun, M.; Han, P.; Shung, S. PMN–PT single crystal, high-frequency ultrasonic needle transducers for pulsed-wave Doppler application. IEEE Trans. Ultra Ferr. Freq. Cont. 2007, 54, 668–675. [Google Scholar] [CrossRef] [PubMed]
  2. Kim, K.; Hsu, D.; Ahn, B.; Kim, Y.; Barnard, D. Fabrication and comparison of PMN-PT single crystal, PZT and PZT-based 1-3 composite ultrasonic transducers for NDE applications. Ultrasonics 2010, 50, 790–797. [Google Scholar] [CrossRef] [PubMed]
  3. Hall, A.; Allahverdi, M.; Akdogan, E.; Safari, A. Piezoelectric/electrostrictive multimaterial PMN–PT monomorph actuators. J. Eur. Ceram. Soc. 2005, 25, 2991–2997. [Google Scholar] [CrossRef]
  4. Yamamoto, N.; Yamashita, Y.; Hosono, Y.; Itsumi, K. Electrical and physical properties of repoled PMN–PT single crystal sliver transducer. Sens. Actuators A-Phys. 2013, 200, 16–20. [Google Scholar] [CrossRef]
  5. Feng, X.; Liu, J.; Teng, D.; Yang, Y.; Liao, L.; Liu, W.; Chen, Q.; Xu, J.; Gao, F. Effect of sintering atmosphere on the microstructure and electrical properties of Pb(Zr1/2Ti1/2)O3-Pb(Zn1/3Nb2/3)O3-Pb(Ni1/3Nb2/3)O3 ceramics. J. Mater. Sci. Mater. Electron. 2022, 33, 11613–11622. [Google Scholar] [CrossRef]
  6. Zhang, S.; Lee, S.; Kim, D.; Lee, H.; Shrout, T. Electromechanical properties of PMN-PZT piezoelectric single crystals near morphotropic phase boundary compositions. J. Am. Ceram. Soc. 2007, 90, 3859–3862. [Google Scholar] [CrossRef]
  7. Li, L.; Liu, J.; Cao, S.; Xu, J.; Wu, C.; Pawlikowska, E.; Szafran, M.; Gao, F. Microstructure evolution and reaction mechanisms of Pb(Zr0.5Ti0.5)O3-Pb(Zn1/3Nb2/3)O3-Pb(Ni1/3Nb2/3)O3 piezoelectric ceramics with plate-like PbTiO3 template. Ceram. Int. 2021, 47, 470–478. [Google Scholar] [CrossRef]
  8. Li, L.; Liu, J.; Xu, J.; Cao, S.; Chen, Q.; Pawlikowska, E.; Szafran, M.; Gao, F.; Reece, M.; Yan, H. Effect of MnO2 on the microstructure and electrical properties of 0.83Pb(Zr0.5Ti0.5)O3-0.11Pb(Zn1/3Nb2/3)O3-0.06Pb(Ni1/3Nb2/3)O3 piezoelectric ceramics. Ceram. Int. 2020, 46, 180–185. [Google Scholar] [CrossRef]
  9. Ananta, S.; Thomas, N. Fabrication of PMN and PFN ceramic by a two-stage sintering technique. J. Eur. Ceram. Soc. 1999, 19, 2917–2930. [Google Scholar] [CrossRef]
  10. Zhu, Z.; Zheng, N.; Li, G.; Yin, Q. Dielectric and electrical conductivity properties of PMS-PZT ceramics. J. Am. Ceram. Soc. 2006, 89, 717–719. [Google Scholar] [CrossRef]
  11. Wang, D.; Cao, M.; Zhang, S. Phase diagram and properties of Pb(In1/2Nb1/2)O3-Pb(Mg1/3Nb2/3)O3-PbTiO3 polycrystalline ceramics. J. Eur. Ceram. Soc. 2012, 32, 433–439. [Google Scholar] [CrossRef]
  12. Wu, J.; Chang, Y.; Yang, B.; Zhang, S.; Sun, Y.; Guo, F.; Cao, W. Phase transitional behavior and electrical properties of Pb(In1/2Nb1/2)O3-Pb(Mg1/3Nb2/3)O3-PbTiO3 ternary ceramics. J. Mater. Sci. Mater. Electron. 2015, 26, 1874–1880. [Google Scholar] [CrossRef]
  13. Hussain, A.; Jabeen, N.; Hassan, N.; Rasheed, S.; Idress, A.; Eldin, S.; Ouladsmane, M.; Khan, S.; Akkinepally, B.; Javed, S. Structural, piezoelectric and ferroelectric analysis of 0.96Bi0.5Na0.5TiO3-0.06BaTiO3: xwt%MnO2 ceramics for high-tech applications. Ceram. Int. 2023, 49, 27848–27854. [Google Scholar] [CrossRef]
  14. Jiang, L.; Chen, R.; Xing, J.; Lu, G.; Li, R.; Shung, K.; Zhu, J.; Zhou, Q. Fabrication of a (K,Na)NbO3-based lead-free 1-3 piezocomposite for high-sensitivity ultrasonic transducers application. J. Appl. Phys. 2019, 125, 214501. [Google Scholar] [CrossRef]
  15. Chen, J.; Li, X.; Zhao, X.; Wang, X.; Chen, C.; Deng, H. Compositional segregation, structural transformation and property-temperature relationship of high-Curie temperature Pb(In1/2Nb1/2)O3–Pb(Mg1/3Nb2/3)O3–PbTiO3 single crystals. J. Mater. Sci. Mater. Electron. 2015, 26, 9316–9328. [Google Scholar] [CrossRef]
  16. Lim, J.; Zhang, S.; Shrout, T. Modified Pb(Yb,Nb)O3-PbZrO3-PbTiO3 Ternary System for High Temperature Applications. Ceram. Int. 2012, 38, 277–282. [Google Scholar] [CrossRef]
  17. Dong, H.; Wang, J.; Chen, H.; Zhang, P.; Zhong, W.; Su, W. 0.08Pb(Fe1/3Sb2/3)O3-yPbTiO;(1-0.08-y)PbZrO3 Piezoelectric Ceramic. J. Funct. Mater. 2001, 32, 80–81. [Google Scholar]
  18. Shaw, J.; Liu, K.; Lin, I. Modification of piezoelectric characteristics of the Pb(Mg,Nb)O3-PbZrO3-PbTiO3 ternary system by aliovalent additives. J. Am. Ceram. Soc. 1995, 78, 178–182. [Google Scholar] [CrossRef]
  19. Wu, L.; Liang, C.; Shieu, C. Piezoelectric properties of (Pb,Sr)(Zr,Ti,Mn,Zn,Nb)O3 piezoelectric ceramic. J. Mater. Sci. 1991, 26, 4439–4444. [Google Scholar] [CrossRef]
  20. Luo, N.; Zhang, S.; Li, Q.; Xu, C.; Shrout, T. New Pb(Mg1/3Nb2/3)O3-Pb(In1/2Nb1/2)O3-PbZrO3-PbTiO3 quaternary ceramics: Morphotropic phase boundary design and electrical properties. ACS Appl. Mater. 2016, 8, 15506–15517. [Google Scholar] [CrossRef] [PubMed]
  21. Jin, L. Broadband Dielectric Response in Hard and Soft PZT: Understanding Softening and Hardening Mechanisms. Ph.D. Thesis, École Polytechnique Fédérale de Lausanne, Lausanne, Switzerland, 2011. [Google Scholar]
  22. Li, F.; Lin, D.; Chen, Z.; Cheng, Z.; Wang, J.; Li, C.; Xu, Z.; Huang, Q.; Liao, X.; Chen, L.; et al. Ultrahigh piezoelectricity in ferroelectric ceramics by design. Nat. Mater. 2018, 17, 349. [Google Scholar] [CrossRef]
  23. Wang, T.; Song, K.; Li, Z. Electrical properties and temperature stability of high TC/TR-T Pb(In1/2Nb1/2)O3–Pb(Zn1/3Nb2/3)O3–PbTiO3 piezoelectric ceramics with compositions near the morphotropic phase boundary. J. Mater. Sci. Mater Electron. 2020, 31, 20411–20422. [Google Scholar] [CrossRef]
  24. Du, J.; Qiu, J.; Zhu, K.; Hong, L. Enhanced piezoelectric properties of 0.55Pb(Ni1/3Nb2/3)O3-0.135PbZrO3-0.315PbTiO3 ternary ceramics by optimizing sintering temperature. J. Electroceram. 2014, 32, 234–239. [Google Scholar] [CrossRef]
  25. Tang, H.; Zhang, M.F.; Zhang, S.J.; Feng, Y.J.; Li, F.; Shrout, T.R. Investigation of dielectric and piezoelectric properties in Pb(Ni1/3Nb2/3)O3-PbHfO3-PbTiO3 ternary system. J. Eur. Ceram. Soc. 2013, 33, 2491–2497. [Google Scholar] [CrossRef]
  26. Kalem, V.; Wan, Y.; Shih, W. Dielectric and piezoelectric properties of PMN-PT ceramics doped with strontium. Ceram. Int. 2018, 44, 2835–2842. [Google Scholar] [CrossRef]
  27. Guo, Q.; Li, F.; Xia, F.; Gao, X.; Wang, P.; Hao, H.; Zhang, S. High-Performance Sm-Doped Pb(Mg1/3Nb2/3)O3-PbZrO3-PbTiO3-Based Piezoceramics. ACS Appl. Mater. Interfaces 2019, 11, 43359–43367. [Google Scholar] [CrossRef] [PubMed]
Figure 1. SEM images of 0.1 PZ ceramic sintered at different temperatures: (a) 1100 °C, (b) 1150 °C, (c) 1200 °C.
Crystals 13 01362 g001
Figure 2. Density of 0.1 PZ ceramic samples sintered at different temperatures.
Crystals 13 01362 g002
Figure 3. XRD patterns of PIZZT ceramic samples.
Crystals 13 01362 g003
Figure 4. XRD peak position fitting analysis of PIZZT ceramics at 2θ = 45°. (a) 0 PZ, (b) 0.05 PZ, (c) 0.1 PZ, (d) 0.15 PZ, (e) 0.2 PZ, (f) 0.25 PZ.
Crystals 13 01362 g004
Figure 5. SEM image of PIZZT ceramic sample. (a) 0 PZ, (b) 0.05 PZ, (c) 0.1 PZ, (d) 0.15 PZ, (e) 0.2 PZ, (f) 0.25 PZ.
Crystals 13 01362 g005
Figure 6. Temperature dependence of dielectric constant and loss of PIZZT ceramic samples.
Crystals 13 01362 g006
Figure 7. Curie temperature and dielectric constant versus component curve of PIZZT piezoelectric ceramics at room temperature.
Crystals 13 01362 g007
Figure 8. Plot of dielectric constant and dielectric loss versus frequency before and after polarization of PIZZT piezoelectric ceramics. (a) 0 PZ, (b) 0.05 PZ, (c) 0.1 PZ, (d) 0.15 PZ, (e) 0.2 PZ, (f) 0.25 PZ.
Crystals 13 01362 g008
Figure 9. Ferroelectric properties of PIZZT ceramics. (a) P-E hysteresis loops, (b) Pr and Ec.
Crystals 13 01362 g009
Figure 10. Electrostriction curves of PIZZT ceramics. (a) S-E plot, (b) d33*.
Crystals 13 01362 g010
Figure 11. Piezoelectric properties of PIZZT ceramics; (a) d33, (b) Qm and kp.
Crystals 13 01362 g011
Table 1. Rhombohedral and tetragonal phase content of PIZZT ceramics.
Samples0 PZ0.05 PZ0.1 PZ0.15 PZ0.2 PZ0.25 PZ
Rhombohedral phase content0.120.130.410.510.610.83
Tetragonal phase content0.880.870.590.490.390.17
Table 2. Dielectric, ferroelectric and piezoelectric properties of 0.28PIN-0.32PZN-(0.4-x)PT-xPZ ceramics.
SamplesƐr
(Before Polarization)
Tc (°C)Pr (μC/cm2)Ec (kV/cm)d33 (pC/N)kpQm
x = 09663205.1014.6900.26140.8
x = 0.05157830023.0519.32040.28129.5
x = 0.1240227238.2211.24520.5366.8
x = 0.15153624838.3210.11900.394.8
x = 0.2136423439.159.31450.38299.1
x = 0.25143221844.637.61250.33117.9
Table 3. Comparison of lead-based piezoelectric ceramic properties.
DesignationTc (°C)d33 (pC/N)kpεrTanδ (%)Ref.
PMN-PT159663/52601.8[22]
PMN-PIN-PT2454500.4929701.1[11]
PMN-PIN-PZT2315800.5338301.5[20]
PZN-PIN-PT2455890.5921431.9[23]
PNN-PZ-PT1159860.6939015 [24]
PNN-PH-PT1109700.6560001.5[25]
Sr-PMN-PT2106300.524000 [26]
Sm-PMN-PT891510/13,0003.5[27]
PIZZT (0.1 PZ)2724500.5324021.5This work
Disclaimer/Publisher’s Note: The statements, opinions and data contained in all publications are solely those of the individual author(s) and contributor(s) and not of MDPI and/or the editor(s). MDPI and/or the editor(s) disclaim responsibility for any injury to people or property resulting from any ideas, methods, instructions or products referred to in the content.

