
Fabrication of Textured 0.685(Na0.5Bi0.5)TiO3-0.065BaTiO3-0.25SrTiO3 Electrostrictive Ceramics by Templated Grain Growth Using NaNbO3 Templates and Characterization of Their Electrical Properties


 ,
,  , and
, and
Abstract
:1. Introduction
2. Materials and Methods
2.1. Powder Preparation
2.2. NaNbO3 Template Preparation
2.3. Tape-Casting and Sintering
2.4. Characterization
3. Results and Discussion
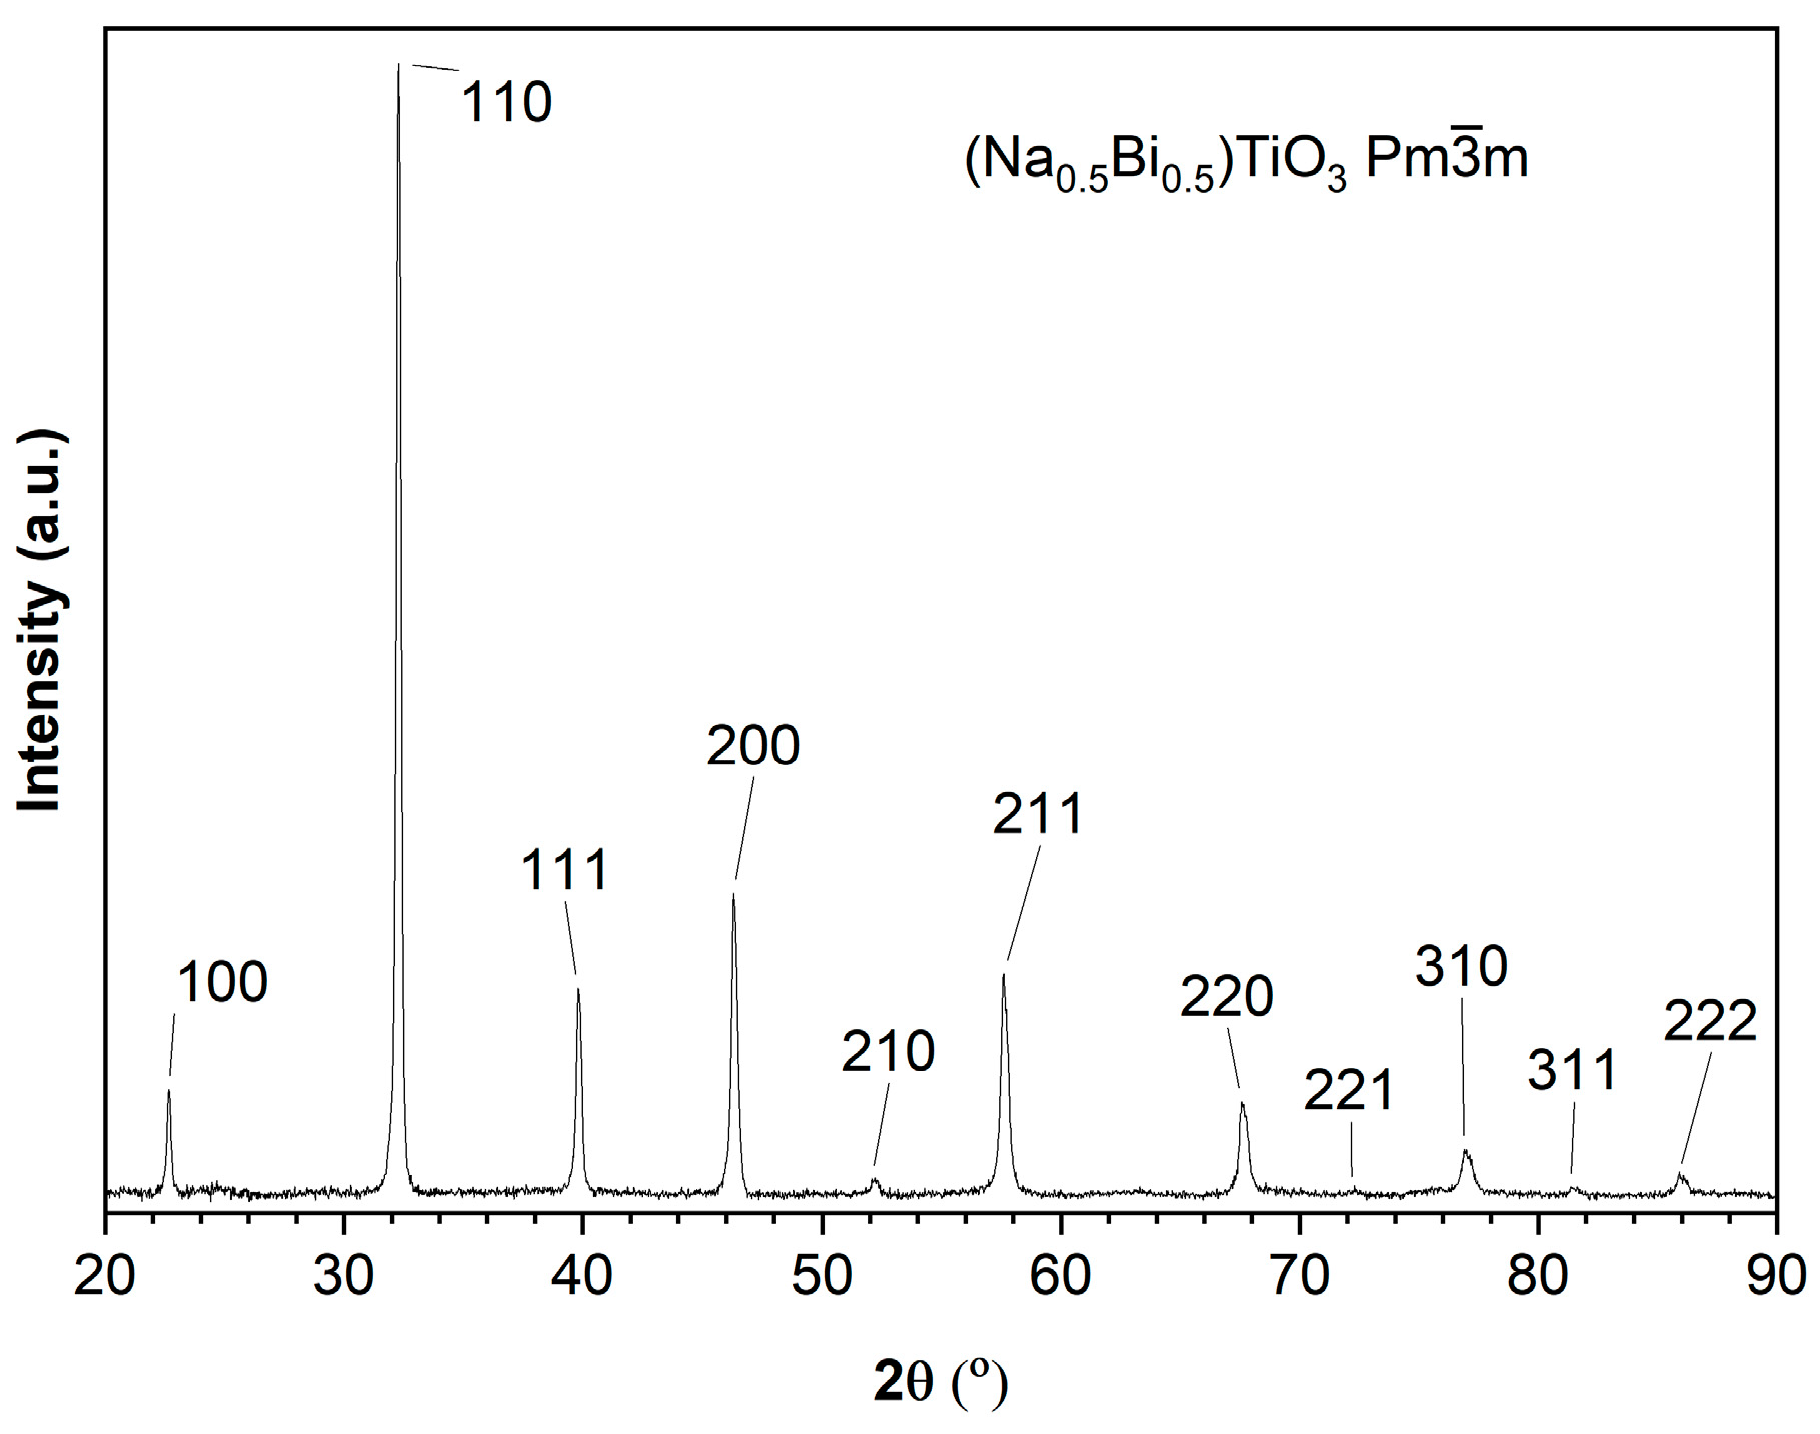
3.1. Powder Preparation
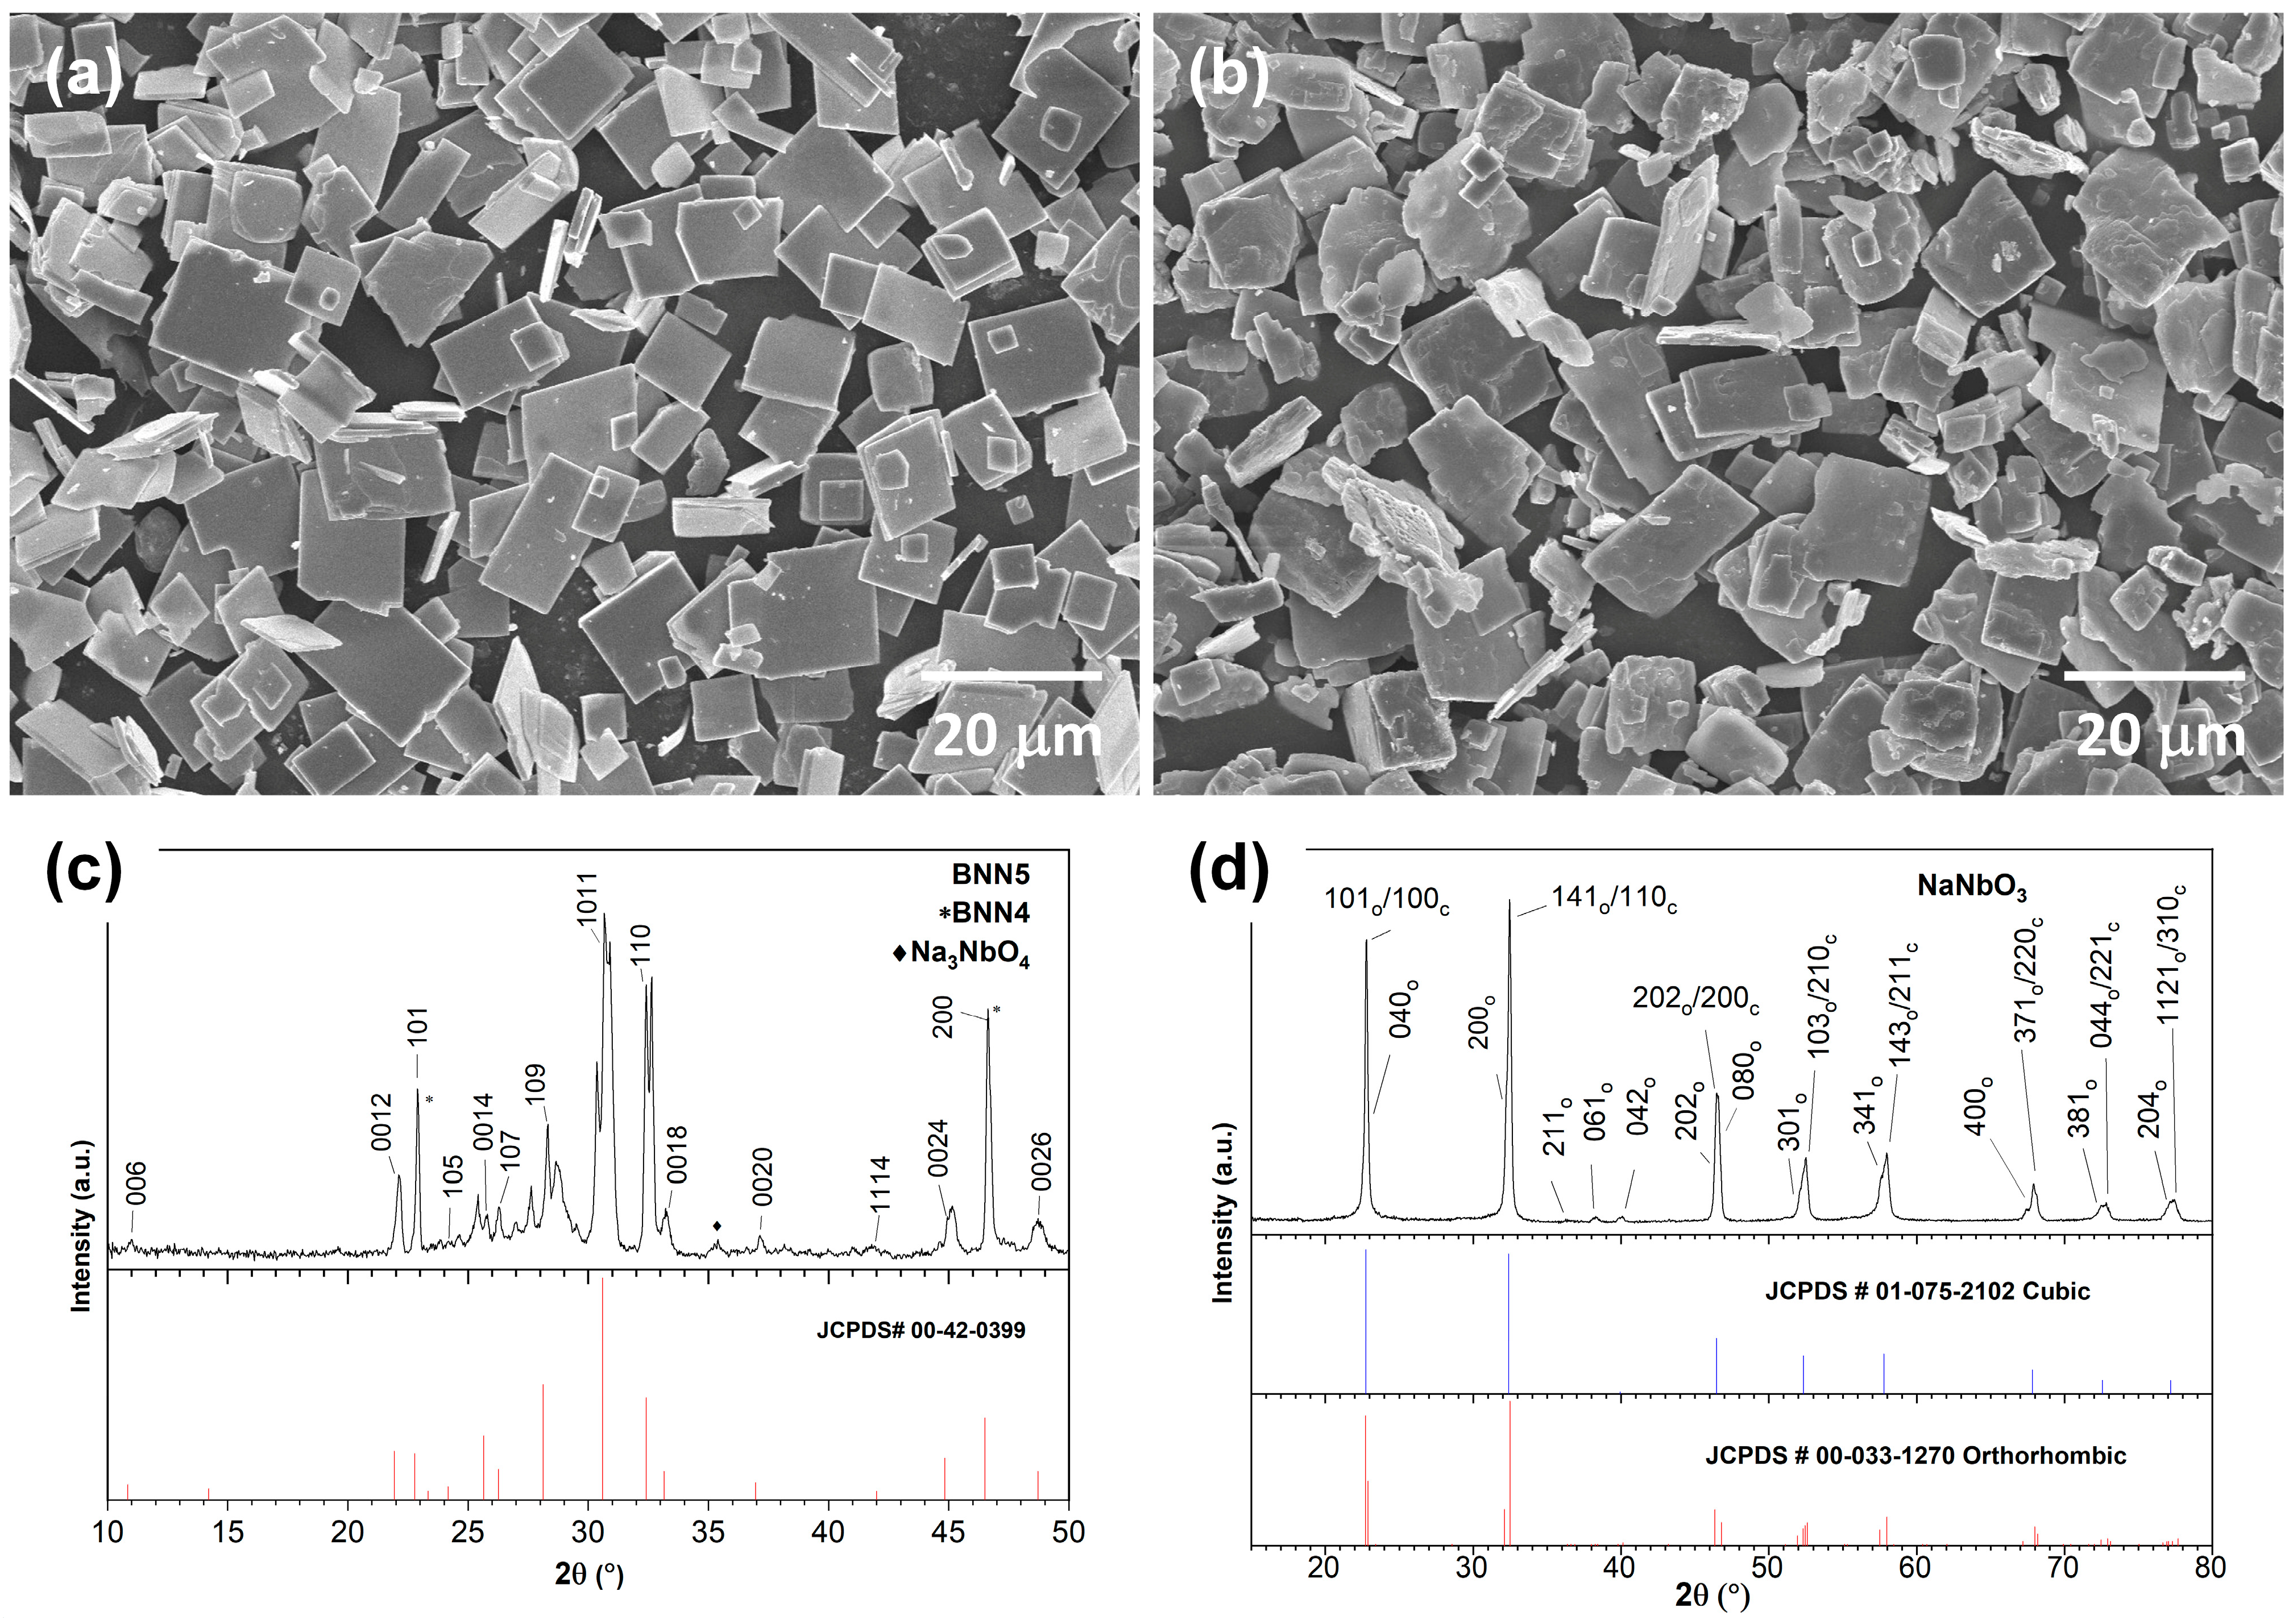
3.2. NaNbO3 Template Preparation
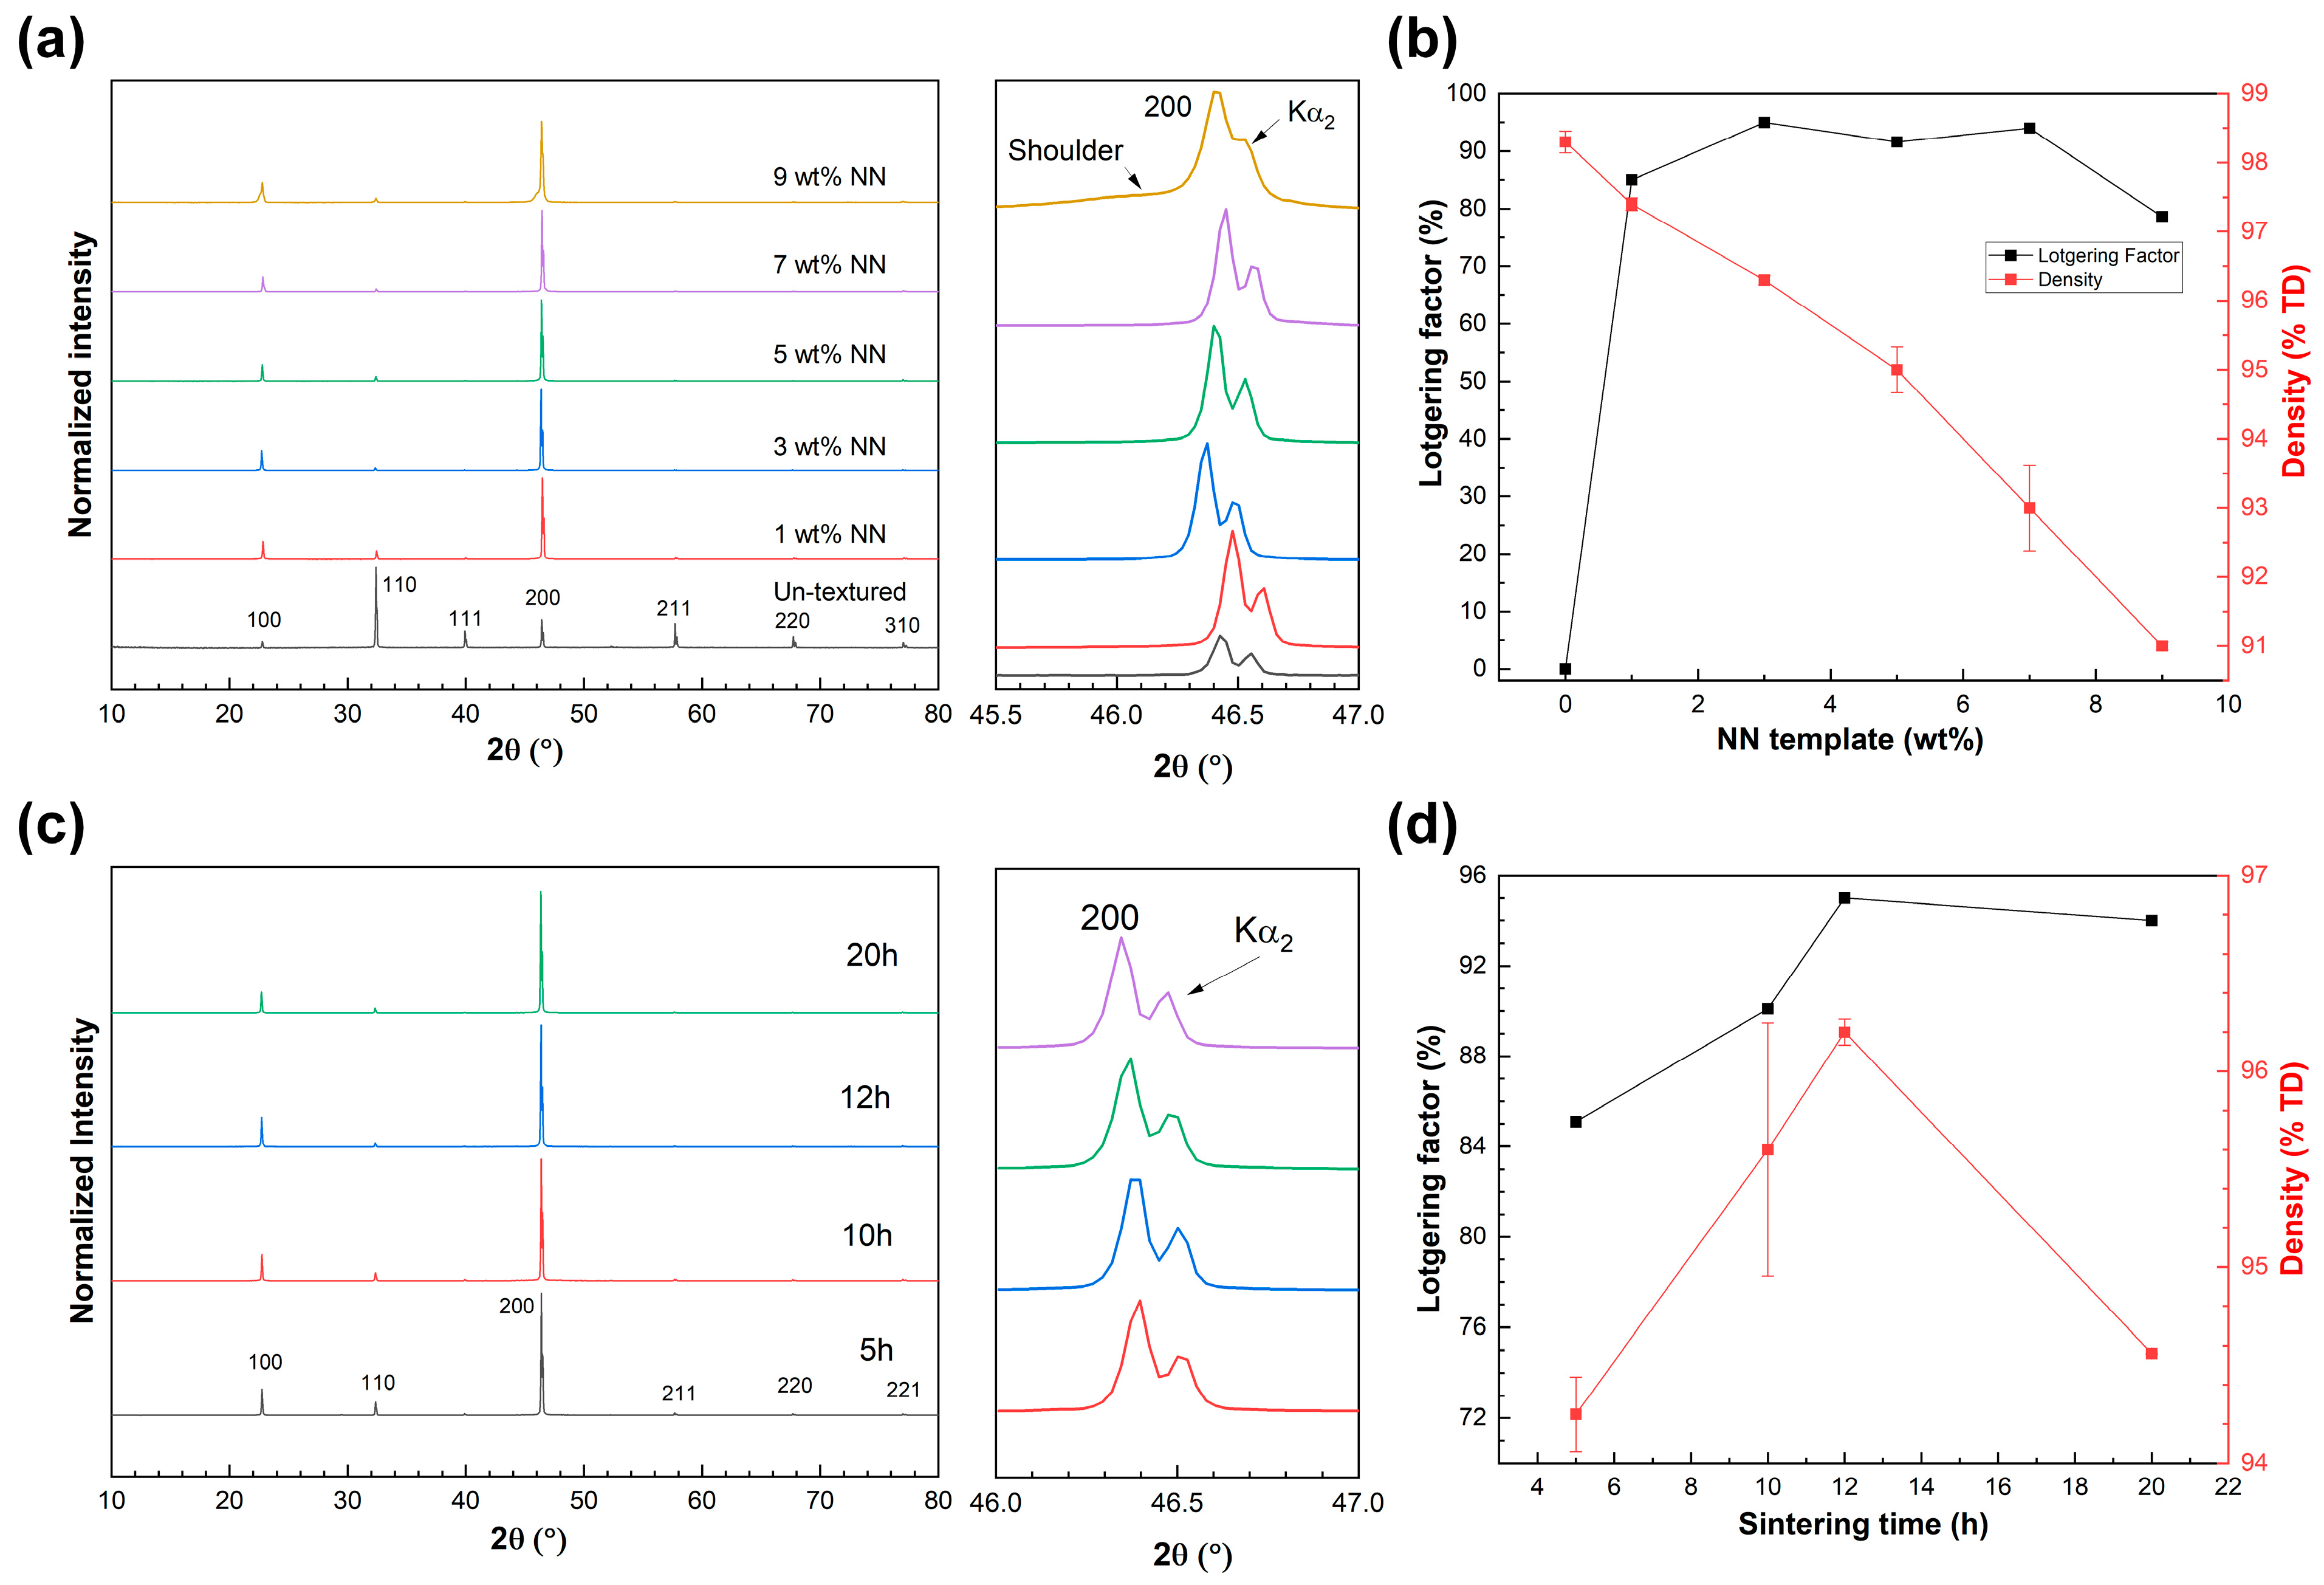
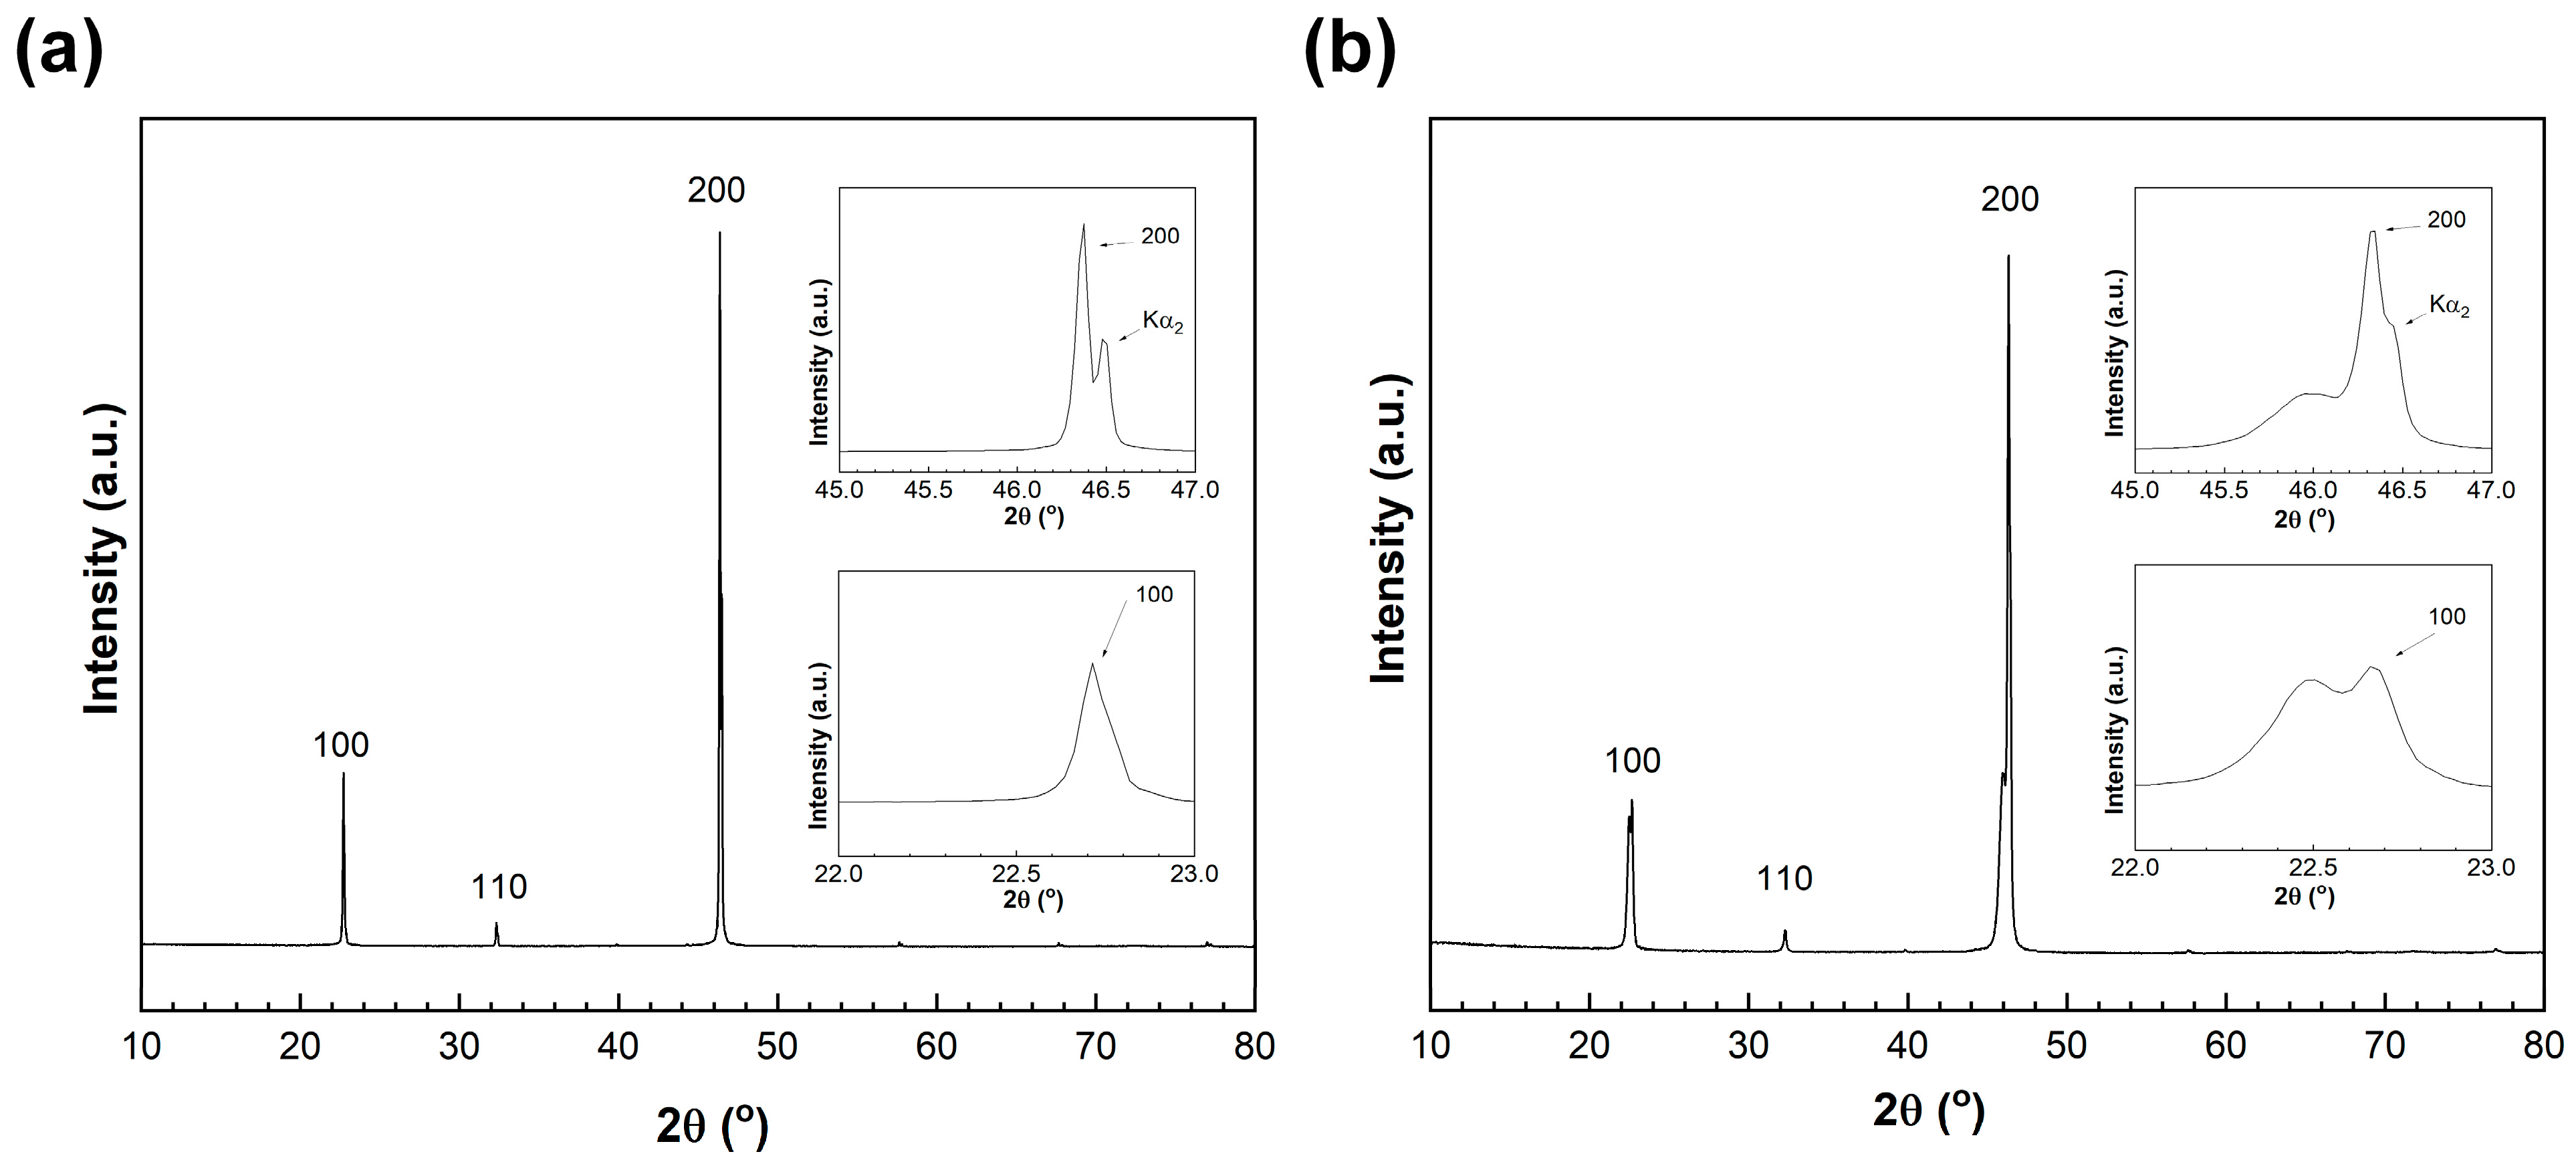
3.3. Texture Development
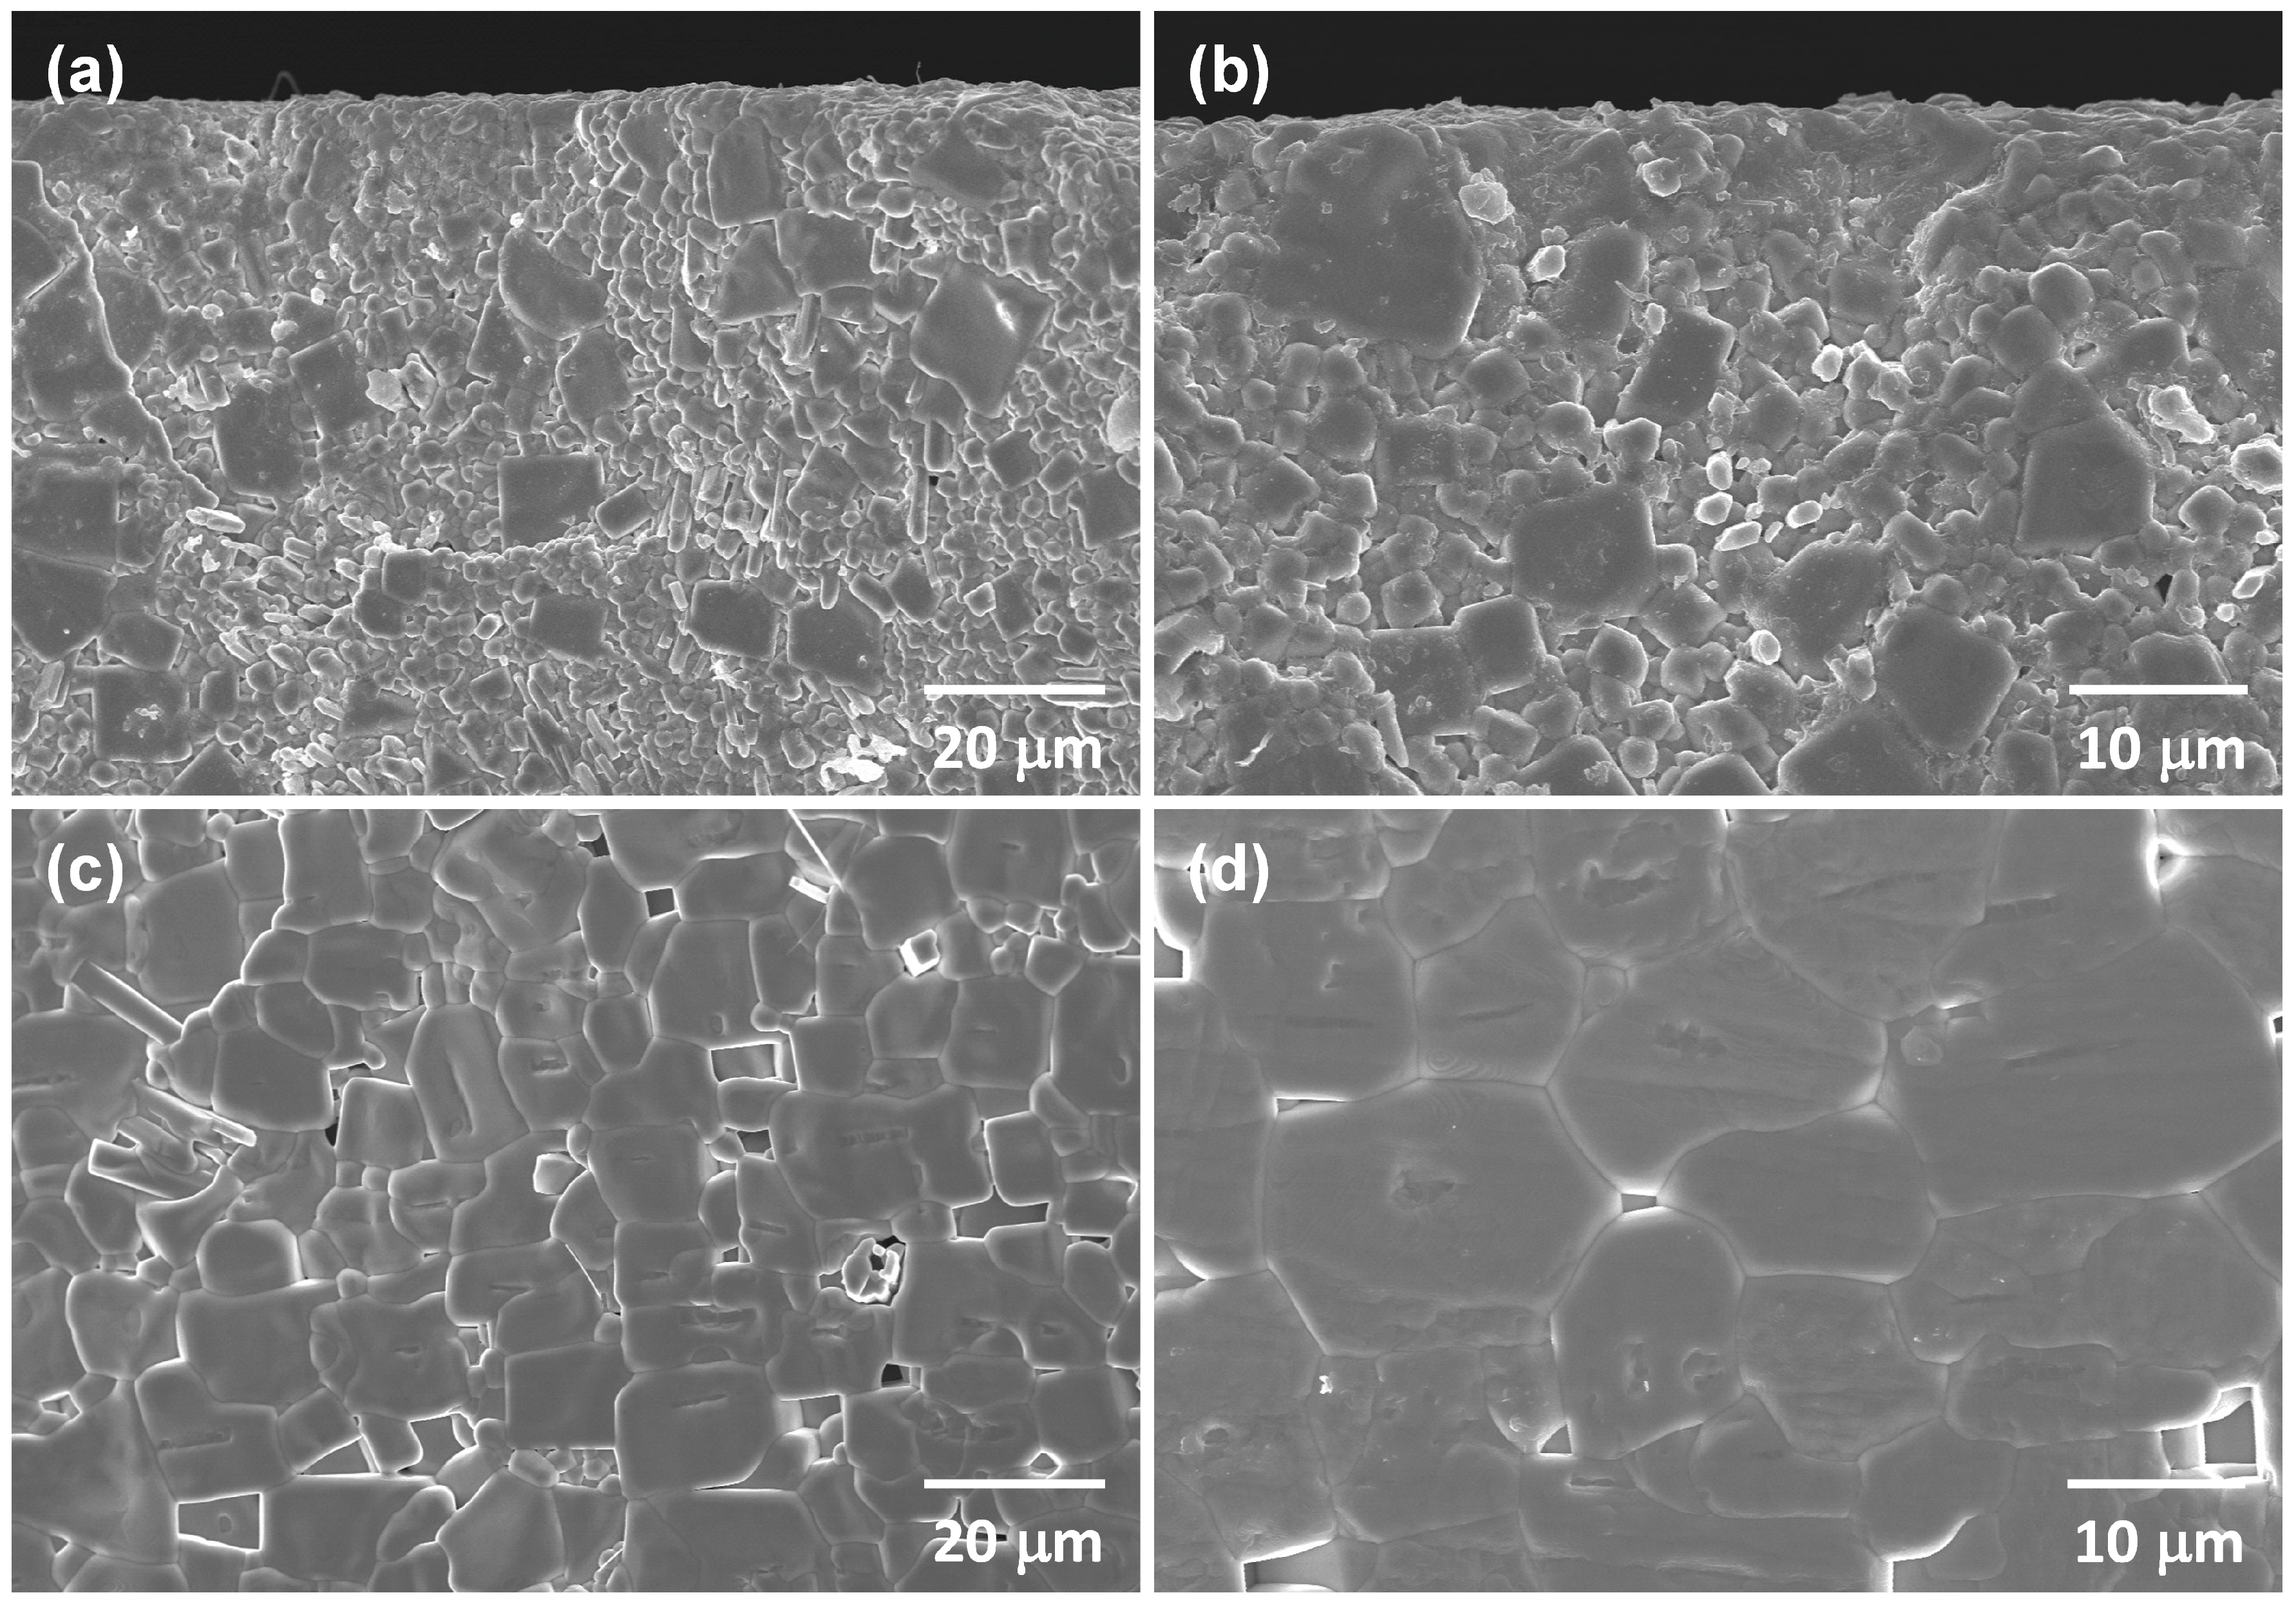
3.4. Microstructure
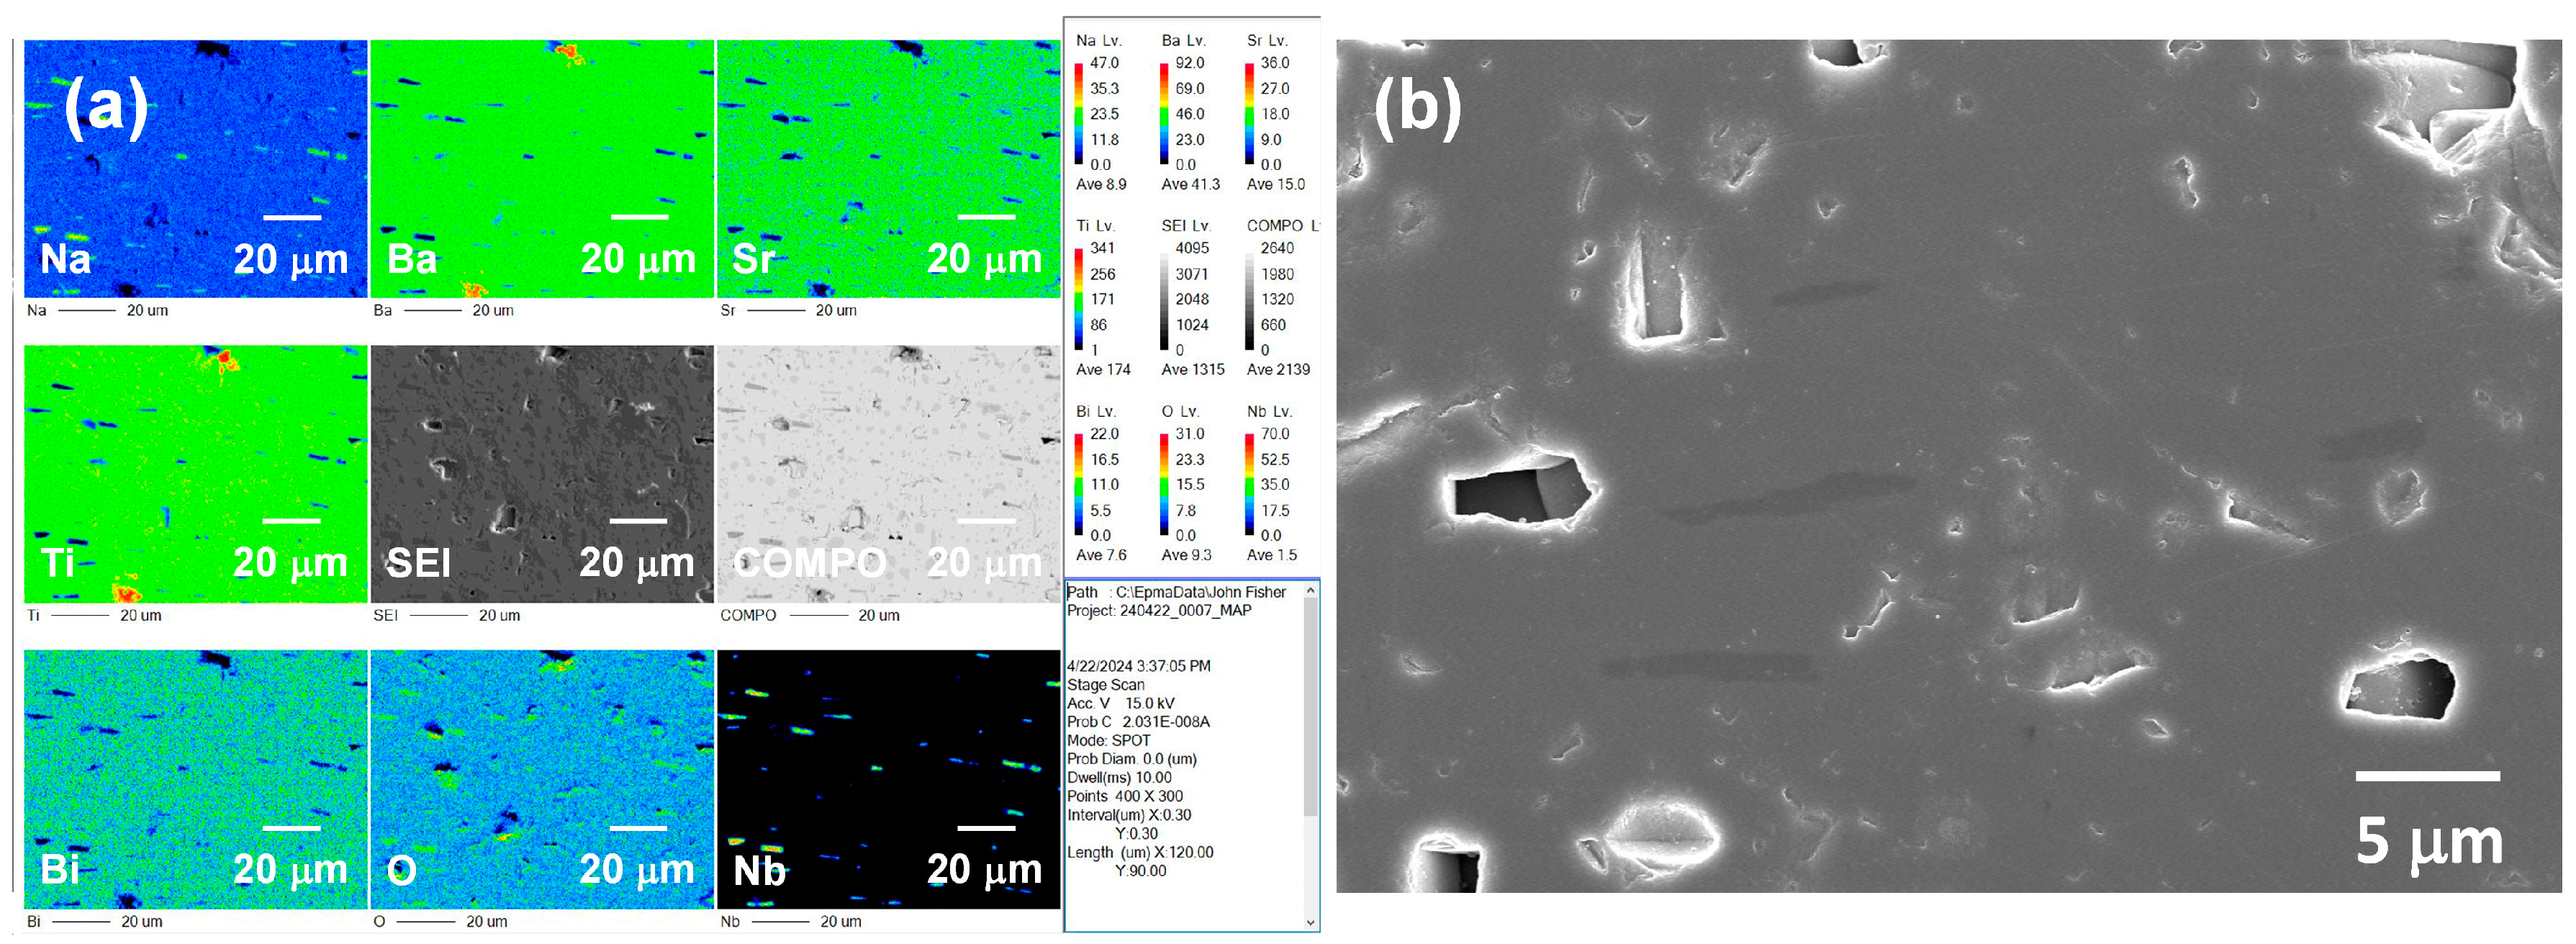
3.5. EPMA Analysis
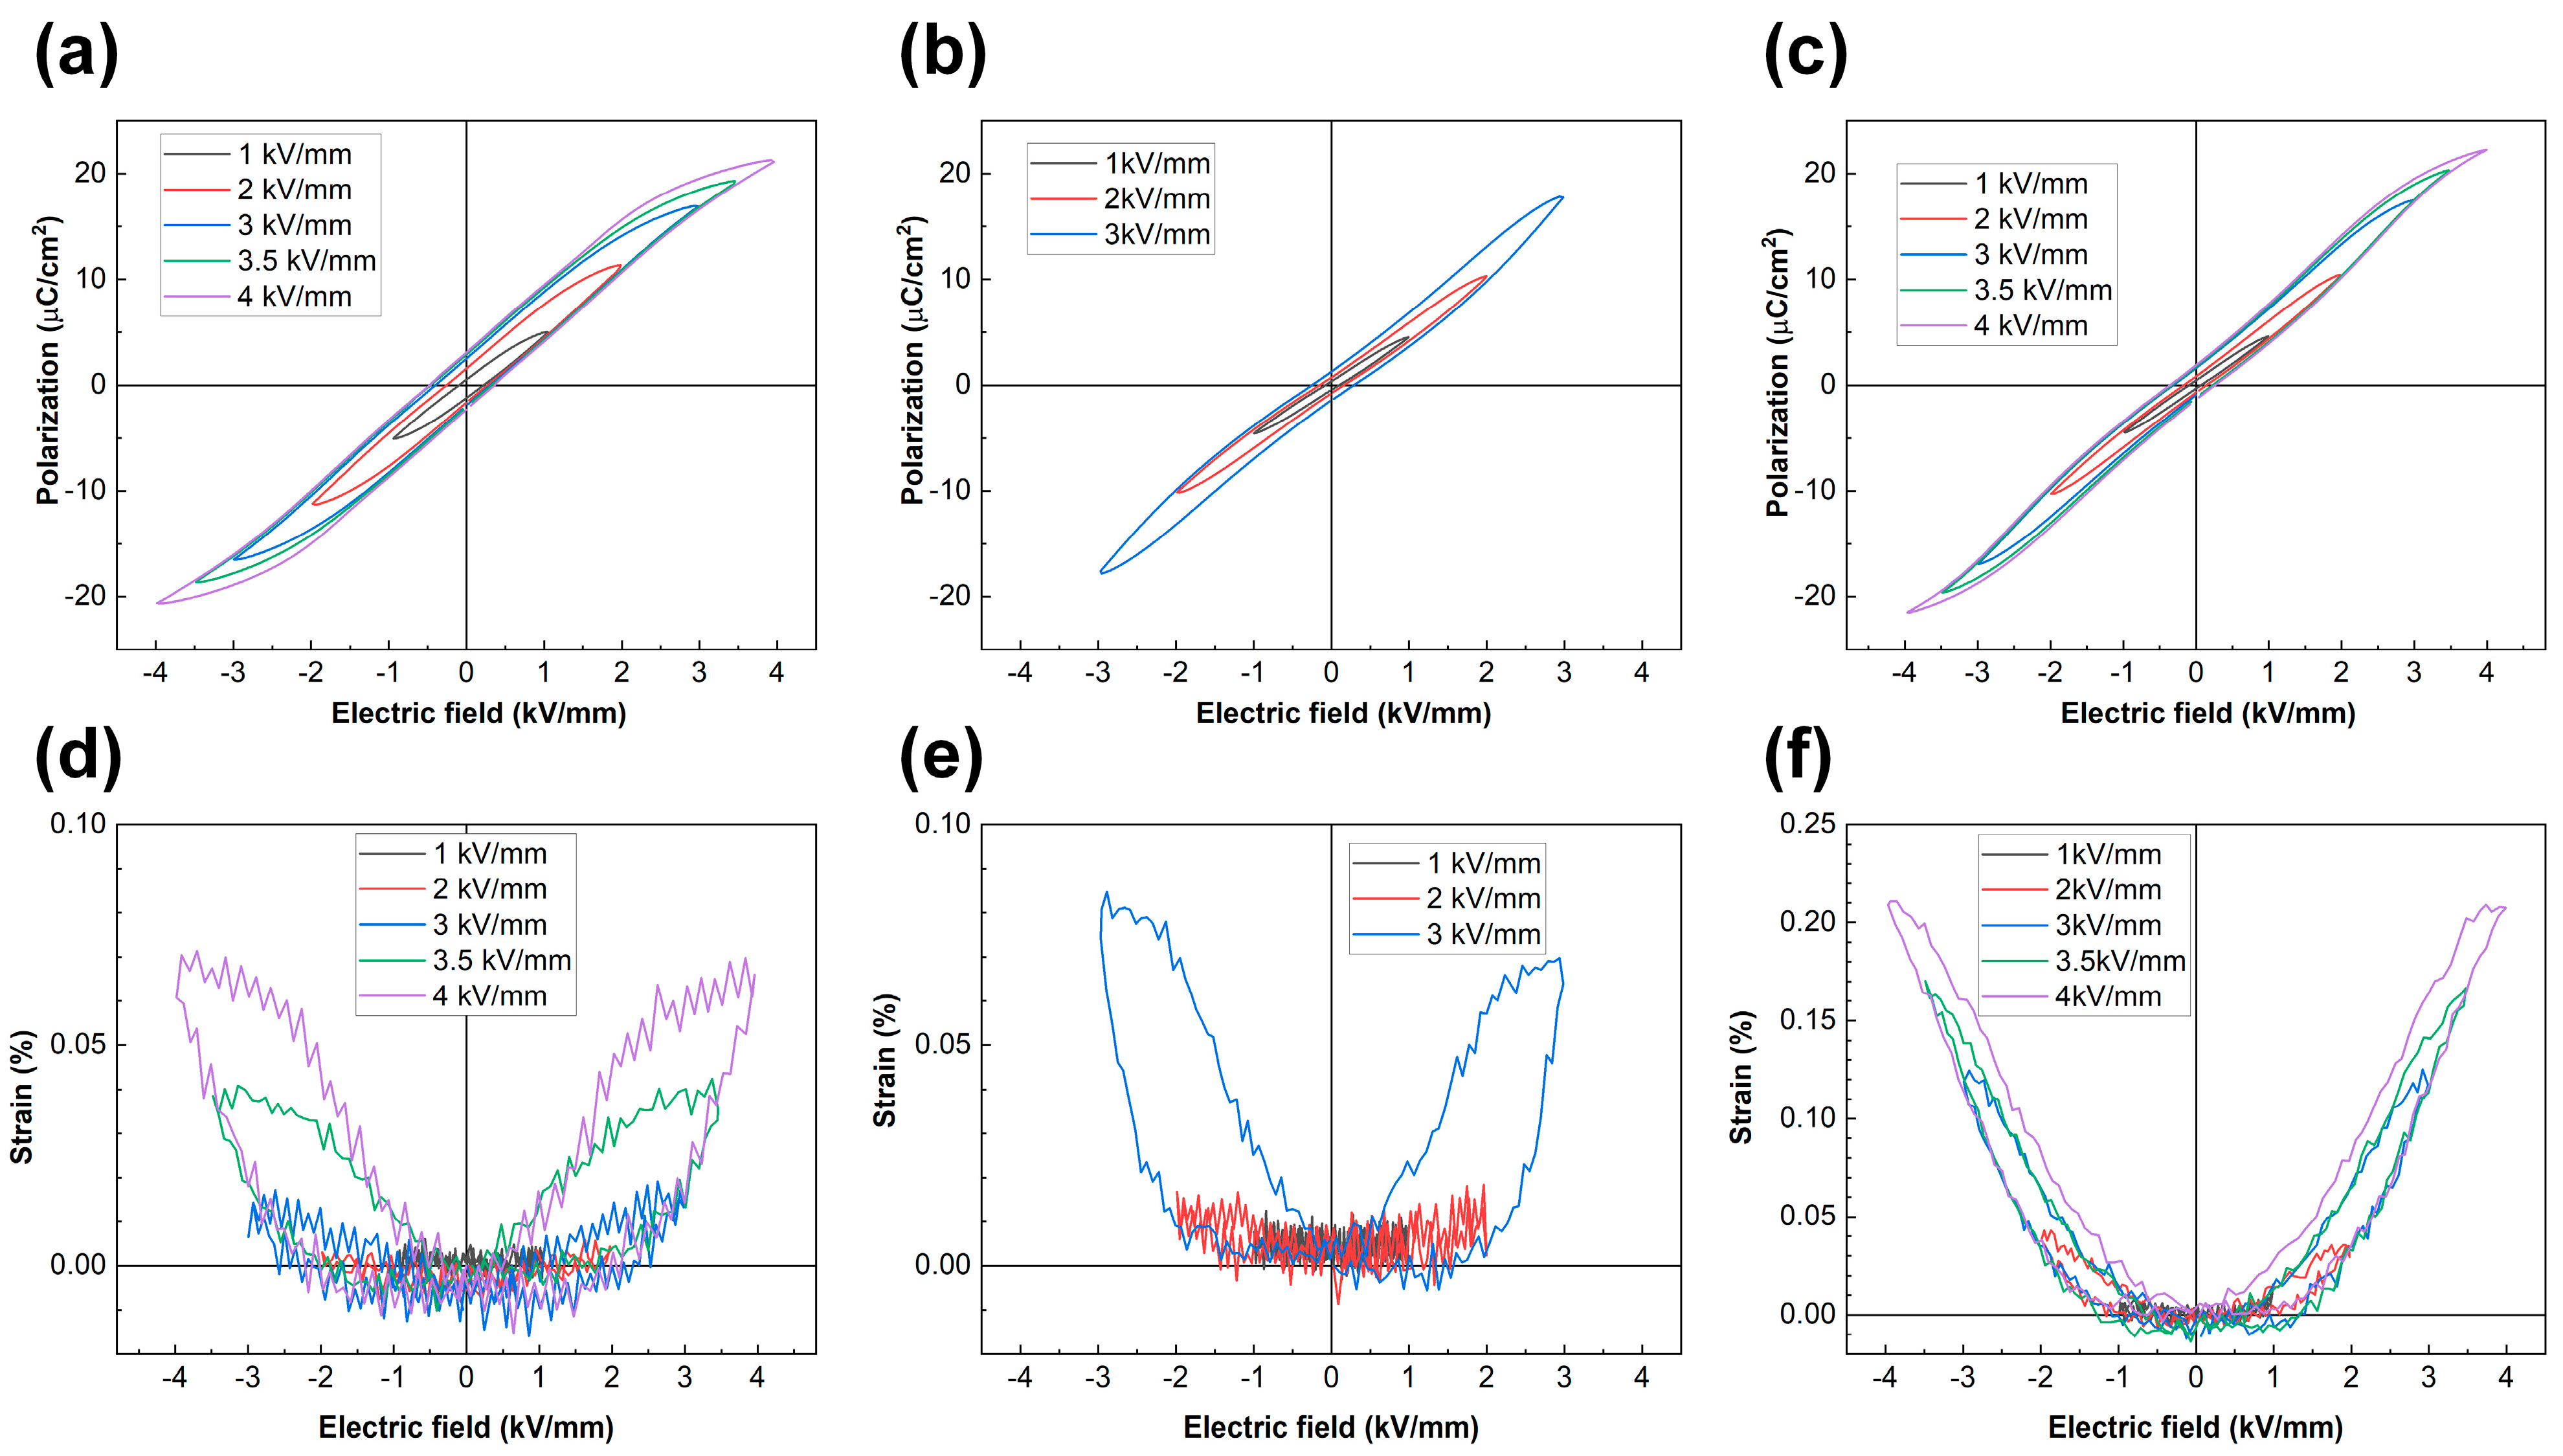
3.6. Polarization and Strain vs. Electric Field Hysteresis Loops
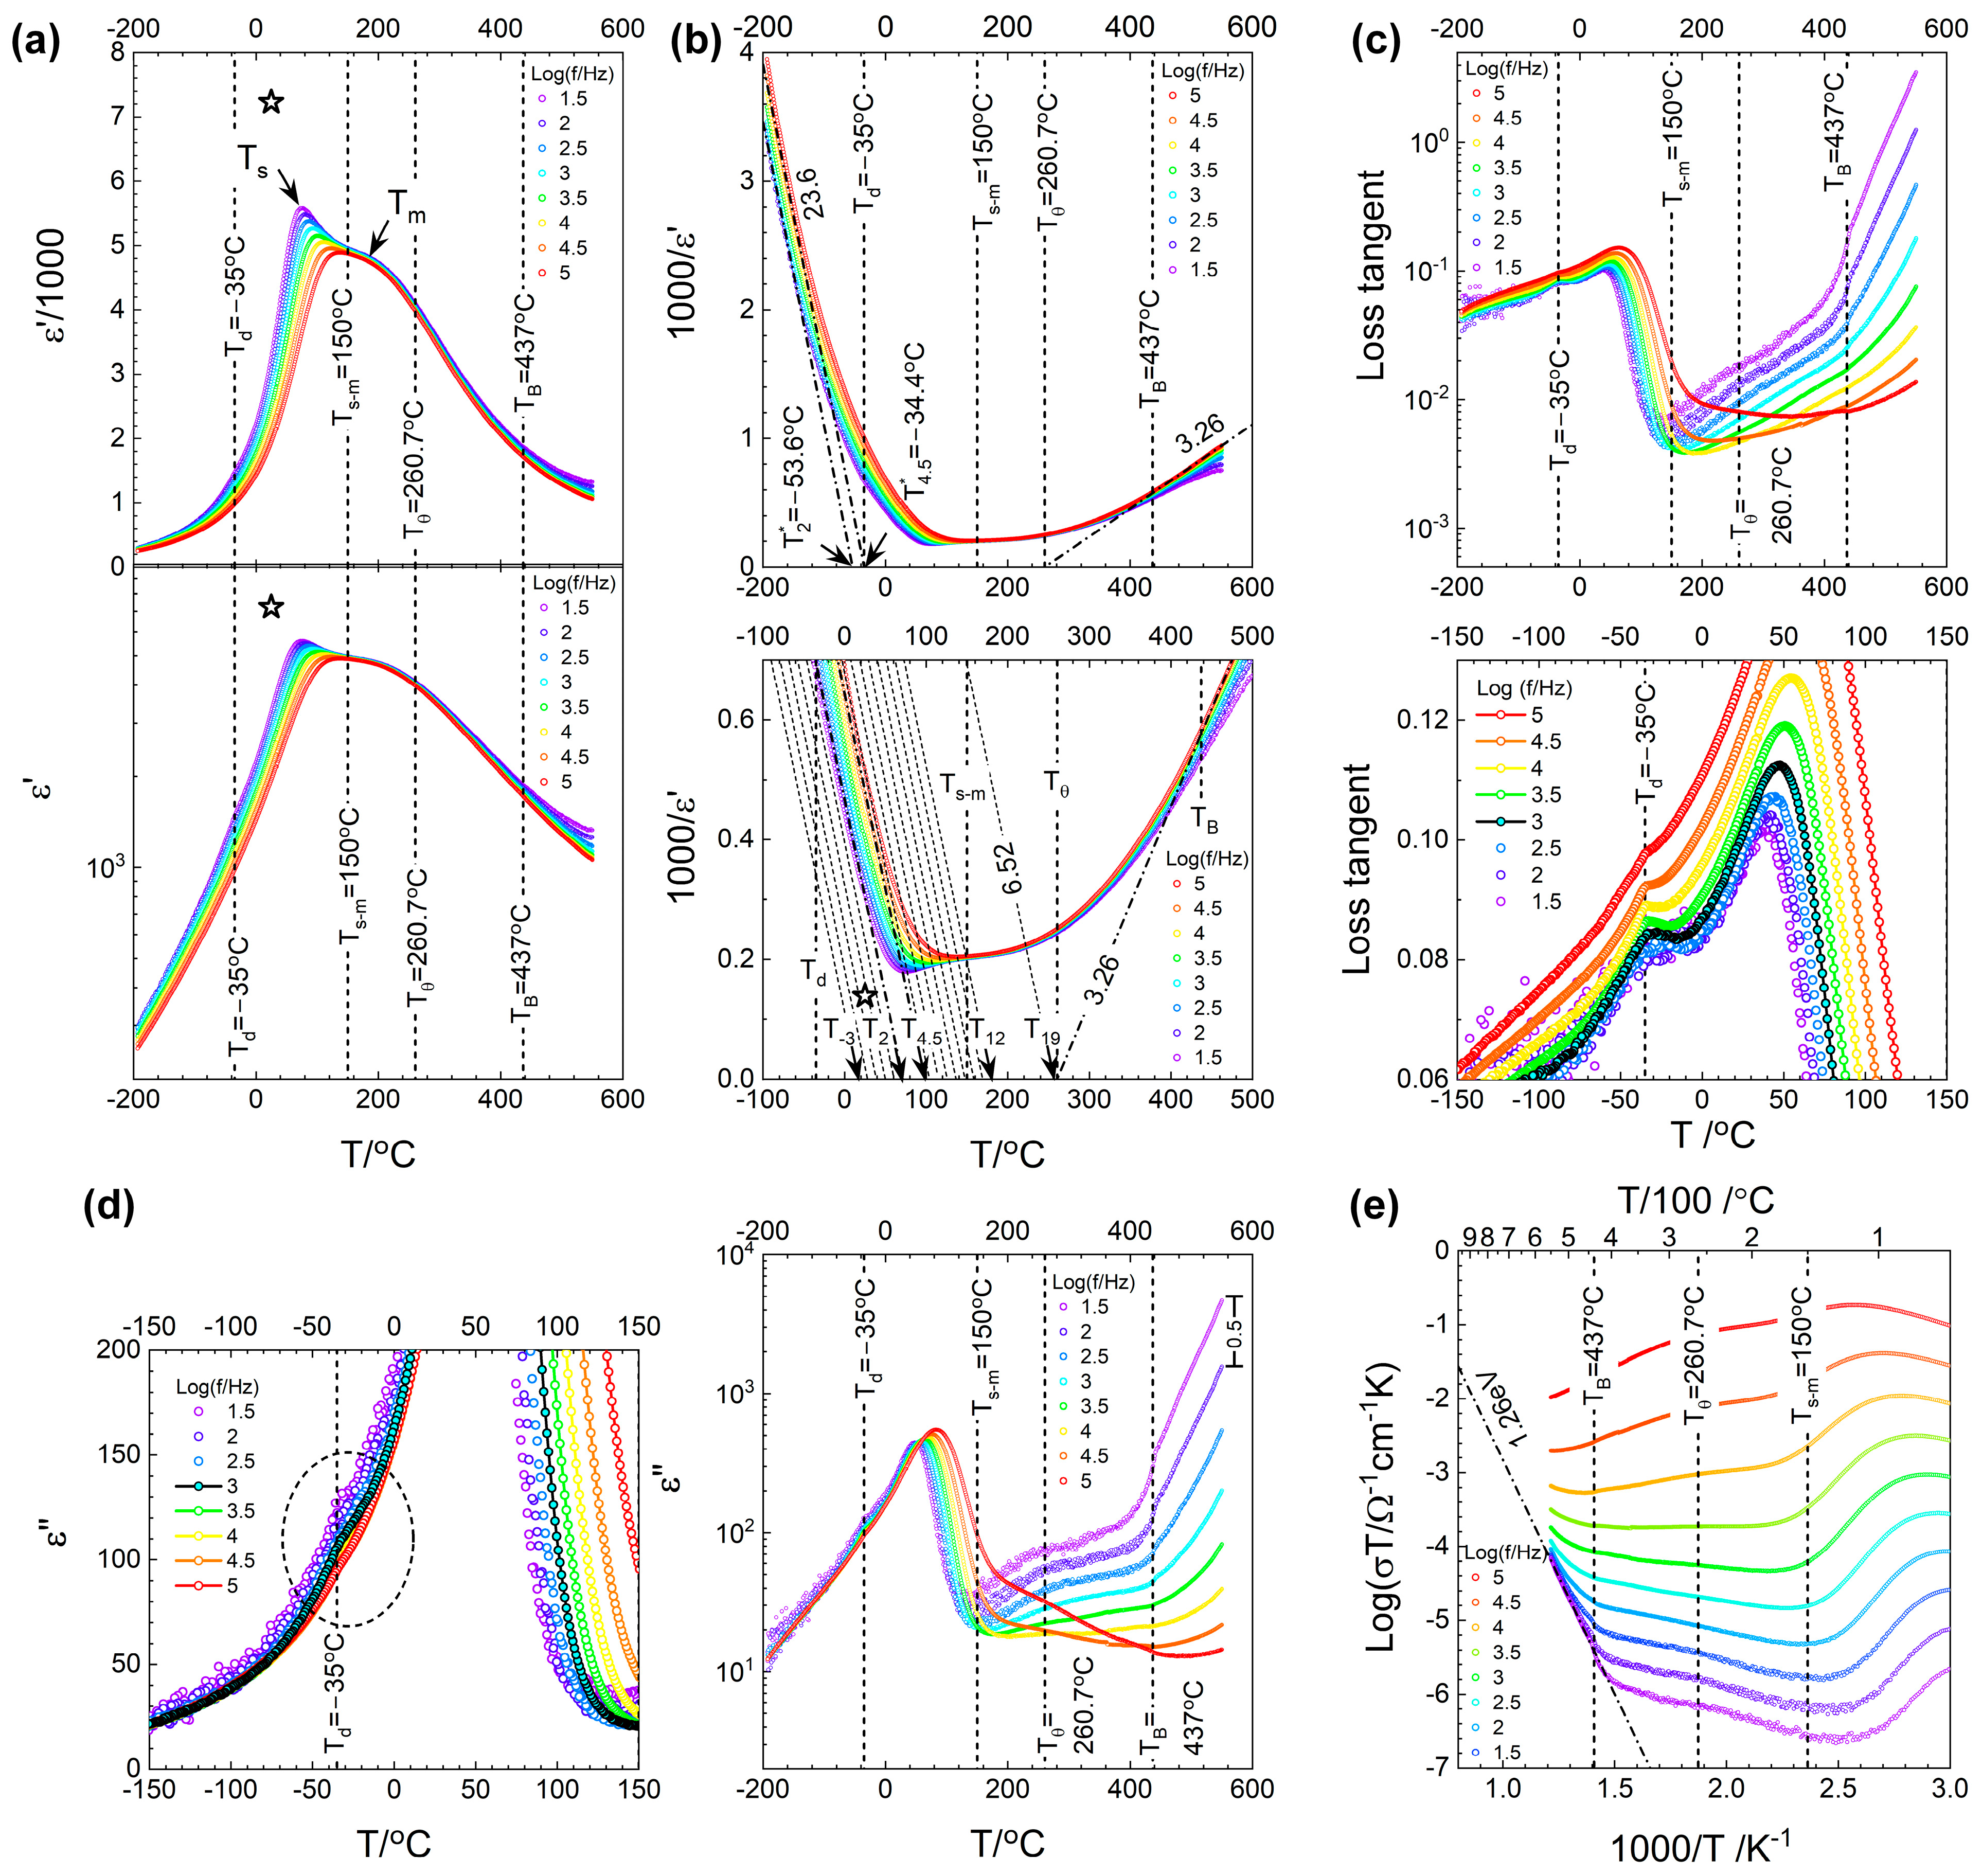
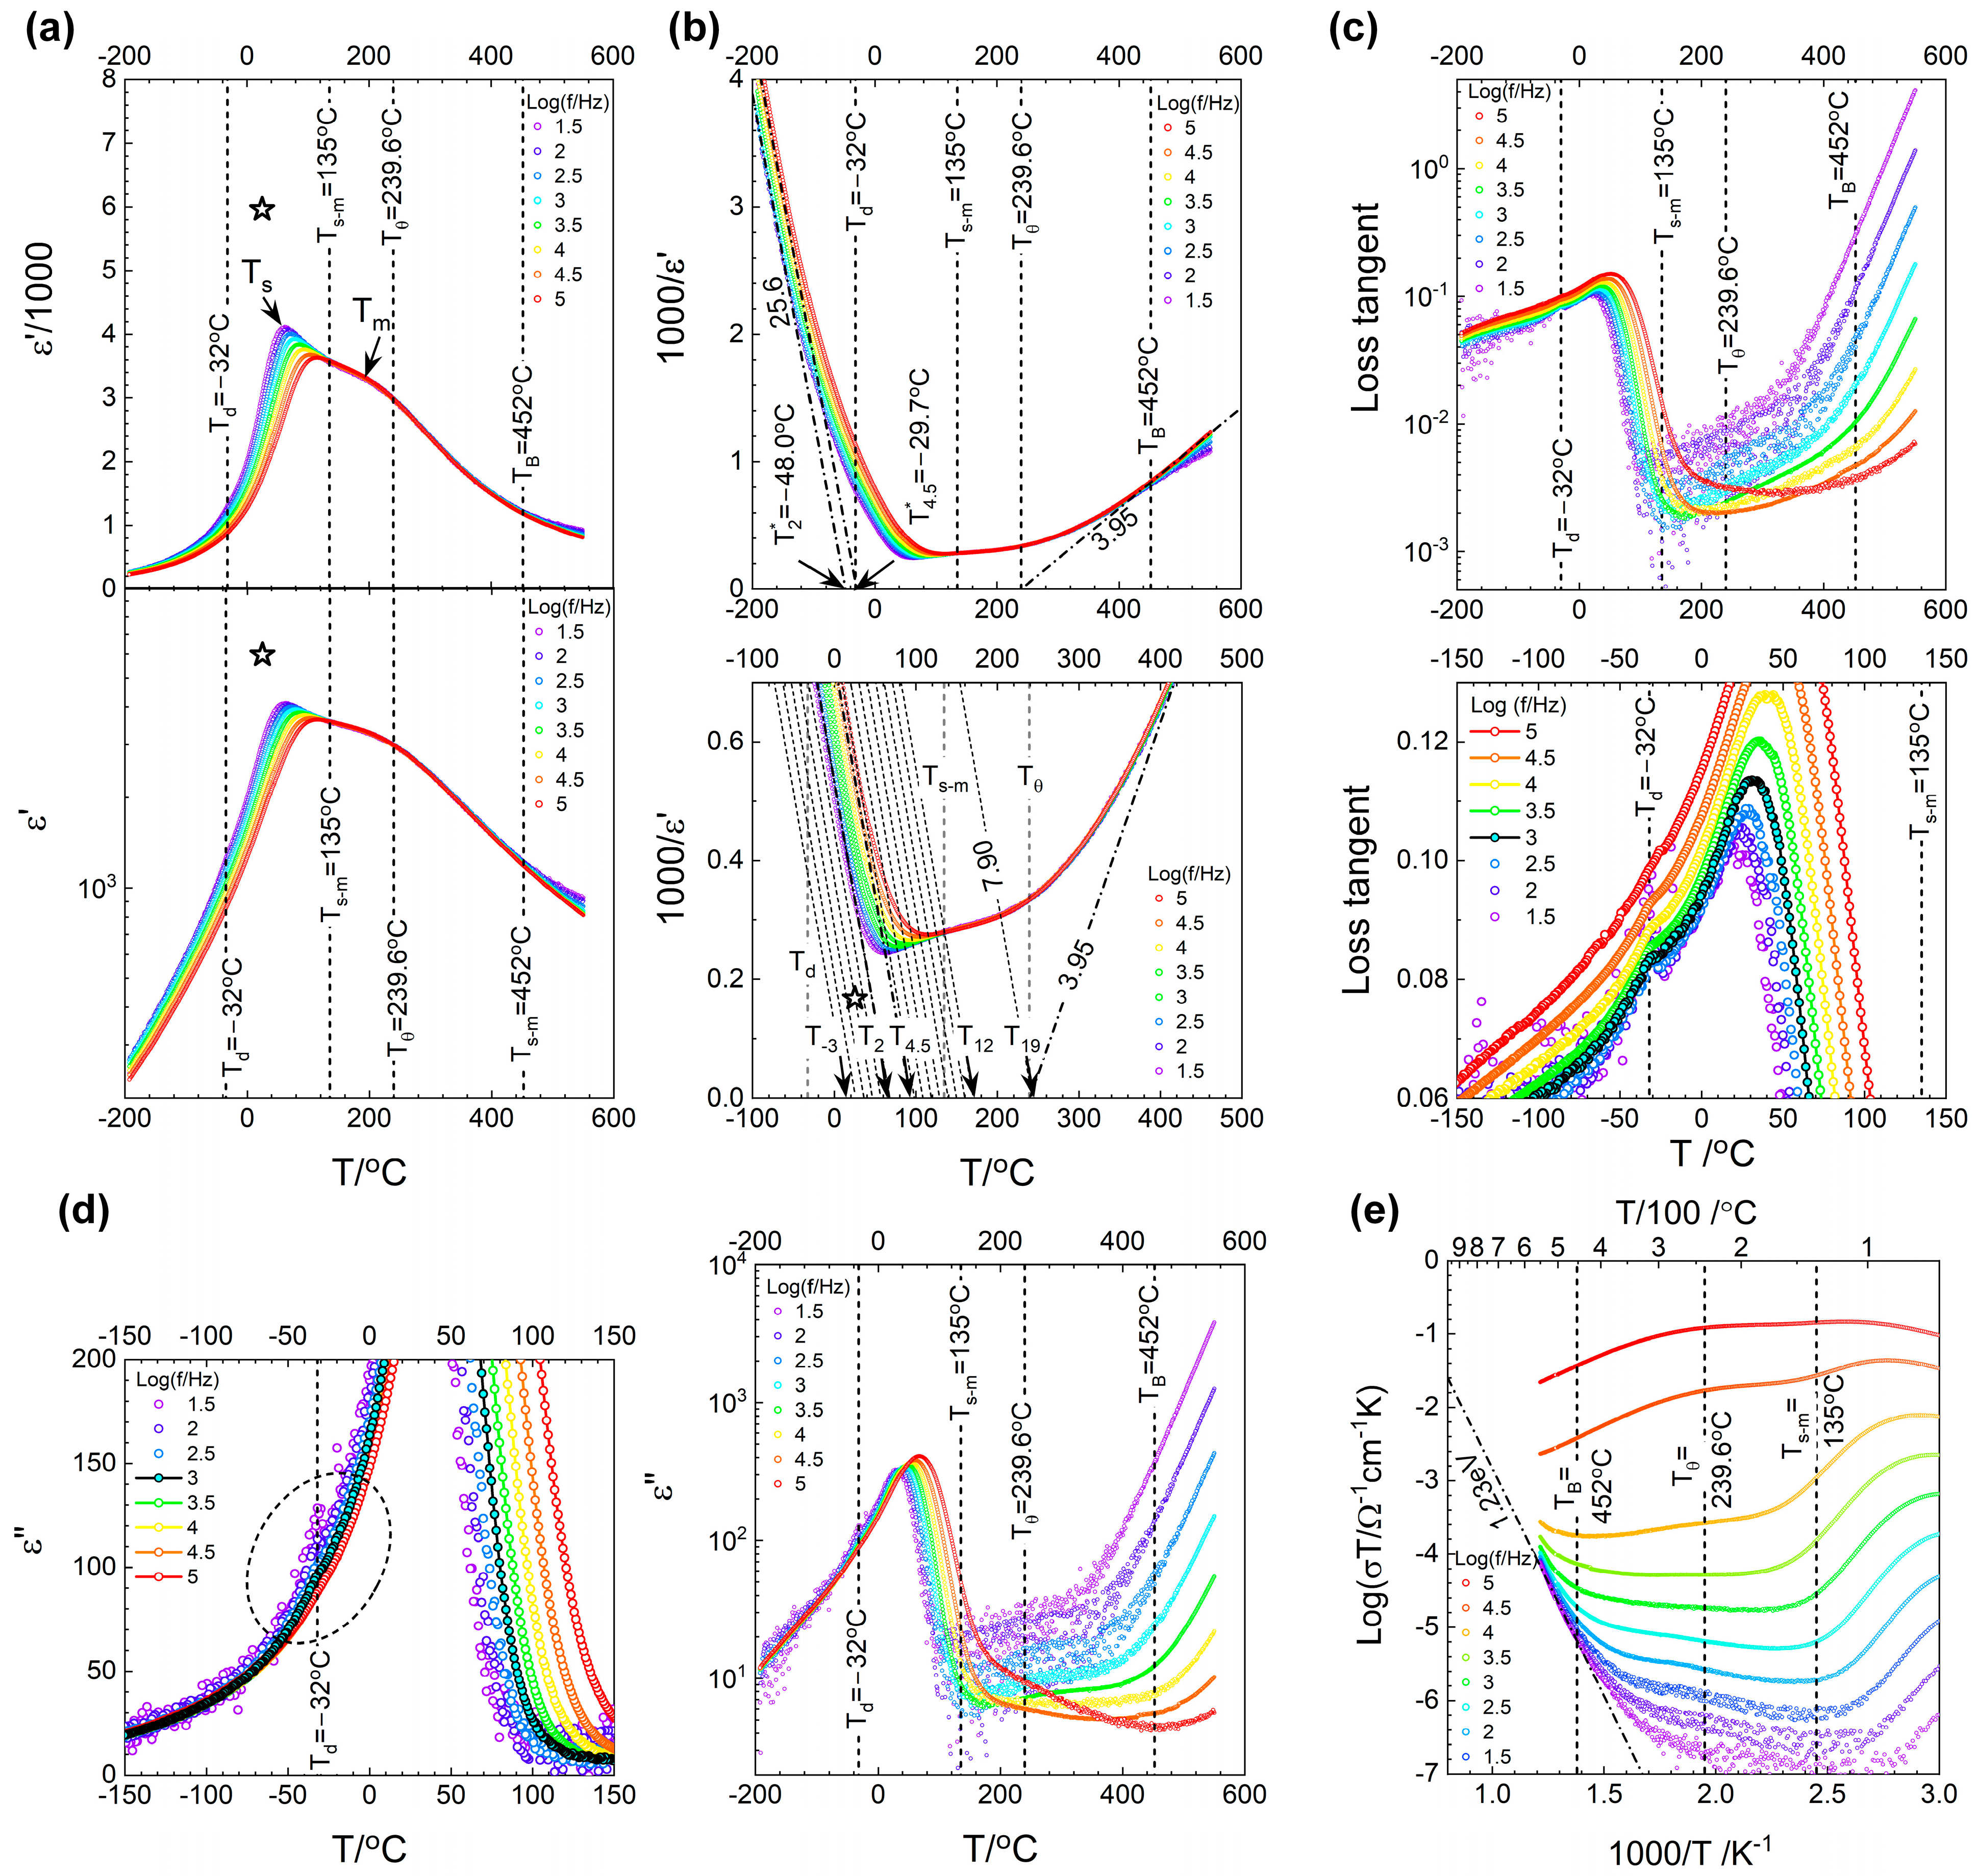
3.7. Dielectric Properties
4. Conclusions
Author Contributions
Funding
Data Availability Statement
Acknowledgments
Conflicts of Interest
References
- Rödel, J.; Jo, W.; Seifert, K.T.P.; Anton, E.M.; Granzow, T.; Damjanovic, D. Perspective on the Development of Lead-free Piezoceramics. J. Am. Ceram. Soc. 2009, 92, 1153–1177. [Google Scholar] [CrossRef]
- Kurihara, K.; Kondo, M. High-strain piezoelectric ceramics and applications to actuators. Ceram. Int. 2008, 34, 695–699. [Google Scholar] [CrossRef]
- Haertling, G.H. Ferroelectric Ceramics: History and Technology. In Ferroelectricity: The Fundamentals Collection; Gonzalo, J.A., Jiménez, B., Eds.; Wiley-VCH Verlag GmbH & Co. KGaA: Weinheim, Germany, 2005; pp. 157–178. [Google Scholar] [CrossRef]
- Jo, W.; Dittmer, R.; Acosta, M.; Zang, J.; Groh, C.; Sapper, E.; Wang, K.; Rödel, J. Giant electric-field-induced strains in lead-free ceramics for actuator applications—Status and perspective. J. Electroceram. 2012, 29, 71–93. [Google Scholar] [CrossRef]
- Gao, X.; Yang, J.; Wu, J.; Xin, X.; Li, Z.; Yuan, X.; Shen, X.; Dong, S. Piezoelectric Actuators and Motors: Materials, Designs, and Applications. Adv. Mater. Technol. 2020, 5, 1900716. [Google Scholar] [CrossRef]
- Wu, J. Advances in Lead-Free Piezoelectric Materials; Springer Nature Singapore Pte Ltd.: Singapore, 2018. [Google Scholar]
- Jones, G.O.; Thomas, P.A. Investigation of the structure and phase transitions in the novel A-site substituted distorted perovskite compound Na0.5Bi0.5TiO3. Acta Crystallogr. Sect. B 2002, 58, 168–178. [Google Scholar] [CrossRef] [PubMed]
- Aksel, E.; Forrester, J.S.; Jones, J.L.; Thomas, P.A.; Page, K.; Suchomel, M.R. Monoclinic crystal structure of polycrystalline Na0.5Bi0.5TiO3. Appl. Phys. Lett. 2011, 98, 152901. [Google Scholar] [CrossRef]
- Parija, B.; Badapanda, T.; Panigrahi, S.; Sinha, T.P. Ferroelectric and piezoelectric properties of (1 − x) (Bi0.5Na0.5)TiO3–xBaTiO3 ceramics. J. Mater. Sci. Mater. Electron. 2012, 24, 402–410. [Google Scholar] [CrossRef]
- Zhang, Y.R.; Li, J.F.; Zhang, B.P. Enhancing Electrical Properties in NBT–KBT Lead-Free Piezoelectric Ceramics by Optimizing Sintering Temperature. J. Am. Ceram. Soc. 2008, 91, 2716–2719. [Google Scholar] [CrossRef]
- Guo, Y.; Gu, M.; Luo, H.; Liu, Y.; Withers, R.L. Composition-induced antiferroelectric phase and giant strain in lead-free (Nay,Biz)Ti1−xO3(1−x)-xBaTiO3 ceramics. Phys. Rev. B 2011, 83, 054118. [Google Scholar] [CrossRef]
- Hiruma, Y.; Nagata, H.; Takenaka, T. Thermal depoling process and piezoelectric properties of bismuth sodium titanate ceramics. J. Appl. Phys. 2009, 105, 084112. [Google Scholar] [CrossRef]
- Hiruma, Y.; Imai, Y.; Watanabe, Y.; Nagata, H.; Takenaka, T. Large electrostrain near the phase transition temperature of (Bi0.5Na0.5)TiO3–SrTiO3 ferroelectric ceramics. Appl. Phys. Lett. 2008, 92, 262904. [Google Scholar] [CrossRef]
- Guo, Y.; Liu, Y.; Withers, R.L.; Brink, F.; Chen, H. Large Electric Field-Induced Strain and Antiferroelectric Behavior in (1 − x)(Na0.5Bi0.5)TiO3-xBaTiO3 Ceramics. Chem. Mater. 2011, 23, 219–228. [Google Scholar] [CrossRef]
- Teranishi, S.; Suzuki, M.; Noguchi, Y.; Miyayama, M.; Moriyoshi, C.; Kuroiwa, Y.; Tawa, K.; Mori, S. Giant strain in lead-free (Bi0.5Na0.5)TiO3-based single crystals. Appl. Phys. Lett. 2008, 92, 182905. [Google Scholar] [CrossRef]
- Liu, X.; Tan, X. Giant Strains in Non-Textured (Bi1/2Na1/2)TiO3-Based Lead-Free Ceramics. Adv. Mater. 2016, 28, 574–578. [Google Scholar] [CrossRef]
- Sheng, J.; Cao, W.P.; Li, W.L.; Lin, Q.R.; Li, M.L.; Hou, X.; Fei, W.D. Giant strain performance of lead-free relaxor piezoceramics through synergistic compositional and defect engineering. Chem. Eng. J. 2023, 475, 145989. [Google Scholar] [CrossRef]
- Li, F.; Jin, L.; Xu, Z.; Zhang, S. Electrostrictive effect in ferroelectrics: An alternative approach to improve piezoelectricity. Appl. Phys. Rev. 2014, 1, 011103. [Google Scholar] [CrossRef]
- Khan, N.U.; Yun, W.S.; Ullah, A.; Ali, S.; Sheeraz, M.; Ullah, A.; Kim, I.W.; Ahn, C.W. Large electrostrictive response via tailoring ergodic relaxor state in Bi1/2Na1/2TiO3-based ceramics with Bi(Mn1/2Ce1/2)O3 end-member. Ceram. Int. 2024, 50, 8790–8799. [Google Scholar] [CrossRef]
- Zhang, S.-T.; Kounga, A.B.; Jo, W.; Jamin, C.; Seifert, K.; Granzow, T.; Rödel, J.; Damjanovic, D. High-Strain Lead-free Antiferroelectric Electrostrictors. Adv. Mater. 2009, 21, 4716–4720. [Google Scholar] [CrossRef]
- Ullah, A.; Gul, H.B.; Ullah, A.; Sheeraz, M.; Bae, J.-S.; Jo, W.; Ahn, C.W.; Kim, I.W.; Kim, T.H. Giant room-temperature electrostrictive coefficients in lead-free relaxor ferroelectric ceramics by compositional tuning. APL Mater. 2018, 6, 016104. [Google Scholar] [CrossRef]
- Yao, K.; Zhou, C.; Li, Q.; Xiao, Z.; Yuan, C.; Xu, J.; Chen, G.; Rao, G. Large electrostrictive coefficient with optimized Electro-Strain in BNT-based ceramics with ergodic state. Mater. Sci. Eng. B 2022, 283, 115828. [Google Scholar] [CrossRef]
- Jing, R.; Hu, Q.; Zhang, L.; Sun, Y.; Wu, J.; Alikin, D.O.; Shur, V.Y.; Wei, X.; Du, H.; Chang, Y.; et al. Ultra-slim electrostrains with superior temperature-stability in lead-free sodium niobate-based ferroelectric perovskite. J. Mater. 2022, 8, 1230–1238. [Google Scholar] [CrossRef]
- Duraisamy, D.; Venkatesan, G.N. Compositionally driven giant strain and electrostrictive co-efficient in lead free NBT-BT-BFO system. Appl. Phys. Lett. 2018, 112, 052903. [Google Scholar] [CrossRef]
- Swain, S.; Kumar Kar, S.; Kumar, P. Dielectric, optical, piezoelectric and ferroelectric studies of NBT–BT ceramics near MPB. Ceram. Int. 2015, 41, 10710–10717. [Google Scholar] [CrossRef]
- Zhang, Q.; Zhao, X.; Sun, R.; Luo, H. Crystal growth and electric properties of lead-free NBT-BT at compositions near the morphotropic phase boundary. Phys. Status Solidi (A) 2011, 208, 1012–1020. [Google Scholar] [CrossRef]
- Lv, J.; Li, Q.; Li, Y.; Tang, M.; Jin, D.; Yan, Y.; Fan, B.; Jin, L.; Liu, G. Significantly improved energy storage performance of NBT-BT based ceramics through domain control and preparation optimization. Chem. Eng. J. 2021, 420, 129900. [Google Scholar] [CrossRef]
- Kanuru, S.R.; Baskar, K.; Dhanasekaran, R. Synthesis, structural, morphological and electrical properties of NBT–BT ceramics for piezoelectric applications. Ceram. Int. 2016, 42, 6054–6064. [Google Scholar] [CrossRef]
- Liu, K.; Zhang, Y.; Marwat, M.A.; Wang, G.; Wang, D.; Ma, W.; Wei, T.; Li, M.; Xu, J.; Yang, H.; et al. Large electrostrain in low-temperature sintered NBT-BT-0.025FN incipient piezoceramics. J. Am. Ceram. Soc. 2020, 103, 3739–3747. [Google Scholar] [CrossRef]
- Sapper, E.; Novak, N.; Jo, W.; Granzow, T.; Rödel, J. Electric-field–temperature phase diagram of the ferroelectric relaxor system (1 − x)Bi1/2Na1/2TiO3 − xBaTiO3 doped with manganese. J. Appl. Phys. 2014, 115, 194104. [Google Scholar] [CrossRef]
- Wang, F.; Xu, M.; Tang, Y.; Wang, T.; Shi, W.; Leung, C.M. Large Strain Response in the Ternary Bi0.5Na0.5TiO3–BaTiO3–SrTiO3 Solid Solutions. J. Am. Ceram. Soc. 2012, 95, 1955–1959. [Google Scholar] [CrossRef]
- Wang, F.; Jin, C.; Yao, Q.; Shi, W. Large electrostrictive effect in ternary Bi0.5Na0.5TiO3-based solid solutions. J. Appl. Phys. 2013, 114, 027004. [Google Scholar] [CrossRef]
- Zang, J.; Li, M.; Sinclair, D.C.; Jo, W.; Rödel, J. Impedance Spectroscopy of (Bi1/2Na1/2)TiO3–BaTiO3 Ceramics Modified with (K0.5Na0.5)NbO3. J. Am. Ceram. Soc. 2014, 97, 1523–1529. [Google Scholar] [CrossRef]
- Le, P.G.; Pham, T.L.; Nguyen, D.T.; Lee, J.S.; Fisher, J.G.; Kim, H.P.; Jo, W. Solid state crystal growth of single crystals of 0.75(Na1/2Bi1/2)TiO3-0.25SrTiO3 and their characteristic electrical properties. J. Asian Ceram. Soc. 2021, 9, 40–51. [Google Scholar] [CrossRef]
- Bai, W.; Xi, J.; Zhang, J.; Shen, B.; Zhai, J.; Yan, H. Effect of different templates on structure evolution and large strain response under a low electric field in <001>-textured lead-free BNT-based piezoelectric ceramics. J. Eur. Ceram. Soc. 2015, 35, 2489–2499. [Google Scholar] [CrossRef]
- Zhou, X.; Yang, H.; Xue, G.; Luo, H.; Zhang, D. Optimized strain performance in <001>-textured Bi0.5Na0.5TiO3-based ceramics with ergodic relaxor state and core—Shell microstructure. J. Adv. Ceram. 2022, 11, 1542–1558. [Google Scholar] [CrossRef]
- Hussain, A.; Maqbool, A.; Malik, R.A.; Ahmed, T.; Lee, S.; Kim, M.-H. Texture performance of lead-free Bi1/2Na1/2TiO3–BaZrO3 ceramics. Ceram. Int. 2023, 49, 10073–10082. [Google Scholar] [CrossRef]
- Gao, F.; Hong, R.-Z.; Liu, J.-J.; Yao, Y.-H.; Tian, C.-S. Effect of different templates on microstructure of textured Na0.5Bi0.5TiO3–BaTiO3 ceramics with RTGG method. J. Eur. Ceram. Soc. 2008, 28, 2063–2070. [Google Scholar] [CrossRef]
- Jiang, C.; Zhou, X.; Zhou, K.; Chen, C.; Luo, H.; Yuan, X.; Zhang, D. Grain oriented Na0.5Bi0.5TiO3-BaTiO3 ceramics with giant strain response derived from single-crystalline Na0.5Bi0.5TiO3-BaTiO3 templates. J. Eur. Ceram. Soc. 2016, 36, 1377–1383. [Google Scholar] [CrossRef]
- Liu, K.; Ma, W.; Ben, N.; Zhu, H.; Xu, W.; Gao, H.; Samart, C.; Kongparakul, S.; Zhang, H.; Tan, H. Superior Large-Signal Piezoelectric Coefficient in Textured NBT-Based Piezoceramics by Template-Induced Structure and Composition Modulation. ACS Appl. Mater. Interfaces 2023, 15, 24595–24605. [Google Scholar] [CrossRef]
- Bai, W.; Chen, D.; Zheng, P.; Xi, J.; Zhou, Y.; Shen, B.; Zhai, J.; Ji, Z. NaNbO3 templates-induced phase evolution and enhancement of electromechanical properties in <00l> grain oriented lead-free BNT-based piezoelectric materials. J. Eur. Ceram. Soc. 2017, 37, 2591–2604. [Google Scholar] [CrossRef]
- Ahn, C.W.; Choi, G.; Kim, I.W.; Lee, J.S.; Wang, K.; Hwang, Y.; Jo, W. Forced electrostriction by constraining polarization switching enhances the electromechanical strain properties of incipient piezoceramics. NPG Asia Mater. 2017, 9, e346. [Google Scholar] [CrossRef]
- Chang, Y.; Yang, Z.; Chao, X.; Liu, Z.; Wang, Z. Synthesis and morphology of anisotropic NaNbO3 seed crystals. Mater. Chem. Phys. 2008, 111, 195–200. [Google Scholar] [CrossRef]
- Zhang, M.; Fan, H.; Chen, L.; Yang, C. Synthesis and formation mechanisms of high aspect ratio platelike NaNbO3 particles by topochemical microcrystal conversion. J. Alloys Compd. 2009, 476, 847–853. [Google Scholar] [CrossRef]
- Mathur, L.; Bae, H.; Namgung, Y.; Park, J.-Y.; Song, S.-J. Flow behavior of gadolinium doped ceria under different polymeric and hydrodynamic environment for tape casting application. Korean J. Chem. Eng. 2022, 39, 2991–3002. [Google Scholar] [CrossRef]
- Lotgering, F.K. Topotactical reactions with ferrimagnetic oxides having hexagonal crystal structures—I. J. Inorg. Nucl. Chem. 1959, 9, 113–123. [Google Scholar] [CrossRef]
- Moriana, A.D.; Zhang, S. Lead-free textured piezoceramics using tape casting: A review. J. Mater. 2018, 4, 277–303. [Google Scholar] [CrossRef]
- Park, S.-E.; Shrout, T.R. Ultrahigh strain and piezoelectric behavior in relaxor based ferroelectric single crystals. J. Appl. Phys. 1997, 82, 1804–1811. [Google Scholar] [CrossRef]
- Chen, C.; Wang, Y.; Jiang, X.; Tu, N.; Chen, Y.; Zhou, S.; Xia, X.; Shen, Z.; Luo, H. Orientation dependence of electric field induced phase transitions in lead-free (Na0.5Bi0.5)TiO3-based single crystals. J. Am. Ceram. Soc. 2019, 102, 4306–4313. [Google Scholar] [CrossRef]
- Ge, W.; Liu, H.; Zhao, X.; Li, X.; Pan, X.; Lin, D.; Xu, H.; Jiang, X.; Luo, H. Orientation dependence of electrical properties of 0.96Na0.5Bi0.5TiO3-0.04BaTiO3 lead-free piezoelectric single crystal. Appl. Phys. A 2009, 95, 761–767. [Google Scholar] [CrossRef]
- Yu, H.-L.; Ko, N.-R.; Choi, W.-J.; Zate, T.T.; Jo, W. A Brief Review of Some Challenging Issues in Textured Piezoceramics via Templated Grain Growth Method. J. Sens. Sci. Technol. 2023, 32, 10–15. [Google Scholar] [CrossRef]
- Zhao, W.; Ya, J.; Xin, Y.; E, L.; Zhao, D.; Zhou, H. Fabrication of Na0.5Bi0.5TiO3–BaTiO3-Textured Ceramics Templated by Plate-Like Na0.5Bi0.5TiO3 Particles. J. Am. Ceram. Soc. 2009, 92, 1607–1609. [Google Scholar] [CrossRef]
- Bai, W.; Chen, D.; Zheng, P.; Zhang, J.; Shen, B.; Zhai, J.; Ji, Z. Grain-orientated lead-free BNT-based piezoceramics with giant electrostrictive effect. Ceram. Int. 2017, 43, 3339–3345. [Google Scholar] [CrossRef]
- Zeng, J.T.; Kwok, K.W.; Tam, W.K.; Tian, H.Y.; Jiang, X.P.; Chan, H.L.W. Plate-Like Na0.5Bi0.5TiO3 Template Synthesized by a Topochemical Method. J. Am. Ceram. Soc. 2006, 89, 3850–3853. [Google Scholar] [CrossRef]
- Kimura, T.; Takahashi, T.; Tani, T.; Saito, Y. Preparation of crystallographically textured Bi0.5Na0.5TiO3–BaTiO3 ceramics by reactive-templated grain growth method. Ceram. Int. 2004, 30, 1161–1167. [Google Scholar] [CrossRef]
- Kong, S.; Kumar, N.; Checchia, S.; Cazorla, C.; Daniels, J. Defect-Driven Structural Distortions at the Surface of Relaxor Ferroelectrics. Adv. Funct. Mater. 2019, 29, 1900344. [Google Scholar] [CrossRef]
- Kumar, N.; Kong, S.; Sharma, P.; Shi, X.; Vats, G.; Checchia, S.; Seidel, J.; Hoffman, M.; Daniels, J. Functional surface layers in relaxor ferroelectrics. J. Mater. Chem. C 2020, 8, 7663–7671. [Google Scholar] [CrossRef]
- Zhang, D.; Zhang, S.; Yuan, X.; Zhou, X.; Qi, H.; Yan, M.; Yan, Z.; Zhou, K. Enhanced piezoelectric properties in textured NaNbO3–BaTiO3–SrZrO3 ceramics by templated grain growth. J. Alloys Compd. 2020, 843, 155865. [Google Scholar] [CrossRef]
- Chang, Y.; Sun, Y.; Wu, J.; Wang, X.; Zhang, S.; Yang, B.; Messing, G.L.; Cao, W. Formation mechanism of highly [001]c textured Pb(In1/2Nb1/2)O3-Pb(Mg1/3Nb2/3)O3-PbTiO3 relaxor ferroelectric ceramics with giant piezoelectricity. J. Eur. Ceram. Soc. 2016, 36, 1973–1981. [Google Scholar] [CrossRef]
- Maurya, D.; Zhou, Y.; Yan, Y.; Priya, S. Synthesis mechanism of grain-oriented lead-free piezoelectric Na0.5Bi0.5TiO3-BaTiO3 ceramics with giant piezoelectric response. J. Mater. Chem. C 2013, 1, 2102–2111. [Google Scholar] [CrossRef]
- Salimkhani, H.; Fulanović, L.; Frömling, T. Sinterability of sodium bismuth titanate-based electroceramics at low temperatures. J. Eur. Ceram. Soc. 2024, 44, 1570–1580. [Google Scholar] [CrossRef]
- Sung, Y.S.; Kim, J.M.; Cho, J.H.; Song, T.K.; Kim, M.H.; Chong, H.H.; Park, T.G.; Do, D.; Kim, S.S. Effects of Na nonstoichiometry in (Bi0.5Na0.5+x)TiO3 ceramics. Appl. Phys. Lett. 2010, 96, 022901. [Google Scholar] [CrossRef]
- Gadelmawla, A.; Riess, K.; Birkenstock, J.; Hinterstein, M.; Webber, K.G.; Khansur, N.H. Effect of varying Bi content on the temperature-dependent mechanical, dielectric, and structural properties of nominal Na1/2Bi1/2TiO3. J. Appl. Phys. 2021, 130, 185106. [Google Scholar] [CrossRef]
- Zhang, A.; Jing, R.; Zhuang, M.; Hou, H.; Zhang, L.; Zhang, J.; Lu, X.; Yan, Y.; Du, H.; Jin, L. Nonstoichiometric effect of A-site complex ions on structural, dielectric, ferroelectric, and electrostrain properties of bismuth sodium titanate ceramics. Ceram. Int. 2021, 47, 32747–32755. [Google Scholar] [CrossRef]
- Li, L.; Li, M.; Zhang, H.; Reaney, I.M.; Sinclair, D.C. Controlling mixed conductivity in Na1/2Bi1/2TiO3 using A-site non-stoichiometry and Nb-donor doping. J. Mater. Chem. C 2016, 4, 5779–5786. [Google Scholar] [CrossRef]
- Han, J.; Yin, J.; Wu, J. BNT-based ferroelectric ceramics: Electrical properties modification by Ta2O5 oxide addition. J. Am. Ceram. Soc. 2020, 103, 412–422. [Google Scholar] [CrossRef]
- Craciun, F.; Galassi, C.; Birjega, R. Electric-field-induced and spontaneous relaxor-ferroelectric phase transitions in (Na1/2Bi1/2)1−xBaxTiO3. J. Appl. Phys. 2012, 112, 124106. [Google Scholar] [CrossRef]
- Jin, L.; Li, F.; Zhang, S. Decoding the Fingerprint of Ferroelectric Loops: Comprehension of the Material Properties and Structures. J. Am. Ceram. Soc. 2014, 97, 1–27. [Google Scholar] [CrossRef]
- Liu, G.; Dong, J.; Zhang, L.; Yan, Y.; Jing, R.; Jin, L. Phase evolution in (1 − x)(Na0.5Bi0.5)TiO3-xSrTiO3 solid solutions: A study focusing on dielectric and ferroelectric characteristics. J. Mater. 2020, 6, 677–691. [Google Scholar] [CrossRef]
- Liu, X.; Shen, B.; Zhai, J. Designing novel sodium bismuth titanate lead-free incipient perovskite for piezoactuator applications. J. Am. Ceram. Soc. 2019, 102, 6751–6759. [Google Scholar] [CrossRef]
- Dittmer, R.; Gobeljic, D.; Jo, W.; Shvartsman, V.V.; Lupascu, D.C.; Jones, J.L.; Rödel, J. Ergodicity reflected in macroscopic and microscopic field-dependent behavior of BNT-based relaxors. J. Appl. Phys. 2014, 115, 084111. [Google Scholar] [CrossRef]
- Le, P.G.; Tran, T.L.; Kim, H.P.; Jo, W.; Lee, J.S.; Fisher, J.G. Growth of single crystals of 0.75(Na0.5Bi0.5)TiO3-0.25(Sr0.7Ca0.3)TiO3 and characterisation of their electrical properties. Open Ceram. 2021, 6, 100099. [Google Scholar] [CrossRef]
- Bai, W.; Li, L.; Wang, W.; Shen, B.; Zhai, J. Phase diagram and electrostrictive effect in BNT-based ceramics. Solid State Commun. 2015, 206, 22–25. [Google Scholar] [CrossRef]
- Shi, J.; Fan, H.; Liu, X.; Bell, A.J. Large Electrostrictive Strain in (Bi0.5Na0.5)TiO3–BaTiO3–(Sr0.7Bi0.2)TiO3 Solid Solutions. J. Am. Ceram. Soc. 2014, 97, 848–853. [Google Scholar] [CrossRef]
- Wu, J.; Zhang, H.; Huang, C.-H.; Tseng, C.-W.; Meng, N.; Koval, V.; Chou, Y.-C.; Zhang, Z.; Yan, H. Ultrahigh field-induced strain in lead-free ceramics. Nano Energy 2020, 76, 105037. [Google Scholar] [CrossRef]
- Singha, A.; Praharaj, S.; Rout, S.K.; Rout, D. Composition dependent crossover from ferroelectric to relaxor-ferroelectric in NBT-ST-KNN ceramics. Curr. Appl. Phys. 2022, 36, 160–170. [Google Scholar] [CrossRef]
- Ullah, A.; Malik, R.A.; Ullah, A.; Lee, D.S.; Jeong, S.J.; Lee, J.S.; Kim, I.W.; Ahn, C.W. Electric-field-induced phase transition and large strain in lead-free Nb-doped BNKT-BST ceramics. J. Eur. Ceram. Soc. 2014, 34, 29–35. [Google Scholar] [CrossRef]
- Deng, A.; Wu, J. Optimized strain properties with small hysteresis in BNT-based ceramics with ergodic relaxor state. J. Eur. Ceram. Soc. 2021, 41, 5147–5154. [Google Scholar] [CrossRef]
- Bai, W.; Wang, L.; Zheng, P.; Wen, F.; Yuan, Y.; Ding, M.; Chen, D.; Zhai, J.; Ji, Z. Large electrostrictive effect in lead-free (Bi.5Na.5)TiO3-based composite piezoceramics. Ceram. Int. 2018, 44, 8628–8634. [Google Scholar] [CrossRef]
- Hao, J.; Xu, Z.; Chu, R.; Li, W.; Fu, P.; Du, J.; Li, G. Large electrostrictive effect and strong photoluminescence in rare-earth modified lead-free (Bi0.5Na0.5)TiO3-based piezoelectric ceramics. Scr. Mater. 2016, 122, 10–13. [Google Scholar] [CrossRef]
- Ang, C.; Yu, Z. High, Purely Electrostrictive Strain in Lead-Free Dielectrics. Adv. Mater. 2006, 18, 103–106. [Google Scholar] [CrossRef]
- Li, F.; Jin, L.; Guo, R. High electrostrictive coefficient Q33 in lead-free Ba(Zr0.2Ti0.8)O3-x(Ba0.7Ca0.3)TiO3 piezoelectric ceramics. Appl. Phys. Lett. 2014, 105, 232903. [Google Scholar] [CrossRef]
- Li, F.; Jin, L.; Xu, Z.; Wang, D.; Zhang, S. Electrostrictive effect in Pb(Mg1/3Nb2/3)O3-xPbTiO3 crystals. Appl. Phys. Lett. 2013, 102, 152910. [Google Scholar] [CrossRef]
- Hao, J.; Xu, Z.; Chu, R.; Li, W.; Fu, P.; Du, J.; Li, G. Structure evolution and electrostrictive properties in (Bi0.5Na0.5)0.94Ba0.06TiO3–M2O5 (M=Nb, Ta, Sb) lead-free piezoceramics. J. Eur. Ceram. Soc. 2016, 36, 4003–4014. [Google Scholar] [CrossRef]
- Tran, V.D.N.; Dinh, T.H.; Han, H.-S.; Jo, W.; Lee, J.-S. Lead-free Bi1/2(Na0.82K0.18)1/2TiO3 relaxor ferroelectrics with temperature insensitive electrostrictive coefficient. Ceram. Int. 2013, 39, S119–S124. [Google Scholar] [CrossRef]
- Yang, S.; Li, J.; Liu, Y.; Wang, M.; Qiao, L.; Gao, X.; Chang, Y.; Du, H.; Xu, Z.; Zhang, S.; et al. Textured ferroelectric ceramics with high electromechanical coupling factors over a broad temperature range. Nat. Commun. 2021, 12, 1414. [Google Scholar] [CrossRef]
- Qi, H.; Zuo, R. Giant electrostrictive strain in (Bi0.5Na0.5)TiO3–NaNbO3 lead-free relaxor antiferroelectrics featuring temperature and frequency stability. J. Mater. Chem. A 2020, 8, 2369–2375. [Google Scholar] [CrossRef]
- Li, F.; Xu, Z.; Zhang, S. The effect of polar nanoregions on electromechanical properties of relaxor-PbTiO3 crystals: Extracting from electric-field-induced polarization and strain behaviors. Appl. Phys. Lett. 2014, 105, 122904. [Google Scholar] [CrossRef]
- Cao, W.P.; Sheng, J.; Qiao, Y.L.; Jing, L.; Liu, Z.; Wang, J.; Li, W.L. Optimized strain with small hysteresis and high energy-storage density in Mn-doped NBT-ST system. J. Eur. Ceram. Soc. 2019, 39, 4046–4052. [Google Scholar] [CrossRef]
- Cao, W.; Li, W.; Feng, Y.; Bai, T.; Qiao, Y.; Hou, Y.; Zhang, T.; Yu, Y.; Fei, W. Defect dipole induced large recoverable strain and high energy-storage density in lead-free Na0.5Bi0.5TiO3-based systems. Appl. Phys. Lett. 2016, 108, 202902. [Google Scholar] [CrossRef]
- Zhang, S.-T.; Yan, F.; Yang, B.; Cao, W. Phase diagram and electrostrictive properties of Bi0.5Na0.5TiO3–BaTiO3–K0.5Na0.5NbO3 ceramics. Appl. Phys. Lett. 2010, 97, 122901. [Google Scholar] [CrossRef]
- Hao, J.; Xu, Z.; Chu, R.; Li, W.; Du, J. Lead-free electrostrictive (Bi0.5Na0.5)TiO3–(Bi0.5K0.5)TiO3–(K0.5Na0.5)NbO3 ceramics with good thermostability and fatigue-free behavior. J. Mater. Sci. 2015, 50, 5328–5336. [Google Scholar] [CrossRef]
- Liu, X.; Xue, S.; Ma, J.; Zhai, J.; Shen, B.; Wang, F.; Zhao, X.; Yan, H. Electric-field-induced local distortion and large electrostrictive effects in lead-free NBT-based relaxor ferroelectrics. J. Eur. Ceram. Soc. 2018, 38, 4631–4639. [Google Scholar] [CrossRef]
- Tang, X.; Liu, L.; Guo, L.; Li, L.; Guo, Y.; Guan, Q.; Ren, M.; Hao, J.; Li, W. High-temperature and long-term stability in Co/Sb-codoped (Bi0.5Na0.5)TiO3-based electrostrictive ceramics. J. Alloys Compd. 2021, 876, 160202. [Google Scholar] [CrossRef]
- Liu, X.; Zhao, Y.; Shi, J.; Du, H.; Xu, X.; Lu, H.; Che, J.; Li, X. Improvement of dielectric and ferroelectric properties in bismuth sodium titanate based relaxors through Bi non-stoichiometry. J. Alloys Compd. 2019, 799, 231–238. [Google Scholar] [CrossRef]
- Praharaj, S.; Rout, D.; Kang, S.J.L.; Kim, I.W. Large electric field induced strain in a new lead-free ternary Na0.5Bi0.5TiO3-SrTiO3-BaTiO3 solid solution. Mater. Lett. 2016, 184, 197–199. [Google Scholar] [CrossRef]
- Zhang, H.; Xu, P.; Patterson, E.; Zang, J.; Jiang, S.; Rödel, J. Preparation and enhanced electrical properties of grain-oriented (Bi1/2Na1/2)TiO3-based lead-free incipient piezoceramics. J. Eur. Ceram. Soc. 2015, 35, 2501–2512. [Google Scholar] [CrossRef]
- Sung, Y.S.; Kim, J.M.; Cho, J.H.; Song, T.K.; Kim, M.H.; Park, T.G. Effects of Bi nonstoichiometry in (Bi0.5+xNa) TiO3 ceramics. Appl. Phys. Lett. 2011, 98, 012902. [Google Scholar] [CrossRef]
- Mishra, A.; Khatua, D.K.; De, A.; Majumdar, B.; Frömling, T.; Ranjan, R. Structural mechanism behind piezoelectric enhancement in off-stoichiometric Na0.5Bi0.5TiO3 based lead-free piezoceramics. Acta Mater. 2019, 164, 761–775. [Google Scholar] [CrossRef]
- Shvartsman, V.V.; Lupascu, D.C. Lead-Free Relaxor Ferroelectrics. J. Am. Ceram. Soc. 2012, 95, 1–26. [Google Scholar] [CrossRef]
- Jo, W.; Schaab, S.; Sapper, E.; Schmitt, L.A.; Kleebe, H.J.; Bell, A.J.; Rödel, J. On the phase identity and its thermal evolution of lead free (Bi1/2Na1/2)TiO3-6 mol% BaTiO3. J. Appl. Phys. 2011, 110, 074106. [Google Scholar] [CrossRef]
- Fisher, J.G.; Sim, S.-H.; Ðoàn, T.T.; Uwiragiye, E.; Mok, J.; Lee, J. Comparison of (K0.5Na0.5)NbO3 Single Crystals Grown by Seed-Free and Seeded Solid-State Single Crystal Growth. Materials 2023, 16, 3638. [Google Scholar] [CrossRef] [PubMed]
- Uwiragiye, E.; Pham, T.L.; Lee, J.-S.; Lee, B.-W.; Ko, J.-H.; Fisher, J.G. 0.98(K0.5Na0.5)NbO3–0.02(Bi0.5Na0.5)(Zr0.85Sn0.15)O3 Single Crystals Grown by the Seed-Free Solid-State Crystal Growth Method and Their Characterization. Ceramics 2024, 7, 840–857. [Google Scholar] [CrossRef]
- Fridkin, V.M. Thermodynamics of Ferroelectric Semiconductors. In Ferroelectric Semiconductors; Consultants Bureau: New York, NY, USA, 1980; Chapter 1; pp. 1–21. [Google Scholar]
- Landau, L.D.; Lifshitz, E.M. Chapter XIV—Phase Transitions of the Second Kind and Critical Phenomena. In Statistical Physics, 3rd ed.; Landau, L.D., Lifshitz, E.M., Eds.; Butterworth-Heinemann: Pergamon, Turkey, 1980; Volume 5, pp. 446–516. [Google Scholar]
- Fisher, J.G.; Park, H.Y.; Song, Y.O.; Baek, S.J.; Vu, H.; Kim, J.H.; Kim, Y.H.; Lee, J.S. Sintering, microstructure and electrical properties of 0.4(Bi0.5K0.5)TiO3-0.6BiFeO3 lead-free piezoelectric ceramics. J. Korean Phys. Soc. 2016, 68, 59–67. [Google Scholar] [CrossRef]
- Anton, E.-M.; Jo, W.; Damjanovic, D.; Rödel, J. Determination of depolarization temperature of (Bi1/2Na1/2)TiO3-based lead-free piezoceramics. J. Appl. Phys. 2011, 110, 094108. [Google Scholar] [CrossRef]
- Trung, D.T.; Uwiragiye, E.; Lan, T.T.; Fisher, J.G.; Lee, J.-S.; Mok, J.; Lee, J.; Naqvi, F.U.H.; Ko, J.-H. Growth of Single Crystals of (K1−xNax)NbO3 by the Self-Flux Method and Characterization of Their Phase Transitions. Materials 2024, 17, 4195. [Google Scholar] [CrossRef]
- Abbas, A.; Jung, W.G.; Moon, W.J.; Uwiragiye, E.; Pham, T.L.; Lee, J.S.; Fisher, J.G.; Ge, W.; Naqvi, F.U.H.; Ko, J.H. Growth of (1 − x)(Na1/2Bi1/2)TiO3–xKNbO3 single crystals by the self-flux method and their characterisation. J. Korean Ceram. Soc. 2024, 61, 342–365. [Google Scholar] [CrossRef]


| Additive | Name | Weight % |
|---|---|---|
| Solvent | Methyl ethyl ketone + ethanol (66/34%) | 40.405 |
| Dispersant | Triethanolamine | 1.06 |
| Plasticizer | benzyl n-butyl phthalate | 3.435 |
| Plasticizer | Polyethylene glycol 400 | 0.93 |
| Binder | Polyvinyl butyral | 4.165 |
| Solids | 0.685NBT-0.065BT-0.25ST powder with 0~9 wt% NN templates | 50 |
| Untextured 0.685NBT-0.065BT-0.25ST | Textured 0.685NBT-0.065BT-0.25ST | |||||
|---|---|---|---|---|---|---|
| Element | Nominal | Mean | Standard Deviation | Nominal | Mean | Standard Deviation |
| Na | 0.3425 | 0.294 | ±0.007 | 0.3425 | 0.311 | ±0.049 |
| Bi | 0.3425 | 0.352 | ±0.009 | 0.3425 | 0.340 | ±0.032 |
| Ti | 1 | 0.999 | ±0.001 | 1 | 0.983 | ±0.008 |
| Sr | 0.25 | 0.242 | ±0.007 | 0.25 | 0.239 | ±0.009 |
| Nb | - | not measured | - | - | 0.018 | ±0.005 |
| Ba | 0.065 | 0.064 | ±0.003 | 0.065 | 0.063 | ±0.006 |
| Al | - | 0.001 | ±0.001 | - | 0.001 | ±0.001 |
| Parameter | Td | Ts-m | Tθ | TB | A | B/B * | T4.5/T4.5 * | T2/T2 * | C/C * | D | Ea |
|---|---|---|---|---|---|---|---|---|---|---|---|
| Unit | °C | °C | °C | °C | °C−1 | °C−1 | °C | °C | °C | ln(Ω−1cm−1K) | eV |
| Untextured | −35 | 150 | 260.7 | 437 | 0.00326 | 0.00652 (=2A) | 98.65 | 71.50 | 10.86 | 8.1 | 1.26 |
| 0.02363 | −34.36 | −53.62 | 7.70 | ||||||||
| Textured | −32 | 135 | 239.6 | 452 | 0.00395 | 0.00790 (=2A) | 92.96 | 67.17 | 10.32 | 7.7 | 1.23 |
| 0.02560 | −29.73 | −48.04 | 7.32 |
Disclaimer/Publisher’s Note: The statements, opinions and data contained in all publications are solely those of the individual author(s) and contributor(s) and not of MDPI and/or the editor(s). MDPI and/or the editor(s) disclaim responsibility for any injury to people or property resulting from any ideas, methods, instructions or products referred to in the content. |
© 2024 by the authors. Licensee MDPI, Basel, Switzerland. This article is an open access article distributed under the terms and conditions of the Creative Commons Attribution (CC BY) license (https://creativecommons.org/licenses/by/4.0/).
Share and Cite
Andleeb, K.; Trung, D.T.; Fisher, J.G.; Tran, T.T.H.; Lee, J.-S.; Choi, W.-J.; Jo, W. Fabrication of Textured 0.685(Na0.5Bi0.5)TiO3-0.065BaTiO3-0.25SrTiO3 Electrostrictive Ceramics by Templated Grain Growth Using NaNbO3 Templates and Characterization of Their Electrical Properties. Crystals 2024, 14, 861. https://doi.org/10.3390/cryst14100861
Andleeb K, Trung DT, Fisher JG, Tran TTH, Lee J-S, Choi W-J, Jo W. Fabrication of Textured 0.685(Na0.5Bi0.5)TiO3-0.065BaTiO3-0.25SrTiO3 Electrostrictive Ceramics by Templated Grain Growth Using NaNbO3 Templates and Characterization of Their Electrical Properties. Crystals. 2024; 14(10):861. https://doi.org/10.3390/cryst14100861
Chicago/Turabian StyleAndleeb, Kiran, Doan Thanh Trung, John G. Fisher, Tran Thi Huyen Tran, Jong-Sook Lee, Woo-Jin Choi, and Wook Jo. 2024. "Fabrication of Textured 0.685(Na0.5Bi0.5)TiO3-0.065BaTiO3-0.25SrTiO3 Electrostrictive Ceramics by Templated Grain Growth Using NaNbO3 Templates and Characterization of Their Electrical Properties" Crystals 14, no. 10: 861. https://doi.org/10.3390/cryst14100861
APA StyleAndleeb, K., Trung, D. T., Fisher, J. G., Tran, T. T. H., Lee, J.-S., Choi, W.-J., & Jo, W. (2024). Fabrication of Textured 0.685(Na0.5Bi0.5)TiO3-0.065BaTiO3-0.25SrTiO3 Electrostrictive Ceramics by Templated Grain Growth Using NaNbO3 Templates and Characterization of Their Electrical Properties. Crystals, 14(10), 861. https://doi.org/10.3390/cryst14100861