Article

Atomistic Study on Defect–Grain Boundary Interactions in TiVTa Concentrated Solid–Solution Alloys

1
Institute of Reactor Engineering and Technology, China Institute of Atomic Energy, Beijing 102413, China
2
School of Physics and Electronics, Hunan University, Changsha 410082, China
*
Authors to whom correspondence should be addressed.
These authors contributed equally to the work.
Crystals 2024, 14(2), 166; https://doi.org/10.3390/cryst14020166
Submission received: 5 January 2024 / Revised: 23 January 2024 / Accepted: 24 January 2024 / Published: 6 February 2024
(This article belongs to the Special Issue High-Entropy Alloys: Progress and Prospects)

Abstract

:
The elemental segregation behaviors and interactions between point defects and symmetrical tilt grain boundaries (GBs) in TiVTa concentrated solid–solution alloys (CSAs) have been studied through hybrid Monte Carlo/molecular dynamics (MC/MD) simulations. A pure V model, a random TiVTa CSA with randomly distributed elements, and an equilibrated TiVTa CSA with Ti segregation were constructed to investigate the influence of chemical disorder and local elemental segregation on defect–GB interactions. For defect–GB interactions, GBs interact more strongly with interstitials than with vacancies. Compared with the pure V, the vacancy absorption length scale of GBs is greater, whereas the interstitial absorption length scale of GBs is shorter in TiVTa CSAs due to the chemical fluctuation and local lattice distortion. This means a higher recombination efficiency of point defects in TiVTa CSAs. The elemental (Ti) segregation in TiVTa CSAs can further enhance the sink strength of GBs towards interstitials, while simultaneously reducing their sink strength towards vacancies. Consequently, the preference effects of GBs towards interstitials and vacancies are amplified in the equilibrated CSA due to local ordering, thereby reducing efficient defect annihilation around GBs. These results provide fundamental insights into the irradiation defect dynamics of CSAs with body-centered cubic (bcc) structure.

1. Introduction

Nuclear energy represents a highly promising avenue for addressing the global energy crisis. In pursuit of enhanced safety and economic viability, the concept of advanced generation IV reactors has been proposed [1]. Refractory concentrated solid–solution alloys (CSAs) composed of multiple principle elements with extremely high melting temperatures are reported to have superior high-temperature mechanical performances, good corrosion resistance and radiation resistance, and are considered as promising structural material candidates for advanced nuclear applications [2,3,4,5,6,7,8,9,10,11]. Specifically, TiVTa CSAs with single-phase body-centered cubic (bcc) structures maintain good thermal stability and low neutron activation and exhibit an excellent strength–ductility trade-off at room or elevated temperatures [12,13]. Moreover, extended refractory TiVTa CSAs, such as TiVTa(Nb, Zr, Cr) [14,15,16,17], TiVTaNbHf [18], and TiVTaZrHf [19], have also shown good mechanical properties. As for the irradiation performance in TiVTa CSAs, suppressed radiation-induced defects and good resistance to irradiation hardening have been observed in Ti ion irradiation experiments [20]. At high He ion irradiation fluence, scattered needle-like shaped segregations of Ti appear near He bubbles in TiVTa CSAs [21]. The generation and evolution of irradiation-induced defects can help one to understand the radiation resistance of materials. Recently, the formation and migration behaviors of point defects in TiVTa CSAs have been studied from the perspective of chemical complexity and lattice distortion [22,23]. These simulation results provide a theoretical basis and insight for the further study of irradiation behavior of TiVTa CSAs.
Due to the high concentrations of all constituent elements, CSAs exhibit a pronounced state of chemical disorder. It is commonly assumed that different types of elements are distributed randomly within the lattice. However, recent experiments have revealed the existence of short-range ordering (SRO) in CSAs during the annealing process [24,25]. The nonuniform distributions of elements can be characterized by the Warren–Cowley SRO parameters [26]. It has been demonstrated that local ordering in CSAs strongly affects their mechanical performance [24,27] and defect properties [28,29,30]. Notably, the SRO in CSAs is closely related to the local atomic environment [31,32]. For example, the element Ti exhibits an intrinsic hexagonal close-packed (hcp) structure and is dynamically unstable in the bcc phase so that the preferential segregation of Ti-rich clusters toward grain boundaries (GBs) can be observed [33]. GBs are important structural features and play a crucial role in determining the mechanical properties [34] and irradiation performance [35] of polycrystalline CSAs. Revealingly, elemental segregation and local ordering in the vicinity of GBs have been observed in CSAs [28,36,37]. Moreover, Li et al. [38] have found that the enrichment of Nb can increase GB stability, which further improves the strength of NbMoTaW CSAs.
GBs are known to have an essential impact on the irradiation microstructure via their interactions with irradiation-induced defects [39,40]. The thorough investigation of the absorption of point defects by GBs can contribute to a comprehensive understanding of the microstructural evolution behaviors under irradiation. The GB serves as an efficient sink for vacancies and interstitials in materials [41], thus necessitating a comprehensive investigation into the interaction between GB and point defects. For elemental metals and conventional alloys, defect–GB interactions have been studied in depth, as in, for example, Tschopp et al. [42], who explored the interactions between point defects and GBs in α-Fe and found that defect formation energies rely on both the local atomic structure and the distance from the center of the GB. In particular, the quantification of sink strength in GBs has been demonstrated through the analysis of point defect formation energy distribution in the vicinity of GBs [42,43]. Additionally, it has been observed that defect–GB interactions in α-Fe occurred not through individual defect movements, but rather via a chain-like group defect [44]. Through chain-like defects, point defects can effectively translate long distances to annihilate with their opposite, meaning that GBs act as highly efficient defect sinks that do not saturate under extreme radiation conditions. Zhang et al. [45] applied the molecular dynamics (MD) method to investigate the interactions between irradiation-induced defects and GBs in Fe–Cr alloys, revealing that GBs significantly contribute to defect trapping, particularly for interstitials. For face-centered cubic (fcc) CSAs, extensive research has also been conducted on defect–GB interactions. For instance, solute depletion or enrichment at GBs in NiFeCrMn CSAs was found to be limited due to the relatively sluggish diffusion of solutes during high-temperature irradiation [46]. In NiCoFeCrMn CSAs, the GB segregation can suppress the formation of voids due to the enhanced and localized interstitial cluster and subsequent point defect recombination, thereby improving the radiation tolerance [47]. Zhao [31] investigated the defect–GB interactions in NiCoFeCu CSAs, confirming that elemental segregation enhances the sink strength of GBs towards vacancies while simultaneously reducing the sink strength toward interstitials. However, the influence of GBs on defect properties and defect–GB interactions in refractory CSAs remains unclear due to the intrinsic characteristics of bcc structure, such as chemical fluctuation and local lattice distortion. Notably, the thermodynamic stability, microstructure, deformation mechanisms, and various properties of CSAs are significantly affected by the local lattice distortion [48]. Therefore, the mechanism by which this factor (local lattice distortion) contributes to the interactions between defects and GBs remains to be elucidated. More importantly, the phenomenon of radiation-induced segregation (RIS) has been observed in CSAs due to the high concentrations of all constituent elements [46,49]. Significant lattice distortion in bcc CSAs can profoundly impact defect behavior and subsequently influence the radiation resistance of the material [50,51]. Therefore, the RIS in bcc CSAs may give rise to distinct influences on defect–GB interactions. The aforementioned factors will have a profound impact on the irradiation performance of bcc CSAs.
In this work, three representative symmetrical tilt GBs of pure V and TiVTa CSAs were constructed, including Σ3 (111), Σ3 (112) and Σ19 (331) GBs. The selection of TiVTa CSAs was based on their exceptional properties, as previously described. The impact of chemical fluctuations and lattice distortions on GB properties in TiVTa CSAs were examined through a comparative analysis with pure V. Firstly, the initial configuration was relaxed statically and at 300 K to analyze the influence of the multi-principal effect on the GB structure. We then quantitatively characterized the lattice distortion in pure V and TiVTa CSAs. Hybrid Monte Carlo/molecular dynamics (MC/MD) simulations were carried out to analyze the influence of elemental segregation (i.e., SRO) on the defect–GB interactions in TiVTa CSAs. Finally, the cohesive energy was calculated and combined with the results of Chen et al. [33]. It was thereby demonstrated that both the chemical-element exclusivity and chemical-affinity disparity serve as driving forces for SRO in the TiVTa CSAs [52]. Additionally, the vacancy and interstitial formation energies were calculated and the interactions between point defects and GBs in pure V and TiVTa CSAs were discussed.

2. Materials and Methods

Atomistic simulations were performed to study the defect–GB interactions in pure V and TiVTa CSAs by using a large-scale atomic/molecular massively parallel simulator (LAMMPS) [53]. Finnis–Sinclair-type interatomic potentials for TiVTa CSAs were used in this work, as developed by Rongyang Qiu [54].
The structures and energetics of GBs were investigated. The lattice constants of pure V and equiatomic TiVTa CSAs were initially set to 3.03 Å and 3.21 Å, respectively. Three typical symmetrical tilt GBs (namely Σ3 (111) GB, Σ3 (112) GB, and Σ19 (331) GB) were constructed using Tschopp et al.’s method [55]. A three-dimensional periodic simulation cell (50 × 300 × 50 Å) was employed as depicted in Figure 1, whereby there are two GBs (one in the middle and one at the top/bottom) and two crystal orientations. The static GB structure within a 0 K minimum energy configuration was obtained by using the conjugate gradient algorithm. Then, the structural properties of GBs at 300 K were determined in an isobaric–isothermal (NPT) ensemble. The supercell structure was optimized by relaxation in the NPT ensemble with a duration of 30 ps (the timestep is 1 fs). The structures and energies of atoms at GBs after relaxation were analyzed.
In the present work, the radial distribution function (RDF) and mean square displacement (MSD) are calculated to describe the local lattice distortion. The RDF is calculated by the following formula:
g ( r ) = ρ ( r ) ρ a
where ρ ( r ) is the number density of the radial distribution of atoms, r is the radius of the radial distribution of atoms, and ρ a is the average atomic number density in the system.
The MSD is defined by the following equation [56]:
R 2 t = j N r j ( t ) r j ( 0 ) 2 N
where t is the simulation time, r j ( 0 ) is the initial position of the j-th atom, r j ( t ) is the position at times t of the j-th atoms, R 2 ( t ) is MSD, and N is the total number of atoms in the model.
It should be noted that the calculation of RDF in this work does not distinguish between different types of atom pairs. In the specific simulation process, the NPT ensemble is employed for relaxation at 300 K during the calculation of MSD, with a timestep of 1 fs and a total simulation duration of 100 ps.
The hybrid MC/MD method was adopted to study the effects of elemental segregation (i.e., SRO) on the microstructure evolution in TiVTa CSAs. Supercells with elemental segregation were obtained by performing MC swaps between two different types of atoms. The Metropolis criterion was used to determine the acceptance of new configuration. The energy of the system before and after the swap was calculated in the NPT ensemble. If Δ E < 0 , the swap is accepted. Otherwise, it is accepted with the following probability:
P = e Δ E k B T
where k B is the Boltzmann constant, and T is the temperature. The simulation performed 100 MC swaps for each pair, followed by up to 100 MD relaxations per iteration at 300 K. The MD timestep was set to 1 fs, and 5 million steps were carried out in total. It should be noted that the accuracy of the simulation method using hybrid MC/MD depends on the precision of the potential function. In other words, a suitable and accurate potential function can significantly improve the reliability of the simulated results. The potential function employed in this study has been assessed by several recent studies [23,54,57], revealing its applicability to the investigation of the energetics of point defects and the elucidation of radiation-induced damage behaviors in materials.
In order to obtain the quantitative description of SRO in the 1st nearest neighbor shell, we calculated the Warren–Cowley parameter (WCP) as follows [26]:
W C P m n = 1 Z m n χ n Z m
where Z m n is the number of n-type atoms around m-type atoms, Z m is the number of atoms around m-type atoms, and χ n is the atomic percentage of n-type atoms. If W C P m n > 0 , mn-type pairs occur less frequently than random ones. If W C P m n = 0 , mn-type pairs are randomly distributed. If W C P m n < 0 , mn-type pairs are more abundant than random.
To reveal the effects of chemical fluctuations on the defect–GB interactions, the defect formation energies ( E f ) were calculated for pure V and TiVTa CSAs. The formation energies of defect E f can be calculated as follows:
E f = E d e f e c t E b u l k ± μ d e f e c t
where E d e f e c t and E b u i k are the energies of supercells with and without defect, and μ d e f e c t is the chemical potential of the removed (+) or added (−) atom [31].
The Open Visualization Tool (OVITO) [58,59,60] was used to analyze the coordinates of point defects by using the Wigner–Seitz defect analysis. Structural analysis was carried out by using the common neighbor analysis (CNN).

3. Results

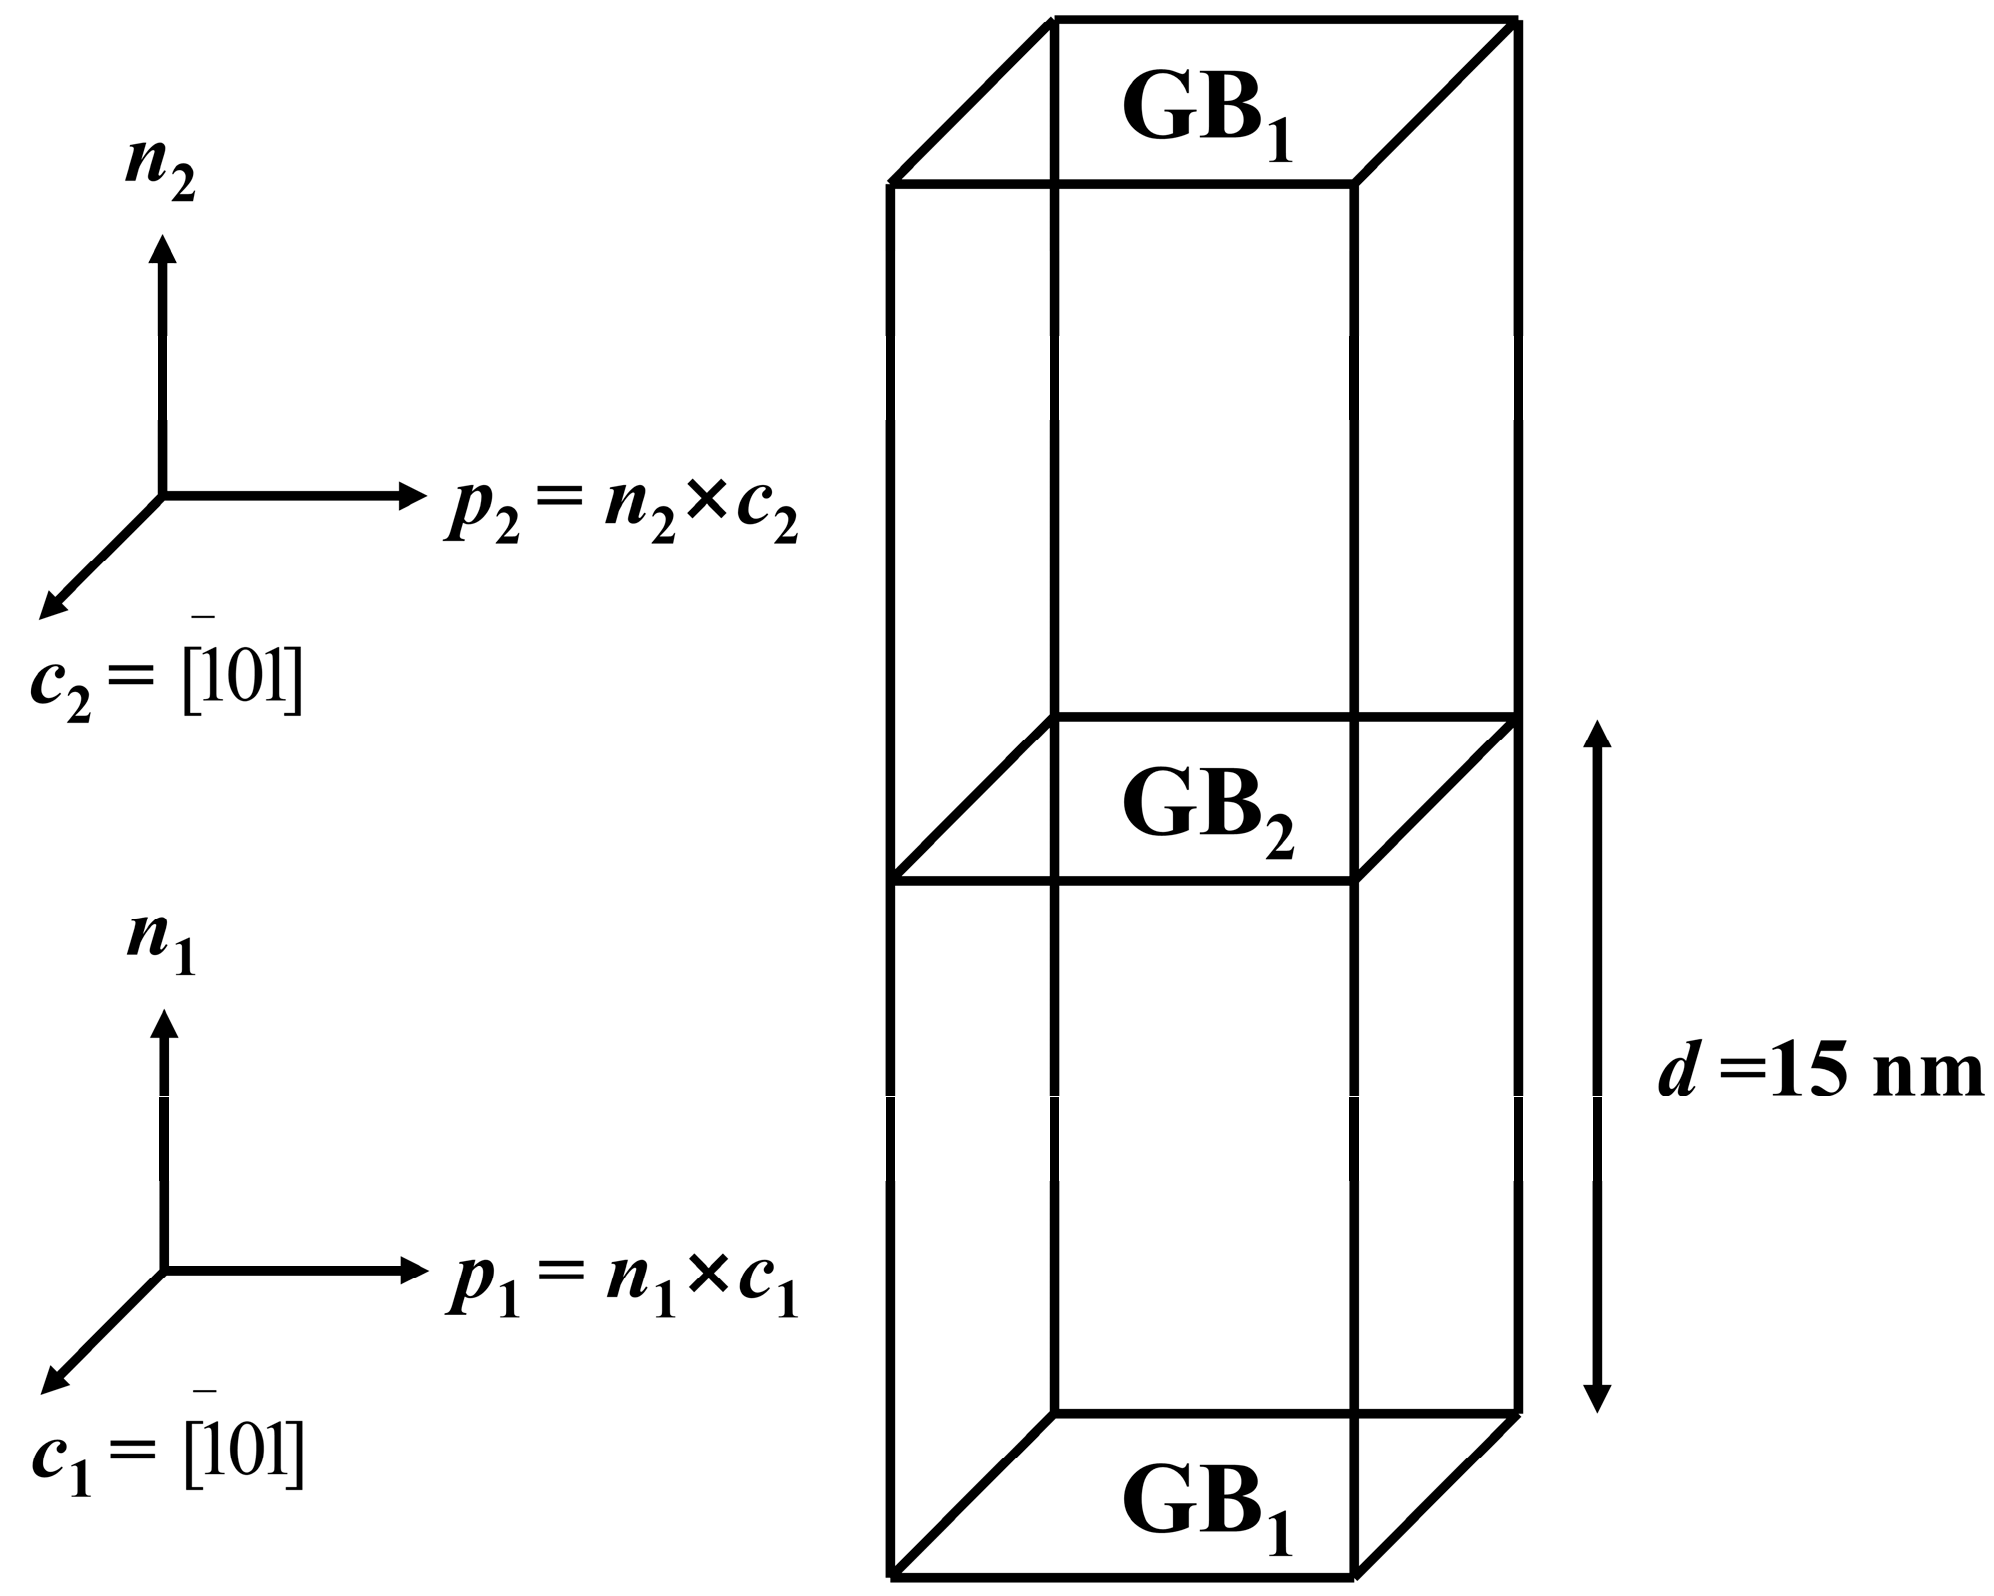
3.1. Grain Boundary Structure

The structures and energetics of GBs are important for understanding the interactions between point defects and GBs. As shown in Figure 2, the GB structures (0 K (static) and 300 K) of the model were determined through CNN analysis using OVITO, followed by the selection of two adjacent parallel layers of atoms to extract relevant data such as atomic species and positions. The Origin is utilized to project the GB structure onto the (110) plane, where the two layers of atoms along the <110> axis are depicted in contrasting black and white colors while illustrating the structural units of the GB. The structural units for the Σ3 (111) GB and Σ3 (112) GB are labeled D and E, respectively. The Σ3 (111) static GB in pure V exhibits a symmetric structure and continuous repeating structural units which are clearly visible. As the temperature increases, thermal activation causes certain atoms to displace from their lattice sites, while maintaining the overall relative integrity of the GB structure. However, the Σ3 (111) GB in TiVTa CSAs exhibits serious distortion at both 0 K and 300 K, and the repeating structural units are not regular with a certain degree of deformation. For Σ3 (112) GB, in both pure V and TiVTa CSAs, the GB structures are stable, maintaining symmetric structures and repeating structural units, and the impact of temperature increase is negligible. The Σ19 (331) GB of pure V also maintains a stable symmetrical structure at 0 K, and the displacement of atoms occurs at 300 K, resembling the Σ3 (111) GB. The degree of lattice distortion in TiVTa CSAs is greater for Σ19 (331) GB compared with Σ3 (112) GB. Note that the structural units of Σ19 (331) GB in both pure V and TiVTa CSAs are too irregular, so they are not labeled in this study. According to the results of the grain boundary energy (GBE) for bcc metals calculated by Li et al. [61], there is a strong correlation between the degree of lattice distortion at GBs and GBEs, with an ascending order of Σ3 (112) GB < Σ3 (111) GB < Σ19 (331) GB.
As a refractory CSA, TiVTa alloy generally has more significant lattice distortion than fcc CSAs [48]. In CuNiCoFe CSAs, repeating structural units can be interrupted by partial dislocations emitted from the GB, while the structural units can still be observed [62]. As shown in Figure 3, the distance gaps between the first nearest neighboring (1NN) and 2NN, as well as 3NN and 4NN in the TiVTa CSAs are filled, indicating significant deviation of atoms from their ideal lattice sites and severe local lattice distortion occurring in the TiVTa CSAs compared with the pure V. We also calculated the MSD during 300 K relaxation in the NPT ensemble to quantitatively characterize the atomic displacement. The MSD in the TiVTa CSAs, as depicted in Figure 4, was also observed to be greater than that of the pure V due to its more pronounced lattice distortion. Therefore, unlike the minor intrinsic lattice distortion observed in fcc CSAs, the significant lattice distortion present in bcc CSAs will exert a more pronounced influence on the structure and properties of GBs.
The atomic energy distributions at different static GBs were analyzed to further determine the structures of GBs, as shown in Figure 5. For Σ3 (111) GB in pure V, it can be found that the atomic energy distribution is symmetric as a function of distance from GB center and that the energies of the V atoms at different GBs exhibit varying degrees of increase when compared with the other atoms in the matrix. Based on the above analyses, the width of GBs in pure V can be determined by the distribution of atomic energy. The width of Σ3 (111) GB is approximately 23 Å, and for Σ3 (112) GB and Σ19 (331) GB, the widths are measured to be around 17 Å and 26 Å, respectively. The atomic energy near the Σ3 (112) GB is observed to be similar to that in the matrix, contrasting with the behavior at the Σ3 (111) and Σ19 (331) GBs.
As shown in Figure 6, the energy of the same atom types in the matrix is no longer a single value due to the different neighbor atomic environment, and the energy distribution maintained in a relatively fixed fluctuation. The energies of Ti, V, and Ta atoms at the Σ3 (111) and Σ19 (331) GBs exhibit varying degrees of increase compared with the other atoms in the matrix. It can be roughly judged that the widths of Σ3 (111) GB and Σ19 (331) GB are about 20 Å. For Σ3 (112) GB, the width of the GB cannot be determined due to the negligible difference in atomic energy between the GB and matrix regions. Generally, the Σ3 (112) GB is usually found possessing the lowest energy in bcc metals, as supported by both theoretical investigations [61,63,64] and experimental findings [61,65,66], thus establishing its exceptional stability. Overall, it is clear that the atomic energy is closely related to the structure of the GB and the adjacent environment.

3.2. Grain Boundary Segregation

In order to analyze elemental segregation behavior around the GB in TiVTa CSAs, hybrid MC/MD simulations were carried out for different GB configurations at 300 K. As shown in Figure 7a, the system with Σ3 (111) GB exhibits an initial rapid decrease in average potential energy, followed by a gradual decline to reach a steady state as the simulation time increases, indicating the formation of energetically more stable configurations. The average atomic energy in TiVTa CSAs at 0, 5 × 10⁵, and 5 × 10⁶ iterations at 300 K is −5.966, −6.067, and −6.083 eV/atom, respectively. Figure 7b–g show the evolution of the corresponding atomic structure and SRO (i.e., WCPs). The initial atomic configuration exhibits a nearly fully random distribution and the values of WCPs approach zero (no SRO). The segregation of the Ti element is significantly more pronounced compared with V and Ta, as evidenced by the results obtained from SRO analysis. As shown in Figure 7g, the formation of Ti–Ti pairs (WCP = −1.54) is highly favored in TiVTa CSAs, while the tendency to form V–Ta (WCP = −0.58) and Ta–Ta (WCP = −0.19) pairs is relatively weak. Additionally, the formation of Ti–V, Ti–Ta, and V–V pairs is disfavored (WCP > 0).
The final configurations with elemental redistribution can be used for the analysis of segregation behaviors at GBs. The atom types and structures are analyzed for configurations before and after MC/MD simulation. The concentration distribution of different atomic species with various GB configurations in TiVTa CSAs was determined. As shown in Figure 8a–c, after relaxation at 300 K, all types of atoms are distributed randomly in the matrix, and the atoms at the Σ3 (111) GB also maintain a state of uniform distribution. The configuration with the lowest energy in the system can be obtained through MC/MD simulation, as depicted in Figure 8d–f. Non-random atomic arrangements are observed, while most atoms still maintain their bcc structures. The segregation of Ti atoms at the GB is pronounced, consistent with the results obtained from the SRO, and exhibits a remarkably high concentration (around 0.9) whereas other elements only account for a concentration of 0.1. The V and Ta atoms are uniformly distributed in the matrix with nearly identical concentrations, predominantly forming V–Ta pairs while exhibiting minimal occurrences of Ta–Ta pairs. The same phenomena are observed in both Σ3 (112) GB and Σ19 (331) GB, as demonstrated in Figure 9 and Figure 10. It should be noted that the concentration of Ti atoms at Σ3 (112) GB is relatively low due to the limited lattice distortion of the GB. The presence of Ti segregation can significantly affect the behaviors of defects in TiVTa CSAs.

3.3. Defect–Grain Boundary Interactions

Characterizing the absorption of point defects by sinks is crucial for comprehending the irradiation-induced microstructural evolutionary process. The interactions between GBs and point defects play a pivotal role in the underlying mechanism of elemental segregation induced by irradiation. The vacancy formation energies of three types of GBs in pure V were plotted as a function of the y-axis distance and are distributed symmetrically due to the symmetrical GB structure, as illustrated in Figure 11a–c. The vacancy formation energies in the matrix, which remain unaffected by GBs, exhibit a stable average value of 2.55 eV. Note that, in all three cases, the vacancy formation energies around GBs are lower than that in the matrix, suggesting attractive interactions between them. In general, the formation energies of point defects are closely correlated with the local atomic structure. Whereby the greatest stability of the Σ3 (112) GB (i.e., minimal lattice distortion) renders it more challenging for point defects to emerge, which aligns with our previous work [22,23]. However, the change trend of point defect formation energies for the other two GBs (Σ3 (111) and Σ19 (331)) does not exhibit complete consistency with the degree of lattice distortion, suggesting that additional factors such as Σ designation, GB energy, and disorientation angle may influence the point defect formation energy [42].
Due to the distinct chemical fluctuations in GB structures within CSAs, the behavior of point defects at GBs deviates from that observed in pure metals. In the random TiVTa CSA, Figure 11d–f display an irregular landscape of vacancy formation energies that arise from significant lattice distortion and chemical complexity. The average vacancy formation energy in the matrix is 1.92 ± 0.21 eV, which is lower than that of pure V. Consequently, the formation of vacancies at GBs is easier and the higher equilibrium vacancy concentration in TiVTa CSAs may increase the recombination efficiency with the interstitials, thereby improving the irradiation resistance. Meanwhile, compared with pure V, a greater reduction in vacancy formation energy around the GB region indicates enhanced interactions between vacancies and GBs.
The distributions of vacancy formation energies in the equilibrated TiVTa CSA after MC/MD simulation are illustrated in Figure 11g–i. Due to the appearance of SRO structure, the chemical environment around defects becomes relatively uniform, and the vacancy formation energies of Ti, V and Ta elements exhibit a relatively obvious stratification phenomenon. The formation energies of Ta vacancies are found to be the highest, followed by V and Ti vacancies. In the GB region, the Ti segregation leads to higher vacancy formation energies compared with the results in the random CSA. Meanwhile, the Ti vacancy emerges as the most prevalent defect type in the vicinity of the GB, owing to the enrichment of Ti elements, exhibiting comparatively lower formation energies when compared with vacancies of V and Ta. It is noteworthy that the decline in vacancy formation energy near GBs in the equilibrated TiVTa CSA exhibits a noticeable reduction, even less than the corresponding value observed in pure V. This means that the vacancy–GB interactions are significantly weakened due to the Ti segregation at GBs.
As for self-interstitials in the matrix of pure V, [111] oriented VV dumbbells are the most stable configurations with the averaged formation energies of 3.37 eV. Consistent with previous studies on pure Fe and Cu [42,43], the reduction in interstitial formation energies around GBs is greater than that of vacancy formation energies, indicating higher binding energies between interstitials and GBs and a preferential segregation of interstitials over vacancies to the GB region. Interstitial formation energies around the Σ3 (112) GB compared with the other two GBs are also the highest, similar to the vacancy. The self-interstitials in TiVTa CSAs typically adopt a dumbbell configuration. Quantitatively, the average interstitial formation energy (2.13 ± 0.24 eV) in the matrix of TiVTa CSAs exhibits a significantly lower value compared with that observed in pure V due to the severe lattice distortion in TiVTa CSAs. Meanwhile, as shown in Figure 12a–f, the decrease in interstitial formation energies near GBs region in the random TiVTa CSA is less than in pure V and this contrast is particularly evident for Σ3 (111) GB, indicating that chemical fluctuations and lattice distortions in TiVTa CSAs may result in a reduction of the GB’s capacity to absorb interstitials. Notably, dumbbells composed of V–V, V–Ti, and Ti–Ti (arranged in ascending order based on their formation energy) exhibit lower formation energies and higher occurrence probabilities. Conversely, the formation of Ta-containing dumbbells is difficult due to their higher formation energies, aligning with the findings obtained from our previous study [23] through first-principles calculations.
The formation energies of interstitials near GBs in the equilibrated TiVTa CSA with Ti segregation are depicted in Figure 12g–i. Similar to the behavior of vacancies in the equilibrated TiVTa CSA, the formation energies of different types of interstitials also exhibit clear stratification due to the presence of SRO. Moreover, the formation energies of Ti–Ti dumbbells are the lowest, followed by V–Ti and V–V dumbbells. Ta-containing dumbbells exhibit the highest difficulty in formation, particularly for Ta–Ta dumbbells. The interstitial formation energies near all three GBs in the equilibrated TiVTa CSA exhibit slight improvement, whereas the interstitial formation energies within the matrix demonstrate significant enhancement. Therefore, the presence of Ti segregation in equilibrated TiVTa CSAs leads to an enhanced capacity for GBs to absorb interstitials.

4. Discussion

To gain a deeper comprehension of the formation mechanism of SRO in grain interiors (GIs), the cohesive energies ( E c o h e ) for three binary combinations and three single elements of {Ti, V, Ta} in the hcp and bcc crystal structures are examined utilizing the MD method. The cohesive energy of a crystal, defined as the energy necessary to dissociate the solid into individual atoms [67,68,69], is considered in this study as the potential energy of each atom [70]. It can be calculated using the following formula:
E c o h e = E t o t a l p e n
where the E t o t a l p e is the total potential energy of the metal crystal and n is the total number of atoms in the crystal.
The cohesive energies, determined from the interatomic potentials employed in the MD simulations, are presented in Table 1. Remarkably, our calculated results exhibit excellent agreement with those reported in [33], indicating that the interatomic potentials [54] are suitable for the investigation of elemental segregation mechanisms in TiVTa CSAs. Both results indicate that Ti–Ti exhibits the highest cohesive energy, Ti–V and V–V are of medium cohesive energies, and that Ti–Ta, V–Ta, and Ta–Ta have lower cohesive energies. Additionally, the constituent elemental pairs (as shown in Table 1) are generally categorized into the following three classes based on their chemical affinity (CA): a low-energy cluster (LEC) characterized by strong CA (0.75 < CAij ≤ 1.0), a medium-energy cluster (MEC) exhibiting moderate CA (0.35 ≤ CAij ≤ 0.75), and a high-energy cluster (HEC) displaying weak CA (0 ≤ CAij < 0.35) [33]. CATaTa (=0.8) and CAVTa (=0.4) are LECs and MECs, respectively. The negative values of WCPs in Figure 7g, i.e., WCPVTa (=−0.58) and WCPTaTa (=−0.19), verify the formation of these atomic pairs. Note that the positive values of WCPs for Ti–V, Ti–Ta, and V–Ta demonstrate that these atomic pairs are not favored in the equilibrated TiVTa CSA and are thus not discussed further. The LECs and MECs, predominantly composed of V–Ta and Ta–Ta, do not contain Ti atoms. In other words, the LECs and MECs exhibit chemical element exclusivity to Ti in the equilibrated TiVTa CSA. Therefore, in this case, Ti atoms bond with adjacent Ti atoms (WCPTiTi = −1.54 in Figure 7g) despite the formation of HECs. The aforementioned trends clearly demonstrate that the SRO in the GIs of TiVTa CSAs is driven by the chemical-affinity disparity and chemical-element exclusivity [52].
In a GB region, Ti-neighboring pairs (HECs) are mainly formed, while Ta-/V-neighboring pairs (LECs/MECs) are rare. The observed trends suggest that the characteristics of SROs in GBs differ from those in GIs, and similar phenomena have also been documented in recent studies [33,71]. Our findings demonstrate that Ti-rich HECs are weak and exhibit a pronounced tendency for segregation at GBs, while Ta-/V-rich LECs/MECs are relatively strong and prefer to remain in GIs. Specially, the optimal-sized HECs formed in the GBs, which are stabilized by surrounding LECs/MECs, can effectively defer dislocation nucleation, thereby enhancing material strength [33].
The sink strength of GB can be quantified by the difference in formation energy between the matrix value and the minimum value observed at the GB [42,43]. The values for the random and the equilibrated CSAs are compared in Table 2. The bulk values are determined by averaging the formation energies obtained from locations at least 25 Å away from the GB. The values near the GB are from the averaged values as denoted in Figure 11 and Figure 12. The sink strength of Σ3 (112) GB is much lower than that of Σ3 (111) GB and Σ19 (331) GB. In contrast with fcc CSAs [31], Σ3 (112) and Σ19 (331) GBs in the random TiVTa CSA interact with interstitials slightly stronger than vacancies, as the values of E I f d i f f are a little larger than E V f d i f f . It should be noted that the interaction strength between GBs and interstitials is found to be comparatively weaker than that between GBs and vacancies for Σ3 (111) GB in the random CSA, which may be caused by GB characteristics, such as the disorientation angle and Σ value.
Considering elemental segregation in the equilibrated CSA, it is found that the trends in the sink strengths of GBs toward vacancies and interstitials are different. For example, elemental segregation at the GB region enhances sink strength towards interstitials on account of E I f d i f f increases for all three types of GBs, while it weakens the interaction strength between three GBs and vacancies because E V f d i f f decreases. The change is induced by the variation of both lowest formation energy around the GB and matrix formation energy. As shown in Table 2, Ti segregation results in a substantial increase in vacancy formation energies near GBs and only a marginal increase within the matrix, while the trend is converse for interstitial formation energies (i.e., a relatively small increase in interstitial formation energies around GBs and significant increase in matrix), attributed to the alteration of chemical compositions and atomic neighbor environment in the equilibrated TiVTa CSA. As a result, the redistribution of elements in CSAs exerts a dual impact on the sink strength of GBs. On one hand, it influences the energies at the GBs due to segregation, while, on the other, there is also an impact on defect energies in regions away from the GBs as a result of elemental concentration changes.
In order to study all of the considered GBs in more detail, we quantify the sink strength using the binding energy of defects ( E b i n d i n g G B ), which is defined as [42] E b i n d i n g G B = E f b u l k E f G B , where E f b u l k and E f G B are averaged formation energies of defects in the region away from the GB and around the GB, respectively. The results are depicted in Figure 13. Generally, the tendency of binding energy is consistent with the results of E f d i f f for three GBs, as shown in Table 2. The Σ3 (112) GB exhibits the lowest binding energy compared with the other two GBs (Σ3 (111) GB and Σ19 (331) GB), which is consistent with [72]. All GBs (except for Σ3 (111) GB in the random TiVTa CSA) exhibit stronger interaction with interstitials compared to vacancies. The vacancy absorption length scale by GBs is greater in TiVTa CSAs compared with pure V (as shown in Figure 13a,c,e), whereas the interstitial absorption length scale by GBs is shorter in TiVTa CSAs than in pure V (as shown in Figure 13b,d,f). This means that the lattice distortion and the chemical fluctuations of the TiVTa CSAs exhibit distinct effects on the absorption behavior of GBs for vacancies and interstitials, compared with pure V. This, in turn, indicates an increased sink strength towards vacancies and a weakened sink strength towards interstitials in TiVTa CSAs, suggesting an enhanced recombination efficiency of point defects due to the reduced disparity in sink strengths between vacancies and interstitials compared with the elemental metal.
Based on the binding energies depicted in Figure 13, except for Σ3 (112) GB, the other two GBs tend to decrease the binding energies of vacancies while increasing those of interstitials, compared with the random CSA, due to the presence of local ordering (Ti segregation). In this case, we demonstrate that local ordering within the equilibrated CSA can suppress the sink strength of GBs for vacancies while concurrently enhancing their sink strength for interstitials. Consequently, the presence of local ordering leads to elemental segregation, facilitating the entrapment of interstitials around GBs. That is to say, the disparities in sink strengths of GBs towards vacancies and interstitials are increased in the equilibrated CSA, thereby reinforcing the preferential inclination of GBs towards them. Therefore, there should be a higher proportion of interstitials that are absorbed into the GBs compared with the random CSAs. This trend will result in a decrease in the concentration of interstitials within the GIs, which may significantly weaken the recombination of defects. Meanwhile, it is worth noting that the increased differences in the sink strength of GBs toward vacancies and interstitials (Figure 13) also indicate that GBs may absorb more interstitials and less vacancies in the equilibrated CSA, which may result in the presence of large-size precipitates surrounding GBs.
The present results in this study show that the segregation of elements plays a critical role in affecting defect–GB interactions in CSAs. Similarly, Utt et al.’s study [62] demonstrates that the influence of segregation on GB mobility is stronger than the inherent randomness in CSAs. The significance of local ordering and the tendency for elemental segregation in CSAs in modifying their defect properties is underscored by these findings.

5. Conclusions

The influence of chemical fluctuations, local lattice distortion, and elemental segregation on defect properties and defect–GB interactions in TiVTa CSAs is investigated through atomistic simulations, by comparing the results from the pure V, the random TiVTa CSA with stochastically distributed elements, and the equilibrated TiVTa CSA with local ordering. Three typical symmetrical tilt GBs (Σ3 (111) GB, Σ3 (112) GB, and Σ19 (331) GB) were selected to study the influence of elemental segregation on defect–GB interactions by using the hybrid MC/MD simulation. Due to the severe lattice distortion in bcc CSAs, the effects of SRO and defect–GB interactions are unique. The conclusions can be summarized as the following:
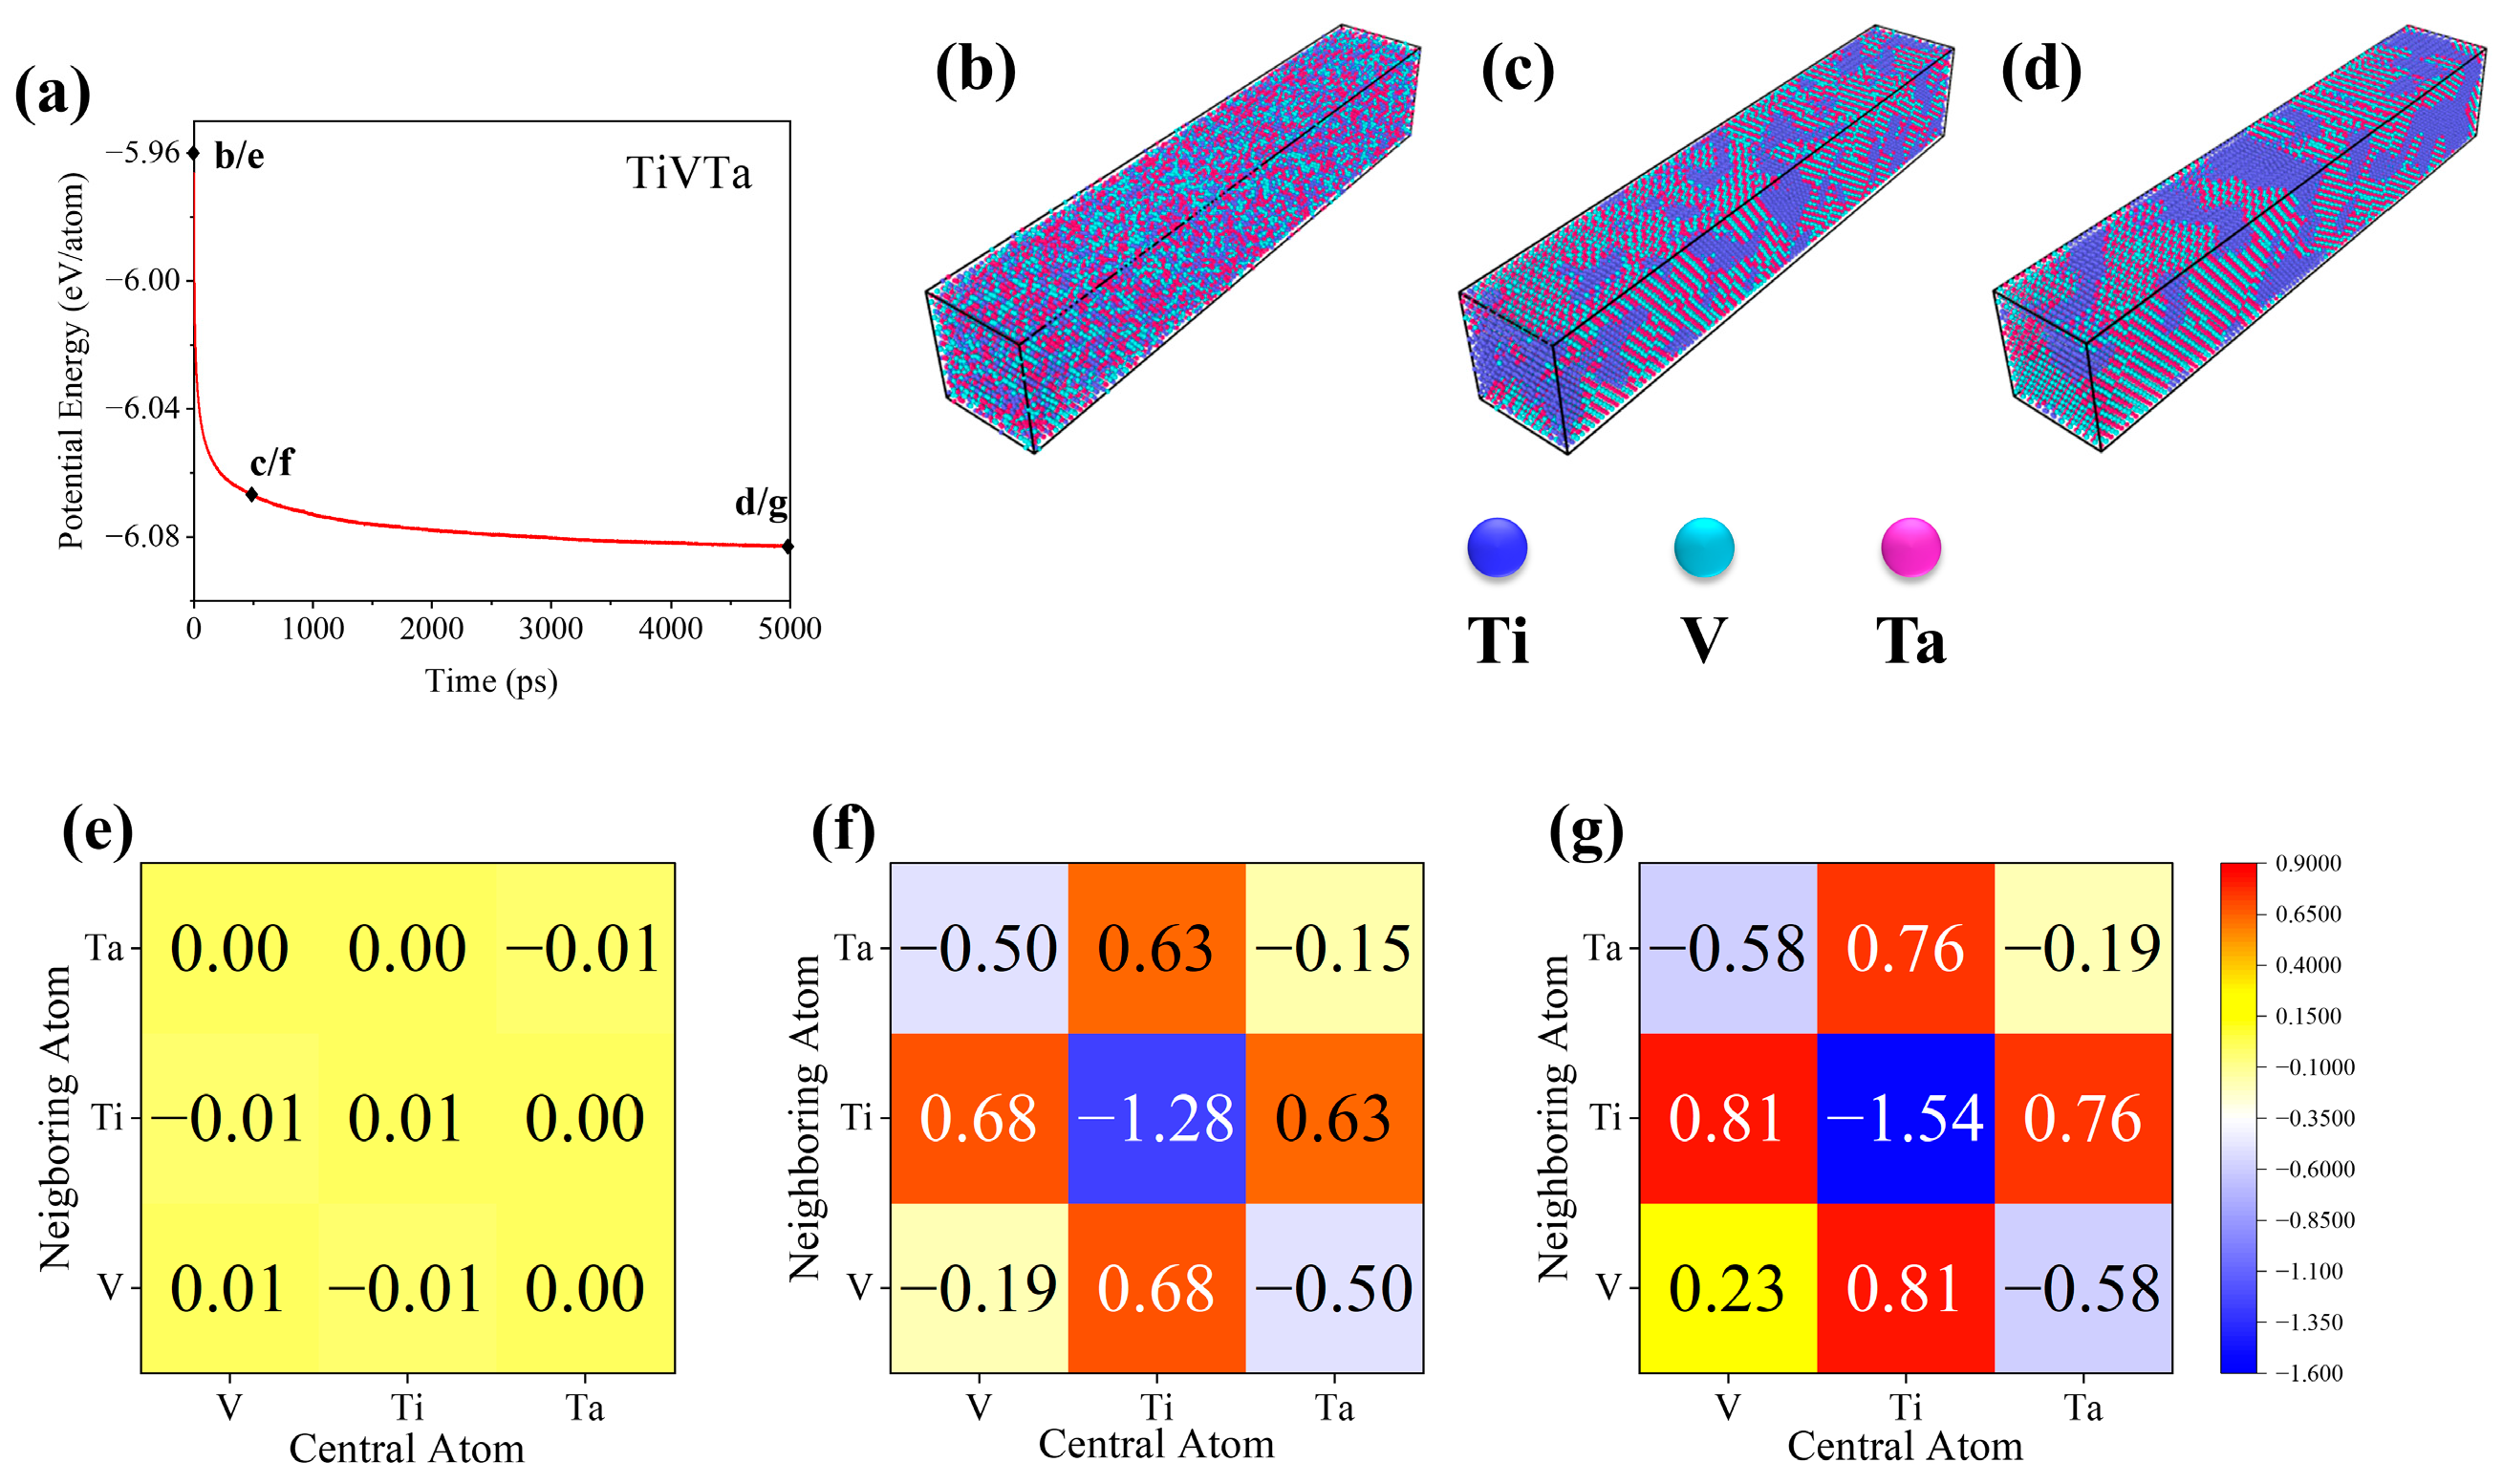
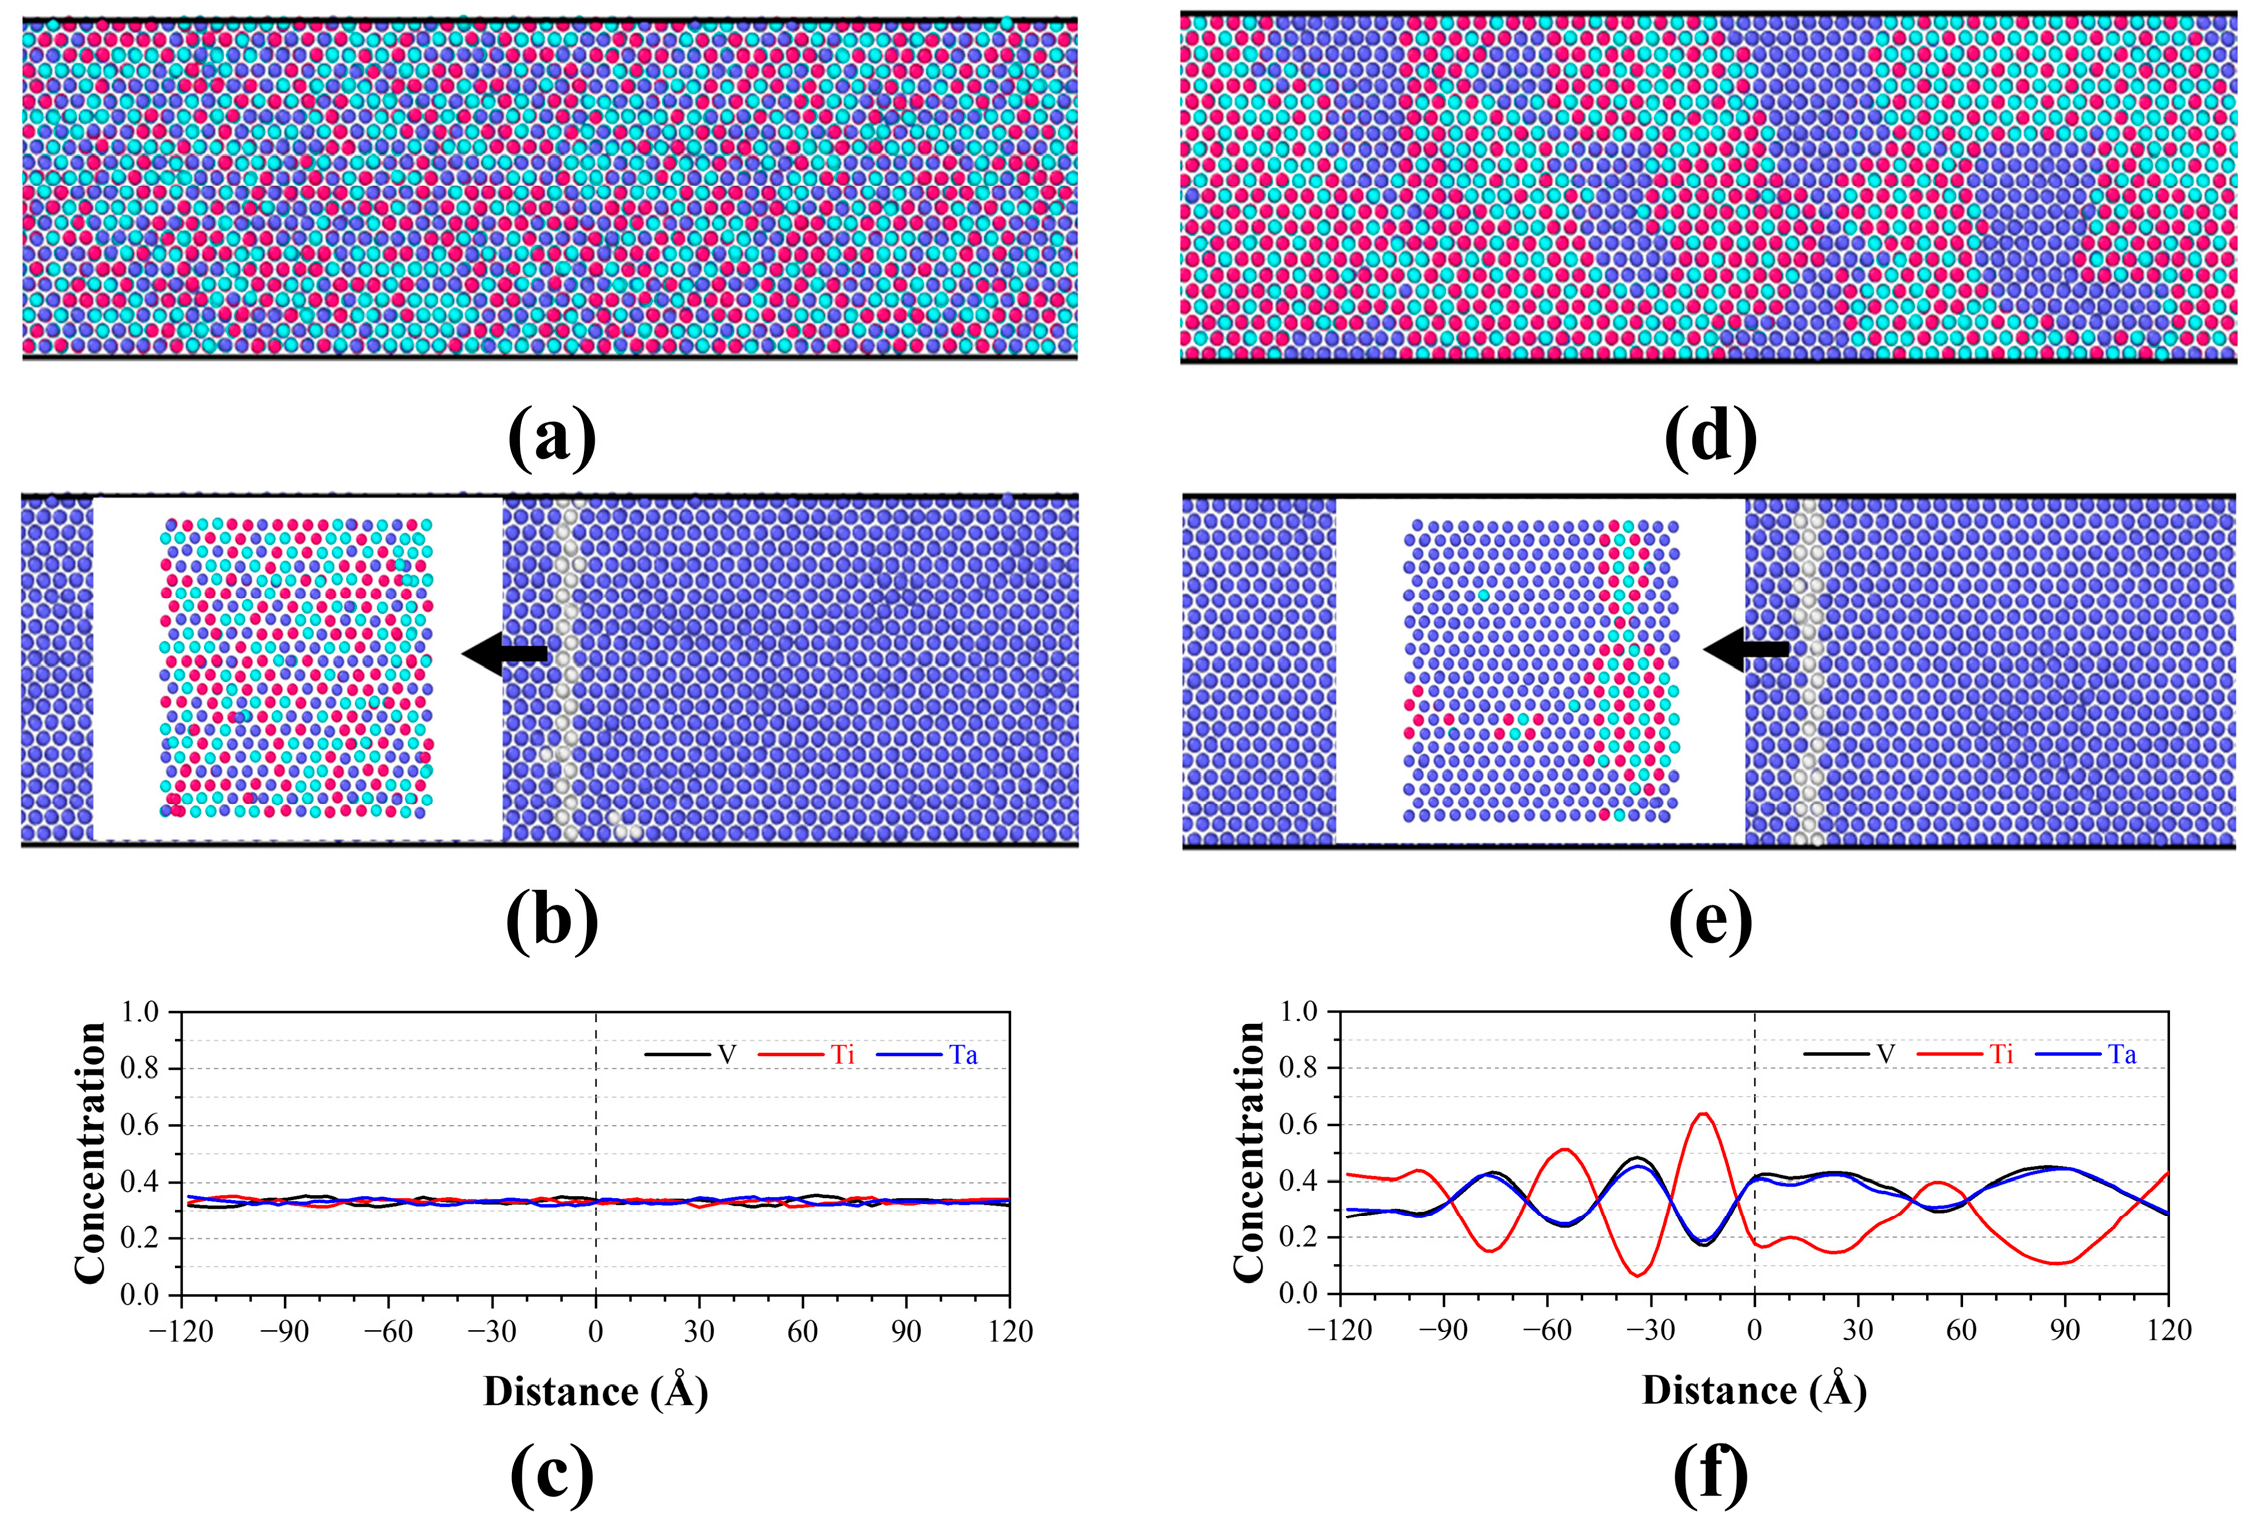
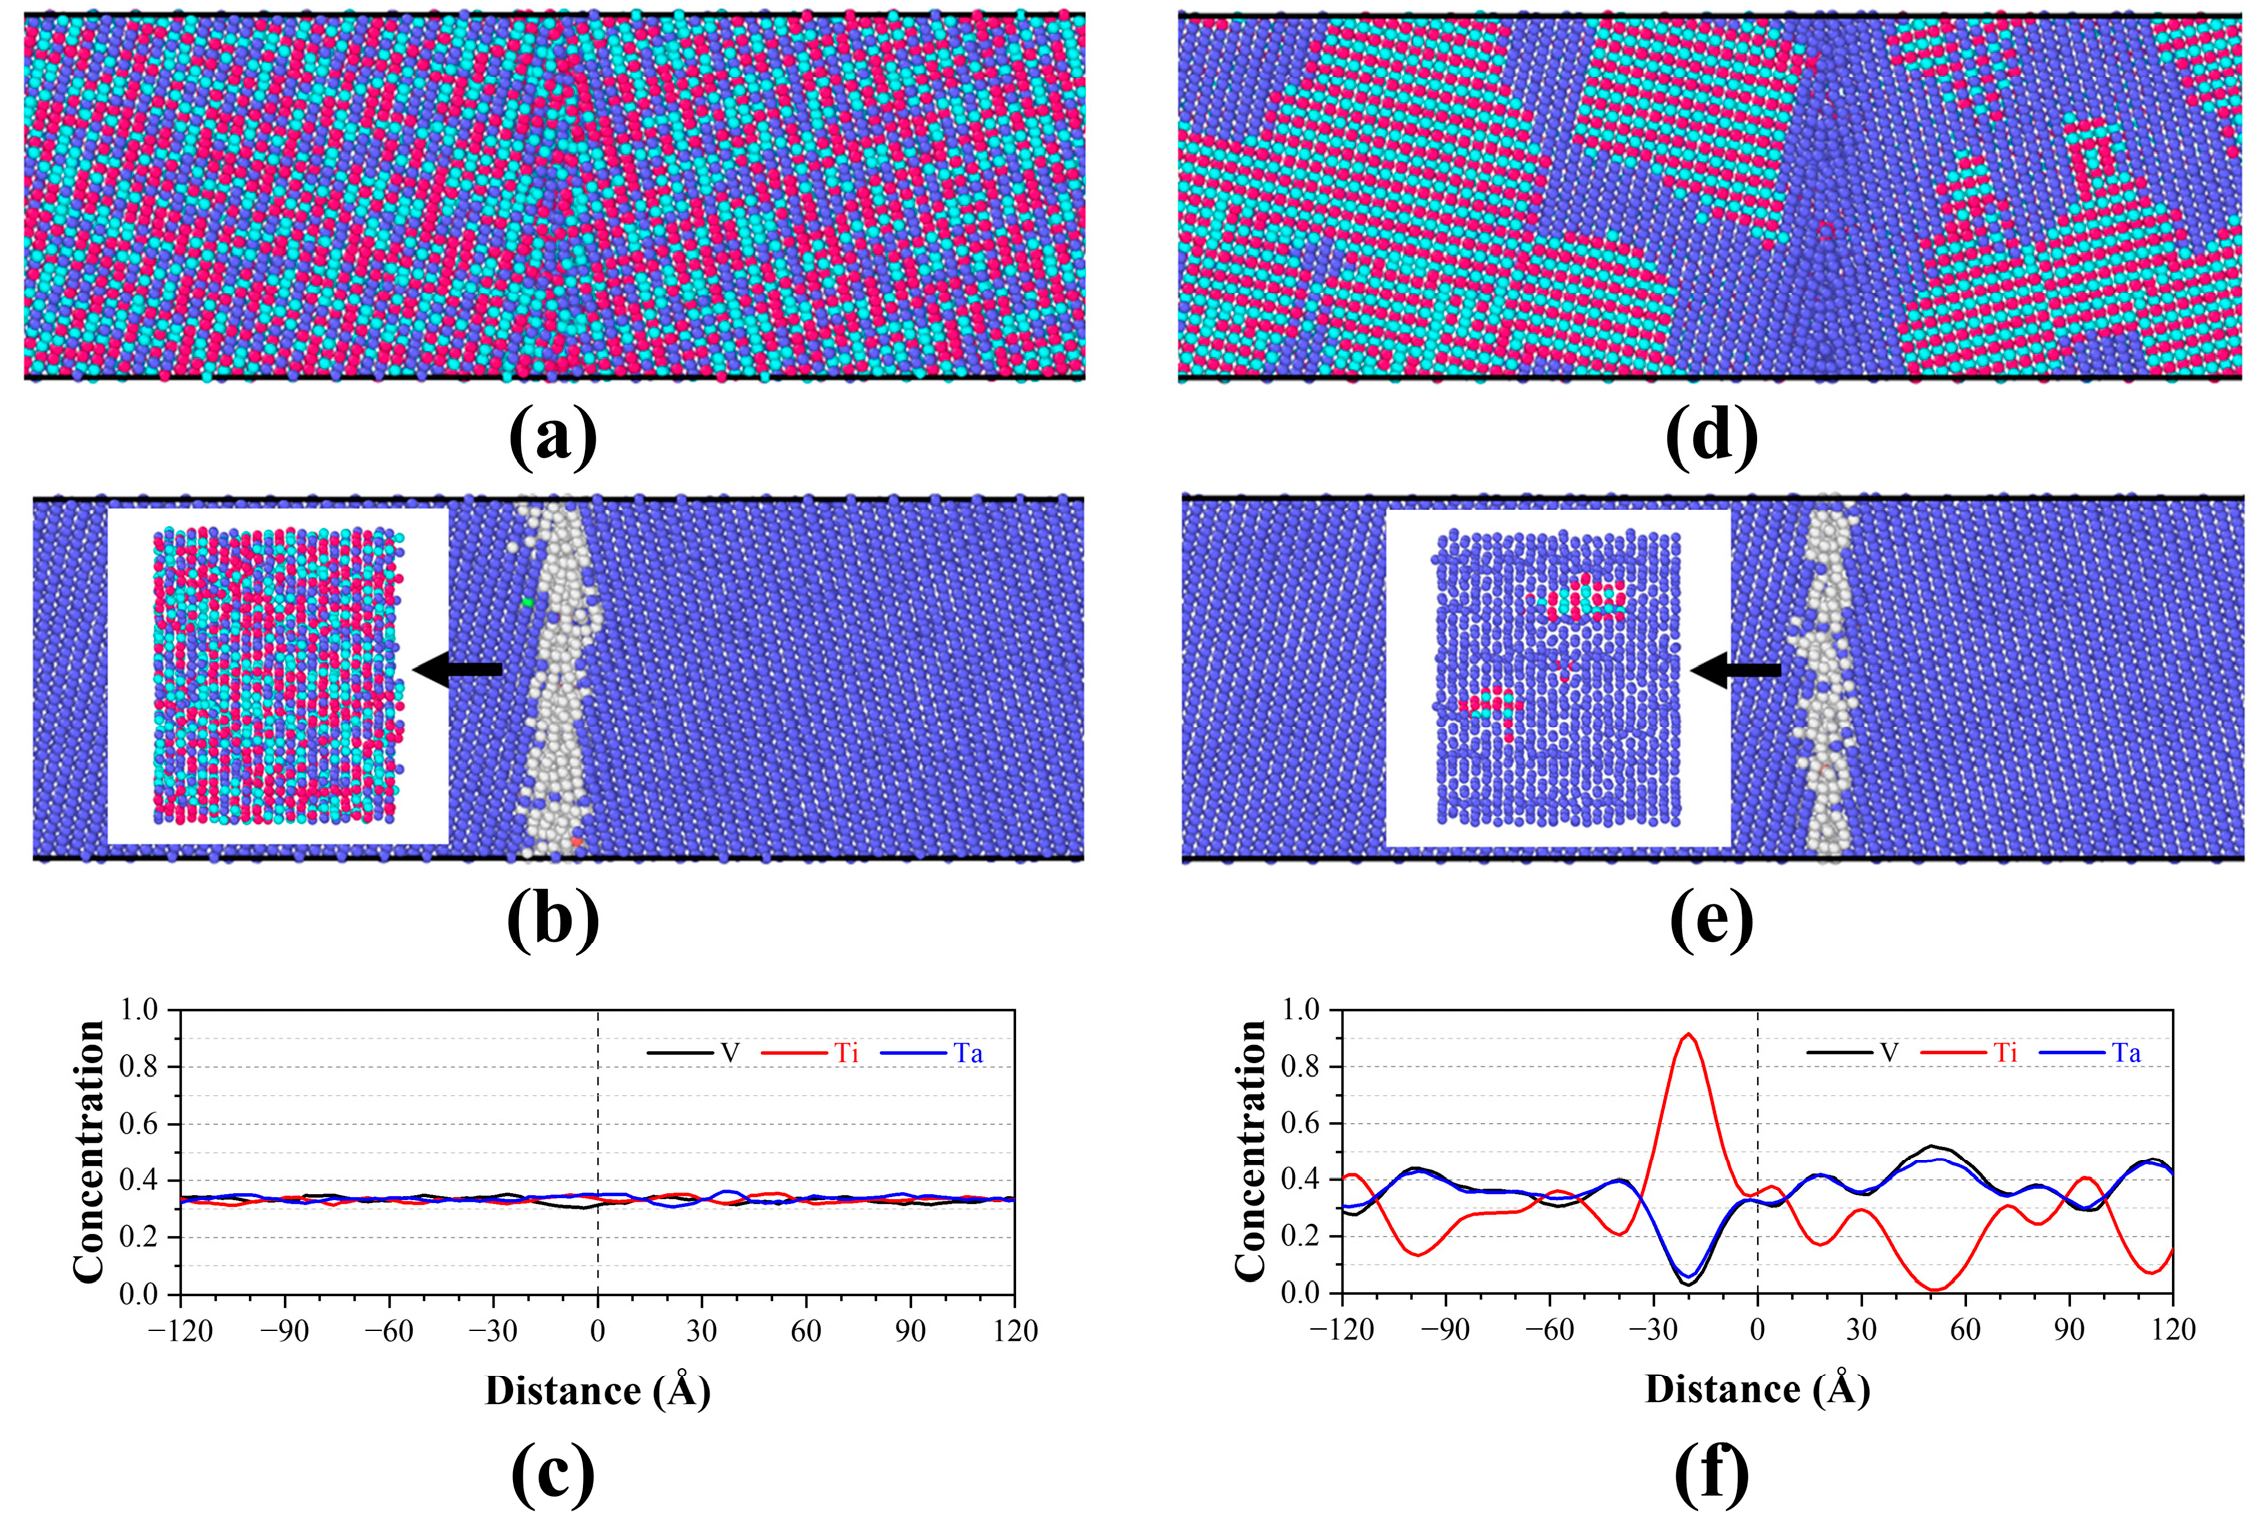
  • Ti segregation around the GB was observed in TiVTa CSAs, while V and Ta depleted at the GB and uniformly distributed in the matrix with nearly same concentration. Meanwhile, the formation mechanism of SRO (Ti segregation) is elucidated by means of cohesive energy and chemical affinity analyses. In the equilibrated TiVTa CSA, Ti-rich HECs exhibit a preference for localization at GBs, while Ta-/V-rich LECs/MECs tend to be distributed within the matrix. This implies that the chemical-element exclusivity and chemical-affinity disparity serve as plausible driving forces for SRO in refractory CSAs, and this mechanism can be further employed to analyze SRO in future investigations.
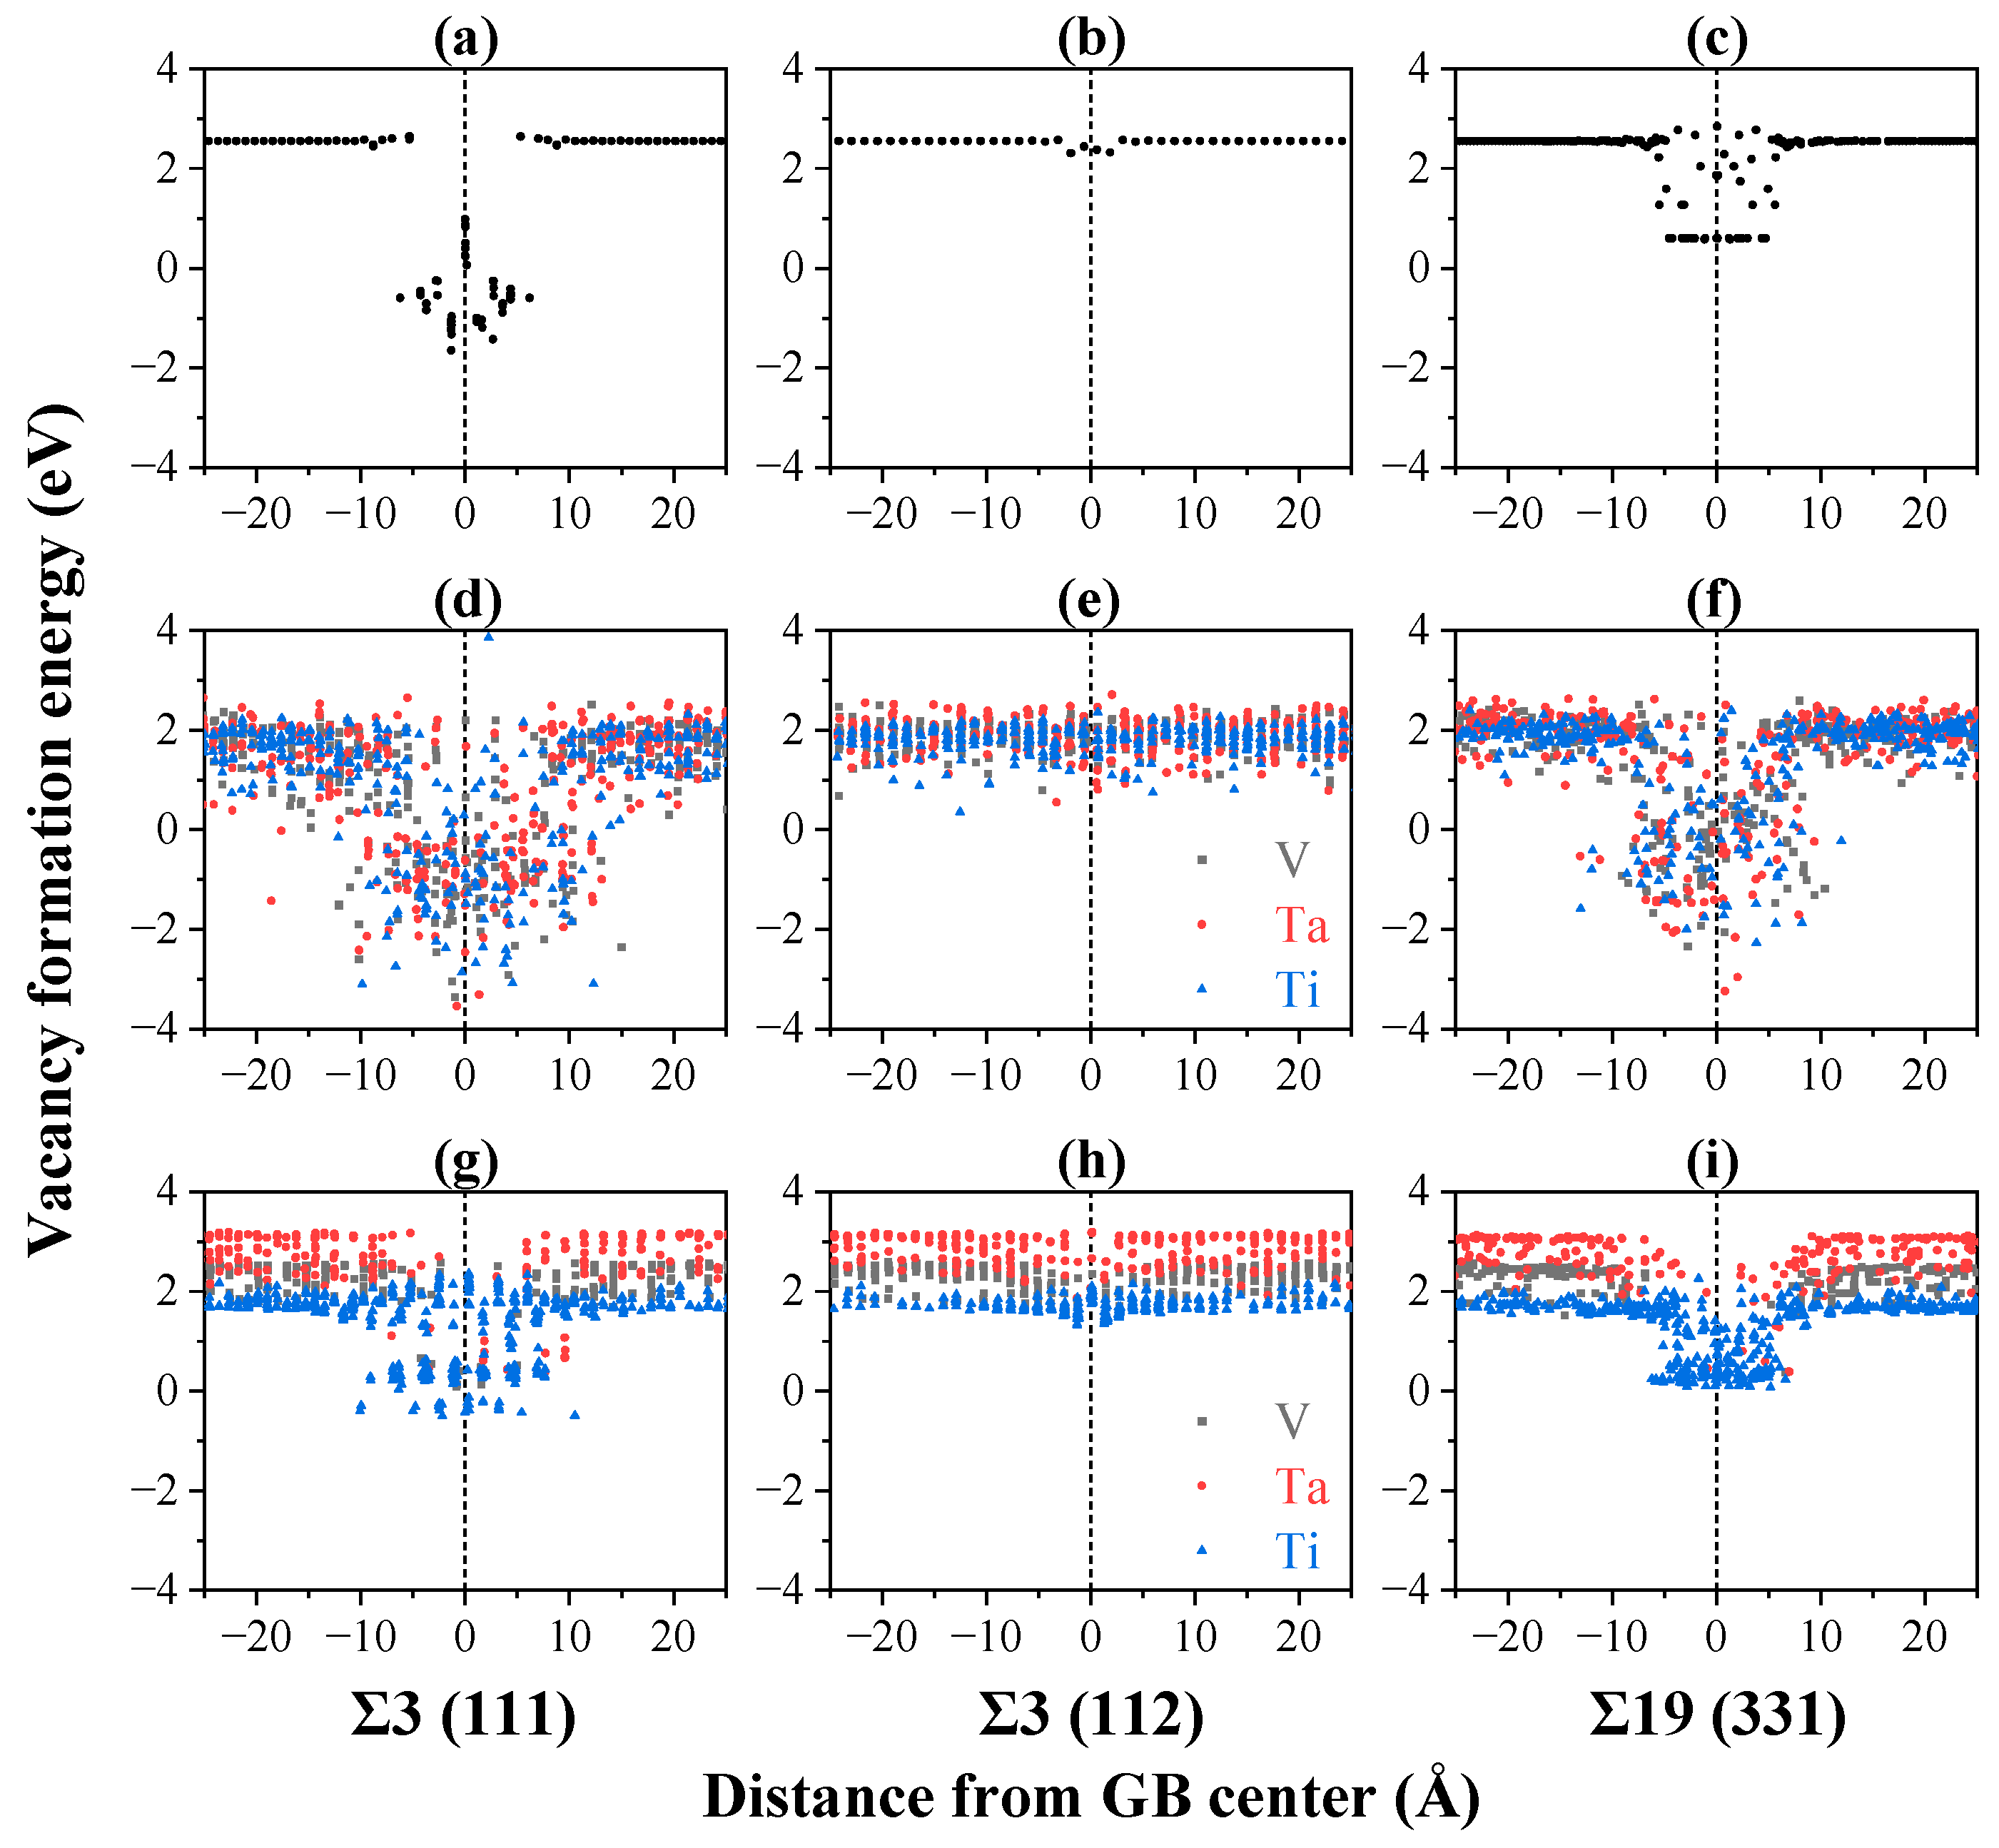
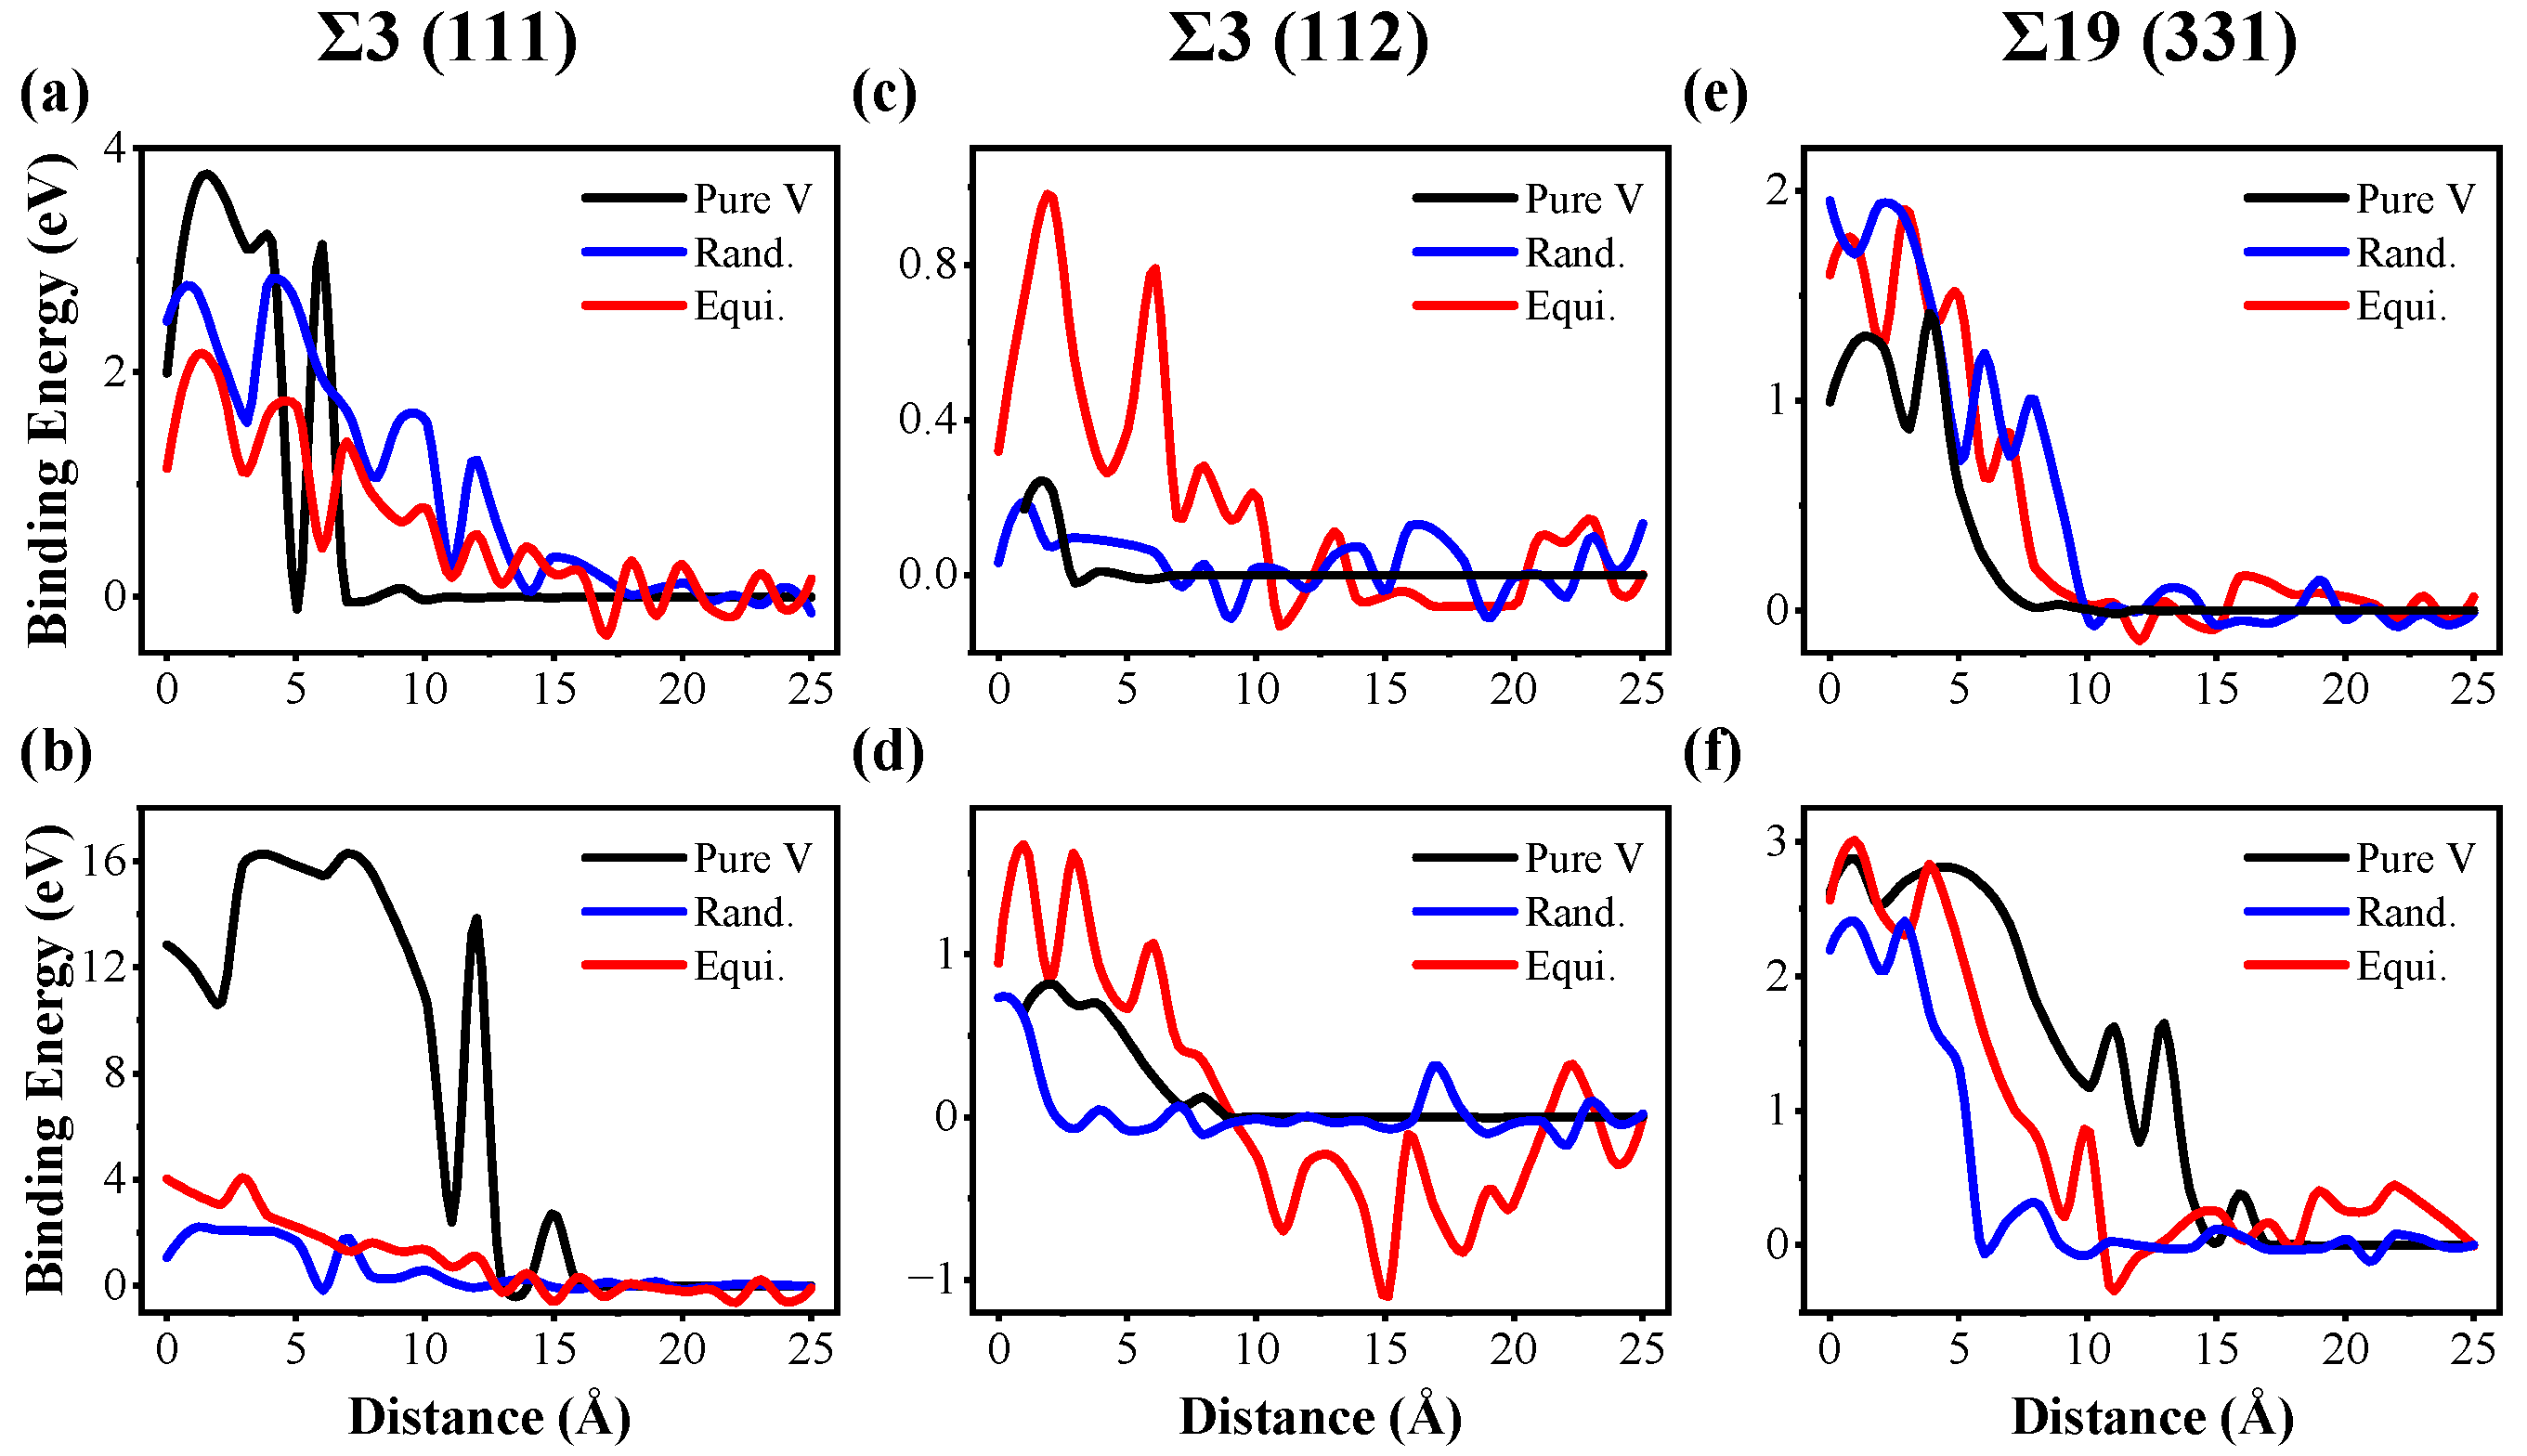
  • Compared with pure V, the vacancy absorption length scale by GBs is greater, whereas the interstitial absorption length scale by GBs is shorter in TiVTa CSAs, implying an enhanced sink strength towards vacancies and a weakened sink strength towards interstitials due to the lattice distortion and the chemical fluctuation in CSAs. This indicates an enhanced recombination efficiency of point defects due to the reduced disparity in sink strengths between vacancies and interstitials in TiVTa CSAs. This result provides an explanation for the superior irradiation resistance observed in refractory CSAs.
  • For the equilibrated CSA, the sink strengths of GBs towards interstitials are enhanced through local ordering with elemental segregation. Conversely, the elemental segregation tends to suppress the sink strength towards vacancies. The bias of GBs towards interstitials and vacancies is thus enhanced, thereby diminishing the efficient annihilation of point defects in the vicinity of GBs. This finding may serve as a valuable reference and theoretical foundation for future investigations on refractory CSAs.

Author Contributions

Conceptualization, Y.Z. and Y.D.; methodology, L.W. and Y.Z.; software, L.W. and Y.Z.; validation, L.W., Y.Z. and Y.D.; formal analysis, L.W. and Y.Z.; investigation, L.W. and Y.Z.; resources, Y.D.; data curation, L.W. and Y.Z.; writing—original draft preparation, L.W.; writing—review and editing, Y.Z., Y.D., X.H., H.D. and W.Y.; visualization, L.W., Z.Z. and M.C.; supervision, Y.Z. and Y.D.; project administration, Y.Z. and Y.D.; funding acquisition, Y.D. All authors have read and agreed to the published version of the manuscript.

Funding

This research was funded by the Dean’s Fund of China Institute of Atomic Energy (grant number 219256) and the National Natural Science Foundation of China (Grants No. UU2341260).

Data Availability Statement

Data are contained within the article.

Conflicts of Interest

The authors declare no conflicts of interest.

References

  1. Locatelli, G.; Mancini, M.; Todeschini, N. Generation IV nuclear reactors: Current status and future prospects. Energy Policy 2013, 61, 1503–1520. [Google Scholar] [CrossRef]
  2. Senkov, O.N.; Miracle, D.B.; Chaput, K.J.; Couzinie, J.-P. Development and exploration of refractory high entropy alloys—A review. J. Mater. Res. 2018, 33, 3092–3128. [Google Scholar] [CrossRef]
  3. Senkov, O.; Gorsse, S.; Miracle, D. High temperature strength of refractory complex concentrated alloys. Acta Mater. 2019, 175, 394–405. [Google Scholar] [CrossRef]
  4. Gorsse, S.; Miracle, D.B.; Senkov, O.N. Mapping the world of complex concentrated alloys. Acta Mater. 2017, 135, 177–187. [Google Scholar] [CrossRef]
  5. Gorsse, S.; Couzinié, J.-P.; Miracle, D.B. From high-entropy alloys to complex concentrated alloys. Comptes Rendus Phys. 2018, 19, 721–736. [Google Scholar] [CrossRef]
  6. Dewangan, S.K.; Mangish, A.; Kumar, S.; Sharma, A.; Ahn, B.; Kumar, V. A review on High-Temperature Applicability: A milestone for high entropy alloys. Eng. Sci. Technol. Int. J. 2022, 35, 101211. [Google Scholar] [CrossRef]
  7. Zong, Y.; Hashimoto, N.; Oka, H. Study on irradiation effects of refractory bcc high-entropy alloy. Nucl. Mater. Energy 2022, 31, 101158. [Google Scholar] [CrossRef]
  8. Pan, Q.; Zhang, L.; Feng, R.; Lu, Q.; An, K.; Chuang, A.C.; Poplawsky, J.D.; Liaw, P.K.; Lu, L. Gradient cell–structured high-entropy alloy with exceptional strength and ductility. Science 2021, 374, 984–989. [Google Scholar] [CrossRef]
  9. Pickering, E.J.; Carruthers, A.W.; Barron, P.J.; Middleburgh, S.C.; Armstrong, D.E.; Gandy, A.S. High-Entropy Alloys for Advanced Nuclear Applications. Entropy 2021, 23, 98. [Google Scholar] [CrossRef]
  10. El-Atwani, O.; Li, N.; Li, M.; Devaraj, A.; Baldwin, J.K.S.; Schneider, M.M.; Sobieraj, D.; Wróbel, J.S.; Nguyen-Manh, D.; Maloy, S.A.; et al. Outstanding radiation resistance of tungsten-based high-entropy alloys. Sci. Adv. 2019, 5, eaav2002. [Google Scholar] [CrossRef]
  11. Miracle, D.B.; Senkov, O.N.; Wilks, J. A critical review of high entropy alloys and related concepts. Acta Mater. 2017, 122, 448–511. [Google Scholar] [CrossRef]
  12. Hu, B.; Yao, B.; Wang, J.; Liu, Y.; Wang, C.; Du, Y.; Yin, H. The Phase Equilibria of the Ti–V–M (M = Si, Nb, Ta) Ternary Systems. Intermetallics 2020, 118, 106701. [Google Scholar] [CrossRef]
  13. Jia, N.; Li, Y.; Liu, X.; Zheng, Y.; Wang, B.; Wang, J.; Xue, Y.; Jin, K. Thermal Stability and Mechanical Properties of Low-Activation Single-Phase Ti-V-Ta Medium Entropy Alloys. JOM 2019, 71, 3490–3498. [Google Scholar] [CrossRef]
  14. Scales, R.J.; Armstrong, D.; Wilkinson, A.J.; Li, B.-S. On the brittle-to-ductile transition of the as-cast TiVNbTa refractory high-entropy alloy. Materialia 2020, 14, 100940. [Google Scholar] [CrossRef]
  15. Yao, H.W.; Qiao, J.W.; Gao, M.C.; Hawk, J.A.; Ma, S.G.; Zhou, H.F.; Zhang, Y. NbTaV-(Ti,W) refractory high-entropy alloys: Experiments and modeling. Mater. Sci. Eng. A 2016, 674, 203–211. [Google Scholar] [CrossRef]
  16. Lee, C.; Song, G.; Gao, M.C.; Feng, R.; Chen, P.; Brechtl, J.; Chen, Y.; An, K.; Guo, W.; Poplawsky, J.D.; et al. Lattice distortion in a strong and ductile refractory high-entropy alloy. Acta Mater. 2018, 160, 158–172. [Google Scholar] [CrossRef]
  17. Kareer, A.; Waite, J.C.; Li, B.; Couet, A.; Armstrong, D.E.J.; Wilkinson, A.J. Short Communication: ‘Low Activation, Refractory, High Entropy Alloys for Nuclear Applications’. J. Nucl. Mater. 2019, 526, 151744. [Google Scholar] [CrossRef]
  18. An, Z.; Mao, S.; Liu, Y.; Wang, L.; Zhou, H.; Gan, B.; Zhang, Z.; Han, X. A novel HfNbTaTiV high-entropy alloy of superior mechanical properties designed on the principle of maximum lattice distortion. J. Mater. Sci. Technol. 2021, 79, 109–117. [Google Scholar] [CrossRef]
  19. Sadeghilaridjani, M.; Ayyagari, A.; Muskeri, S.; Hasannaeimi, V.; Salloom, R.; Chen, W.-Y.; Mukherjee, S. Ion irradiation response and mechanical behavior of reduced activity high entropy alloy. J. Nucl. Mater. 2020, 529, 151955. [Google Scholar] [CrossRef]
  20. Mei, L.; Zhang, Q.; Dou, Y.; Fu, E.; Li, L.; Chen, S.; Dong, Y.; Guo, X.; He, X.; Yang, W.; et al. Distinct ion irradiation response in VTaTi medium entropy alloy from elemental metal V. Scr. Mater. 2023, 223, 115070. [Google Scholar] [CrossRef]
  21. Jia, N.; Li, Y.; Huang, H.; Chen, S.; Li, D.; Dou, Y.; He, X.; Yang, W.; Xue, Y.; Jin, K. Helium bubble formation in refractory single-phase concentrated solid solution alloys under MeV He ion irradiation. J. Nucl. Mater. 2021, 550, 152937. [Google Scholar] [CrossRef]
  22. Dou, Y.-K.; Zhao, Y.-P.; He, X.-F.; Gao, J.; Cao, J.-L.; Yang, W. First-principles study of vacancy defects in TiVTa and TiVTaNb concentrated solid-solution alloys. J. Nucl. Mater. 2023, 573, 154096. [Google Scholar] [CrossRef]
  23. Zhao, Y.-P.; Dou, Y.-K.; He, X.-F.; Deng, H.-Q.; Wang, L.-F.; Yang, W. An atomic scale study on self-interstitial formation and diffusion behaviors in TiVTa and TiVTaNb concentrated solid-solution alloys. Comput. Mater. Sci. 2023, 218, 111943. [Google Scholar] [CrossRef]
  24. Maiti, S.; Steurer, W. Structural-disorder and its effect on mechanical properties in single-phase TaNbHfZr high-entropy alloy. Acta Mater. 2016, 106, 87–97. [Google Scholar] [CrossRef]
  25. Zhang, F.X.; Zhao, S.; Jin, K.; Xue, H.; Velisa, G.; Bei, H.; Huang, R.; Ko, J.Y.P.; Pagan, D.C.; Neuefeind, J.C.; et al. Local Structure and Short-Range Order in a NiCoCr Solid Solution Alloy. Phys. Rev. Lett. 2017, 118, 205501. [Google Scholar] [CrossRef] [PubMed]
  26. Cowley, J.M. X-Ray Measurement of Order in Single Crystals of Cu3Au. J. Appl. Phys. 2004, 21, 24–30. [Google Scholar] [CrossRef]
  27. Chen, S.; Aitken, Z.H.; Pattamatta, S.; Wu, Z.; Yu, Z.G.; Srolovitz, D.J.; Liaw, P.K.; Zhang, Y.-W. Simultaneously enhancing the ultimate strength and ductility of high-entropy alloys via short-range ordering. Nat. Commun. 2021, 12, 4953. [Google Scholar] [CrossRef]
  28. Ji, W.; Wu, M.S. Inhibiting the inverse Hall-Petch behavior in CoCuFeNiPd high-entropy alloys with short-range ordering and grain boundary segregation. Scr. Mater. 2022, 221, 114950. [Google Scholar] [CrossRef]
  29. Li, Q.-J.; Sheng, H.; Ma, E. Strengthening in multi-principal element alloys with local-chemical-order roughened dislocation pathways. Nat. Commun. 2019, 10, 3563. [Google Scholar] [CrossRef]
  30. Zhao, S.; Osetsky, Y.N.; Zhang, Y. Atomic-scale dynamics of edge dislocations in Ni and concentrated solid solution NiFe alloys. J. Alloys Compd. 2017, 701, 1003–1008. [Google Scholar] [CrossRef]
  31. Zhao, S. Effects of local elemental ordering on defect-grain boundary interactions in high-entropy alloys. J. Alloys Compd. 2021, 887, 161314. [Google Scholar] [CrossRef]
  32. Niu, C.; Zaddach, A.J.; Oni, A.A.; Sang, X.; Hurt, J.W.; LeBeau, J.M.; Koch, C.C.; Irving, D.L. Spin-driven ordering of Cr in the equiatomic high entropy alloy NiFeCrCo. Appl. Phys. Lett. 2015, 106, 161906. [Google Scholar] [CrossRef]
  33. Chen, S.; Aitken, Z.H.; Pattamatta, S.; Wu, Z.; Yu, Z.G.; Srolovitz, D.J.; Liaw, P.K.; Zhang, Y.-W. Short-range ordering alters the dislocation nucleation and propagation in refractory high-entropy alloys. Mater. Today 2023, 65, 14–25. [Google Scholar] [CrossRef]
  34. Moon, J.; Jang, M.J.; Bae, J.W.; Yim, D.; Park, J.M.; Lee, J.; Kim, H.S. Mechanical behavior and solid solution strengthening model for face-centered cubic single crystalline and polycrystalline high-entropy alloys. Intermetallics 2018, 98, 89–94. [Google Scholar] [CrossRef]
  35. Zhang, Y.; A Tunes, M.; Crespillo, M.L.; Zhang, F.; Boldman, W.L.; Rack, P.D.; Jiang, L.; Xu, C.; Greaves, G.; E Donnelly, S.; et al. Thermal stability and irradiation response of nanocrystalline CoCrCuFeNi high-entropy alloy. Nanotechnology 2019, 30, 294004. [Google Scholar] [CrossRef] [PubMed]
  36. Wynblatt, P.; Chatain, D. Modeling grain boundary and surface segregation in multicomponent high-entropy alloys. Phys. Rev. Mater. 2019, 3, 054004. [Google Scholar] [CrossRef]
  37. Li, L.; Kamachali, R.D.; Li, Z.; Zhang, Z. Grain boundary energy effect on grain boundary segregation in an equiatomic high-entropy alloy. Phys. Rev. Mater. 2020, 4, 053603. [Google Scholar] [CrossRef]
  38. Li, X.-G.; Chen, C.; Zheng, H.; Zuo, Y.; Ong, S.P. Complex strengthening mechanisms in the NbMoTaW multi-principal element alloy. npj Comput. Mater. 2020, 6, 70. [Google Scholar] [CrossRef]
  39. Ackland, G. Controlling Radiation Damage. Science 2010, 327, 1587–1588. [Google Scholar] [CrossRef]
  40. Han, W.; Demkowicz, M.; Fu, E.; Wang, Y.; Misra, A. Effect of grain boundary character on sink efficiency. Acta Mater. 2012, 60, 6341–6351. [Google Scholar] [CrossRef]
  41. Lejcek, P. Grain Boundary Segregation in Metals; Springer Series in Materials Science; Springer: Berlin/Heidelberg, Germany, 2010. [Google Scholar]
  42. Tschopp, M.A.; Solanki, K.N.; Gao, F.; Sun, X.; Khaleel, M.A.; Horstemeyer, M.F. Probing Grain Boundary Sink Strength at the Nanoscale: Energetics and Length Scales of Vacancy and Interstitial Absorption by Grain Boundaries in A-Fe. Phys. Rev. B 2012, 85, 064108. [Google Scholar] [CrossRef]
  43. Bai, X.-M.; Voter, A.F.; Hoagland, R.G.; Nastasi, M.; Uberuaga, B.P. Efficient Annealing of Radiation Damage Near Grain Boundaries via Interstitial Emission. Science 2010, 327, 1631–1634. [Google Scholar] [CrossRef] [PubMed]
  44. Chen, D.; Wang, J.; Chen, T.; Shao, L. Defect annihilation at grain boundaries in alpha-Fe. Sci. Rep. 2013, 3, srep01450. [Google Scholar]
  45. Zhang, J.; He, H.; Liu, W.; Kang, L.; Yun, D.; Chen, P. Effects of grain boundaries on the radiation-induced defects evolution in BCC Fe–Cr alloy: A molecular dynamics study. Nucl. Mater. Energy 2020, 22, 100726. [Google Scholar] [CrossRef]
  46. Kumar, N.A.P.K.; Li, C.; Leonard, K.J.; Bei, H.; Zinkle, S.J. Microstructural stability and mechanical behavior of FeNiMnCr high entropy alloy under ion irradiation. Acta Mater. 2016, 113, 230–244. [Google Scholar] [CrossRef]
  47. Barr, C.M.; Nathaniel, J.E.; Unocic, K.A.; Liu, J.; Zhang, Y.; Wang, Y.; Taheri, M.L. Exploring Radiation Induced Segregation Mechanisms at Grain Boundaries in Equiatomic Cocrfenimn High Entropy Alloy under Heavy Ion Irradiation. Scr. Mater. 2018, 156, 80–84. [Google Scholar] [CrossRef]
  48. Song, H.; Tian, F.; Hu, Q.-M.; Vitos, L.; Wang, Y.; Shen, J.; Chen, N. Local lattice distortion in high-entropy alloys. Phys. Rev. Mater. 2017, 1, 023404. [Google Scholar] [CrossRef]
  49. He, M.-R.; Wang, S.; Shi, S.; Jin, K.; Bei, H.; Yasuda, K.; Matsumura, S.; Higashida, K.; Robertson, I.M. Mechanisms of Radiation-Induced Segregation in Crfeconi-Based Single-Phase Concentrated Solid Solution Alloys. Acta Mater. 2017, 126, 182–193. [Google Scholar] [CrossRef]
  50. Shi, T.; Su, Z.; Li, J.; Liu, C.; Yang, J.; He, X.; Yun, D.; Peng, Q.; Lu, C. Distinct point defect behaviours in body-centered cubic medium-entropy alloy NbZrTi induced by severe lattice distortion. Acta Mater. 2022, 229, 117806. [Google Scholar] [CrossRef]
  51. Zhang, P.; Jiang, L.; Yang, J.; Su, Z.; Wang, J.; Shi, T.; Lu, C. Research Progress in Refractory High Entropy Alloys for Nuclear Applications. Mater. Rep. 2022, 36, 5–26. [Google Scholar]
  52. Chen, S.; Aitken, Z.H.; Pattamatta, S.; Wu, Z.; Yu, Z.G.; Banerjee, R.; Srolovitz, D.J.; Liaw, P.K.; Zhang, Y.-W. Chemical-Affinity Disparity and Exclusivity Drive Atomic Segregation, Short-Range Ordering, and Cluster Formation in High-Entropy Alloys. Acta Mater. 2021, 206, 116638. [Google Scholar] [CrossRef]
  53. Plimpton, S. Fast Parallel Algorithms for Short-Range Molecular Dynamics. J. Comput. Phys. 1995, 117, 1–19. [Google Scholar] [CrossRef]
  54. Qiu, R.; Chen, Y.; Liao, X.; He, X.; Yang, W.; Hu, W.; Deng, H. Finnis–Sinclair-type potential for atomistic simulation of defects behaviour in V-Ti-Ta ternary system. J. Nucl. Mater. 2021, 557, 153231. [Google Scholar] [CrossRef]
  55. Tschopp, M.A.; Mcdowell, D.L. Asymmetric tilt grain boundary structure and energy in copper and aluminium. Philos. Mag. 2007, 87, 3871–3892. [Google Scholar] [CrossRef]
  56. Marian, J.; Wirth, B.; Odette, G.; Perlado, J. Cu diffusion in α-Fe: Determination of solute diffusivities using atomic-scale simulations. Comput. Mater. Sci. 2004, 31, 347–367. [Google Scholar] [CrossRef]
  57. Zhao, Y.-P.; Dou, Y.-K.; He, X.-F.; Cao, H.; Wang, L.-F.; Deng, H.-Q.; Yang, W. Molecular Dynamics Study of Primary Radiation Damage in Tivta Concentrated Solid-Solution Alloy. Chin. Phys. B 2023. [Google Scholar] [CrossRef]
  58. Stukowski, A. Visualization and analysis of atomistic simulation data with OVITO—The Open Visualization Tool. Model. Simul. Mater. Sci. Eng. 2009, 18, 015012. [Google Scholar] [CrossRef]
  59. Larsen, P.M.; Schmidt, S.; Schiøtz, J. Robust structural identification via polyhedral template matching. Model. Simul. Mater. Sci. Eng. 2016, 24, 05500. [Google Scholar] [CrossRef]
  60. Stukowski, A. Computational Analysis Methods in Atomistic Modeling of Crystals. JOM 2014, 66, 399–407. [Google Scholar] [CrossRef]
  61. Li, C.; Lu, S.; Divinski, S.; Vitos, L. Theoretical and experimental grain boundary energies in body-centered cubic metals. Acta Mater. 2023, 255, 119074. [Google Scholar] [CrossRef]
  62. Utt, D.; Stukowski, A.; Albe, K. Grain boundary structure and mobility in high-entropy alloys: A comparative molecular dynamics study on a Σ11 symmetrical tilt grain boundary in face-centered cubic CuNiCoFe. Acta Mater. 2020, 186, 11–19. [Google Scholar] [CrossRef]
  63. Bristowe, P.D.; Crocker, A.G.; Norgett, M.J. The structure of twin boundaries in body centred cubic metals. J. Phys. F: Met. Phys. 1974, 4, 1859–1864. [Google Scholar] [CrossRef]
  64. Bristowe, P.D.; Crocker, A.G. A computer simulation study of the structures of twin boundaries in body-centred cubic crystals. Philos. Mag. 1975, 31, 503–517. [Google Scholar] [CrossRef]
  65. Nilles, J.L.; Olson, D.L. Energy of a bcc Iron Deformation Twin Boundary. J. Appl. Phys. 2003, 41, 531–532. [Google Scholar] [CrossRef]
  66. Vystavél, T.; Pénisson, J.M.; Gemperle, A. High-Resolution and Conventional Electron Microscopy Study of a Σ = 3, [101]{121} Twin Grain Boundary in Molybdenum. Philos. Mag. A 2001, 81, 417–429. [Google Scholar] [CrossRef]
  67. Kittel, C. Introduction to Solid State Physics; John Wiley & Sons: New York, NY, USA, 1956. [Google Scholar]
  68. Aray, Y.; Rodriguez, J.; Vega, D. Topology of the Electron Density and Cohesive Energy of the Face-Centered Cubic Transition Metals. J. Phys. Chem. B 2000, 104, 4608–4612. [Google Scholar] [CrossRef]
  69. Starace, A.K.; Neal, C.M.; Cao, B.; Jarrold, M.F.; Aguado, A.; López, J.M. Correlation between the Latent Heats and Cohesive Energies of Metal Clusters. J. Chem. Phys. 2008, 129, 144702. [Google Scholar] [CrossRef] [PubMed]
  70. Yan, S. Fundamentals of Solid State Physics; Peking University Press: Beijing, China, 2011. [Google Scholar]
  71. Sorkin, V.; Chen, S.; Tan, T.L.; Yu, Z.; Man, M.; Zhang, Y. First-principles-based high-throughput computation for high entropy alloys with short range order. J. Alloys Compd. 2021, 882, 160776. [Google Scholar] [CrossRef]
  72. Rajagopalan, M.; Tschopp, M.A.; Solanki, K.N. Grain Boundary Segregation of Interstitial and Substitutional Impurity Atoms in Alpha-Iron. JOM 2014, 66, 129–138. [Google Scholar] [CrossRef]
Figure 1. An example of the bicrystal simulation cell used for the grain boundary structure calculations.
Crystals 14 00166 g001
Figure 2. Axis <110> symmetric tilt grain boundary structures with structural units outlined for the (ad) Σ3 (111), (eh) Σ3 (112), and (il) Σ19 (331) grain boundaries. Black and white denote atoms on different {110} planes. The different structural units are labeled D and E.
Crystals 14 00166 g002
Figure 3. The radial distribution g(r) of pure V and TiVTa CSAs models with (a) Σ3 (111), (b) Σ3 (112), and (c) Σ19 (331) grain boundaries.
Crystals 14 00166 g003
Figure 4. MSDs of atoms (without distinguishing between different types of atoms) in pure V and TiVTa CSAs with three types of grain boundaries.
Crystals 14 00166 g004
Figure 5. Atomic energy distribution at (a) Σ3 (111), (b) Σ3 (112), and (c) Σ19 (331) static grain boundaries in pure V.
Crystals 14 00166 g005
Figure 6. Energy distribution of different atoms at (a) Σ3 (111), (b) Σ3 (112), and (c) Σ19 (331) static grain boundaries in TiVTa CSAs. The black, blue, and red atoms represent V, Ti, and Ta atoms, respectively.
Crystals 14 00166 g006
Figure 7. Potential energy, atomic configurations, and Warren–Cowley parameters of the TiVTa CSAs with Σ3 (111) GB during iterations at 300 K. (a) Variation of potential energy with iterations. Atomic configurations and tables of Warren–Cowley parameters at 0 ps (b,e), 500 ps (c,f) and 5000 ps (d,g).
Crystals 14 00166 g007
Figure 8. The analysis of Σ3 (111) GB in TiVTa CSAs with randomly distributed atoms (ac) and elemental segregation (df). (a,d) show the distribution of atom types. The color-coding of atoms: Ti: blue, V: cyan, and Ta: pink. (b,e) show the distribution of atomic structures. Blue represents the bcc structure and white represents other structures. The slice surface shows the distribution of atom types at grain boundaries. (c,f) show the distribution of the number of different types of atoms along the y axis.
Crystals 14 00166 g008
Figure 9. The analysis of Σ3 (112) GB in TiVTa CSAs with randomly distributed atoms (ac) and elemental segregation (df). (a,d) show the distribution of atom types. The color-coding of atoms: Ti: blue, V: cyan, and Ta: pink. (b,e) show the distribution of atomic structures. Blue represents the bcc structure and white represents other structures. The slice surface shows the distribution of atom types at grain boundaries. (c,f) show the distribution of the number of different types of atoms along the y axis.
Crystals 14 00166 g009
Figure 10. The analysis of Σ19 (331) GB in TiVTa CSAs with randomly distributed atoms (ac) and elemental segregation (df). (a,d) show the distribution of atom types. The color-coding of atoms: Ti: blue, V: cyan, and Ta: pink. (b,e) show the distribution of atomic structures. Blue represents the bcc structure and white represents other structures. The slice surface shows the distribution of atom types at grain boundaries. (c,f) show the distribution of the number of different types of atoms along the y axis.
Crystals 14 00166 g010
Figure 11. Vacancy formation energies in the vicinity of three types of GBs in (ac) pure V, (df) random CSA, and (gi) equilibrated CSA with Ti segregation.
Crystals 14 00166 g011
Figure 12. Interstitial formation energies in the vicinity of three types of GBs in (ac) pure V, (df) random CSA, and (gi) equilibrated CSA with Ti segregation.
Crystals 14 00166 g012
Figure 13. Evolution of the vacancy (the first row) and interstitial (the second row) mean binding energies as a function of the distance from the GB center for (a,b) Σ3 (111) GB, (c,d) Σ3 (112) GB, and (e,f) Σ19 (331) GB.
Crystals 14 00166 g013
Table 1. Cohesive energies (eV) and chemical affinities of atomic pairs for the TiVTa CSAs compared with the results of [33].
Atomic PairsEcoheChemical Affinity [33]
This WorkMD [33]DFT [33]
Ti–Ti−4.8−4.9−5.30.0
Ti–V−5.0\\\
Ti–Ta−6.4−6.3−6.60.4
V–V−5.3\−5.40.0
V–Ta−6.7\−6.90.4
Ta–Ta−8.1−8.1−8.10.8
Table 2. The sink strength of GBs as measured by the formation energy difference ( E f d i f f ) between the average value away from the GB ( E f a v e ) and the lowest value near the GB ( E f min ) from the averaged values. All results are given in eV.
VacanciesInterstitials
E V f d i f f E V f a v e E V f m i n E I f d i f f E I f a v e E I f m i n
Random CSA(111)3.481.75−1.732.222.20−0.02
(112)0.191.881.690.732.211.48
(331)2.291.92−0.372.402.19−0.21
Equilibrated CSA(111)2.112.580.474.104.150.05
(112)0.992.481.491.673.521.85
(331)1.922.270.353.013.390.38
Disclaimer/Publisher’s Note: The statements, opinions and data contained in all publications are solely those of the individual author(s) and contributor(s) and not of MDPI and/or the editor(s). MDPI and/or the editor(s) disclaim responsibility for any injury to people or property resulting from any ideas, methods, instructions or products referred to in the content.

