Article

Heat-Affected Zone Microstructural Study via Coupled Numerical/Physical Simulation in Welded Superduplex Stainless Steels

by
Leonardo Oliveira Passos da Silva
1,
Tiago Nunes Lima
2,
Francisco Magalhães dos Santos Júnior
1,
Bruna Callegari
2,
Luís Fernando Folle
2 and
Rodrigo Santiago Coelho
1,2,*
1
Programa de Pós-Graduação GETEC/MPDS/MCTI, Centro Universitário SENAI CIMATEC, Av. Orlando Gomes 1845, Salvador 41650-010, Brazil
2
SENAI CIMATEC, Instituto SENAI de Inovação em Conformação e União de Materiais (CIMATEC ISI C&UM), Av. Orlando Gomes 1845, Salvador 41650-010, Brazil
*
Author to whom correspondence should be addressed.
Crystals 2024, 14(3), 204; https://doi.org/10.3390/cryst14030204
Submission received: 26 January 2024 / Revised: 9 February 2024 / Accepted: 12 February 2024 / Published: 21 February 2024

Abstract

:
Superduplex stainless steels (SDSS) are known for their combination of good mechanical properties and excellent corrosion resistance, enabled by the microstructural balance between austenite and ferrite and an amount of alloying elements. Their application in welded components is, however, limited by the possibility of the precipitation of intermetallic phases and microstructural misbalance, which might hinder their properties, especially in the heat-affected zone (HAZ). This work introduces a methodology that relies simultaneously on physical and numerical simulations to study the HAZ in a UNS S32750 SDSS. Dimensions of the fusion zone and thermal cycles were calibrated for a numerical model using preliminary welding trials. Numerically simulated cycles for each heat input (HI) were physically reproduced in a Gleeble® simulator, and the heat-treated samples were characterized and compared with real specimens welded using the same parameters. Thermal curves resulting from the numerical simulations were successfully replicated by the Gleeble®, indicating adequate application of the desired HI. The hardness and microstructural results from simulated and welded specimens were also found to be quite similar. Therefore, the proposed methodology showed itself adequate not only for the study of duplex stainless steels, but also of materials with similar thermal and mechanical properties, including the extrapolation of welding parameters.

1. Introduction

Many industrial sectors demand advanced materials with excellent mechanical and corrosion properties. One example of such materials are the duplex stainless steels [1]. Frequently, components wherein these materials are used involve a welding step in their manufacturing process. Therefore, the weldability of duplex stainless steels has been the focus of extensive research [2].
Stainless steels are widely used in a variety of applications due to their corrosion resistance achieved by a passive Cr2O3 film, which prevents future oxidation, ensuring resistance to corrosion in these alloys. The family of stainless steels includes martensitic, ferritic, austenitic, precipitation-hardened, and duplex steels, classified according to their microstructural phases and chemical composition. Duplex stainless steels emerged from industry’s increasing need for materials that combine corrosion resistance and mechanical strength. These alloys consist of roughly equal fractions of ferrite (δ) and austenite (γ), combining the favorable properties of austenitic and ferritic stainless steels. Among duplex steels, superduplex stainless steels stand out for their higher content of alloying elements and a pitting resistance equivalent number (PREN) greater than 40, developed to enhance the properties of conventional duplex steels. The application of these materials provides a significant reduction in the thickness of equipment such as pressure vessels and heat exchangers, and a consequent weight reduction [3,4,5].
The heavy amount of alloying elements in duplex stainless steels enables high levels of mechanical and corrosive properties. On the other hand, these elements also facilitate the appearance of intermetallic phases in certain time/temperature conditions, such as those typically faced during welding processes [6]. In these steels, secondary phases can precipitate in temperatures ranging between 300 °C and 1000 °C, preferentially at grain boundaries, leading to embrittlement and negatively affecting their corrosion resistance [7]. One of the main deleterious phases is sigma (σ), which can reduce both the impact and corrosion resistance of duplex stainless steels, leading to as much as a 90% decrease in toughness when its quantity lies close to 4% [8,9,10].
Due to its likely deleterious effects, it is absolutely important to understand the effect of the welding thermal cycle on the fabrication and operation of industrial equipment, with the need to control both composition and microstructure in the weld region [7]. Properties of the fusion zone (FZ) are influenced by the choice of filler and shielding gases, which can contain some alloying elements to compensate for possible losses that occur during the process [3]. In its turn, properties of the heat-affected zone (HAZ) are affected by the thermal cycle alone, which is why it is crucial to understand its behavior upon exposure to heat [11]. In some materials, such as duplex stainless steels, this region is extremely narrow and difficult to isolate, imposing limitations on its characterization, especially in the case of multi-pass welding [2,3,12].
Simulation plays a key role in several manufacturing stages, e.g., casting, welding and heat treatment [13]. Regarding welding, numerical and physical simulations allow the prediction of the material’s response when exposed to thermal cycles, thus enabling an enlargement of the HAZ for subsequent analysis [14,15,16,17,18]. Computational simulations are useful to predict thermal cycles and microstructural evolution, which converts into the time reduction and economy of resources necessary to evaluate the effect of parameter variation on the behavior of the welded joint [19]. Likewise, physical simulation reproduces thermal cycles in larger-scale specimens for subsequent laboratory testing to study in detail the region that is subjected to a specific thermal cycle [20]. However, studies that combine physical and numerical simulations to analyze and predict HAZ microstructure and behavior are scarce, mainly when it comes to multi-pass welding as compared with conventional HAZ studies using simple welding procedures [19,21]. The lack of information about thermomechanical properties during heating and cooling in welding, mainly in multi-pass variations, constitutes a challenge for the development and calibration of numerical models [19].
Rikken et al. [22] used numerical and thermal simulations to evaluate the development of residual stresses in welded joints of S355G10+M steel. For the numerical model, material properties were collected using dilatometry and high-temperature tensile testing, whereas thermal properties were calculated using JMatPro® 4.0 software. Thermal cycles were acquired upon bead-on-plate gas metal arc welding (GMAW) runs for model validation. The study correlated mechanical properties, microstructure, and residual stresses, and agreement was observed between simulated and experimental results, although no assessment of the effect of different heat inputs and cooling rates was carried out.
In the work by Hosseini and Karlsson [23], nitrogen loss and microstructural evolution in the high temperature heat-affected zone (HTHAZ) of an AISD SAF 2507 steel were investigated by means of numerical simulation tools validated by physical simulation and autogenous bead-on-plate gas tungsten arc welding (GTAW) weldments. Such an approach allowed for the correlation between real welding and physical simulation results from data obtained by numerical simulation, comparing both real and simulated microstructures. Nonetheless, welding data were not used to calibrate the numerical simulation-derived thermal cycle for physical simulation. Moreover, no variation of heat input was conducted.
Deepu and Phanikumar [13] used an ICME-based methodology (ICME—Integrated Computational Materials Engineering) to study the microstructure and property evolution in the HAZ of a DP980 steel. In order to validate the finite element simulation, a preliminary bead-on-plate GMAW welding procedure was performed, using an ER70S-6 electrode, for subsequent comparison between experimental and numerically simulated thermal cycles. Again, results suggested good correlation between results, but no investigation of heat input variation was conducted for methodology validation.
The so-called microstructure-predicting methodology (MPM) proposed by Dornelas et al. [19] used numerical, thermodynamic, and physical simulation to predict the influence of the t8/5 time (cooling time between 800 and 500 °C) on the microstructure and mechanical behavior of the coarse-grained heat-affected zone (CGHAZ) of multi-pass Cr–Mo low-alloy steel weldments produced by GTAW and SAW. Physical properties of the material necessary for model calibration were obtained using JMatPro® software. The simulation was validated by comparison between real and simulated thermal cycles using t8/5 = 15, 30, 80, and 210 s obtained using Sysweld software and reproduced in a Gleeble® simulator equipped with a dilatometer. Sysweld’s thermal profile, the comparison between predicted and obtained microhardness, and the microstructure prediction model were used to validate the methodology, which showed itself to be an adequate tool for microstructure and hardness prediction in the CGHAZ zone, despite not correlating the thermal cycles with the corresponding heat input.
Nonetheless, welding parameters are predominantly defined through trial and error, making the process costly in terms of time, material, and expense. The use of physical simulations proves to be an effective strategy, aiming to expand the region of the HAZ for analysis and achieve more precise control over the cooling rates to which the samples are exposed. These simulations, including computational ones, can predict welding thermal cycles and microstructural changes, resulting in a significant reduction in the time and resources needed to assess the effects of parameter modifications on the behavior of welded joints. This approach not only allows for a more in-depth analysis of the HAZ but also contributes to a more informed and efficient decision-making process during welding operations.
Facing the exposed context and with the aim of filling the gaps observed in previous studies [13,19,22,23], the objective of this study is to propose a complete methodology that combines numerical and physical simulations to study the behavior of the HAZ of a multi-pass weld in UNS S32750 superduplex stainless steel, with posterior validation in specimens welded using the same parameters. This methodology involves the calibration of the numerical model, properly validated by bead-on-plate welding trials, using material properties obtained using JMatPro® 9.0 software. The proven model was then used to derive thermal cycle curves for different heat inputs to be subsequently simulated in a Gleeble® system. Microstructure and hardness of both simulated and multi-pass welded specimens were assessed and compared.

2. Materials and Methods

2.1. General Procedure

A flowchart of the developed study is shown in Figure 1. It includes numerical simulation, properly calibrated by previous multi-pass welding and using data properties obtained using JMatPro®, simulation of the thermal cycle in a Gleeble® system, and GTAW/GMAW processes for comparison with simulated specimens.
The welding procedure described in Section 2.3.1 and Section 2.3.2 was performed with the purpose of calibrating the numerical simulation (Section 2.3.3) which, in its turn, was used to convert the target heat inputs (Section 2.4.1) into a thermal cycle to be physically simulated (Section 2.4.2). Test specimens produced by physical simulation were subsequently compared with actual welds (Section 2.4.3) in terms of microstructure and hardness (Section 2.5).

2.2. Materials

Superduplex stainless steel (SDSS) UNS S32750 plates with a thickness of 10 mm were used for the experiments. The chemical composition of as-received material and the ER2594 [24] filler used in welding experiments is shown in Table 1. The initial austenite/ferrite ratio of the base steel was 50/50% ± 2%. The table also includes its PREN (pitting resistance equivalent number), which was higher than 40, as expected for super duplex steels [25].

2.3. Calibration Welding

The calibration welding procedure of the steel was carried out to provide the thermal response of the material, information regarding fusion zone dimensions, and to acquire the thermal cycle (temperature vs. time curve) corresponding to the employed heat input. This information was used to calibrate the numerical simulation model. Thermal cycles were recorded by thermocouples, and the heat input (“HI”) of each pass was calculated using monitored tension, current, and welding speed according to Equation (1) as follows:
HI = 60 × U × I 1000 × V [ kJ mm ] ,
where “V” is the welding speed [mm/min], “U” is the tension [V], and “I” is the current [A] [17]. Welds with and without weaving were produced by manual GTAW and mechanized GMAW techniques.

2.3.1. Calibration Welding with Weaving

Weave bead welding was carried out with five passes by manual GTAW (root and reinforcement) and mechanized GMAW (three final passes), using an ER2594 filler with 2.4 mm diameter. Joint dimensions, length of passes, and thermocouple positions for temperature monitoring are shown in Figure 2. After the two first GTAW passes, a transverse cut (perpendicular to the welding direction) was made for analysis of the fusion zone (FZ), and the same procedure was repeated after the final three GMAW passes.
For the manual GTAW root pass, an Origo Arc 3000i welding source with direct current was used. Argon with 99.99% purity served as purge and shielding gas, and an ER2594 stick was utilized as filler. For the mechanized GMAW welding, the same filler, but in wire form, and a Miller Electric CST 280 source were used. Ar 98% and 2% N were employed as purge and shielding gases, respectively, and a Lincoln Electric robotic manipulator was utilized for torch control. Open arc duration, voltage, current, and gas flow were obtained via a Portable Welding Process Monitoring System—SAP V4, and temperature data were acquired via two thermocouples and a thermographic camera. The average welding speed was indirectly measured by the division of the total joint length by the total open arc duration.
After welding, the cross section of the joint was sectioned and polished for microstructural analysis and for the measurement of each welding bead. Cutting sections were aligned with the thermocouples’ positions for an accurate correlation with the thermal profile. Information about thermocouple positioning and welding pool dimensions are extremely relevant parameters for the calibration of a numerical simulation [9]. Moreover, obtained thermal cycles were useful to generate the computational model from which data were extrapolated for different heat inputs.

2.3.2. Calibration Welding without Weaving

For a better understanding of the effect of heat input on the fusion zone dimensions, weldments without weaving were also produced. Bead-on-plate autogenous GTAW and ER2594-filler GMAW were performed with equal monitoring of voltage, current, average speed, and heat input. Information drawn from this procedure served to calibrate the heat source for numerical simulation. For a more assertive calibration, five and nine beads were deposited for GMAW and GTAW processes, respectively, with a variation of welding parameters, resulting in different heat inputs.

2.3.3. Numerical Simulation

GMAW and GTAW welding of the superduplex steel were simulated with the finite element method (FEM) implemented in the commercial software Simufact Welding® 2023, using input data obtained from the calibration welding. Local mesh refinement was applied to the weld area, as shown in Figure 3. The mesh used was hexahedral with sizes of 0.5 mm in the most refined part (front), 2 mm in the coarsest part (front), and 5 mm in depth. Material properties were obtained using JmatPro® 9.0 software, assuming that the material is homogeneous. Heat source parameters were calibrated based on the experimentally observed weld pool dimensions. Table 2 shows the values collected from the experiments, and the efficiency was also obtained by calibrating the simulation with the experimental observation of deposited weld pools. Table 3 shows the parameters used in the simulation.
Numerical simulation calibrated with results obtained from the welding procedures described above was carried out to reproduce heat input effects in the chosen points on the lower face of the plates, where heating and reheating effects are usually more pronounced. The aim of numerical simulation was to obtain thermal cycles for the heat inputs of interest to later be input into the Gleeble® system for physical simulation. Chosen HAZ regions were high-temperature HAZ (HTHAZ) and low-temperature HAZ (LTHAZ), as defined by their respective peak temperatures of 1350 °C and 1000 °C [9]. The fusion zone’s profile of each pass was modeled with SolidWorks® 2020 software, imported into the Apex® 2023 software for mesh creation and later imported again into Simufact Welding® for the simulation itself.
To calibrate the heat source, an ellipsoid Goldak model was selected [13,26]. For the calculation, information such as depth, width, and front and rear length of the heat source, data resulting from the calibration welding, and both pass and interpass times were required [13]. Additional parameters, e.g., room temperature (25 °C) and thermophysical properties of the material—density, thermal conductivity, and specific heat—obtained with JMatPro® 9.0 software, were also necessary for the simulation [13,27,28]. Simulation configuration also considered boundary conditions such as joint geometry and restraints in six degrees of freedom, including the use of hooks to avoid displacement [13]. From the calibrated numerical model, three heat input conditions were extrapolated, and the thermal cycles were extracted to be reproduced in the physical simulation, as detailed in Section 2.4.2.

2.4. Production of Test Specimens

2.4.1. Parameter Selection

Practical knowledge regarding superduplex stainless steel welding defines that primary heat input values should comprise between 0.7 and 1.2 kJ/mm for 7–20 mm plate thickness; the heat input of the second pass should lie around 75–85% of the first pass’s input; and the interpass temperature should not exceed 100 °C. Three heat input values were chosen as targets for this study: 70%, 110%, and 165% of the upper limit (1.20 kJ/mm), to validate the methodology for a wide heat input range. For the second pass, values of 75% with respect to the first pass were defined. Preliminary studies showed that lower heat input values resulted in insufficient fusion of the base material. The summary of conditions is shown in Table 4.

2.4.2. Physical Simulation

A Gleeble 540® welding simulator was used for physical simulation of HTHAZ and LTHAZ microstructures associated with the three heat input conditions, using specimens with dimensions of 95 × 25 × 10 mm. Thermal cycles obtained via numerical simulation were input into Gleeble’s script, QuikSim® 2 software. A free span of 28 mm between copper grips was defined. A K-type thermocouple was spot-welded onto the specimen’s surface in its mid-length position for temperature control and acquisition. All subsequent characterization was performed on the cross-sections of specimens aligned with the thermocouple’s placement.

2.4.3. Real Welding

The aim of this step was to reproduce real joints under the same conditions of the physical simulation (Table 4). However, in practice, the measured parameters indicated in Table 5 were not consistently achieved due to variations during execution, as it involved manual welding. The same joint configuration as the one shown in Figure 2 was used, with the first two passes made by GTAW and the remaining ones by GMAW. The process was monitored by an ALX III device developed by The Validation Center (TVC) with an acquisition of voltage, current, speed, gas flow, and open arc duration. A Lincoln Electric Speedtec 505 SP welding source was used, and the purge/shielding gas flow was kept between 10 and 15 L/min. GTAW was executed with a mechanized torch and manual consumable feeding. Heat input values were indirectly calculated from the data acquired by the ALX III device. For the lower heat input condition, CD1, it was necessary to perform seven passes to completely fill the welding joint.

2.5. Microstructural Characterization

For microstructural analysis, including ferrite quantification and grain size measurement, specimens were cut; embedded in resin; ground with progressively finer sandpaper grits (from #180 to #1500); and polished with glycol-based 3 µm and 1 µm diamond suspensions using an alcohol-based lubricant. After polishing, an electrolytic etching at 3 V for around 7 s was conducted using a modified Murakami etchant (40% KOH solution) [29].
For the measurement of the fusion zone dimensions, low-magnification (20×) images were acquired with a Wild M3C Heerbrugg Switzerland Type-S optical microscope. Measurements were carried out in ImageJ 1.53k software. Ferrite and austenite quantification was performed according to the ASTM E 562 standard [30]. Images of the microstructure were acquired at a magnification of 500× using a Zeiss AxioScope optical microscope. A 14 × 14 grid with 196 points was used for a higher area coverage to improve measurement precision. Phase quantification was carried out for welded and physically simulated specimens.
Physically simulated and welded specimens also underwent Vickers microhardness measurements with a 0.2 kgf load, (sufficiently low to allow for adequate indentations in the narrow HAZ regions of welded specimens [3,12]), in a Shimadzu HMV2TE tester. Twenty-four measurements were taken in physically simulated specimens and four in each one of the two studied HAZ sub-regions, being two on each side of the weld. HTHAZ indentations were done closer to the FZ, whereas LTHAZ ones were done in the region with the most intense microstructural variation, in terms of grain morphology. Hardness testing was carried out according to the ASTM A370 standard [31] after electrolytic etching, so that different regions of the weld could be identified. At the end, microstructure and hardness were compared to validate the proposed methodology.

3. Results and Discussion

3.1. Welding Calibration and Numerical Simulation

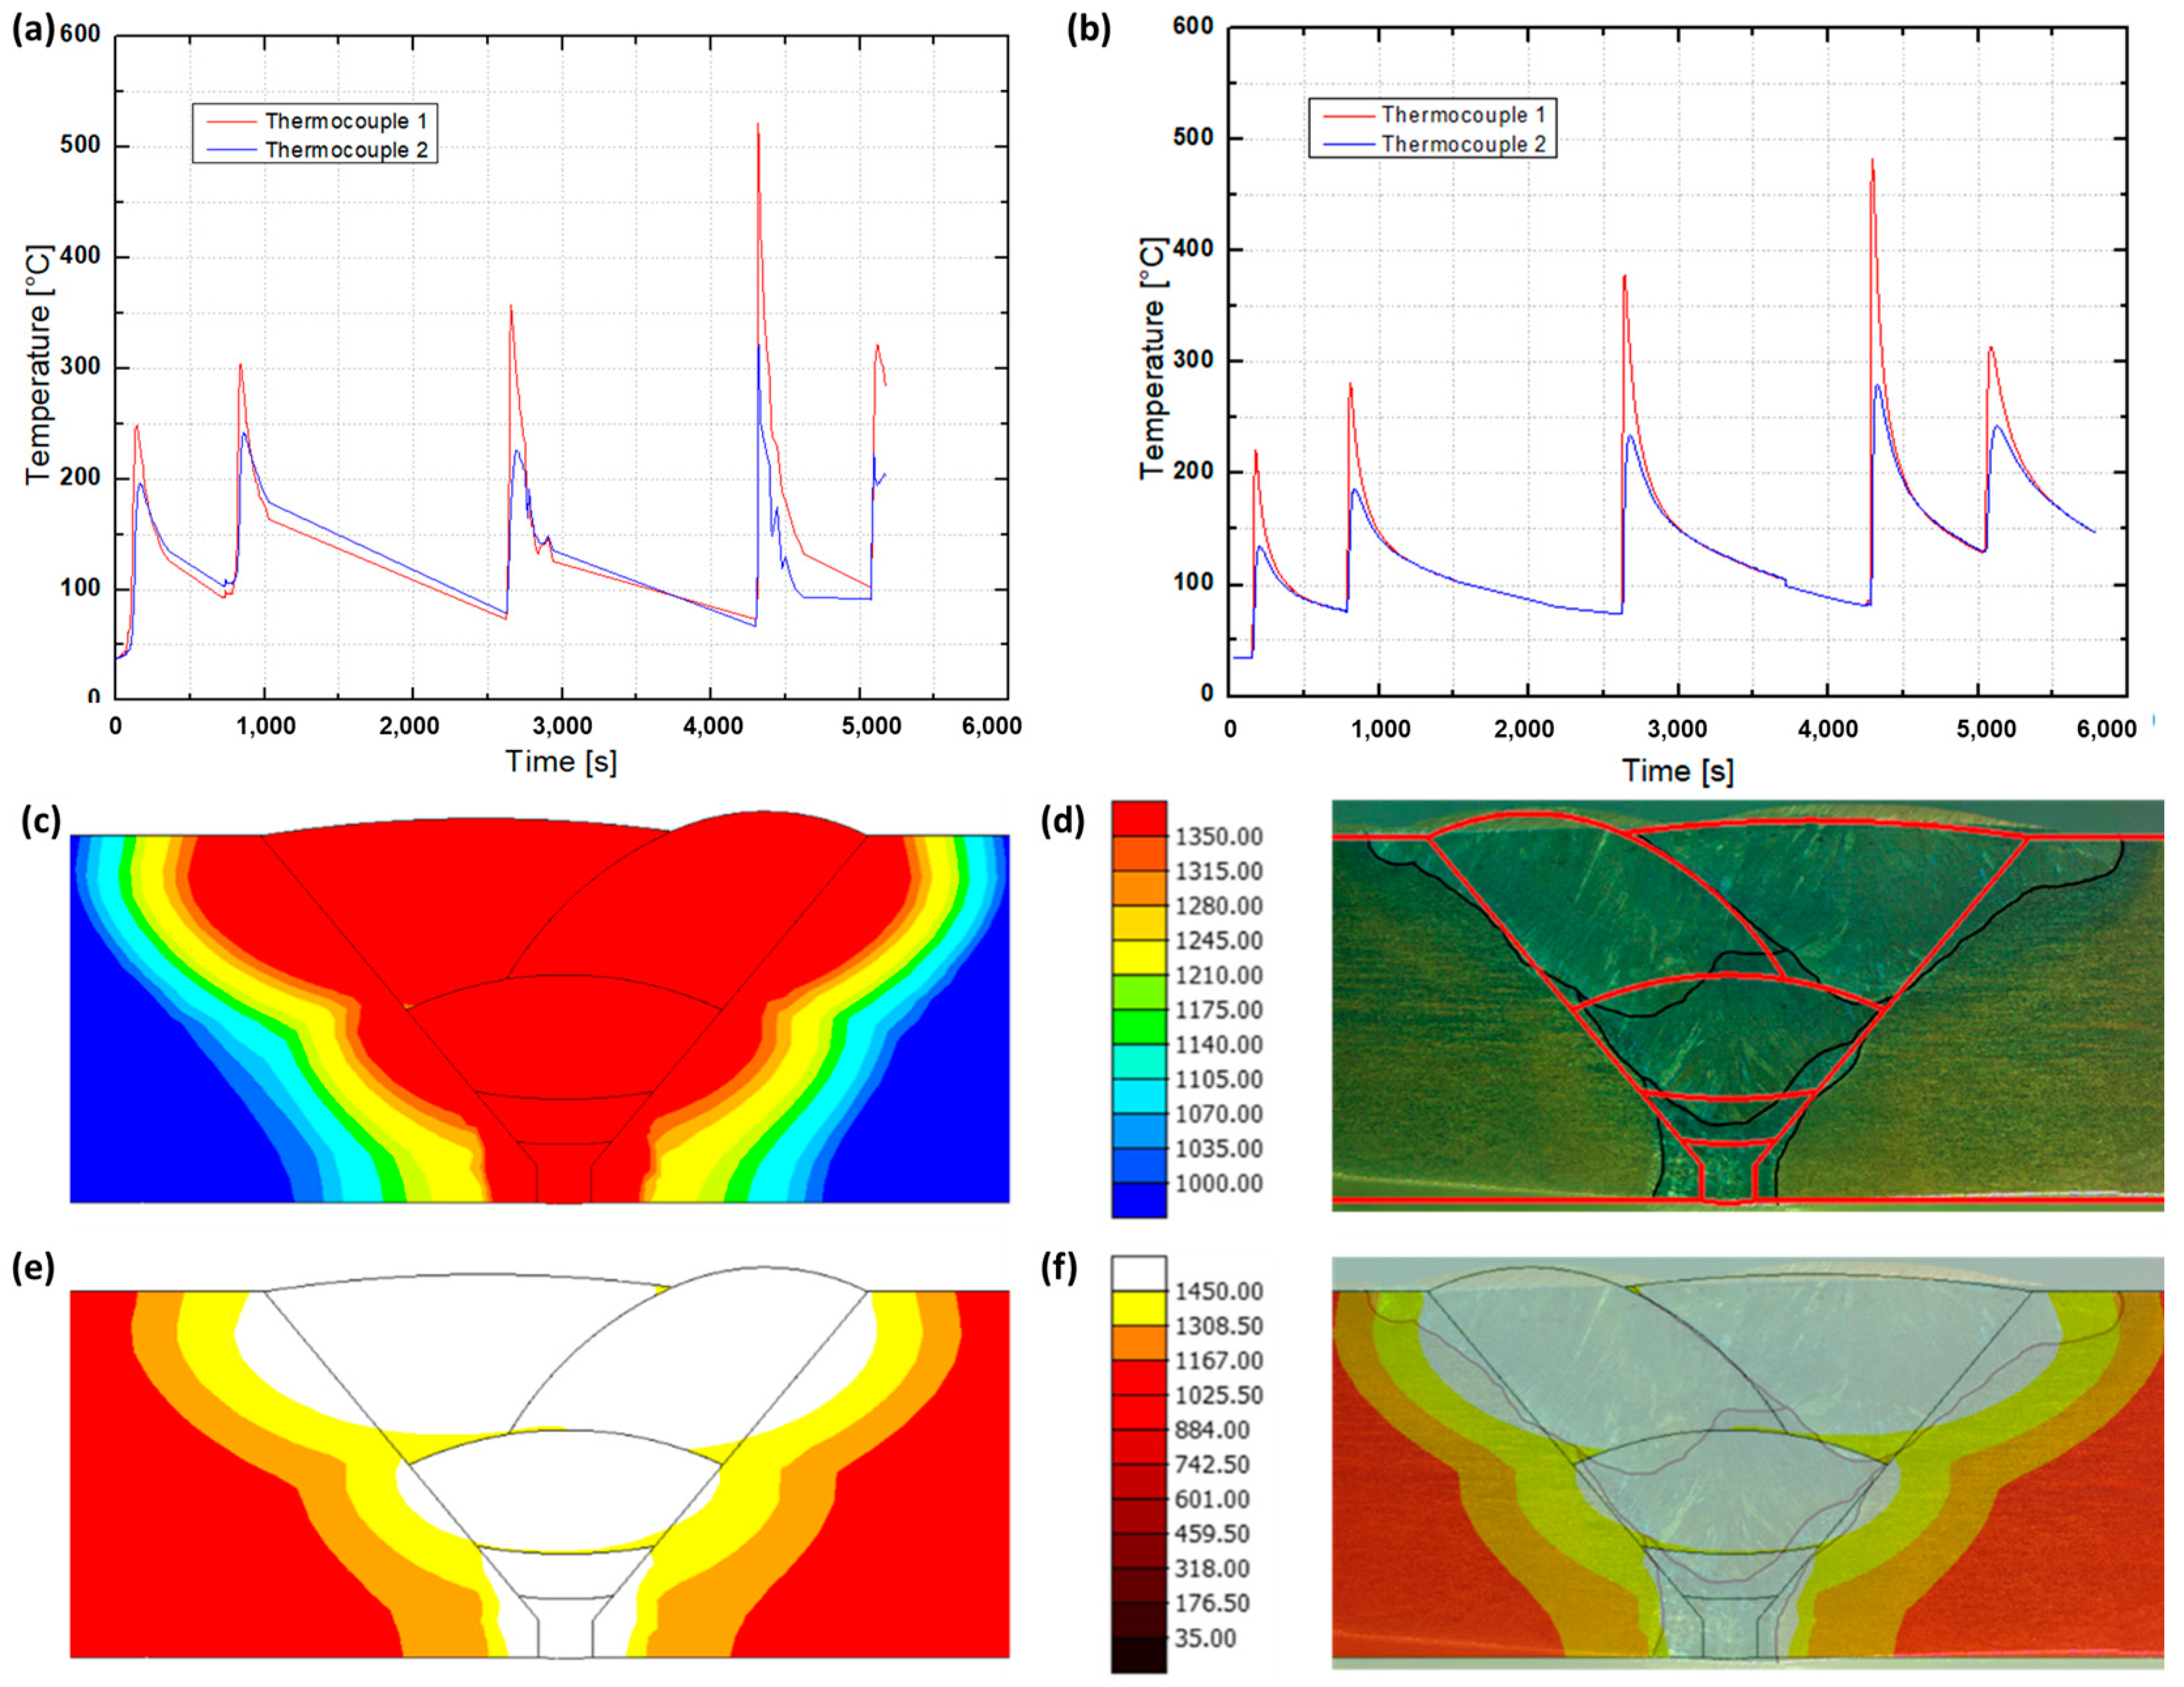
The comparison between thermal curves and FZ profile obtained during weave bead welding and by numerical simulation is shown in Figure 4. It can be observed that the modeled results lie relatively close to the real ones, with the temperature peak difference ranging from a minimum of 2% for thermocouple 1 in pass 5 (calibration welding, 321.6 °C, and Simufact Welding®, 314 °C) to a maximum of 31% for thermocouple 2 in pass 1 (calibration welding, 196.5 °C, and Simufact Welding®, 135 °C).

3.2. Numerical Simulation and Physical Simulation

The execution of Gleeble® simulations required a series of trials for the validation of curves, involving free span and script adjustments, so that physically simulated curves could approximate as much as possible to the modeled ones. The reduction of free span between the copper grips allowed higher cooling rates, but increased the thermal gradient along the specimen’s length, reducing the useful region for subsequent characterization [9]. Another issue is correlated with the temperature overshoot effect caused by the thermal inertia of the system when facing relatively rapid heating and/or cooling, as a result of a delay in the electronic response from the simulator and the physical response from the material [32], leading to peak temperatures higher than the programmed ones.
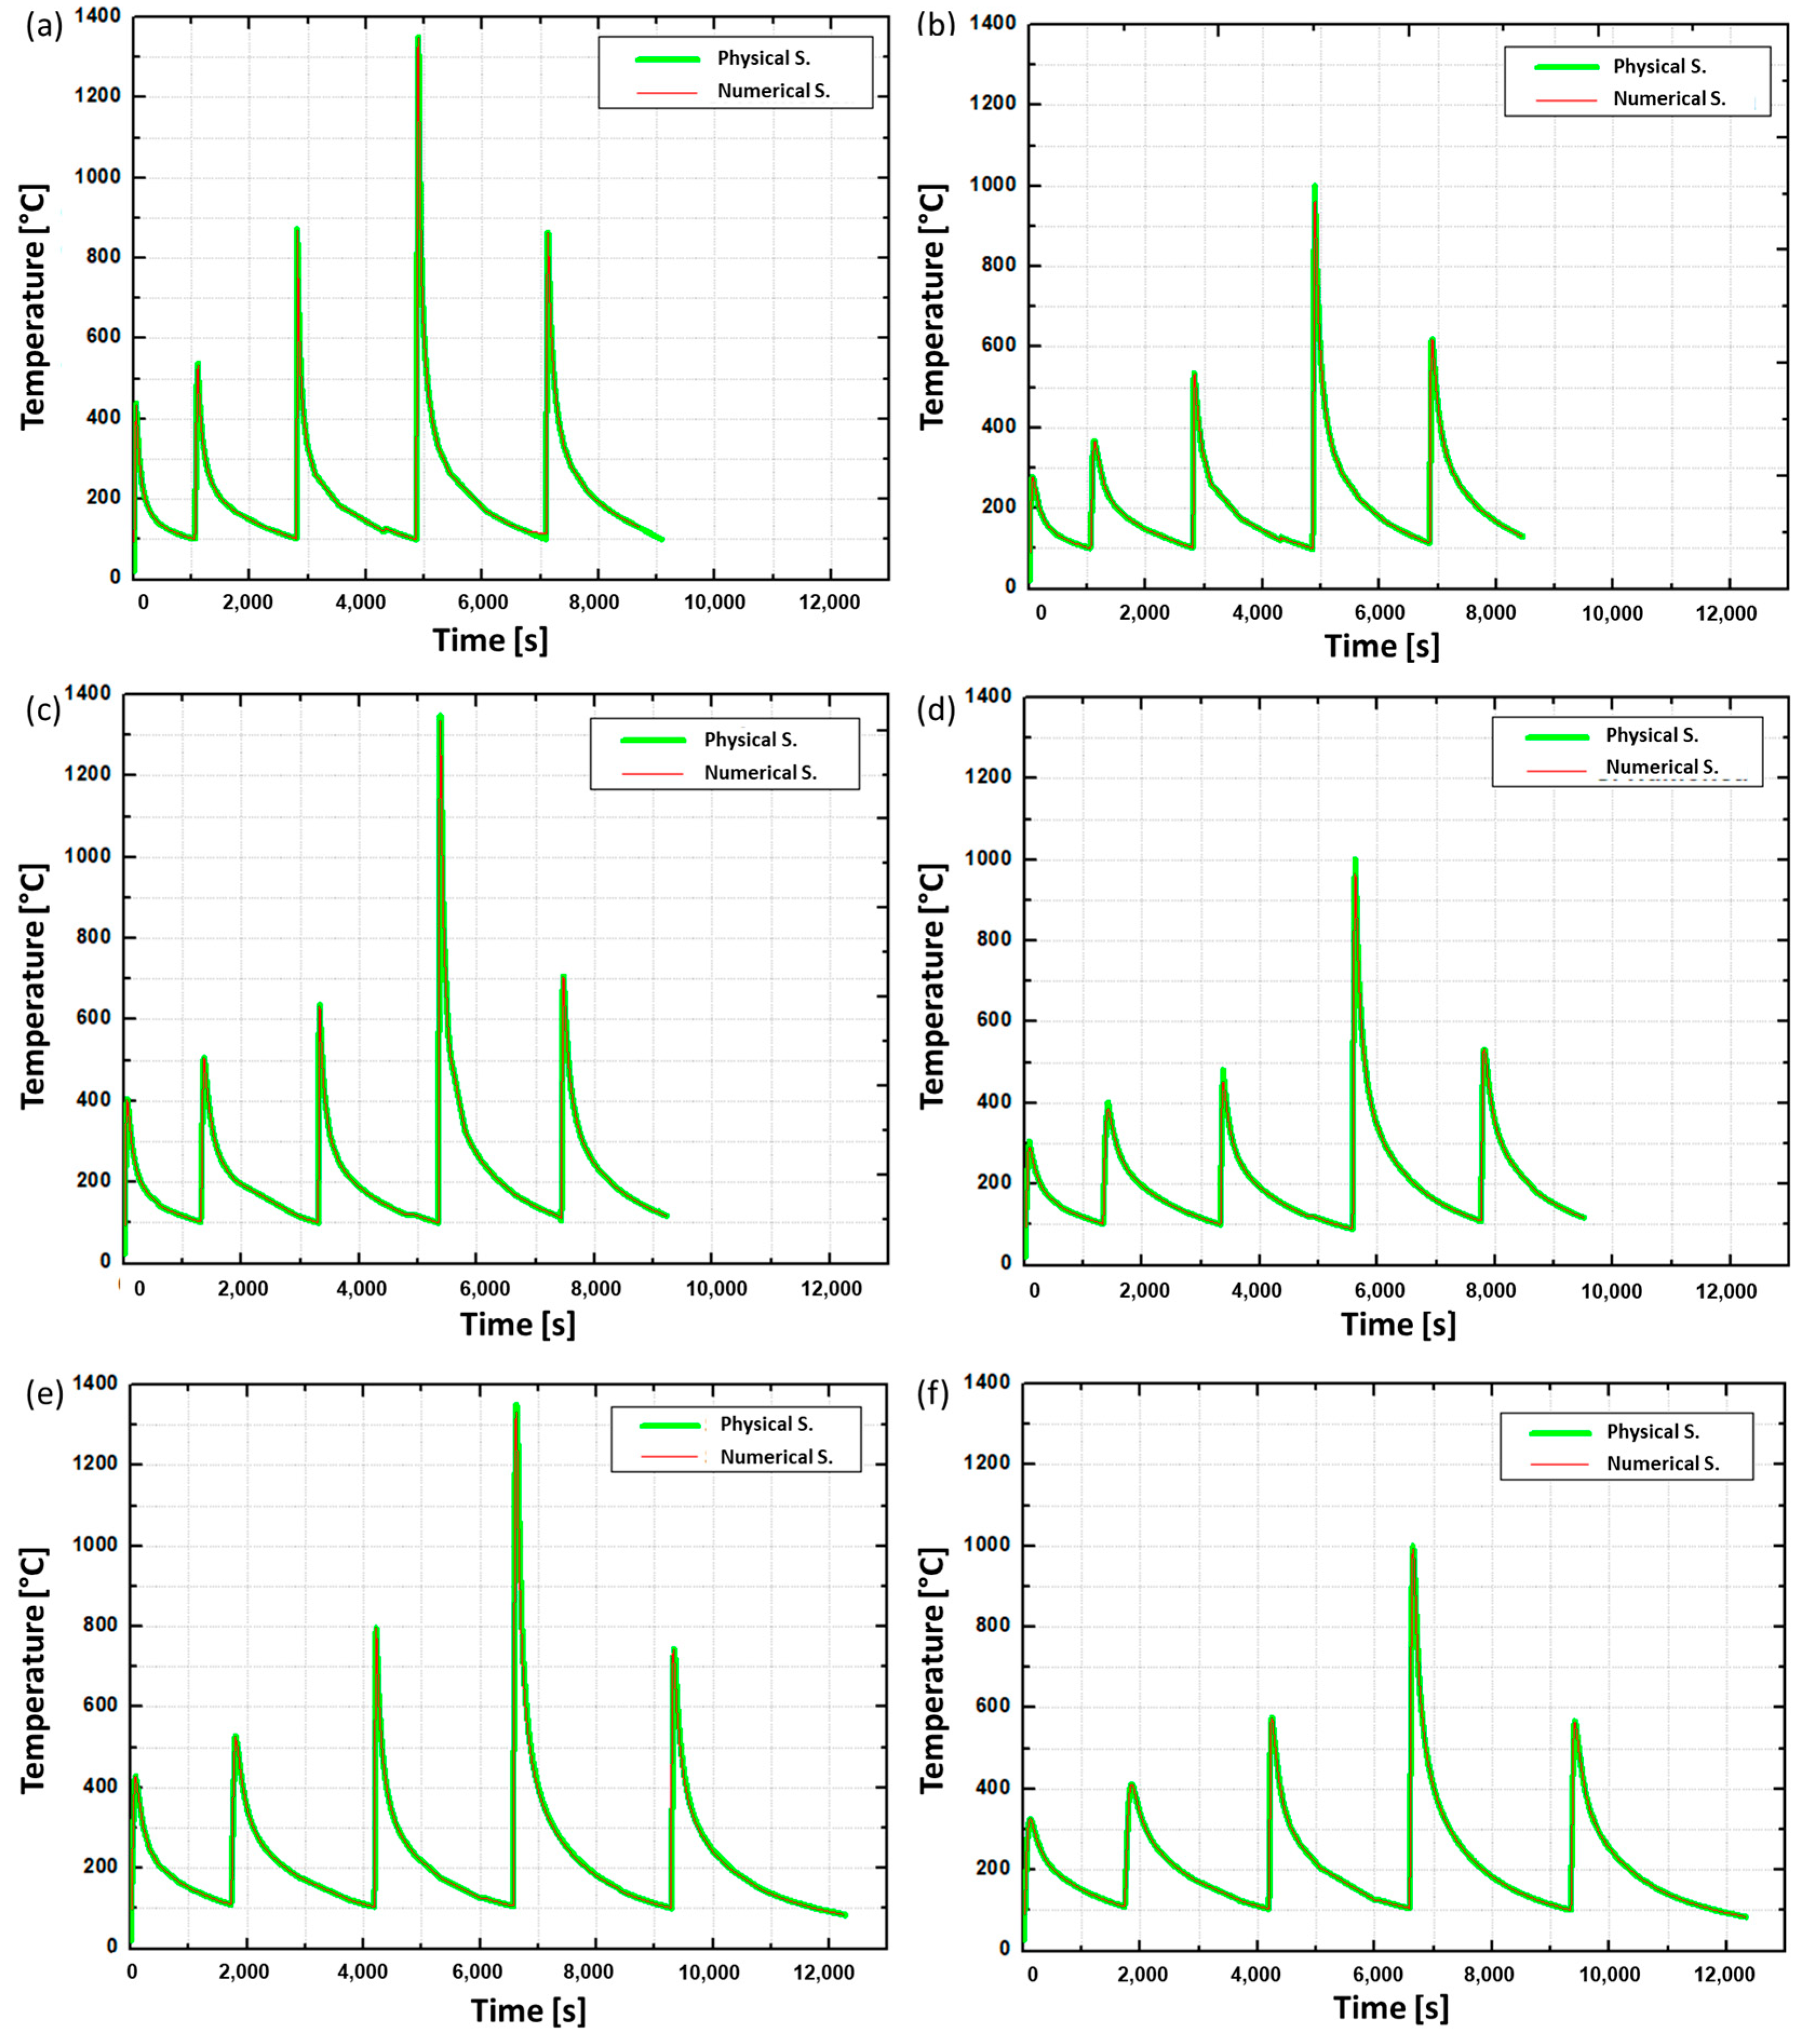
After parameter and program optimization, thermal cycles were carried out for the heat inputs of interest. Resulting curves were compared with numerically modeled ones to assess the representativeness of the applied cycles. As can be seen in Figure 5, all physically simulated curves coincide well with the ones obtained by numerical simulation, with a maximum peak temperature difference of 6% between simulations conducted using Gleeble® physical simulation and numerical simulation via Simufact Welding®, in the LTHAZ of the third pass of CD2 (Gleeble® 481.6 °C and Simufact Welding® 453.3 °C) [9].
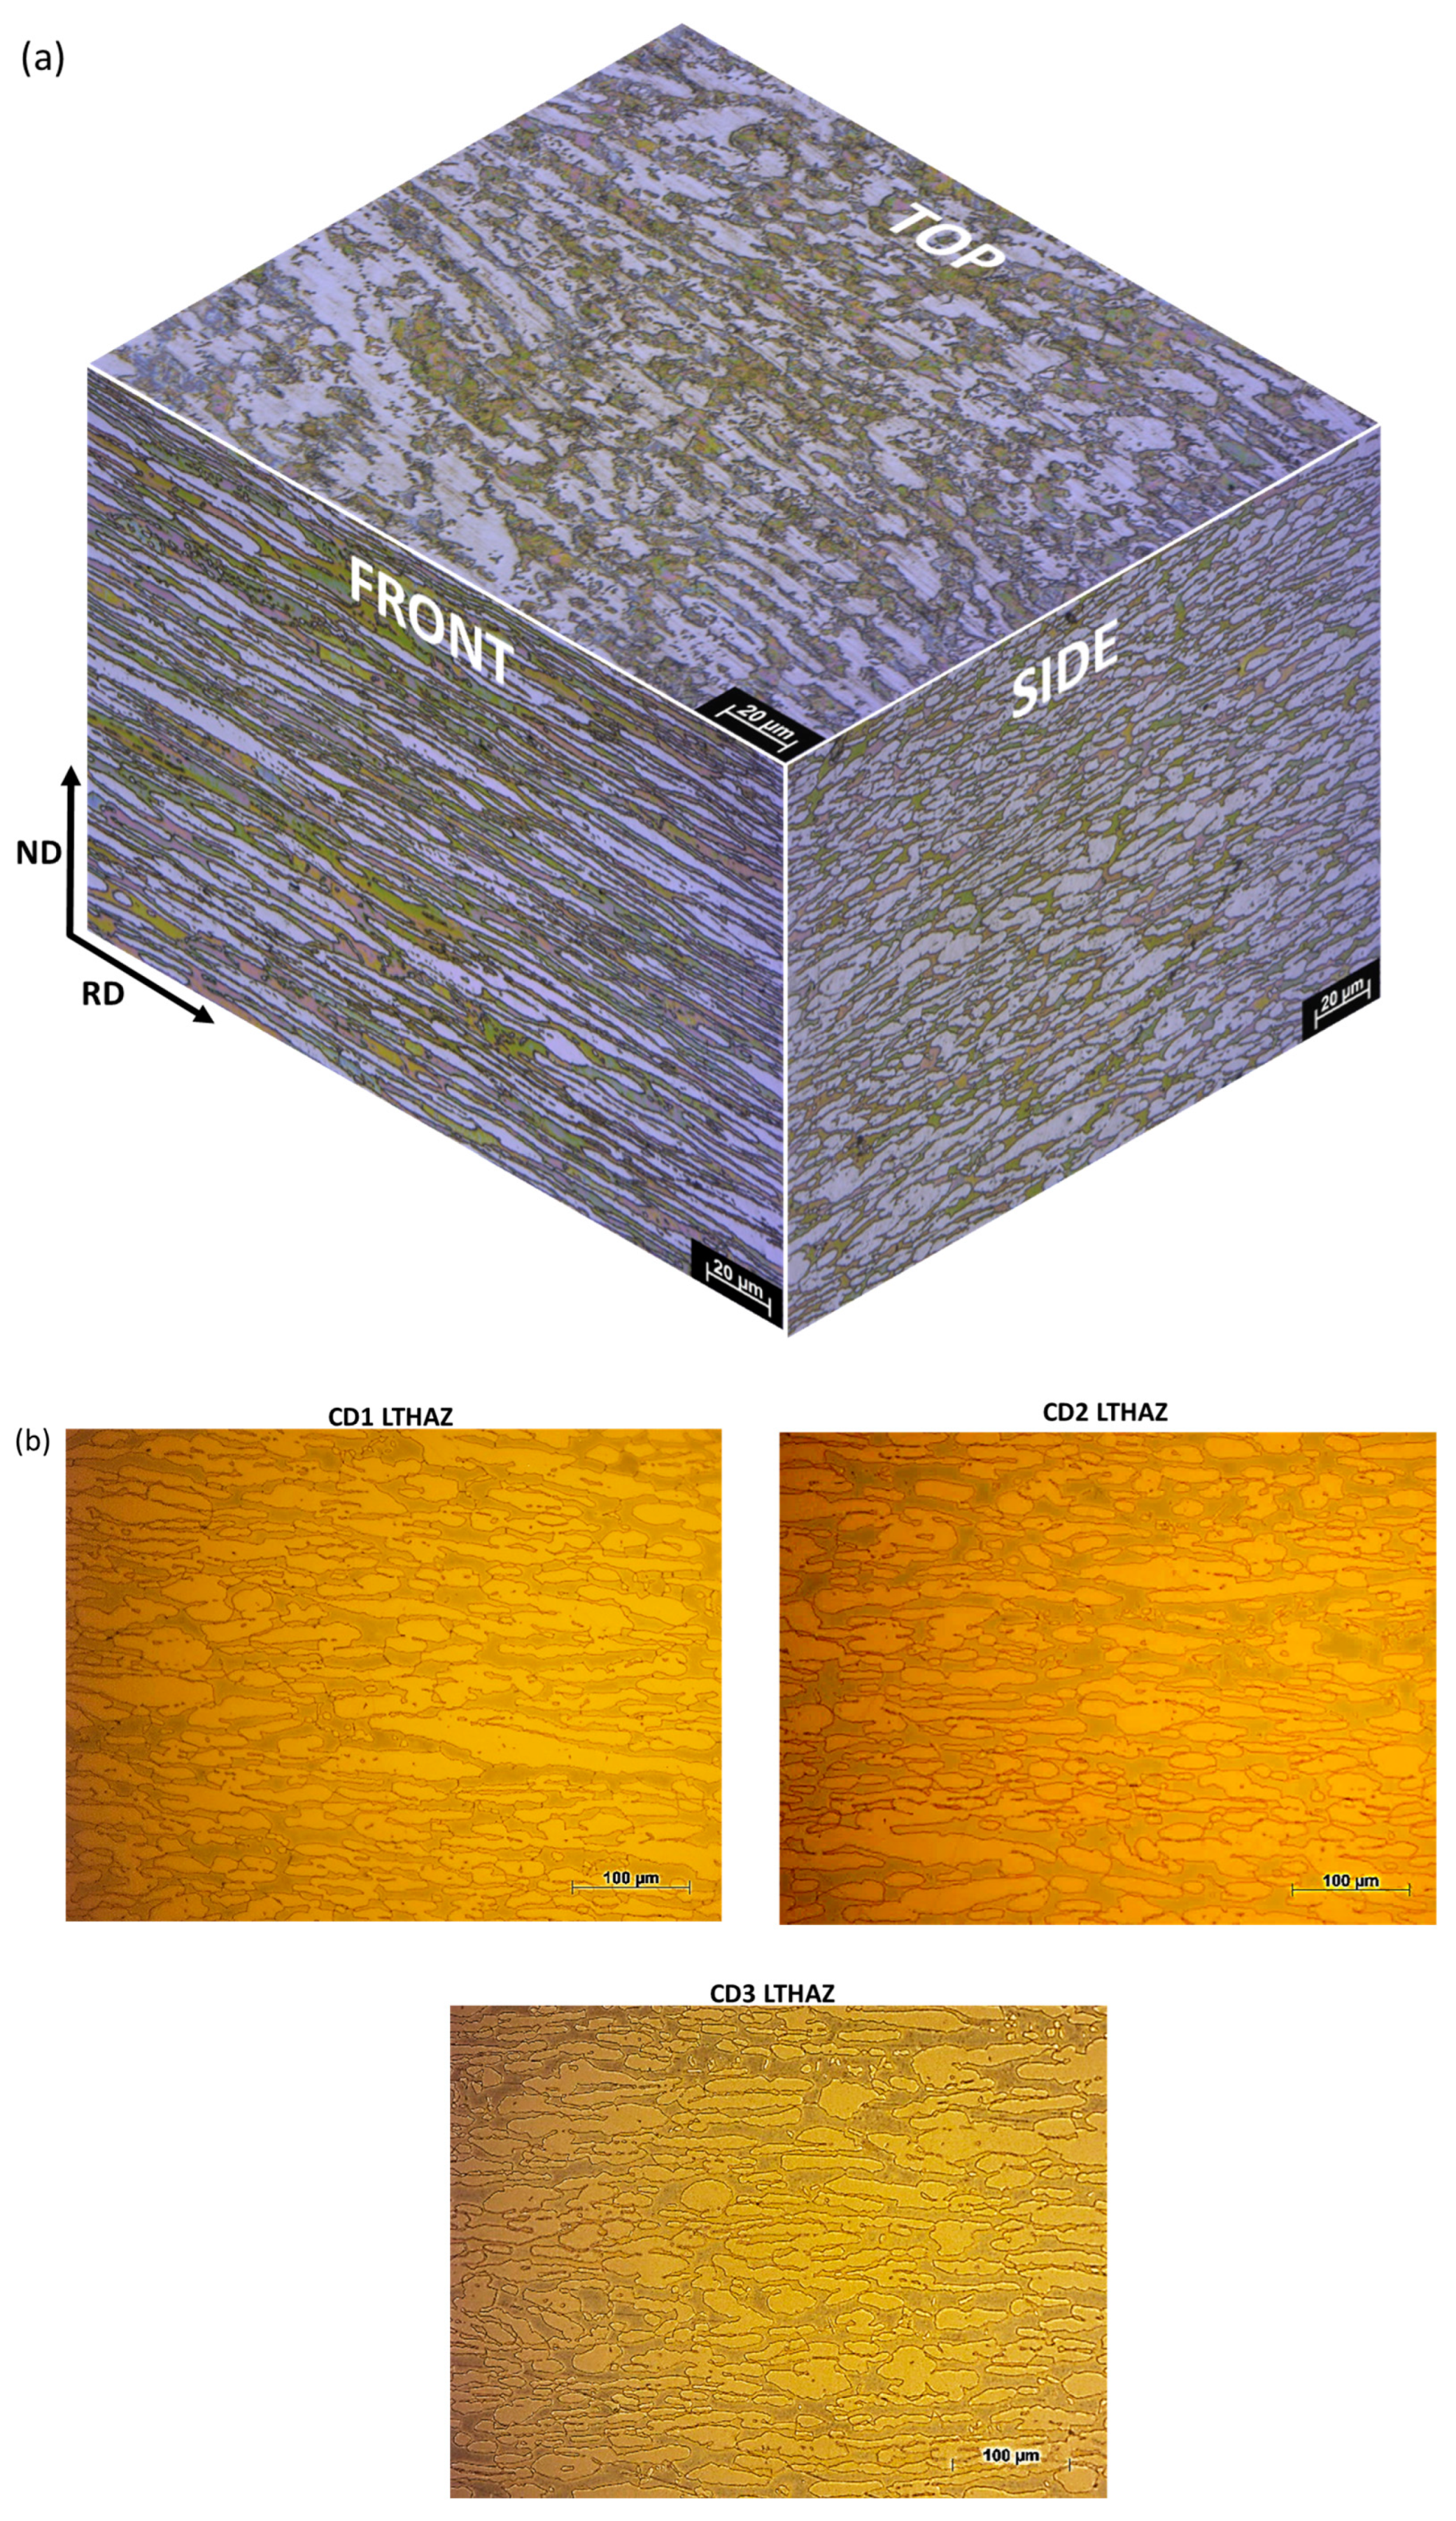
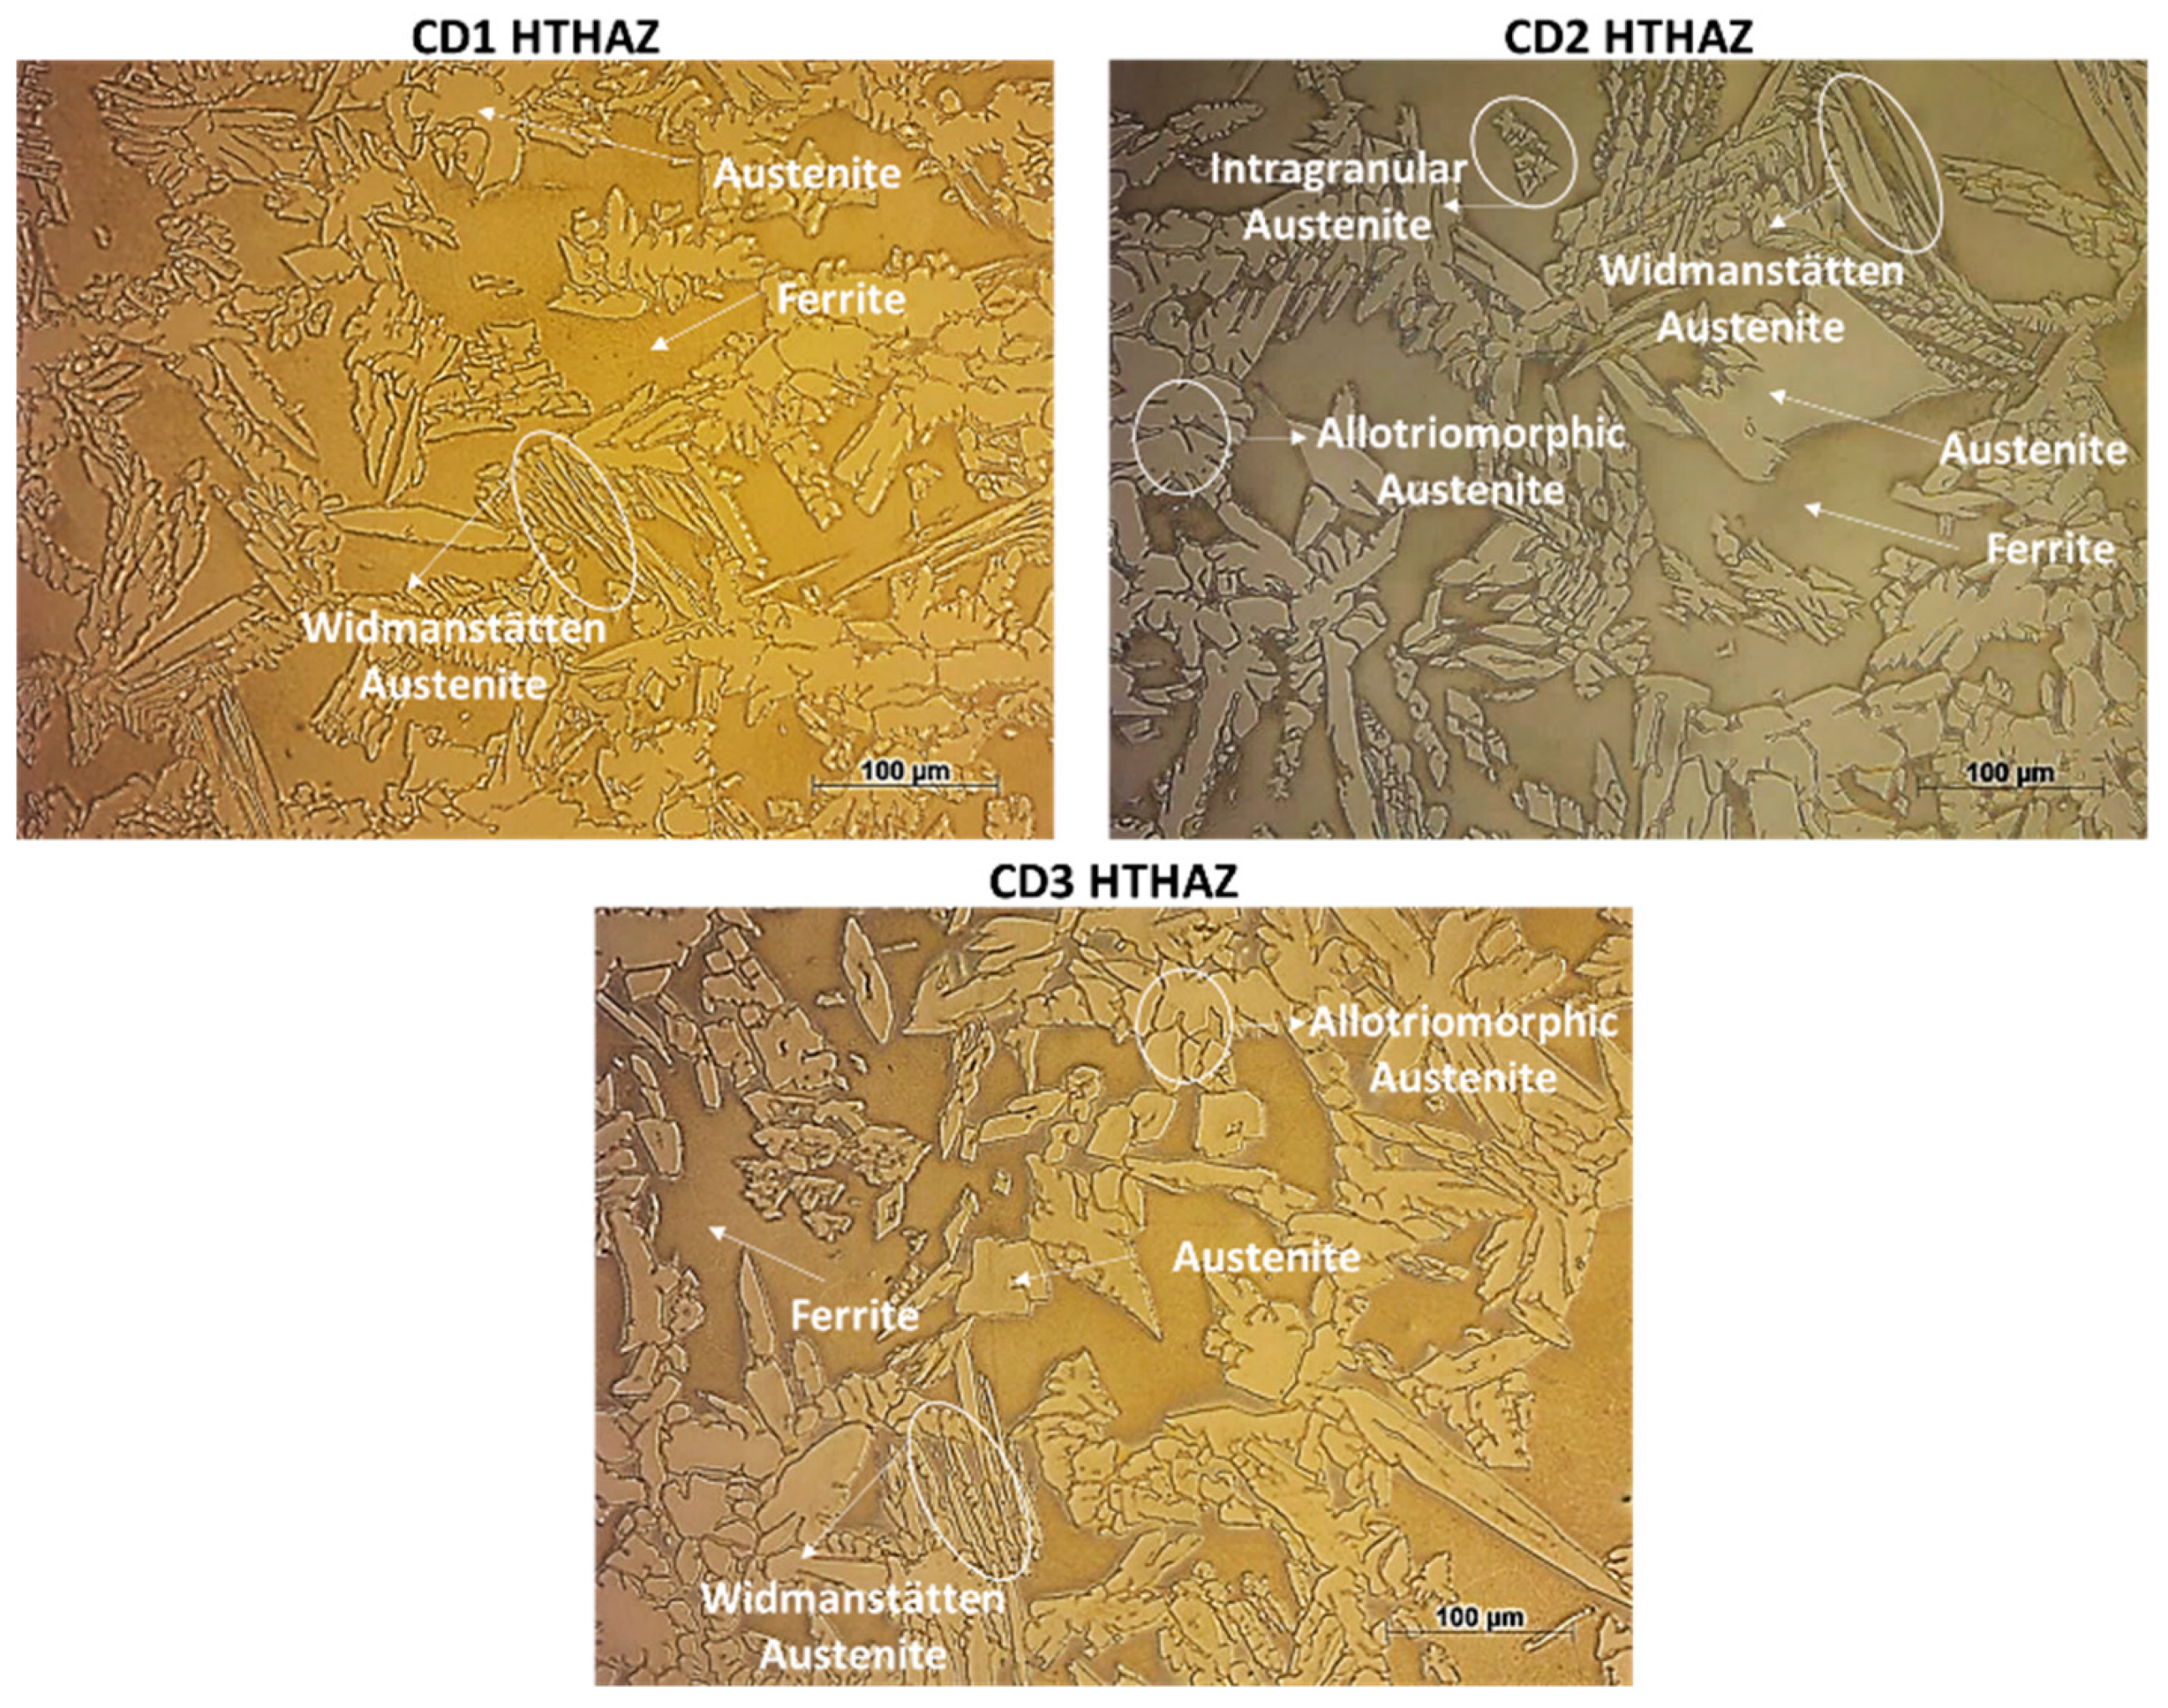
The microstructure of LTHAZ is like that of the as-received material, Figure 6, with elongated grains arising from the rolling process. HTHAZ, on the other hand, presents a ferritic matrix with allotriomorphic grain boundary austenite (GBA), intragranular austenite (IGA), and Widmanstätten austenite (WA) [2,9,11,33], as seen in Figure 7. In the images, darker grains are ferrite and lighter ones are austenite. The microstructures observed correspond to other findings reported in the literature, where lower heat inputs, resulting in higher cooling rates, lead to higher volume fractions of ferrite. In contrast, high heat inputs, with consequently lower cooling rates, promote prolonged exposure to the temperature range in which the precipitation of intermetallic phases may take place, in addition to the presence of forms of austenite, such as GBA, IGA, and WA [11,34,35,36,37].

3.3. Physical Simulation and Real Welding

The final goal of the proposed methodology was to compare the microstructural assessment (microscopy and microhardness) results of the physically simulated and welded specimens. Physical simulation enables the augmentation of the useful area for analysis, leading to a better understanding of the specific morphology related to the thermal cycle of each sub-region, which show themselves relatively narrow in a real weld HAZ [38,39].
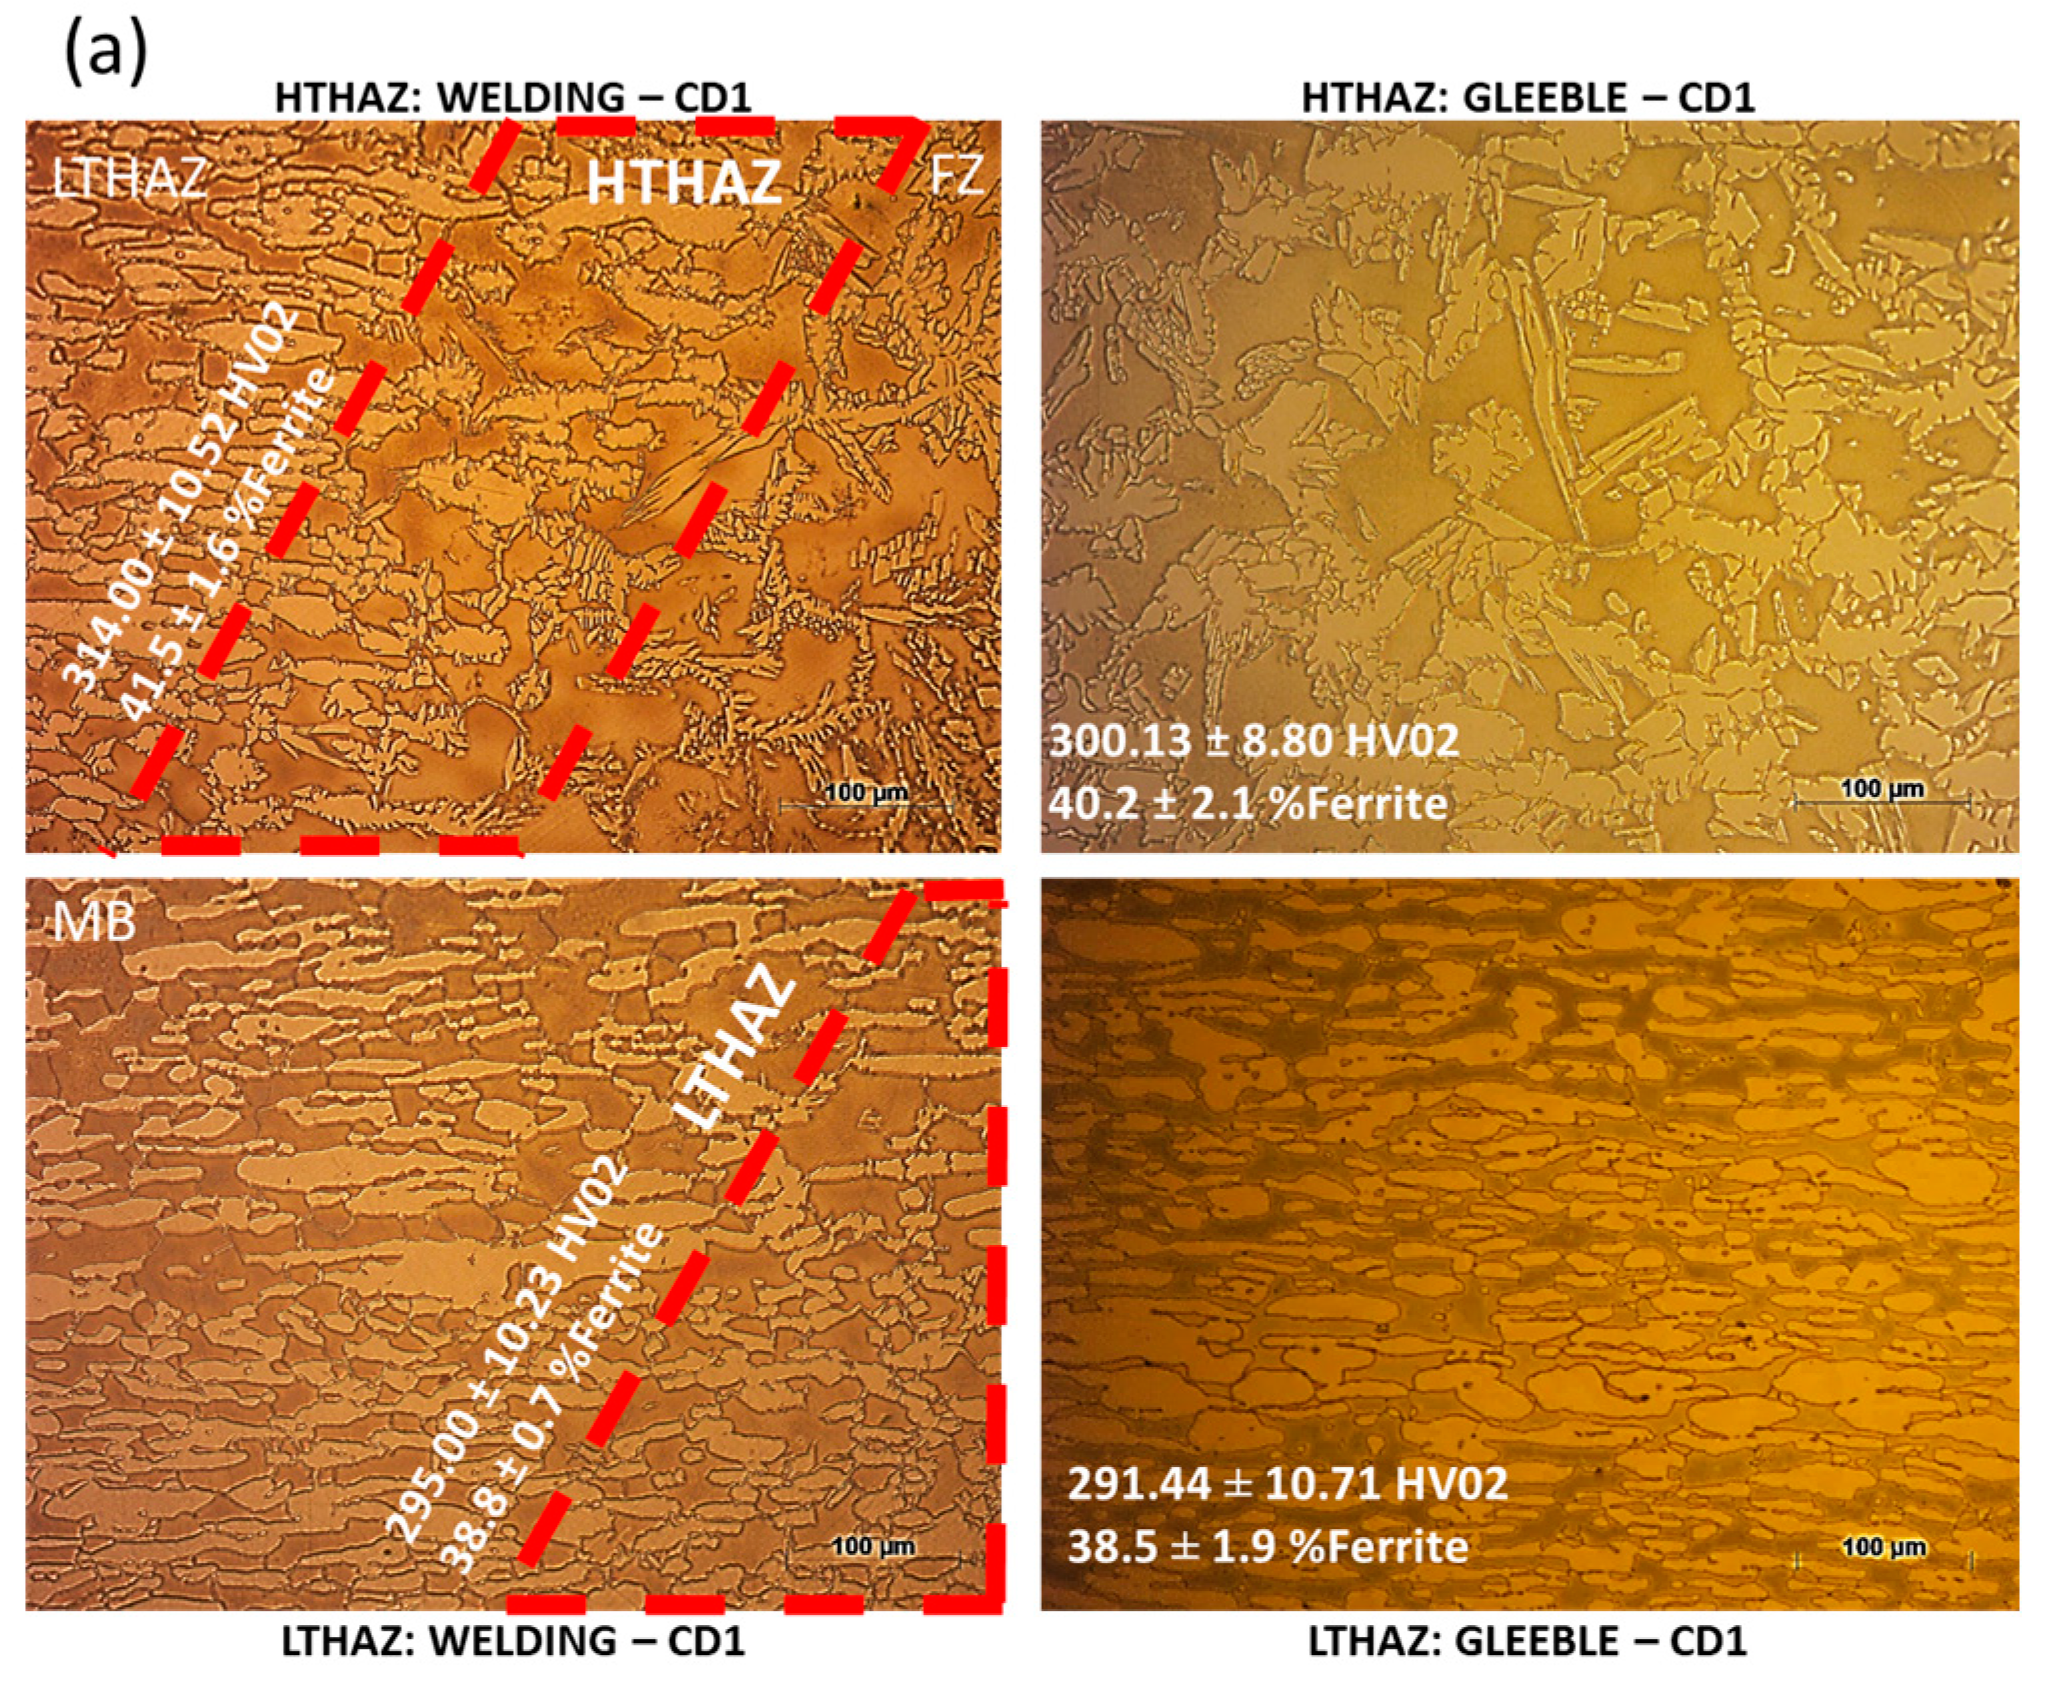
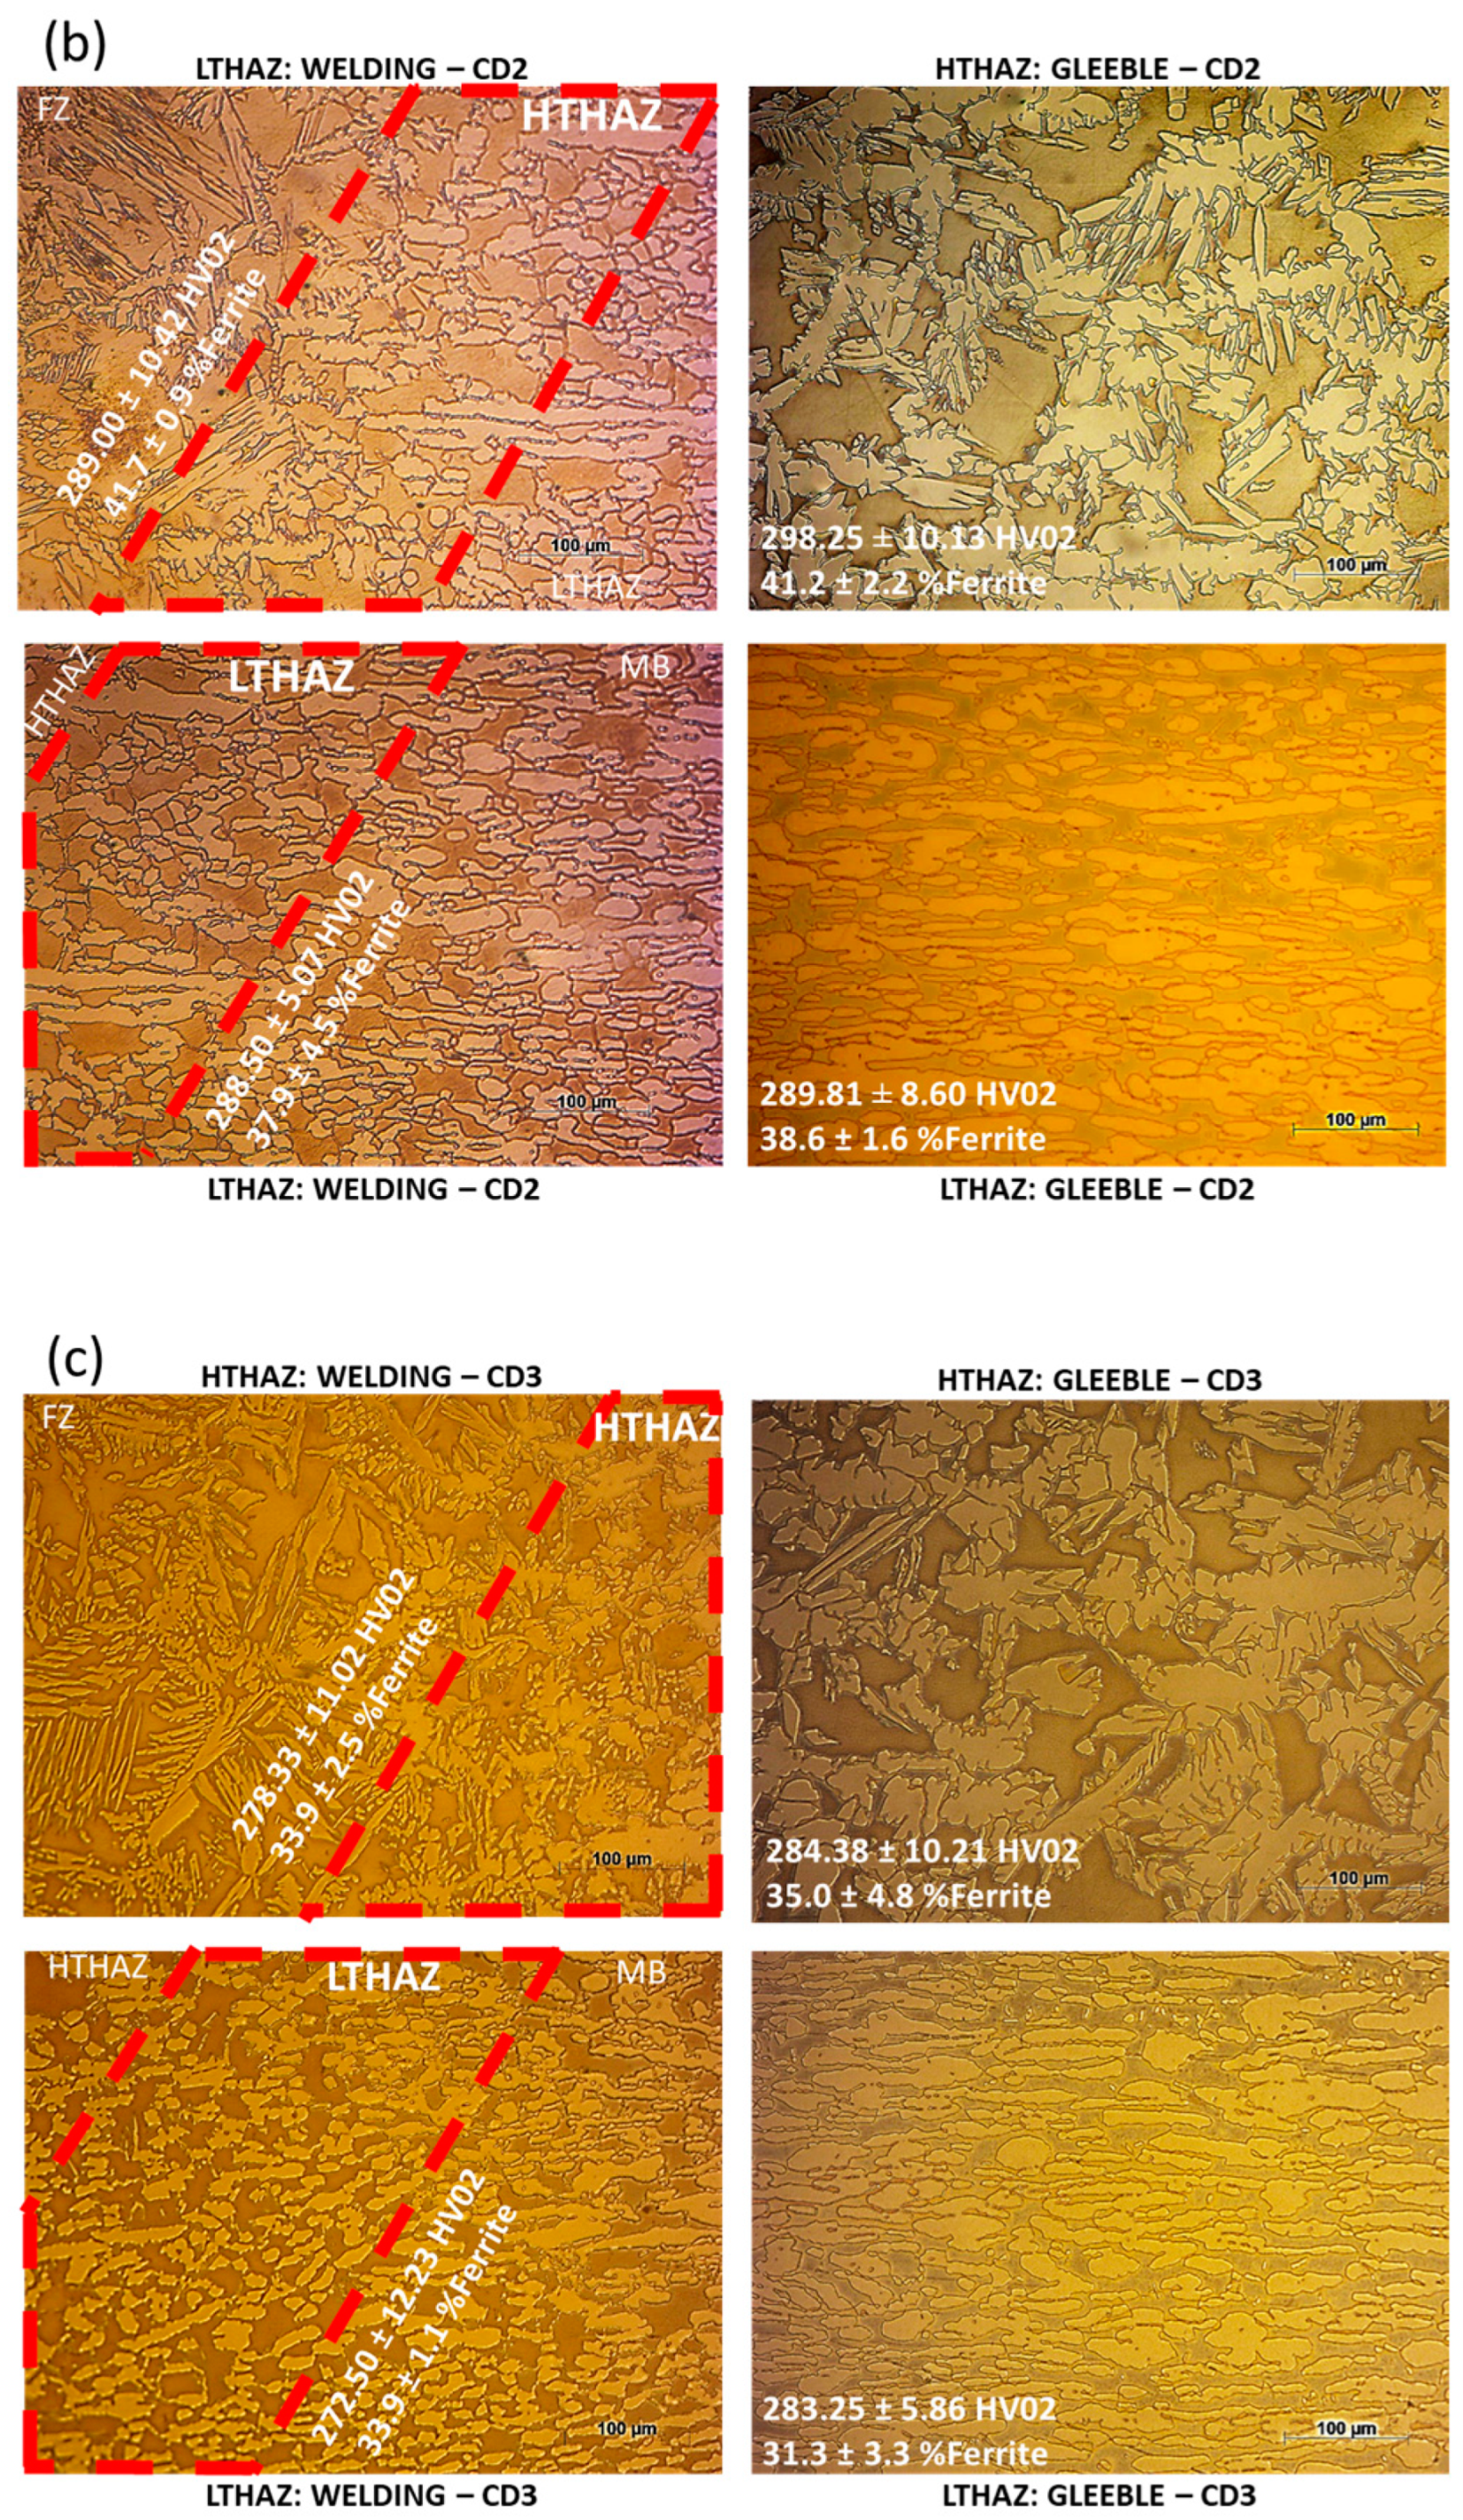
Microhardness values measured in Gleeble® specimens were close to those found in the literature [3]. Welded specimens, however, presented somewhat lower hardness levels, which might be ascribed to the fact that sub-region boundaries are difficult to define, meaning that indentations might have been partially placed in different regions, Figure 8. The graphs in Figure 9 indicate that samples from Gleeble® and welded samples exhibit values with a standard deviation within the range of error, and through analysis of variance (ANOVA), it was identified that there is no significant variation between Gleeble® and welded samples in terms of percentage of ferrite and microhardness. Both simulated and welded microstructures present similarities in microconstituent morphology.
The ferrite content and microhardness values may slightly differ between the results obtained from physical simulation and actual welding, within the margin of error, as seen in Table 6. This variance occurs because the physical simulation is able to replicate the heat-affected zone (HAZ) and expand this area compared to the HAZ of a real welded joint. In the actual weld, it is difficult to differentiate between the high-temperature HAZ and low-temperature HAZ, due to their small dimensions [3,40]. The values of both the HTHAZ and the LTHAZ are quite close, with small relevant variations between the sub-regions. In this context, it is important to consider these results in conjunction with the morphological analysis of the phases present. Additionally, it is necessary to emphasize the difficulty of identifying a specific region of HAZ in the welded joint, due to its reduced dimensions and the microstructural gradient between adjacent sub-regions.
Given that the heat input conditions were selected based on “good” conditions deemed by standards and the literature, the absence of intermetallic phases was expected, as confirmed by the exposure time at peak temperature (less than one thousand (1000) seconds, in all conditions and regions of the HAZ), which is insufficient for nucleation and formation of these intermetallic phases. Typically, the precipitation of secondary phases occurs more rapidly in ferrite or at austenite/ferrite phase boundaries than inside austenite grains. In all heat inputs, whether low or high, corresponding to fast or slow cooling rates, and across all the steel types analyzed, no intermetallic phases, such as sigma phase, among others, were observed. The nondetection of intermetallic phases does not necessarily imply nonformation; however, it can be inferred that the quantity formed may be insignificant, justifying their nondetection in the microstructural analysis conducted in this study, akin to the findings of Fonseca et al., who investigated the same material under more extreme heat inputs of 0.5 kJ/mm and 3.2 kJ/mm [37,40].

4. Conclusions

In this study, a new methodology was proposed and assessed to predict the microstructure of a welding HAZ in superduplex stainless steels, based on coupled numerical and physical simulations. The focus on the HAZ is justified by its high complexity and the possibility of the formation of different microstructures that can be harmful to the mechanical performance of materials.
One of the major challenges in studying the HAZ of duplex and superduplex stainless steels is identifying their subregions due to their small dimensions. Each subregion exhibits distinct characteristics and possibilities for the formation of different intermetallic phases, and expanding this HAZ for a more accurate study is crucial to identify and understand their characteristics. This study introduces a novel methodology for investigating the HAZ of superduplex stainless steel through simulations. It began with a preliminary welding process to calibrate a numerical simulation, from which three variations of heat input were extrapolated, chosen according to standards and the literature. These heat input values were then converted into thermal cycles for physical simulation using the Gleeble® system, and adapted into welding parameters for the final welding process. Subsequently, samples from both the physical simulation and the real welding were analyzed and compared in relation to ferrite content and microhardness.
The use of numerical simulation previously calibrated by data acquired from a preliminary welding procedure, made it possible to derive thermal cycles for each heat input studied in HTHAZ and LTHAZ. The computationally generated curve simulated different heating and cooling rates in each subregion during welding of UNS S32750 superduplex stainless steel, and served as input for physical simulation. Numerically and physically simulated curves were sufficiently close to each other, suggesting that Gleeble® can successfully reproduce conditions studied and simulated by Simufact Welding®. Therefore, the methodology has proven itself adequate to predict relevant characteristics of the welding process, such as thermal cycles and HAZ microstructure in its different regions. Results showed it is possible to accurately reproduce microstructural features under different heat input conditions. Values of microhardness and ferrite content were shown to be relatively close, as well as microconstituent morphologies.
This methodology can be applied to the development of better-suited welding procedures for specific materials, and also for welding studies of new special alloys. The preliminary trial-and-error welding stage for parameter optimization can be adequately replaced with simulation tools, which offers the advantages of defining parameters more assertively for further onsite applications and allowing better control of thermal cycles, which is difficult to attain during real welding procedures. From model validation, other welding parameters, different from those chosen in this study, can be selected for the same material and, alternatively, the methodology can be applied to the welding of other metals and alloys.
Due to the requirement for robust calibration and expensive equipment, the methodology has a higher initial cost as compared with traditional studies that do not involve simulation tools. Nonetheless, if the procedure is extrapolated to various welding conditions and materials, its costs can be easily compensated in due course. Coupled numerical and physical simulations allow for an enhanced control of parameters and an enlargement of the analyzed region, with high repeatability without imparting relevant additional costs.

Author Contributions

Conceptualization, T.N.L. and R.S.C.; methodology, B.C. and T.N.L.; formal analysis, B.C., L.O.P.d.S., F.M.d.S.J. and L.F.F.; investigation, L.O.P.d.S. and F.M.d.S.J.; resources, L.O.P.d.S. and F.M.d.S.J.; data curation, L.O.P.d.S., F.M.d.S.J. and L.F.F.; writing—original draft preparation, L.O.P.d.S. and L.F.F.; writing—review and editing, B.C., T.N.L. and R.S.C.; visualization, B.C.; supervision, R.S.C.; project administration, T.N.L.; funding acquisition, R.S.C. All authors have read and agreed to the published version of the manuscript.

Funding

This research was funded by the ANP/PETROBRAS program (SAP 4600580712).

Data Availability Statement

The raw data supporting the conclusions of this article will be made available by the authors on request.

Acknowledgments

The authors would like to acknowledge the post-graduate program GETEC at SENAI CIMATEC and ANP/PETROBRAS for their financial support to this project.

Conflicts of Interest

The authors declare no conflicts of interest.

References

  1. Zhao, G.; Zhang, R.; Li, J.; Li, H.; Ma, L.; Li, Y. Study on Microstructure and Tensile Damage Evolution of 2205 Duplex Steel at Different Solution Temperatures. Mater. Today Commun. 2022, 33, 104472. [Google Scholar] [CrossRef]
  2. Calderon-Uriszar-aldaca, I.; Briz, E.; Garcia, H.; Matanza, A. The Weldability of Duplex Stainless-Steel in Structural Components to Withstand Corrosive Marine Environments. Metals 2020, 10, 1475. [Google Scholar] [CrossRef]
  3. Arun, D.; Devendranath Ramkumar, K.; Vimala, R. Multi-Pass Arc Welding Techniques of 12 mm Thick Super-Duplex Stainless Steel. J. Mater. Process Technol. 2019, 271, 126–143. [Google Scholar] [CrossRef]
  4. Tavares, S.S.M.; Silva, V.G.; Pardal, J.M.; Corte, J.S. Investigation of Stress Corrosion Cracks in a UNS S32750 Superduplex Stainless Steel. Eng. Fail. Anal. 2013, 35, 88–94. [Google Scholar] [CrossRef]
  5. Pardal, J.M.; Tavares, S.S.M.; Fonseca, M.D.P.C.; Souza, J.A.D.; Vieira, L.M.; Abreu, H.F.G.D. Deleterious Phases Precipitation on Superduplex Stainless Steel UNS S32750: Characterization by Light Optical and Scanning Electron Microscopy. Mater. Res. 2010, 13, 401–407. [Google Scholar] [CrossRef]
  6. Freitas, G.C.L.D.; da Fonseca, G.S.; Moreira, L.P.; Leite, D.N.F. Phase Transformations of the Duplex Stainless Steel UNS S31803 under Non-Isothermal Conditions. J. Mater. Res. Technol. 2021, 11, 1847–1851. [Google Scholar] [CrossRef]
  7. de Farias Azevedo, C.R.; Boschetti Pereira, H.; Wolynec, S.; Padilha, A.F. An Overview of the Recurrent Failures of Duplex Stainless Steels. Eng. Fail. Anal. 2019, 97, 161–188. [Google Scholar] [CrossRef]
  8. Fonseca, C.S.; da Silva, S.N.; Gomes, H.G.; Silva, D.W.; Júnior, J.B.G.; Pinheiro, I.P. Evaluation of the Sigma Phase Precipitation Susceptibility in Duplex Stainless Steel SAF2205 Welding. Rev. Mater. 2019, 24, e12470. [Google Scholar] [CrossRef]
  9. Acuna, A.; Ramirez, A.J. Sigma Phase Formation Kinetics in Hyper Duplex Stainless Steel Welding Filler Metal. Mater. Charact. 2023, 200, 112832. [Google Scholar] [CrossRef]
  10. Singh, J.; Shahi, A.S. Impact Toughness, Fatigue Crack Growth and Corrosion Behavior of Thermally Aged UNS S32205 Duplex Stainless Steel. Trans. Indian Inst. Met. 2019, 72, 1497–1502. [Google Scholar] [CrossRef]
  11. Chaudhari, A.N.; Dixit, K.; Bhatia, G.S.; Singh, B.; Singhal, P.; Saxena, K.K. Welding Behaviour of Duplex Stainless Steel AISI 2205: AReview. Mater. Today Proc. 2019, 18, 2731–2737. [Google Scholar] [CrossRef]
  12. Zhang, Z.; Zhang, H.; Hu, J.; Qi, X.; Bian, Y.; Shen, A.; Xu, P.; Zhao, Y. Microstructure Evolution and Mechanical Properties of Briefly Heat-Treated SAF 2507 Super Duplex Stainless Steel Welds. Constr. Build. Mater. 2018, 168, 338–345. [Google Scholar] [CrossRef]
  13. Deepu, M.J.; Phanikumar, G. ICME Framework for Simulation of Microstructure and Property Evolution During Gas Metal Arc Welding in DP980 Steel. Integr. Mater. Manuf. Innov. 2020, 9, 228–239. [Google Scholar] [CrossRef]
  14. Hosseini, V.A.; Cederberg, E.; Hurtig, K.; Karlsson, L. A Physical Simulation Technique for Cleaner and More Sustainable Research in Additive Manufacturing. J. Clean. Prod. 2021, 285, 124910. [Google Scholar] [CrossRef]
  15. Gáspár, M.; Sisodia, R.P.S.; Dobosy, A. Physical Simulation-Based Characterization of HAZ Properties in Steels. Part 2. Dual-Phase Steels. Strength. Mater. 2019, 51, 805–815. [Google Scholar] [CrossRef]
  16. Genchev, G.; Doynov, N.; Ossenbrink, R.; Michailov, V.; Bokuchava, G.; Petrov, P. Residual Stresses Formation in Multi-Pass Weldment: A Numerical and Experimental Study. J. Constr. Steel Res. 2017, 138, 633–641. [Google Scholar] [CrossRef]
  17. Varbai, B.; Pickle, T.; Májlinger, K. Effect of Heat Input and Role of Nitrogen on the Phase Evolution of 2205 Duplex Stainless Steel Weldment. Int. J. Press. Vessel. Pip. 2019, 176, 103952. [Google Scholar] [CrossRef]
  18. Sakata, M.; Kadoi, K.; Inoue, H. Age-Hardening Behaviors of the Weld Metals of 22% Cr and 25% Cr Duplex Stainless Steels at 400 °C. J. Nucl. Mater. 2023, 581, 154438. [Google Scholar] [CrossRef]
  19. Dornelas, P.H.G.; Filho, J.d.C.P.; Farias, F.W.C.; e Oliveira, V.H.P.M.; Moraes, D.d.O.; Júnior, P.Z. FEM-Thermodynamic Simulation Methodology to Predict the Influence of T8/5 on the Coarse Grain Heat-Affected Zone of a Cr-Mo Low-Alloy Steel Pipe. J. Manuf. Process 2020, 60, 520–529. [Google Scholar] [CrossRef]
  20. Palmieri, M.E.; Lorusso, V.D.; Tricarico, L. Investigation of Material Properties of Tailored Press Hardening Parts Using Numerical and Physical Simulation. Procedia Manuf. 2020, 50, 104–109. [Google Scholar] [CrossRef]
  21. Hosseini, V.A.; Hurtig, K.; Karlsson, L. Effect of Multipass TIG Welding on the Corrosion Resistance and Microstructure of a Super Duplex Stainless Steel. Mater. Corros. 2017, 68, 405–415. [Google Scholar] [CrossRef]
  22. Rikken, M.; Pijpers, R.; Slot, H.; Maljaars, J. A Combined Experimental and Numerical Examination of Welding Residual Stresses. J. Mater. Process Technol. 2018, 261, 98–106. [Google Scholar] [CrossRef]
  23. Hosseini, V.A.; Karlsson, L. Physical and Kinetic Simulation of Nitrogen Loss in High Temperature Heat Affected Zone of Duplex Stainless Steels. Materialia 2019, 6, 100325. [Google Scholar] [CrossRef]
  24. American Welding Society. AWS A5.9/A5.9:2017 Welding Consumables–Wire Electrodes, Strip Electrodes, Wires, and Rods for Arc Welding of Stainless and Heat Resisting Steels–Classification, 9th ed.; The American Society of Mechanical Engineers: New York, NY, USA, 2017; ISBN 978-0-7918-7079-2. [Google Scholar]
  25. Chail, G.; Kangas, P. Super and Hyper Duplex Stainless Steels: Structures, Properties and Applications. Procedia Struct. Integr. 2016, 2, 1755–1762. [Google Scholar] [CrossRef]
  26. Goldak, J.; Chakravarti, A.; Bibby, M. A New Finite Element Model for Welding Heat Sources. Metall. Trans. B 1984, 15, 299–305. [Google Scholar] [CrossRef]
  27. Hemmesi, K.; Mallet, P.; Farajian, M. Numerical Evaluation of Surface Welding Residual Stress Behavior under Multiaxial Mechanical Loading and Experimental Validations. Int. J. Mech. Sci. 2020, 168, 105127. [Google Scholar] [CrossRef]
  28. Wang, Z.; Wang, K.; Liu, Y.; Zhu, B.; Zhang, Y.; Li, S. Multi-Scale Simulation for Hot Stamping Quenching & Partitioning Process of High-Strength Steel. J. Mater. Process Technol. 2019, 269, 150–162. [Google Scholar] [CrossRef]
  29. Putz, A.; Althuber, M.; Zelić, A.; Westin, E.M.; Willidal, T.; Enzinger, N. Methods for the Measurement of Ferrite Content in Multipass Duplex Stainless Steel Welds. Weld. World 2019, 63, 1075–1086. [Google Scholar] [CrossRef]
  30. ASTM E562; Standard Test Method for Determining Volume Fraction by Systematic Manual Point Count. ASTM International: West Conshohocken, PA, USA, 2000.
  31. ASTM A370; Standard Test Methods and Definitions for Mechanical Testing of Steel Products. ASTM International: West Conshohocken, PA, USA, 2019.
  32. Vieira, D.; Andrade, E.; Jorge, V.L.; Araújo, D.B.; Scotti, A. Determinação de “Overshoot” Em Simulação Física de ZAC de Soldagem. In Proceedings of the XLIV CONSOLDA—Congresso Nacional de Soldagem, Uberlândia, MG, Brazil, 10–13 September 2018; Volume 12. [Google Scholar]
  33. Nuñez de la Rosa, Y.E.; Calabokis, O.P.; Pena Uris, G.M.; Borges, P.C. Pitting and Crevice Corrosion Behavior of the Duplex Stainless Steel UNS S32205 Welded by Using the GTAW Process. Mater. Res. 2022, 25, e20220179. [Google Scholar] [CrossRef]
  34. Mohammed, G.; Ishak, M.; Aqida, S.; Abdulhadi, H. Effects of Heat Input on Microstructure, Corrosion and Mechanical Characteristics of Welded Austenitic and Duplex Stainless Steels: A Review. Metals 2017, 7, 39. [Google Scholar] [CrossRef]
  35. Biezmaa, M.V.; Berlangab, C.; Argandonac, G. Relationship between Microstructure and Fracture Types in a UNS S32205 Duplex Stainless Steel. Mater. Res. 2013, 16, 965–969. [Google Scholar] [CrossRef]
  36. Chen, L.; Tan, H.; Wang, Z.; Li, J.; Jiang, Y. Influence of Cooling Rate on Microstructure Evolution and Pitting Corrosion Resistance in the Simulated Heat-Affected Zone of 2304 Duplex Stainless Steels. Corros. Sci. 2012, 58, 168–174. [Google Scholar] [CrossRef]
  37. Da Fonseca, G.S.; Barbosa, L.O.R.; Ferreira, E.A.; Xavier, C.R.; De Castro, J.A. Microstructural, Mechanical, and Electrochemical Analysis of Duplex and Superduplex Stainless Steels Welded with the Autogenous TIG Process Using Different Heat Input. Metals 2017, 7, 538. [Google Scholar] [CrossRef]
  38. Olaya-Luengas, L.; Morejón, J.A.P.; Rezende, M.C.; Bott, I.d.S. Análise Microestrutural Da Zta Simulada Na Gleeble Do Aço Duplex Saf 2205. In Proceedings of the 71th ABM Annual Congress, Rio de Janeiro, RJ, Brazil, 27–29 September 2016; pp. 956–965. [Google Scholar] [CrossRef]
  39. Verma, J.; Taiwade, R.V. Effect of Welding Processes and Conditions on the Microstructure, Mechanical Properties and Corrosion Resistance of Duplex Stainless Steel Weldments—A Review. J. Manuf. Process 2017, 25, 134–152. [Google Scholar] [CrossRef]
  40. Hosseini, V.A.; Valiente Bermejo, M.A.; Gårdstam, J.; Hurtig, K.; Karlsson, L. Influence of Multiple Thermal Cycles on Microstructure of Heat-Affected Zone in TIG-Welded Super Duplex Stainless Steel. Weld. World 2016, 60, 233–245. [Google Scholar] [CrossRef]
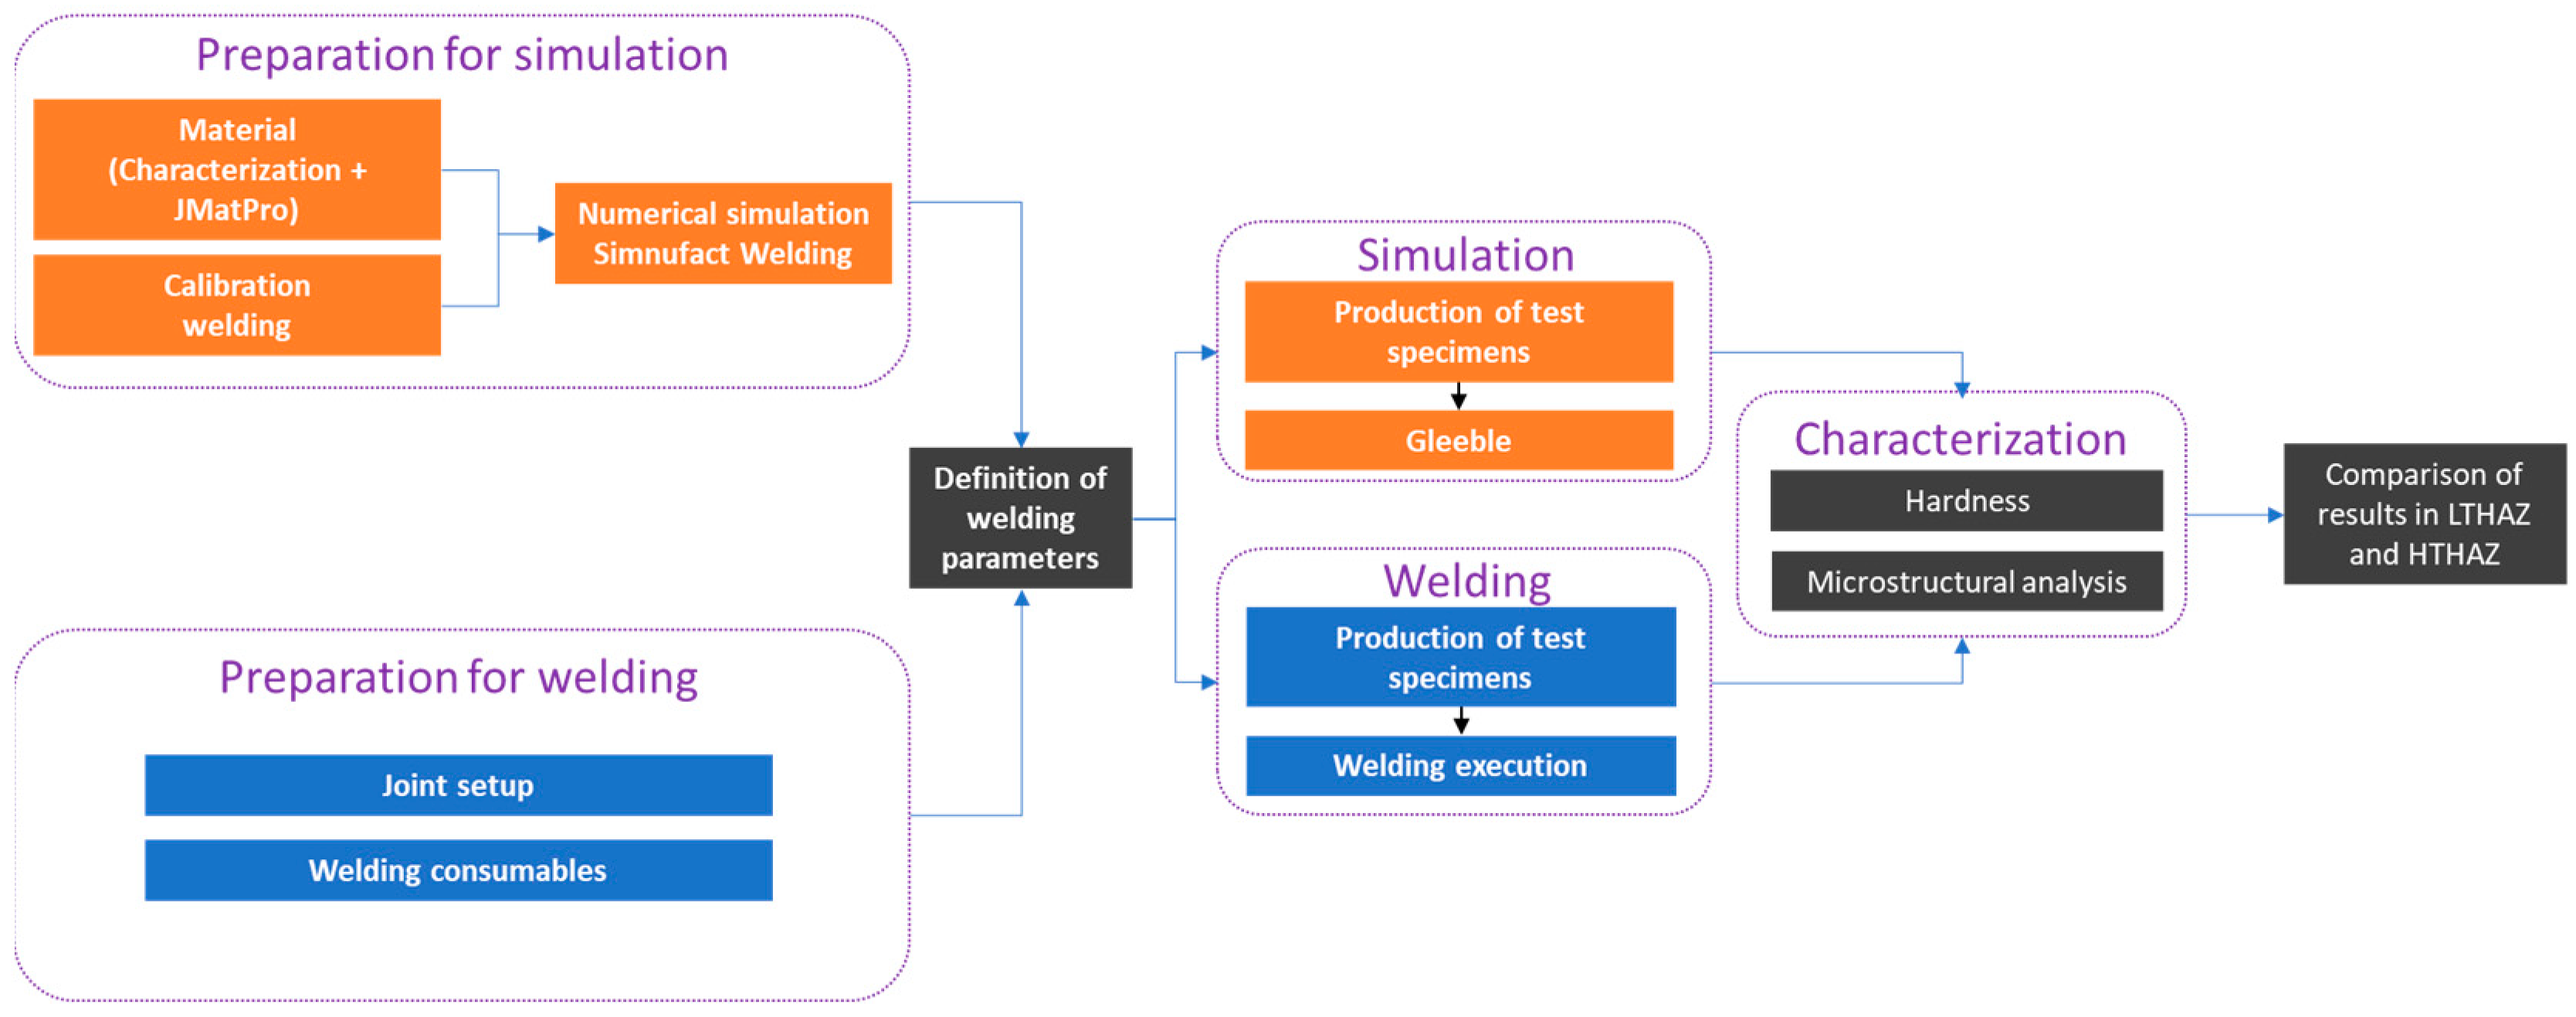
Figure 1. Flowchart showing the steps comprised in the proposed methodology.
Crystals 14 00204 g001
Figure 2. Schematic drawing, in mm, of the designed joint for weave bead welding. T1 and T2 indicate the positions of the thermocouples used.
Crystals 14 00204 g002
Figure 3. Mesh used in the simulation. 3D view (a), frontal view (b) and HAZ zoomed section showing mesh details (c).
Crystals 14 00204 g003
Figure 4. Thermal cycle measured in calibration welding (a); thermal cycle obtained in Simufact Welding simulation (b); temperature maps (c,e); pass geometry in (d,f).
Crystals 14 00204 g004
Figure 5. Physical (green line) and numerical (red line) simulation curves of HTHAZ (a,c,e) and LTHAZ (b,d,f) regions for condition CD1 (a,b), CD2 (c,d), and CD3 (e,f).
Crystals 14 00204 g005
Figure 6. Metallography in three dimensions of AISI UNS S32750 material, 10 mm as received. 200× magnification. Electrolytic etching with 40% KOH, 3V for about 7 s. RD—rolling direction; ND—normal direction (a), microstructure of LTHAZ CD1, CD2, and CD3 from physical samples (b).
Crystals 14 00204 g006
Figure 7. Different microstructures identified in samples subjected to the thermal cycle of physical simulation using the Gleeble®.
Crystals 14 00204 g007
Figure 8. Microstructure comparison between HAZ sub-regions in welded specimens (regions highlighted with a dashed red line), and in Gleeble® specimens in conditions CD1 (a), CD2 (b), and CD3 (c).
Crystals 14 00204 g008aCrystals 14 00204 g008b
Figure 9. Comparison between HAZ sub-regions in welded specimens (black) and in Gleeble® (red) specimens, both in term of percentage ferrite and microhardness, in conditions CD1 (a), CD2 (b), and CD3 (c).
Crystals 14 00204 g009
Table 1. Chemical composition (% weight; Fe: balance) of the UNS S32750 superduplex steel and of the ER2594 filler.
MaterialCCrNiMoMnSiNPSCuWPREN 1
SDSS0.01524.726.883.800.740.420.270.0290.01--41.58
ER25940.00324.0–27.08.0–10.52.5–4.52.50.030.20–0.300.030.021.51.035.45–46.65
1 PREN = Cr + 3.3 Mo + 16 N.
Table 2. Data collected from experimental tests.
ParameterPASS 1PASS 2PASS 3PASS 4PASS 5
Start (s)070326264298.65073
End (s)3601030294046255172
Interpass waiting time (s)034315961358.6448
Welding time (s)360327314326.499
Bead size (mm)350350315290280
Speed (mm/s)2.702.776.096.095.42
Voltage (V)12.512.5323232
Current (A)154146114112103
Efficiency (η)0.40.550.450.50.6
Table 3. Parameters used for FEM simulation of welding in Simufact Welding® 2023 software.
ParameterGTAWGMAWUnit
Front length (af)24.5mm
Rear length (ar)814mm
Depth (d)47mm
Width (b)15mm
Gaussian parameter (M)33-
Convective heat transfer coefficient (h) 2020W/m2k
Contact heat transfer coefficient (α) 10001000W/m2k
Emissivity (ε)0.60.6-
Table 4. Heat input and interpass temperature target conditions used in this study.
Condition1st Pass (GTAW) [kJ/mm]2nd Pass (GTAW) [kJ/mm]Subsequent Passes (GMAW) [kJ/mm]Interpass Temperature [°C]
CD10.840.630.84100
CD21.320.991.32100
CD31.981.491.98100
Table 5. Measured welding parameters for the three heat input conditions studied.
ConditionPassSpeed [mm/min]Voltage [V]Current [A]HI [kJ/mm]
CD1179.96 ± 7.0110.29 ± 0.52114.00 ± 0.010.88
2105.62 ± 9.2310.20 ± 0.47114.00 ± 0.010.66
3–7360–37023.89 ± 0.10160–1750.66–0.68
CD2179.96 ± 7.0110.29 ± 0.52114.00 ± 0.010.88
2105.62 ± 9.2310.20 ± 0.47114.00 ± 0.010.66
3–7360–37023.89 ± 0.10160–1750.66–0.68
CD3154.45 ± 4.8912.23 ± 0.34148.00 ± 0.011.99
2108.43 ± 5.2413.17 ± 0.43219.00 ± 0.011.60
3–5200–23029.25 ± 0.10240–2601.83–2.15
Table 6. Ferrite content (%) and microhardness (HV02) comparison of Gleeble® and welded samples.
RegionCD1CD2CD3
Gleeble (%)Welded (%)Gleeble (%)Gleeble (%)Welded (%)Gleeble (%)
LTHAZ38.5 ± 1.938.8 ± 0.738.6 ± 1.637.9 ± 4.531.3 ± 3.333.9 ± 1.1
HTHAZ40.2 ± 2.141.5 ± 1.641.2 ± 2.241.7 ± 0.935 ± 4.833.9 ± 2.5
Gleeble (HV02)Welded (HV02)Gleeble (HV02)Welded (HV02)Gleeble (HV02)Welded (HV02)
LTHAZ291.4 ± 10.7295 ± 10.2289.8 ± 8.6288.5 ± 5.0283.2 ± 5.8272.5 ± 12.2
HTHAZ300.1 ± 8.8314.0 ± 10.5298.2 ± 10.1289 ± 10.4284.4 ± 10.2278.3 ± 11.02
Disclaimer/Publisher’s Note: The statements, opinions and data contained in all publications are solely those of the individual author(s) and contributor(s) and not of MDPI and/or the editor(s). MDPI and/or the editor(s) disclaim responsibility for any injury to people or property resulting from any ideas, methods, instructions or products referred to in the content.