Abstract
Microwave fabrication and design techniques are commonly employed in the terahertz (THz) domain. However, a characterization of commercially available microwave dielectric materials is usually lacking at sub-THz and THz frequencies. In this work, we characterized four substrates by Rogers and an Ordyl dry resist between 0.2 and 2 THz, in terms of relative permittivity and loss tangent. The reflectance spectra of the investigated materials were retrieved by means of THz time-domain spectroscopy in reflection mode and post-processed according to a transmission-line model in which the materials’ parameters are fit by means of the Havriliak–Negami variation of the Debye model. The relative permittivity of the investigated materials showed negligible frequency dispersion in the sub-THz and in the THz range. In terms of the loss tangent, the Rogers substrates revealed a more pronounced frequency-dispersive behavior among different materials, as dictated by the Havriliak–Negami model. The Ordyl resist was dispersive in the 0.2–1.2 THz range and presented a nearly constant loss tangent value between 1.2 and 2 THz. These results may represent a reference for the development of innovative components for THz and sub-THz emerging applications.
1. Introduction
Printed circuit board (PCB) technology is widely used for designing planar waveguiding and radiating devices such as filters, polarizers, and antennas that operate at microwave and millimeter-wave frequencies [1,2,3]. PCB technology is preferred for its versatility, low cost, and simple fabrication process, and the broad availability of commercial materials [4]. Commonly employed laminates in PCB technology include ceramics, polytetrafluoroethylene (PTFE), and epoxy resin composites. The relative permittivity and loss tangents of these materials frequently exhibit relatively low-frequency dispersion in the frequency of interest for most microwave applications that span from a few hundred MHz to a few tens of GHz. For this reason, such material parameters are usually provided by the manufacturer at 1 GHz and/or 10 GHz. Therefore, the dielectric characterization at these frequencies can be safely approximated in the frequency range of interest with a constant fit.
Conversely, the dielectric properties of commonly used PCB materials at THz or sub-THz frequencies can significantly differ from those provided by the manufacturer at lower frequencies. Therefore, it is essential to accurately characterize these materials, considering the non-negligible frequency dispersion of the generally complex-valued dielectric constant. Commercial laminates from Taconic and Rogers are interesting materials for devices working at millimeter-wave and sub-THz frequencies [5]. In [4], the dielectric properties of Taconic and Rogers substrates were characterized in the W-band (75–110 GHz) using a voltage network analyzer (VNA). The S-parameters of a substrate-integrated waveguide (SIW) resonator were used to extract the dielectric properties. In [6], Rogers substrates were characterized in the 0.2–1.8 THz range using THz time-domain spectroscopy (TDS). References [7,8] related and compared the THz-TDS measurements with VNA measurements for several Rogers and co-fired ceramics. THz-TDS measurements cannot offer a reliable estimation of the material dielectric properties at frequencies below 300 GHz due to a lack of dynamic range with respect to the noise floor. In contrast, VNA measurements deliver accurate results below 300 GHz, but they can only be extended up to 1.5 THz with a significant increase in associated equipment cost. Therefore, the two approaches, i.e., THz-TDS and VNA, are usually seen as complementary; still, they produce comparable results [9,10].
Even if most THz-TDS measurements are performed in transmission mode [11], the reflection mode represents an effective technique for retrieving the complex-valued frequency dispersion of the dielectric properties of moderately reflective and lossy materials [12,13,14,15]. It also represents a powerful tool for the THz characterization of back-metallized substrates employed in THz planar antennas [16] and in the synthesis of metasurfaces for THz-wave manipulation, e.g., absorption [17] or beam steering [18].
The aim of this work is to provide a first-time THz characterization in terms of both dielectric permittivity and the loss tangent of the following dielectric materials: Rogers RO3006, Rogers CLTE-MW, Rogers Ultralam 3850HT, Rogers Duroid 6035HTC, and Ordyl FP 415. The measurements have been performed in reflection mode and the frequency dispersion of the complex permittivity has been described by the Havriliak–Negami variation of the Debye model [15]. This model replicates with remarkable accuracy the experimentally measured reflectance spectra through a fitting optimization procedure based on an analytical transmission-line model.
2. Materials and Methods
2.1. The Substrates
In this work, we characterized four commercially available substrates and a dry resist at THz frequencies. Rogers RO3006, CLTE-MW, and Duroid 6035HTC are ceramic-filled PTFE composites intended for use in commercial microwave and RF applications. These substrates are developed to provide a cost-effective, high-performance material for the circuit designer. The three samples are 0.64 mm, 0.08 mm, and 0.1254 mm thick, respectively. The Rogers Ultralam 3850HT uses a highly temperature-resistant liquid crystalline polymer (LCP) as a laminate material. This substrate has a melt temperature of 330 °C, which can simplify the process of building multilayer boards. According to the manufacturer [19], the Ultralam laminates are well suited for high-speed and high-frequency applications used in mobile internet devices, automotive radar, and moisture-sensitive MMIC and chip packaging applications. The Ultralam 3850HT sample is 0.18 mm thick. Ordyl FP 415 is a solvent-type dry film specifically developed to obtain ultra-fine line patterns. It is a negative, aqueous-processable dry film, developable and strippable in mildly alkaline solutions, and designed to be exposed with LDI and standard UV lamps. The Ordyl sample is 56 µm thick.
Since all Rogers substrates are metalized on both sides, we etched the 35 µm electrodeposited copper film from one side of the substrates. This was achieved by depositing a 1.3 µm thick resin Microposit S1813 by Rohm and Haas via spin-coating (10 s at 500 rpm, 60 s at 4000 rpm), which was baked for 60 s at 115 °C on a hotplate. Then, the exposed copper side was etched by immersing the samples in a copper wet-etching solution (100 mL H2O, 60 mL HCl, 20 mL H2O2) at 25 °C for 4 min. The resin film was removed by bathing the samples in acetone for 1 min and, finally, they were rinsed in isopropanol and deionized water. In the case of Ordyl FP 415, we used a commercial silicon wafer, 300 µm thick, as a substrate and evaporated aluminum film, 200 nm thick, to serve as a reflective layer for the samples. Then we cut the wafer into four pieces and laminated different dry film layers using the same process described above, obtaining a final thickness of approximately 60 µm. At the end of this process, each sample (Figure 1) showed a bare top side and a back-metallized side and was suitable for investigation in reflection mode by THz-TDS.
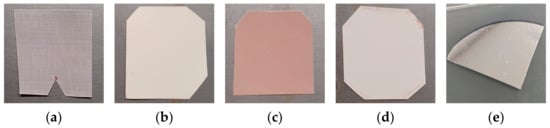
Figure 1.
Investigated material samples: (a) Rogers CLTE-MW; (b) Rogers Ultralam 3850HT; (c) Rogers Duroid 6035HTC; (d) Rogers RO3006; (e) Ordyl FP 415.
2.2. Terahertz Time-Domain Spectroscopy: Setup and Post-Processing Procedure
In this work, the substrates were investigated in reflection mode using the THz time-domain spectrometer TeraFlash Pro [20]. The measurement procedure has been fully described in [15] and is summarized next for the readers’ convenience Figure 2. shows the diagram of the reflection-mode configuration of the THz-TDS setup. The instrument uses the FemtoFErb THz FD6.5 laser as the source, which produces 50 fs pulses at 1560 µm with a 100 MHz repetition rate [20]. The laser pulses are delivered to the emitter by optical fibers, which emit the THz signal through a photoconductive antenna. The THz wave has an angle of incidence of θi = 8°. The measurements were performed by averaging 100 pulses for each time-domain pulse trace s(t) over a 200 ps time window to achieve a true spectral resolution of 5 GHz; zero-padding up to 1 ns was employed to achieve a virtual frequency resolution of 1 GHz. The low level of the signal at the end of the recorded trace of 200 ps (due to the non-negligible absorption and moderate reflectivity of the samples) ensures that no artifacts are introduced by the zero-padding technique. The reflection spectra in the frequency domain were obtained in the range 0.2–2 THz, which ensures almost 80 dB of dynamic range compared to the noise floor.
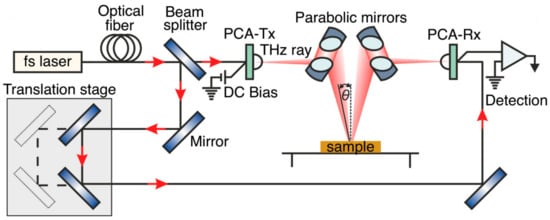
Figure 2.
Schematic of the THz-TDS setup in reflection mode. It consists of a near-infrared laser, photoconductive transmit (Tx) and receive (Rx) antennas, an optical delay line, a set of parabolic mirrors, and a metallic baseplate for the placement of a sample. The red arrows represent the guided signal path, while the red-shaded elements mark the THz beam propagating in the free space.
The THz-TDS measurements were post-processed taking into account the losses and their frequency dispersion, as discussed in [15,21]. To this aim, the samples were modeled by means of an equivalent circuit (Figure 3), and the correspondent theoretical amplitude reflection coefficient Rth was derived at the air–substrate interface, viz., z = 0. The amplitude reflection coefficient is Rth = |Yc − Yin|/|Yc + Yin| by definition (see, e.g., [22]), where Yc and Yin are the characteristic admittance at z = 0+ and the input admittance looking downwards at z = 0−, respectively. According to Figure 3, Yc = Y0cos θi (the incident wave is TE polarized), where Y0 is the wave admittance in the air, and Yin = −jYε cot(kzεd), where Yε and kzε are the wave admittance and the propagating wavenumber in the dielectric substrate of thickness d. The amplitude reflection coefficient finally reads:
where k0 is the vacuum wavenumber.
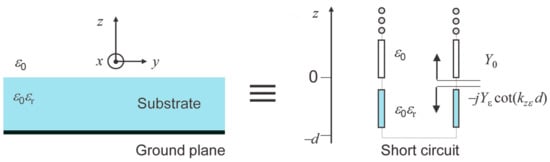
Figure 3.
Sample cross-section and its equivalent circuit model.
Then, the theoretical amplitude reflection coefficient was compared with the measured amplitude reflection coefficient (Rmeas). Rmeas was the ratio between the amplitude of the reflection spectrum (i.e., in frequency domain) |S(f)| from the substrate over the reference measurement taken without any sample. In the Rth evaluation, the substrate relative permittivity was described by the Havriliak–Negami variation of the Debye model [15,23] (a time-harmonic ejωt dependence is tacitly assumed):
These parameters were introduced as free variables in a standard optimization procedure that relies on the Nelder–Mead simplex method implemented in MATLAB© (version R2023a), which minimized the L2-norm of the difference between Rth and Rmeas over the 0.2–2 THz spectral window of investigation. Thus, the optimization problem consisted of seeking the optimum values of ε∞, Δε, τ, α, and β such that:
where fmin = 0.2 THz and fmax = 2 THz. This minimization process provided a 5-tuple of optimum values to be applied to (2) to obtain the best fit of Rmeas.
3. Results
Figure 4 and Figure 5 show data obtained by the post-processing procedure, as outlined in the previous section. Figure 4a reports the relative permittivity in the frequency range between 0.2 and 2 THz, while Figure 4b represents the loss tangent of the materials.
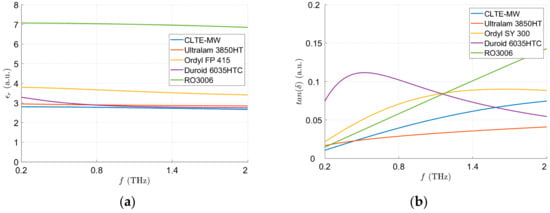
Figure 4.
Spectra of the (a) relative dielectric permittivity and (b) loss tangent fit by means of the Havriliak–Negami variation of the Debye model.
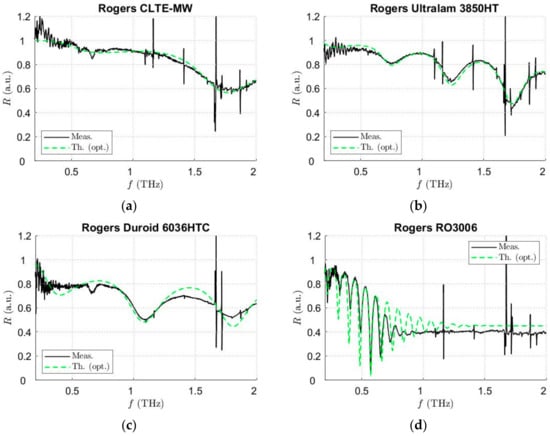
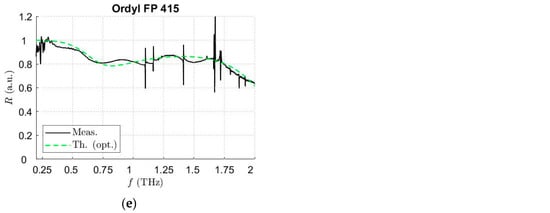
Figure 5.
Measured (black line) and theoretical (green dashed line) spectra based on the Havriliak–Negami variation of the Debye model for the five investigated materials: (a) Rogers CLTE-MW, (b) Rogers Ultralam 3850HT, (c) Rogers Duroid 6035HTC, (d) Rogers RO3006, and (e) Ordyl FP 415.
The results revealed a different behavior between the dielectric permittivity and the loss tangent. In fact, the relative permittivity showed a significant low-frequency dispersion. In contrast, the loss tangent presented a non-negligible frequency dispersion in the investigated frequency range. Rogers CLTE-MW, Ultralam 3850HT, and RO3006 had a value of loss tangent that almost linearly increased between 0.2 and 2 THz. RO3006 showed the highest increment in the loss tangent value. Ordyl FP 415 had a loss tangent with a moderate frequency dispersion between 0.2 and 1.2 THz and a very low dispersive loss tangent between 1.2 and 2 THz.
A comparison between the reflectance coefficients experimentally obtained |Rmeas| and those theoretically calculated |Rth| is shown in Figure 5 for each material sample investigated in this study.
Moreover, Table 1 summarizes the parameters employed in the Havriliak–Negami variation of the Debye model for each material. All materials have the parameter β = 1, which reduces the Havriliak–Negami model to the Cole–Cole equation [24]. On the other side, all materials except Ultralam 3850HT have the parameter α = 1 too and fit with a standard Debye model. However, when the parameters are α < 1 and β = 1, the Havriliak–Negami model describes a different relaxation behavior that dielectric polymers may exhibit in contrast to more ideal dielectric materials. More precisely, in the Debye model, the spectrum of the imaginary part of the relative permittivity will show a peak at ω = 1/τ with a full-width at half maximum (FWHM) equal to /τ. As the exponent α in the Cole-Cole equation decreases from 1 (the condition for the Debye model), the FWHM increases, thus causing a spectral broadening of the absorption. Another way to interpret this phenomenon is that the relaxation time becomes frequency dependent (which, in turn, changes the FWHM expected from the Debye model), thus explaining the different dispersive behavior of certain polymers.

Table 1.
Havriliak–Negami variation of the Debye model parameters involved in the substrates’ relative permittivity evaluation. The τ parameter is expressed in femtoseconds.
In this regard, Ultralam 3850HT is a considerably different material from other Rogers composites investigated in this work. While CLTE-MW, Duroid 6035HTC, and RO3006 are ceramic-filled and PTFE-based composite materials, Ultralam 3850HT uses an LCP as a laminate material. This difference might explain the reason why a simple Debye model is not sufficient to obtain an accurate fit with the measured reflection spectrum.
As reported in [21], an oscillating component with a decreasing amplitude as the frequencies increase can be observed in the reflection spectra shown in Figure 5. This characteristic behavior of the reflection spectra, also known as the Fabry–Perot effect, is due to the multiple reflections experienced by the THz wave that penetrates the substrate and remains partially trapped between the metallic plate and the air–dielectric interface. With reference to THz-TDS measurements in reflection mode, the Fabry–Perot effect is particularly useful for retrieving the necessary information for the dispersion model-fitting procedure. In fact, the position and the modulation depth of such oscillating peaks depend on the material dielectric properties at the investigated frequencies and on the sample’s thickness. These data at 0.3, 1, and 1.5 THz are reported in Table 2.
Table 2.
Relative dielectric constant and loss tangent values of the investigated substrates at 10 GHz, 0.3 THz, 1 THz, and 1.5 THz. Data at 10 GHz are provided by manufacturers and are not available (n.a.) for Ordyl FP 415.
Rogers RO3006 has a reflectance spectrum converging toward a constant value at higher frequencies (Figure 5b). This is the value of the THz wave reflected by the upper surface of the substrate and is related to relative permittivity of the material. However, this constant value is lower for the measured reflectance spectra than the theoretical ones. This is due to a defocusing effect related to the samples’ thickness and the high permittivity of RO3006, which doubles the wave path distance. The value of the theoretical reflection coefficient at higher frequencies can be estimated using the formula )/(. The theoretical reflection coefficient value at 1.5 THz for the RO3006 (see Table 2) is 0.45, as reported in Figure 5b. As discussed in [21], this higher-frequency behavior does not necessarily need the application of a corrective technique. In fact, the lower part of the frequency spectra contains the essential information in the suggested post-processing technique, and it matches the theoretical spectra well.
Overall, these results can constitute an interesting reference in the development of innovative components for THz and sub-THz emerging applications.
4. Discussion
Table 2 also summarizes the dielectric properties provided by manufacturers at 10 GHz. The dielectric properties of standard microwave substrates can differ significantly in the sub-THz and THz spectral range. For the investigated materials, it is true specifically in terms of a loss tangent that increases by a factor of ten for most of the substrates. Furthermore, the values of dielectric permittivity and loss tangent are usually extracted by inversion algorithms, and the causality principle in the frequency-domain dielectric function could be not necessarily preserved. In this study, we accurately fit the data by means of the Havriliak–Negami variation of the Debye model, which provided a readily available analytic and consistent expression that intrinsically fulfills Kramers–Kronig relations, thus ensuring causality. We also note that the relative permittivity of all materials slightly decreases in the investigated frequency range, whereas the loss tangent correspondingly increases for most materials (see Figure 4a,b). This is consistent with the relaxation times reported in Table 1 at which resonances fres correspond with frequencies way beyond the investigated THz range (viz., fres = 1/(2πτ)). The only exception is the Rogers Duroid 6035HTC whose resonance is expected at around 0.47 THz, as one can infer from the maximum location of the loss tangent in Figure 4b.
The measurement of the reflection spectra of the materials allows for indirectly determining the absorption spectrum, which is mainly related to the loss tangent of the materials by means of Lambert–Beer’s law. As shown in Table 2, the loss tangent of all materials goes from 0.1 to 0.01; thus, the absorption rates of these substrates are rather different from one another. Although the materials that are commonly used for microwave devices have higher losses than those that are typically used for THz devices [25,26,27], they have the advantage of being low-cost and more widespread. This means that they can be easily obtained and integrated with other technologies, such as antennas, filters, and modulators, to realize efficient and versatile THz and sub-THz devices.
In this work, we characterized four commercially available substrates (Rogers RO3006, Rogers CLTE-MW, Rogers Ultralam 3850HT, and Rogers Duroid 6035HTC) and a dry resist (Ordyl FP 415) at sub-THz and THz frequencies based on THz time-domain spectroscopy in reflection mode. The measured reflectance spectra were matched to theoretical reflectance spectra retrieved by a transmission-line model where the complex permittivity of the investigated material was fit by means of the Havriliak–Negami variation of the Debye model. According to the proposed post-processing technique, materials’ relative permittivity showed a negligible frequency dispersion in the sub-THz and THz range. In terms of the loss tangent, the Rogers substrates revealed a frequency-dispersive behavior. The Ordyl resist was dispersive in the 0.2–1.2 THz range and presented a nearly constant loss tangent value between 1.2 and 2 THz. These data can constitute a useful reference in the design of THz and sub-THz devices and applications.
In future work, the phase of the reflection spectrum at THz frequencies will be investigated. By measuring both the amplitude and the phase of the reflected signal, it is possible to obtain more accurate information about the thickness and the complex permittivity of the material under test, as well as to detect any defects or anomalies in its structure. Moreover, the phase of the reflection spectrum provides further insights into the behavior of materials such as foams that have a dielectric permittivity close to one. Another point of interest is related to the birefringence of the samples tested at THz frequencies. Birefringence is a property that can reveal the anisotropy and the alignment of the molecular structure of the material, which can affect its optical and electrical behavior [28,29,30]. This property can be interesting for dielectric substrates, as it can provide insights into their suitability and performance for THz applications. Furthermore, birefringence has various applications at THz and sub-THz frequencies, as it is instrumental in realizing polarizing filters and wave plates.
Author Contributions
Conceptualization, W.F. and D.C.Z.; methodology, S.T., W.F. and D.C.Z.; measurements, S.T., W.F., L.M., F.M., T.R. and D.C.Z.; software, W.F.; data processing, S.T., W.F. and D.C.Z.; writing—original draft preparation, S.T.; writing—review and editing, all authors; supervision, R.B., W.F. and D.C.Z. All authors have read and agreed to the published version of the manuscript.
Funding
This work was supported by the project ECS00000024 “Ecosistemi dell’Innovazione”–Rome Technopole of the Italian Ministry of University and Research (B83C22002890005), public call n. 3277, PNRR–Mission 4, Component 2, Investment 1.5, financed by the European Union, Next Generation EU. W. F. acknowledges the project PRIN 2022 “SAFE” (Spiral and Focused Electromagnetic fields) 2022ESAC3K, Italian Ministry of University and Research (MUR) financed by the European Union, Next Generation EU.
Data Availability Statement
The original contributions presented in the study are included in the article, further inquiries can be directed to the corresponding author.
Conflicts of Interest
The authors declare no conflicts of interest.
References
- Shi, S.; Lu, Q.; Feng, W.; Chen, W. Wideband Polarization Rotation Transmitarray Using Arrow-Shaped FSS at W-Band. IEEE Trans. Antennas Propag. 2022, 70, 6001–6005. [Google Scholar] [CrossRef]
- You, K.Y.; Sim, M.S. Survey on RF, Microwave, and Millimeter-Wave Planar Passive Components Design Using Analytical Approach. In Handbook of Research on Emerging Designs and Applications for Microwave and Millimeter Wave Circuits; IGI Global: Hershey, PA, USA, 2023; pp. 404–482. ISBN 978-1-66845-955-3. [Google Scholar]
- Guo, Q.-Y.; Wong, H. Design of an Air-Filled Slot Antenna and Array for Millimeter-Wave Applications. IEEE Trans. Antennas Propag. 2022, 70, 7217–7222. [Google Scholar] [CrossRef]
- Cheng, Y.J.; Liu, X.L. W-Band Characterizations of Printed Circuit Board Based on Substrate Integrated Waveguide Multi-Resonator Method. IEEE Trans. Microw. Theory Tech. 2016, 64, 599–606. [Google Scholar] [CrossRef]
- Zhu, H.-T.; Liu, D.; Hu, J.; Li, S.; Shi, S.-C.; Xue, Q.; Che, W. Low-Loss, Thermally Insulating, and Flexible Rectangular Dielectric Waveguide for Sub-THz—Signal Coupling in Superconducting Receivers. IEEE Trans. Terahertz Sci. Technol. 2020, 10, 190–199. [Google Scholar] [CrossRef]
- Hejase, J.A.; Paladhi, P.R.; Chahal, P.P. Terahertz Characterization of Dielectric Substrates for Component Design and Nondestructive Evaluation of Packages. IEEE Trans. Compon. Packag. Manuf. Technol. 2011, 1, 1685–1694. [Google Scholar] [CrossRef]
- Ma, M.; Wang, Y.; Navarro-Cia, M.; Liu, F.; Zhang, F.; Liu, Z.; Li, Y.; Hanham, S.M.; Hao, Z. The Dielectric Properties of Some Ceramic Substrate Materials at Terahertz Frequencies. J. Eur. Ceramic Soc. 2019, 39, 4424–4428. [Google Scholar] [CrossRef]
- Ruan, X.; Chan, C.H. Terahertz Free-Space Dielectric Property Measurements Using Time- and Frequency-Domain Setups. Int. J. RF Microw. Comput.-Aided Eng. 2019, 29, e21839. [Google Scholar] [CrossRef]
- Naftaly, M.; Vieweg, N.; Deninger, A. Industrial Applications of Terahertz Sensing: State of Play. Sensors 2019, 19, 4203. [Google Scholar] [CrossRef]
- Carter, J.; Lees, H.; Wang, Q.; Chen, S.J.; Atakaramians, S.; Withayachumnakul, W. Terahertz Properties of Common Microwave Dielectric Materials. J. Infrared Millim. Terahertz Waves 2023, 44, 873–884. [Google Scholar] [CrossRef]
- Withayachumnankul, W.; Naftaly, M. Fundamentals of Measurement in Terahertz Time-Domain Spectroscopy. J. Infrared Millim. Terahertz Waves 2013, 35, 610–637. [Google Scholar] [CrossRef]
- Jepsen, P.U.; Jensen, J.K.; Møller, U. Characterization of Aqueous Alcohol Solutions in Bottles with THz Reflection Spectroscopy. Opt. Express 2008, 16, 9318. [Google Scholar] [CrossRef] [PubMed]
- Mackenzie, D.M.A.; Whelan, P.R.; Bøggild, P.; Jepsen, P.U.; Redo-Sanchez, A.; Etayo, D.; Fabricius, N.; Petersen, D.H. Quality Assessment of Terahertz Time-Domain Spectroscopy Transmission and Reflection Modes for Graphene Conductivity Mapping. Opt. Express 2018, 26, 9220. [Google Scholar] [CrossRef] [PubMed]
- Ahi, K.; Shahbazmohamadi, S.; Asadizanjani, N. Quality Control and Authentication of Packaged Integrated Circuits Using Enhanced-Spatial-Resolution Terahertz Time-Domain Spectroscopy and Imaging. Opt. Lasers Eng. 2018, 104, 274–284. [Google Scholar] [CrossRef]
- Fuscaldo, W.; Simone, S.D.; Dimitrov, D.; Marinova, V.; Mussi, V.; Beccherelli, R.; Zografopoulos, D.C. Terahertz Characterization of Graphene Conductivity via Time-Domain Reflection Spectroscopy on Metal-Backed Dielectric Substrates. J. Phys. D Appl. Phys. 2022, 55, 365101. [Google Scholar] [CrossRef]
- Fuscaldo, W.; Tofani, S.; Zografopoulos, D.C.; Baccarelli, P.; Burghignoli, P.; Beccherelli, R.; Galli, A. Systematic Design of THz Leaky-Wave Antennas Based on Homogenized Metasurfaces. IEEE Trans. Antennas Propag. 2018, 66, 1169–1178. [Google Scholar] [CrossRef]
- Astorino, M.D.; Fastampa, R.; Frezza, F.; Maiolo, L.; Marrani, M.; Missori, M.; Muzi, M.; Tedeschi, N.; Veroli, A. Polarization-Maintaining Reflection-Mode THz Time-Domain Spectroscopy of a Polyimide Based Ultra-Thin Narrow-Band Metamaterial Absorber. Sci. Rep. 2018, 8, 1985. [Google Scholar] [CrossRef]
- Vasic, B.; Isic, G.; Beccherelli, R.; Zografopoulos, D.C. Tunable Beam Steering at Terahertz Frequencies Using Reconfigurable Metasurfaces Coupled With Liquid Crystals. IEEE J. Sel. Top. Quantum Electron. 2020, 26, 7701609. [Google Scholar] [CrossRef]
- ULTRALAM-38501.Pdf. Available online: http://pwcircuits.co.uk/pwcircuits/wp-content/uploads/2018/08/ULTRALAM-38501.pdf (accessed on 14 February 2024).
- TOPTICA Photonics AG TeraFlash pro, Versatile Time-Domain Terahertz Platform. Available online: https://www.toptica.com/products/terahertz-systems/time-domain/teraflash-pro (accessed on 18 February 2024).
- Fuscaldo, W.; Maita, F.; Maiolo, L.; Beccherelli, R.; Zografopoulos, D.C. Broadband Dielectric Characterization of High-Permittivity Rogers Substrates via Terahertz Time-Domain Spectroscopy in Reflection Mode. Appl. Sci. 2022, 12, 8259. [Google Scholar] [CrossRef]
- Pozar, D.M. Microwave Engineering; John Wiley & Sons: Hoboken, NJ, USA, 2012; ISBN 978-0-470-63155-3. [Google Scholar]
- Havriliak, S.; Negami, S. A Complex Plane Representation of Dielectric and Mechanical Relaxation Processes in Some Polymers. Polymer 1967, 8, 161–210. [Google Scholar] [CrossRef]
- Cole, K.S.; Cole, R.H. Dispersion and Absorption in Dielectrics I. Alternating Current Characteristics. J. Chem. Phys. 1941, 9, 341–351. [Google Scholar] [CrossRef]
- Feng, Y.; Tsao, H.; Barker, N.S. THz MEMS Switch Design. Micromachines 2022, 13, 745. [Google Scholar] [CrossRef] [PubMed]
- Tofani, S.; Zografopoulos, D.C.; Missori, M.; Fastampa, R.; Beccherelli, R. Terahertz Focusing Properties of Polymeric Zone Plates Characterized by a Modified Knife-Edge Technique. J. Opt. Soc. Am. B 2019, 36, D88–D96. [Google Scholar] [CrossRef]
- Shen, S.; Liu, X.; Shen, Y.; Qu, J.; Pickwell-MacPherson, E.; Wei, X.; Sun, Y. Recent Advances in the Development of Materials for Terahertz Metamaterial Sensing. Adv. Opt. Mater. 2022, 10, 2101008. [Google Scholar] [CrossRef]
- Castro-Camus, E.; Johnston, M.B. Extraction of the Anisotropic Dielectric Properties of Materials from Polarization-Resolved Terahertz Time-Domain Spectra. J. Opt. A Pure Appl. Opt. 2009, 11, 105206. [Google Scholar] [CrossRef][Green Version]
- Arikawa, T.; Zhang, Q.; Ren, L.; Belyanin, A.A.; Kono, J. Review of Anisotropic Terahertz Material Response. J. Infrared Millim. Terahertz Waves 2013, 34, 724–739. [Google Scholar] [CrossRef]
- Mosley, C.D.W.; Failla, M.; Prabhakaran, D.; Lloyd-Hughes, J. Terahertz Spectroscopy of Anisotropic Materials Using Beams with Rotatable Polarization. Sci. Rep. 2017, 7, 12337. [Google Scholar] [CrossRef]
Disclaimer/Publisher’s Note: The statements, opinions and data contained in all publications are solely those of the individual author(s) and contributor(s) and not of MDPI and/or the editor(s). MDPI and/or the editor(s) disclaim responsibility for any injury to people or property resulting from any ideas, methods, instructions or products referred to in the content. |
© 2024 by the authors. Licensee MDPI, Basel, Switzerland. This article is an open access article distributed under the terms and conditions of the Creative Commons Attribution (CC BY) license (https://creativecommons.org/licenses/by/4.0/).