Article

Analysis of Phase-Specific Strain Pole Figures for Duplex Steels under Elasto-Plastic Uniaxial Tension—Experiment vs. EPSC Modelling

1
Institute for Applied Materials, Karlsruhe Institute of Technology, 76131 Karlsruhe, Germany
2
Institut Laue-Langevin, 38042 Cedex 9 Grenoble, France
3
Heinz Maier-Leibnitz Zentrum (MLZ), TU München, 85748 Garching, Germany
*
Author to whom correspondence should be addressed.
Crystals 2024, 14(3), 206; https://doi.org/10.3390/cryst14030206
Submission received: 3 February 2024 / Revised: 13 February 2024 / Accepted: 15 February 2024 / Published: 21 February 2024
(This article belongs to the Special Issue Microstructure and Properties of Steels and Other Structural Alloys)

Abstract

:
For the duplex stainless steel X2CrNiMoN22-5-3, phase-specific strain pole figures (strain PFs) for the phases ferrite (bcc) and austenite (fcc) were analysed under uniaxial tensile loading for various loading states in purely elastic and elasto-plastic regimes. Experimentally, strain PFs were determined by means of in situ neutron diffraction strain measurements under defined uniaxial loading. These experimental results were compared with strain PFs calculated using elasto-plastic self-consistent (EPSC) modelling. The comparison was performed for two different {hkl} planes per phase. While classic load stress and load partitioning analyses for multi-phase materials are often limited to the load direction and a selected direction transverse to it, the results illustrate the added value of determining a strain PF, especially when a phase-specific texture is present. The comparison with experimental data shows how well the load partitioning behaviour can be predicted using common EPSC models, using the example of a duplex stainless steel. The EPSC model used was validated with the software ISODEC in its elastic range. Based on the results of the EPSC model, and taking into account the local phase-specific crystallographic texture, a prediction can be made as to what extent intergranular stresses and phase-specific textures could affect the results of a (residual) stress analysis by means of the diffraction method. This makes it possible to assess whether, for technical applications, meaningful residual stress results can be expected in certain component directions.

1. Introduction

Multiphase materials with a high fraction of contributing phases are interesting candidates for structural materials in engineering applications, as such materials often combine different material properties in a positive way. Duplex stainless steels are an example of such a class of multiphase materials and are becoming increasingly popular as construction materials in mechanical and industrial engineering, as these steels optimally combine the advantages of austenitic stainless steels and ferritic steels. Such steel grades generally have good mechanical properties, resulting in a high strength combined with good ductility. In addition, duplex stainless steels often have better corrosion resistance than conventional austenitic steels, which makes them attractive for applications in, i.a. the chemical and petrochemical industries, in seawater desalination plants and in offshore technology [1,2,3,4,5]. In principle, when producing metallic technical components through processes where plastic deformation and/or thermal energy are introduced, it can be assumed that phase-specific crystallographic textures and/or phase-specific residual stress (RS) states are introduced or affected. Thus, a change in the phase-specific RS as well as the phase-specific texture can be expected along an industrial production route [6,7,8,9,10]. This was impressively demonstrated in [6] for two duplex steels processed through rolling. The duplex steels investigated developed more pronounced crystallographic textures with increasing deformation. Since these crystallographic textures can have an influence on the resulting RS, and also on RS analysis, it is necessary to know the existing crystallographic texture state. In [11], it was shown for a duplex steel with a crystallographic texture subjected to a deep rolling process that this mechanical surface treatment also affects the phase-specific crystallographic texture in the near-surface region, with the side-effect being that, for X-ray residual stress analysis oscillations of 2θ vs.  s i n 2 ψ  distributions were drastically reduced.
For a suitable design of technically relevant components made of multiphase materials with a high fraction of contributing phases, knowledge of the phase-specific load partitioning behaviour and about the development of phase-specific residual stresses resulting from manufacturing and from elasto-plastic loading during service is necessary. Phase-specific strain and stress can only be determined by means of diffraction methods, which are phase-selective. If the evolution of stresses should be determined non-destructively by means of in situ diffraction methods that gain information from the bulk of the material, either high-energy X-ray methods (mostly synchrotron X-ray-based approaches) and neutron diffraction strain analyses are the methods of choice. In neutronographic stress analysis, the line position or the lattice plane spacing in the three supposedly independent principal stress directions are determined. Considering the reference lattice plane spacings for the phase-specific strain- and/or stress-free state  d 0 { h k l } , the {hkl}-dependent elastic lattice strains in these three appointed directions can be determined. From those lattice strains, the {hkl}- and phase-specific stress or residual stress state can be derived using Hooke’s law (Equation (1), according to [12], p. 207) and the lattice-plane-specific diffraction elastic constants (DECs).
σ i j h k l , p = E h k l , p ( 1 + υ h k l , p ) ε i j h k l , p + υ h k l , p ( 1 2 υ h k l , p ) ε 11 h k l , p + ε 22 h k l , p + ε 33 h k l , p δ i j
where the index  i j  identifies the current calculated directions and  ε 11 h k l , p ε 22 h k l , p  and  ε 33 h k l , p  are the strain of the used {hkl} in phase  p  in the three independent directions.  E h k l , p  and  υ h k l , p  correspond to the phase- and {hkl}-specific Young’s moduli and Poisson’s ratios, respectively. Thus, the accuracy of the calculated stress value depends on the experimentally determined lattice strains ( d e x p . h k l , p d 0 h k l , p ) and the used DEC. For the calculation of stresses from the elastic lattice strain using phase-specific DECs, it is expected that there exists a linear relationship between the experimentally determined lattice strain and mechanical stress. In reality, however, this is only given to a limited extent, as in the elasto-plastic stress regime the lattice strain vs. mechanical stress distributions often become significantly non-linear as, i.a., is shown in [12,13,14,15,16,17]. In the literature, this effect is generally termed the ‘plastic anisotropy effect’ (e.g., [12]). A consequence of plastic anisotropy is (phase-specific) microstresses, also known as intergranular stresses [12,18].
It has been shown in the literature that, based on load stress experiments, some lattice planes have been identified to show only a low sensitivity to these plastically induced microstresses. For f.c.c. (face-centred cubic) phases, such as the austenite phase in duplex stainless steels, these are the {111}, {311} and {220} diffraction lines (e.g., [12,15,19,20,21,22]) and for b.c.c. (body-centred cubic) phases, i.e., for the ferrite phase, the {110} and {211} lattice planes are recommended for stress analysis (e.g., [12,19,23,24]). Moreover, it must be noted that the plastic anisotropy effect (intergranular strains and stresses) is also related to crystallographic texture and texture evolution [18]. Regarding neutron stress analysis, these intergranular strains can also affect the reference value  d 0 { h k l }  and can lead, in particular, for multiphase materials, to erroneous stress calculations. In addition, the changing load partitioning leads to a deviating behaviour of the different lattice planes compared to a single-phase material. To better understand the influence of phase-specific textures on the behaviour of the different lattice planes under load, strain pole figures (strain PFs) are perfect. Examples of strain PFs, among others, are shown in [25,26,27]. Because no load stress experiments are carried out on real components and, in addition, often in residual stress analyses the lattice strain is determined only in the three supposedly principal directions, a possibly occurring pronounced plastic anisotropy effect cannot be detected. For this purpose, either a complete load stress analysis must be carried out for a sufficient number of independent orientations or the sample must be tilted to specifically tilt the scattering vector to detect anisotropic effects. In order to take that into account in diffraction stress analysis, measurements performed according to the well-known  s i n 2 ψ  method [28] are frequently applied for lab-scaled X-ray stress analysis, but these could well be extended also to neutron or high-energy synchrotron X-ray measurements.
Anisotropy effects, based on elastic or plastic anisotropy, lead to non-linear distributions of lattice strain vs.  s i n 2 ψ . One possibility for predicting these anisotropic effects for the different lattice planes (and to correct for them in the average term) is to use elasto-plastic self-consistent (EPSC) material models. These modelling approaches have already been successfully applied for both single-phase (e.g., [21,25,26,29,30,31,32]) and multi-phase materials (e.g., [33,34]). It has been shown that for the elasto-plastic self-consistent description of a nominally identical duplex steel such as X2CrNiMoN22-5-3, as an example, very different material data have been published in the literature. In general, EPSC models for small elasto-plastic deformations show better agreement with the determined data than those for large macroscopic total strains. For these, often only the principal trend of the predicted lattice strains is correct. A plot of the EPSC modelling results versus  s i n 2 ψ  is shown in [35], where the general trend of the lattice strain distribution could be predicted as a function of  s i n 2 ψ .
To better understand phase-specific load distribution, in this work uniaxial loading experiments are carried out. For different total strains in the elasto-plastic regime, strain PFs are recorded for different lattice planes. This was achieved by neutron diffraction analyses using the SALSA instrument [36] at ILL, Grenoble (France). The model material used is the duplex stainless steel X2CrNiMoN22-5-3, which, in the present case, has a phase-specific texture due to the manufacturing route of the rod material. Moreover, these load stress experiments are accompanied by EPSC modelling, which is applied to predict strain PFs with respect to the phase-specific crystallographic texture. For the pure elastic load range, a validation is performed by comparing the EPSC results with the well-established software “ISODEC”. The lattice strains determined for various {hkl} planes of each phase were further plotted versus  s i n 2 ψ  to visualize and assess the effect of anisotropy by means of the curvature of the distributions.

2. Experiment

The duplex stainless steel X2CrNiMoN22-5-3 (Materials no.: 1.4462, in accordance with [37]) was chosen as the model material. The nominal phase contents are 50 vol% for ferrite and 50 vol% for austenite, which was confirmed by X-ray diffraction phase analysis (α-Fe 53:46 γ-Fe) and by means of metallography (α-Fe 51: 49 γ-Fe ± 3). The nominal chemical composition is given in Table 1. Micrographs of the as-received state of the duplex stainless steel, which was provided as a rod material with a diameter of 30 mm, are shown in Figure 1. The sample was metallographically prepared and subsequently etched with Beraha II etchant. The bright blue areas correspond to the ferrite phase.
The phase-specific crystallographic textures in the sample cross-section were determined by means of X-ray diffraction (XRD) after removing about 200 µm material from the cut surface by electrochemical polishing. For XRD texture analysis, a Seifert PTS 3000 4-circle diffractometer (Rich. Seifert & Co, Ahrensburg, Germany), using Ni-filtered Co-Kα radiation and a pinhole collimator on the primary side with a nominal aperture of ø 1 mm and a 0.8° slit on the secondary side, was used. For the ferrite phase, the four independent lattice plane families {110}, {200}, {211} and {220} were analysed; for the austenite phase, the {111}, {200}, {220}, {222} and {311} planes were chosen. In all cases, incomplete pole figures (PFs) were determined up to sample tilts of 70°. From these, the orientation distribution function (ODF) for both cubic phases was calculated using the open source MATLAB toolbox MTEX [40]. The phase-specific textures, in their initial state, are shown in Figure 2b as PFs recalculated from the ODFs. For both phases, the ODFs indicate that a specific crystallographic texture was induced through the rolling of the rod material. According to the m.r.d. values of 16 (for ferrite) and 19 (for austenite), the phase-specific textures are rather distinct. While for the b.c.c. phase a fibre texture with <001> parallel to the rod axis is predominantly present (cf. Figure 2: φ2 = 45° cut through ODF), for the f.c.c. phase two fibre components are determined, i.e., a rather intense Θ fibre and a less pronounced γ fibre.
Strain PFs under in situ loading were determined using the SALSA instrument [36] at the Institute Laue-Langevin (ILL) (Grenoble France). For this purpose, due to symmetry reasons, only a quarter PF was recorded at 0, 1, 4 and 10% total strain for the lattice planes {200} and {211} of the b.c.c. ferrite phase and {220} and {311} of the f.c.c. austenite phase, respectively. The macroscopic stress–strain curve of the experimentally investigated sample, including the measuring positions, is shown in Figure 3. The experimental setup is presented in Figure 4. A miniature uniaxial tension–compression rig of type LFM-S 10kN (Walter + Bai GmbH, Löhningen, Switzerland) was mounted on the rotary table in the Eulerian cradle of the SALSA instrument. The uniaxial tensile test was performed under strain control using a clip-on extensometer (SANDNER Messtechnik GmbH, Biebesheim am Rhein, Germany) attached to the cylindrical tensile testing sample. A traverse translation speed of 0.01 mm/s was used. Interrupted tests were carried out by means of relaxation steps that were performed under position control. The relaxation time per load step was 15 min. For each quadrant of the strain PF, 131 individual measurement points were determined. Here, a step size of 7.5° in the range–45° ≤ φ ≤ +45° and a step size of 10° in the range 0° ≤ χ ≤ 90° (cf. Figure 4 and Figure 5 for applied angle denotations) were chosen. Note that all angles in this work are given in degrees. For the state after the final loading, i.e., for the states during unloading from a total strain of 10%, only a tilt of χ could be performed at a constant φ angle of 30°, due to the time constraints of the limited neutron beamtime. This was carried out for the state at a partial unloading to about 350 MPa and for the final unloading state. The evaluation of the measured diffractograms was performed using the software LAMP (Version 8.5) [41]. For this purpose, a separate individual background function was used for each lattice plane. The strain values of the experimental strain PFs were evaluated with a {hkl}- and phase-specific  d 0 h k l , p  value (lattice plane spacing in a strain-free state), which results (with respect to [42]) from the intersection of the lattice plane spacing distributions over χ at the different load levels. Regarding the phase-specific reference values required for strain calculation (cf. Equation (2)), various strategies were proposed (see, e.g., [42]). In our experience, it is extremely difficult, to the point of impossible, to create a reference state for duplex stainless steels that is largely free of phase-specific residual stresses. Through the processing route (at least small amount of) phase-specific residual stresses always occur and must be taken into account, which is due to the differences in the coefficient of thermal expansion (CTE) and the elasto-plastic properties of the contributing ferrite and austenite phases. Hence, the above-referenced way to obtain an orientation-independent  d 0 h k l , p  value is considered to be the most suitable, instead of free-cutting reference samples (e.g., small cubes or pins), since it can be expected that for the material state of interest at least parts of the phase-specific residual stresses will not be released through free cutting.
Thus, for each orientation of the strain PF, a phase- and lattice-plane-specific strain can be calculated according to Equation (2).
ε h k l , p φ , χ = d l o a d h k l , p φ , χ d 0 h k l , p d 0 h k l , p
All neutron diffraction measurements (line positions) were performed on the same sample under the specified orientation ( φ , χ ) and the indicated load level. The in situ samples from the neutron diffraction experiment and the sample from the laboratory experiment that were used to determine the initial texture were clearly marked before the measurements to guarantee that the results could be clearly assigned.
The applied nominal gauge volume defined by radial collimators, with a full width at half maximum (FWHM) of 2 mm, was about 2 × 2 × 2 mm3, and the wavelength was set to 1.645 Å. The cylindrical tensile testing sample had a diameter of 4 mm at the gauge length 38 mm. Care was taken to ensure an accurate sample alignment in the way that the nominal gauge volume (the diagonal space in the above-mentioned cubic nominal gauge volume is about 3.46 mm) stayed always centred and hence inside the cylindrical tensile sample. By these means no corrections due to partially filled gauge volumes must be applied.
The strain PFs resulting from the experiments (and the EPSC modelling) are designed similarly to the back-calculated texture PF from Figure 2. The top view of the sample cross-section is shown in each case. This can be easily understood from Figure 5 in combination with Figure 4. Since a φ range of 90° was determined for each strain PF quadrant, all 4 measurements could be shown in one diagram for better comprehension of their evolution with an increasing load. For this purpose, for each measurement the sample was rotated in total by 90° in the φ direction.

3. Elasto-Plastic Self-Consistent Model

The determination of effective (mechanical) properties is largely accomplished by homogenization methods. In this context, mean field methods, e.g., [43], which take into account the properties of the composite constituents, provide a numerically efficient alternative to full-field methods, which resolve the microstructure completely.
Regarding the self-consistent (SC) method, formulated for elastic material behaviour, e.g., [44,45], each grain is considered to be an elliptical inclusion completely enclosed in a homogeneous medium. This homogeneous equivalent medium (HEM) in turn always has the average properties of all grains of the considered polycrystal. If a strain increment is applied to this homogeneous equivalent medium, an interaction of the HEM with the inclusion under consideration occurs. The resulting stress in the inclusion is compared with the lattice-plane-specific critical resolved shear stresses (CRSS), and, moreover, the number and orientation, as well as the activity, of the potential slip systems is determined.
The elasto-plastic self-consistent (EPSC) method is an extension of the self-consistent method (SC) method to elasto-plastic material behaviour. The EPSC method used in the work at hand is based on the EPSC4 model of Clausen and Tomé [29,46], which in turn is based on previous work by Turner and Tomé [47]. The EPSC4 model has been successfully used in a number of single-phase material descriptions, inter alia [31,32]. This EPSC model, originally written in FORTRAN77, was made available to us for the present project. In the following section, the original EPSC4 model was first translated into the MATLAB programming language and extensively validated. Subsequently, we extended its routine for application to multiphase materials with a high fraction of contributing phases. In this work, those extensions will be discussed in more detail with reference to [48,49,50].
The strain hardening caused by each of the deformation mechanisms considered in the modelling is accounted for by using an extended dislocation density-based strain hardening model according to [51]. This approach has the decisive advantage that the effective lattice-plane-specific (α) and phase ( p )-specific CRSS ( τ c p , α ) are determined by the summation of their individual strain hardening contributions, and thus further strain hardening mechanisms can be added (see Equation (3)).
τ c p , α = τ 0 p , α + τ f o r p , α + τ s u b p , α
In the shown state (lab temperature ≈20 °C), the CRSS is composed of an initial temperature-dependent value  τ 0 p , α  and the dislocation density-dependent contributions  τ f o r p , α  and  τ s u b p , α . The second and third terms represent, in agreement with [51], the work hardening due to dislocation interactions. Hereby,  τ f o r p , α  (the index ´for´ stands for forest dislocations) is only a simplification, according to [51], as it only considers dislocations that are interlocked between dislocations of the same type, i.e., forest dislocations are dislocations in an inactive slip system that penetrate the active slip plane. According to [49], the variable  τ s u b p , α  describes the fraction of the substructures in the hardening. Here, this variable is related to the variable  τ d e b p , α  in [51]. With regard to the dislocation hardening approach, this model forms a much more physically motivated hardening approach than phenomenologically comparable models using pure hardening parameters. As a further deformation mechanism, an approach to describe twinning is implemented in the present EPSC material model. However, metallographic investigations on a comparable duplex steel showed [17] that this is not a preferred deformation mechanism of the f.c.c. austenite phase in the duplex steel under consideration.
When using EPSC methods on two- or multiphase materials with high fractions of contributing phases, the question of the interaction of the two or more phases with each other has to be taken into account. It is known from the literature (e.g., [52,53,54,55,56]) that this should be best implemented by considering the changing stiffnesses due to the interaction of the two phases or the elasto-plastic stiffness modulus.
Here, as a first approach, the SC scheme described by Willis [44] is applied to determine the effective stiffness by means of Equation (4).
C = α = 1 N c α C α I < 4 > + P α C α C 1 β = 1 N c β I < 4 > + P β C β C 1 1
In Equation (4), the effective stiffness tensor of the matrix is symbolised by  C  and  c  is the single crystal stiffness of the considered phase  α , β , taking into account the phase-specific texture. The polarization tensor P is related to the Eshelby tensor  w  by  P = W C 1  [57,58]. I is the unit matrix. N stands for the number of different types of embedded inclusions.
In many cases, the necessary phase-specific input parameters of the EPSC material model can only be taken from literature sources in a limited way. Likewise, the experimental determination of their individual values in cases of multiphase materials is often extremely time-consuming or even simply not feasible. Based on this problem, we decided to determine the required input parameters using an optimisation approach based on {hkl}-specific experimental data. In this context, care was taken to ensure that the possible optimisation range was limited in a way that made physical sense, i.e., the values lie within a plausible value range. The gradient descent method was chosen as the optimisation approach, which was also implemented in our MATLAB code [59]. The resulting phase-specific material parameters, including the different pre-measured phase-specific textures, were used to predict the lattice-plane-specific strains in a load stress test. For the phase-specific initial stiffness, the values specified in Table 2 were used.
Table 3 shows the phase-specific as well as the slip-plane-specific values of the initial CRSS  τ 0 p , α . The values listed in Table 2 and Table 3 are the result of the optimisation calculation. A change in the sample temperature during the simulation was excluded, thus no temperature dependence of  τ 0 p , α  was considered. The {123}<111> slip system was not considered. According to [60], the system is not active at room temperature in the ferritic phase of steels. The underlying phase-specific texture in the EPSC model was read in Bunge notation. A total number of 4958 different orientations were considered. Each orientation represents a separate grain or inclusion problem. For a better illustration, the recalculated PFs, using the open-source toolbox MTEX [40], are shown in Figure 2. For the experimental PFs, the same lattice planes were plotted, which were also determined experimentally.
Table 2. Phase-specific stiffness values used in the EPSC model. Adjusted on the basis of [59].
FerriteAustenite
c 11  (MPa) c 12  (MPa) c 44  (MPa) c 11  (MPa) c 12  (MPa) c 44  (MPa)
Applied230,000135,000114,000227,700143,750140,300
Start values [61]231,000130,000116,000198,000125,000122,000

4. Using the EPSC Model to Describe the Strain Pole Figure Experiment

Figure 6 shows the result of the EPSC modelling with the input parameters (including the phase-specific crystallographic texture) from the strain PFs experiment. Here, the calculated lattice strain in the load direction and one transverse direction above the total strain are presented. From the experiment, three load steps could be used for the comparison of experimental data with EPSC modelling results for the lattice strains in the longitudinal and transverse directions. Again, the comparison indicates that there exists a good agreement between the experimental values and those of the EPSC simulations. Only for the strain in the transverse direction for the ferrite {200} lattice planes can a pronounced divergence be noticed. Here, the effect of strain reversal after the phase-specific yield point is well described qualitatively, but this effect is overestimated in absolute terms. Small deviations between the determined values and the predicted evolution may also be due to initial {hkl}-specific incremental strains as well as phase-specific (micro) residual stresses in the macroscopically stress-free sample. Although the results presented only show a change in strain relative to the initial state, there is always a superposition of phase-specific residual stresses and applied stresses when compared with the simulation. This could affect the phase-specific yield strengths and the overall phase-specific mechanical behaviour and was not considered in the EPSC modelling. In this context, and considering the state of the art of EPSC models, the result shown in Figure 6 can be classified as very good for the time being.
A comparison of the CRSS values given in Table 3 with those given in the literature (see Table 4) shows some significant differences. This applies both to phase-specific CRSS values (as used in this model) and to existing EPSC models based on the so-called “hardening parameters”. This is due to the fact that, nominally, the same duplex steel was used in this experimental work, but from different batches and with possibly differing processing parameters. As a consequence, the exact chemical composition of the phases may differ slightly, as well as their respective phase-specific grain size distribution and phase-specific crystallographic texture. Moreover, it must also be kept in mind that a macroscopic absence of stress in the bulk sample is not the same as the absence of phase-specific (micro)stresses. In addition, for the duplex stainless steel samples used in this work, initial phase-specific stresses due to the manufacturing of the semi-finished material can be assumed, as shown in Figure 7. When using values from simulative studies, it must always be taken into account that the chosen model and its implementation may have an influence on the chosen input parameters, if these have been fitted to experimental data. It should be noted that the model used is not suitable for correctly predicting the {hkl}-specific lattice strains of any duplex steel without an optimisation calculation using a master material data set and the steel’s phase-specific texture.

5. Results and Discussion

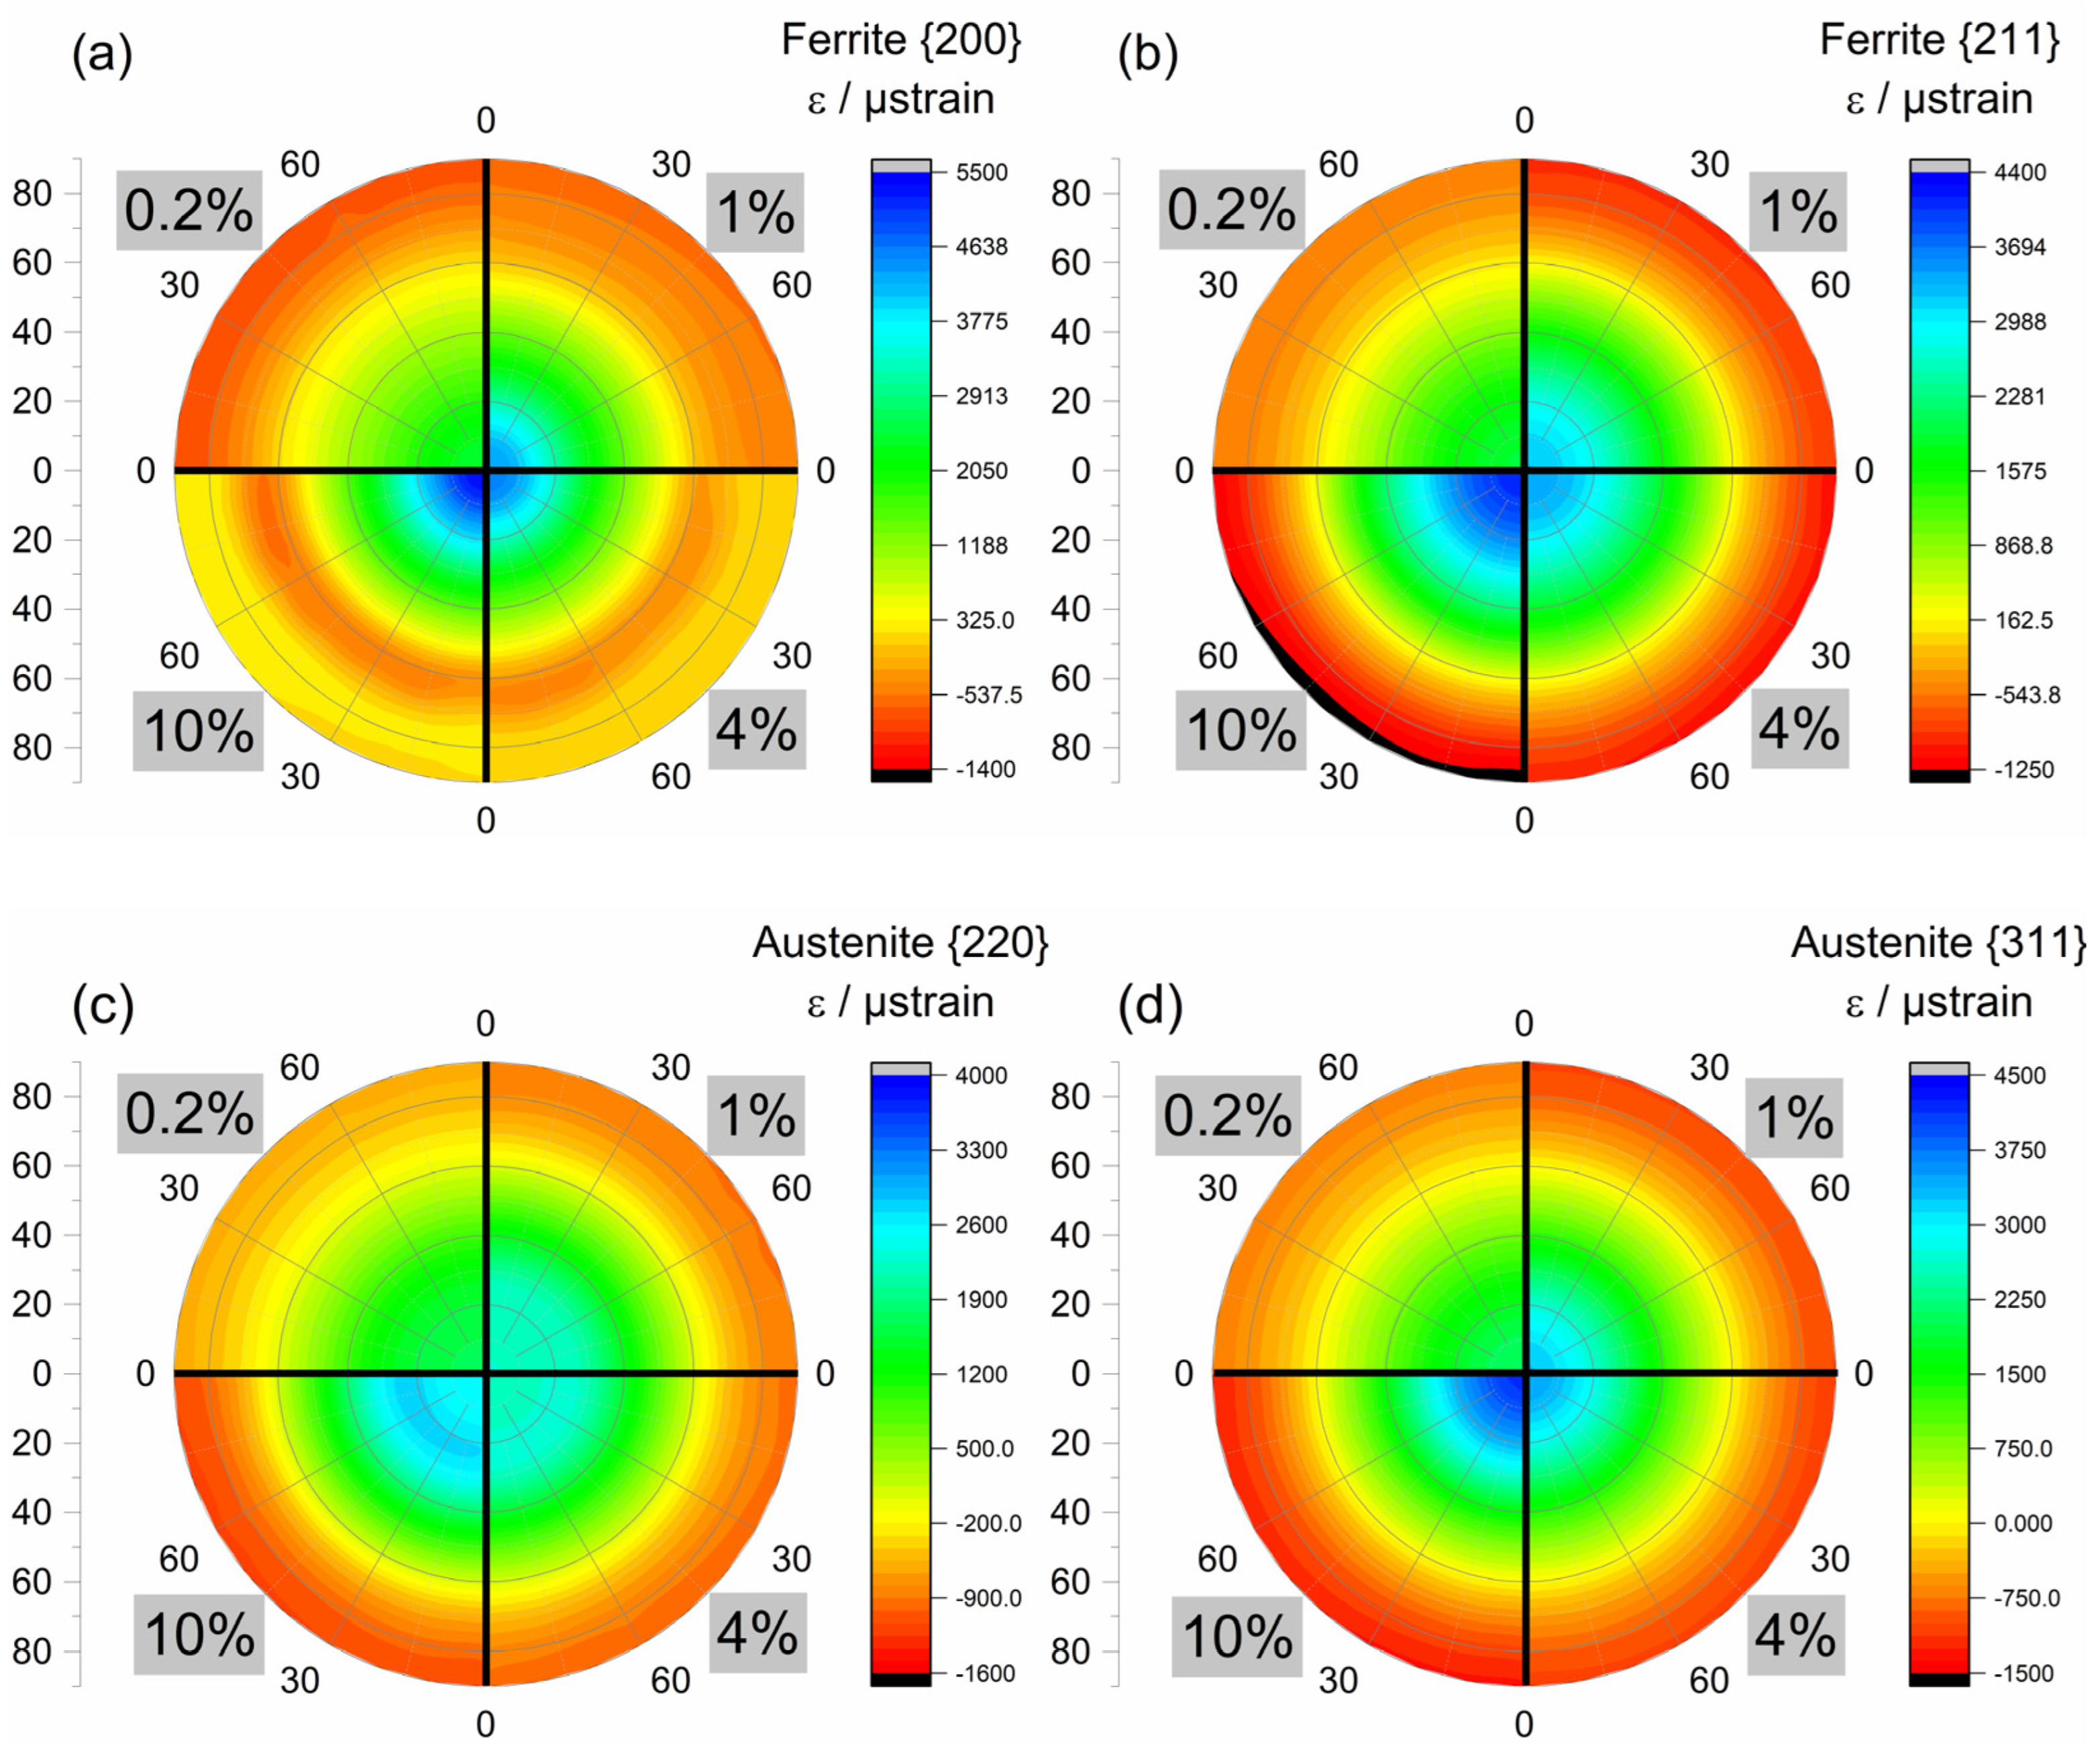
5.1. Experimental Results

At the beginning of the presentation of the results it is once again clearly emphasized that the chosen experimental method is only suitable for determining strain PFs. Hence, no “stress PF” or so-called stress functions could be determined in the present work, which is due to the limitations of the measurement data set available. An approach using stress functions has been described by Behnken, e.g., in [64,65], and an application of stress factors to account for the anisotropy for duplex stainless steels can be found, e.g., in [66]. However, for determining stress functions, e.g., further {hkl} planes must be considered for both phases, as the stress factors only account for elastic anisotropy effects. Due to the limitations of the data set determined by means of neutron diffraction analysis, we focussed on phase-specific strain PFs. Hence, in the present work, the experimentally determined strain distribution ( ε h k l , p φ , χ )  will to be compared and discussed with the phase- and {hkl}-specific strains that were calculated using the presented EPSC model.
Figure 7 shows the experimentally determined strain distributions presented as strain PFs. Here, according to the used convention, the azimuth angle is referred to as φ (rotation around the normal direction) and the tilt angle as χ, with χ = 0° as the sample’s load direction (cf. Figure 4 and Figure 5). In the partial images Figure 7a,b, the strain PFs for the ferrite {200} and {211} lattice planes are presented, respectively. The corresponding lattice strain PFs for the austenite phases are shown in partial images Figure 7c, for the {220} lattice plane, and Figure 7d, for the {311} lattice plane. In each case, the {hkl} plane and phase-specific strain PFs for the initial state and for the mechanically loaded states at total strains of 1%, 4% and 10% are shown in one strain PF, i.e., each quadrant represents the lattice strain PF for one loading state, and all four figures belonging to the same {hkl} lattice plane families are scaled identically. From the colour gradations of the initial state, it can be seen that the nearly load-free sample (only 5 MPa pre-load is used as the initial load to compensate for the backlash of the sample clamping) exhibits a phase- or {hkl}-plane-specific residual stress state. The subsequent load direction of the sample (cf. Figure 4 and Figure 5) is the normal direction in Figure 7 (χ = 0°). From this it can be seen that, for the two lattice planes of the ferrite phase, in their initial state, rather low compressive lattice strains in the longitudinal direction and low tensile lattice strains in the radial direction exist. For the two lattice planes of the austenite phase, on the other hand, tensile lattice strains are present in the later load direction and compressive lattice strains in the radial direction. It should be emphasized that this initial lattice strain distribution is not identical for the two lattice planes of the same phase. For instance, for the ferrite phase, for the {200} lattice plane higher lattice strains are determined than for the {211} lattice plane. On the other hand, the residual lattice strain state initially present is significantly lower for the austenite {220} lattice plane compared with the {311} lattice plane. Under uniaxial mechanical load, the maximum tensile lattice strain always appears in the centre (χ = 0°) of the strain PFs, as expected. In the radial direction, however, compressive lattice strains are always determined. In general, it can be seen that all strain PFs plotted here for the loaded states are axisymmetric, as could be expected from the intensity PFs shown in Figure 2. However, a closer look reveals that, for the {220} lattice plane of the austenite phase, an intermediate maximum forms under the applied load at an angle of about χ = 40°. For the {200} lattice plane of the ferrite phase, the formation of a lattice strain minimum at an angle of approx. χ = 65° can be observed under the applied load. For all four {hkl} lattice plane families considered here, slight variations in lattice strain are also observed along their graphs for the same φ angle. This can be seen particularly well at 4% total strain for the ferrite {200} or the austenite {311} lattice planes at an angle of χ = 90°. As a first approximation, all four lattice planes show an almost linear distribution of the lattice strain vs. the tilt angle χ in their initial state, according to Figure 7. Overall, the strain PFs in Figure 7 do not show any strain distributions under load that deviate from the expected conical shape. This can be expected from their rather homogeneous texture characteristics (cf. Figure 2); hence, much larger inhomogeneities would be expected for deviating textures, with a lower symmetry with regard to the angle φ.
The calculation of a global phase-specific strain based on the {hkl}-specific results, e.g., according to [67], was deliberately not carried out. This would have required further assumptions and/or additional lattice planes of type {hkl} (which were not analysed herein). An experimentally determined phase-specific stress could then have been derived from these. It should be noted that this stress distribution is influenced by the local phase content, the phase-specific texture and the phase-specific mechanical properties [17]. Furthermore, it must be expected that for the present microstructure the influence of the grain morphology will also affect the results [9,68]. As a consequence, it must be concluded that nominally identical duplex stainless steels can exhibit different mechanical behaviours if, for example, they are taken from different batches of the material. However, based on Figure 6, it can already be estimated that in the present case the phase-specific strains in the ferrite phase are higher than those in the austenite phase. This would be consistent with the investigations on the same duplex stainless steel in [17].
For the example of the austenite {220} reflections, the data were also plotted in Figure 8 vs.  s i n 2 ψ  (corresponding to  s i n 2 ( χ 90 ) —cf. Figure 4 and Figure 5), which has practical relevance and is much better suited to indicate changes by means of non-linearities due to anisotropy effects. Moreover, the uniform scaling of all quadrants was abolished in order to emphasize local inhomogeneities more strongly. A closer look at the results, for instance, reveals that at  s i n 2 ψ = 0.6 a noticeable inhomogeneity in the distribution can already be seen in the initial state. At φ = 70°, an elastic strain of around 140 µstrains is determined, but this is only about 67 µstrains at the angle φ = 20°. However, under an applied load, the location of these inhomogeneities shift somewhat, e.g., to  s i n 2 ψ ≈ 0.7, which is clearly recognizable in the strain PFs determined at a total strain of 1 and 4%. In that region, the divergence becomes much larger and is around 200 µstrain. Although the strain PF represents the entirety of the results over the orientation space, a section of the strain PF is much more appropriate to assess the results in regard to anisotropy effects. These sections (lattice strain vs.  s i n 2 ψ ) are shown in Figures 11–14.

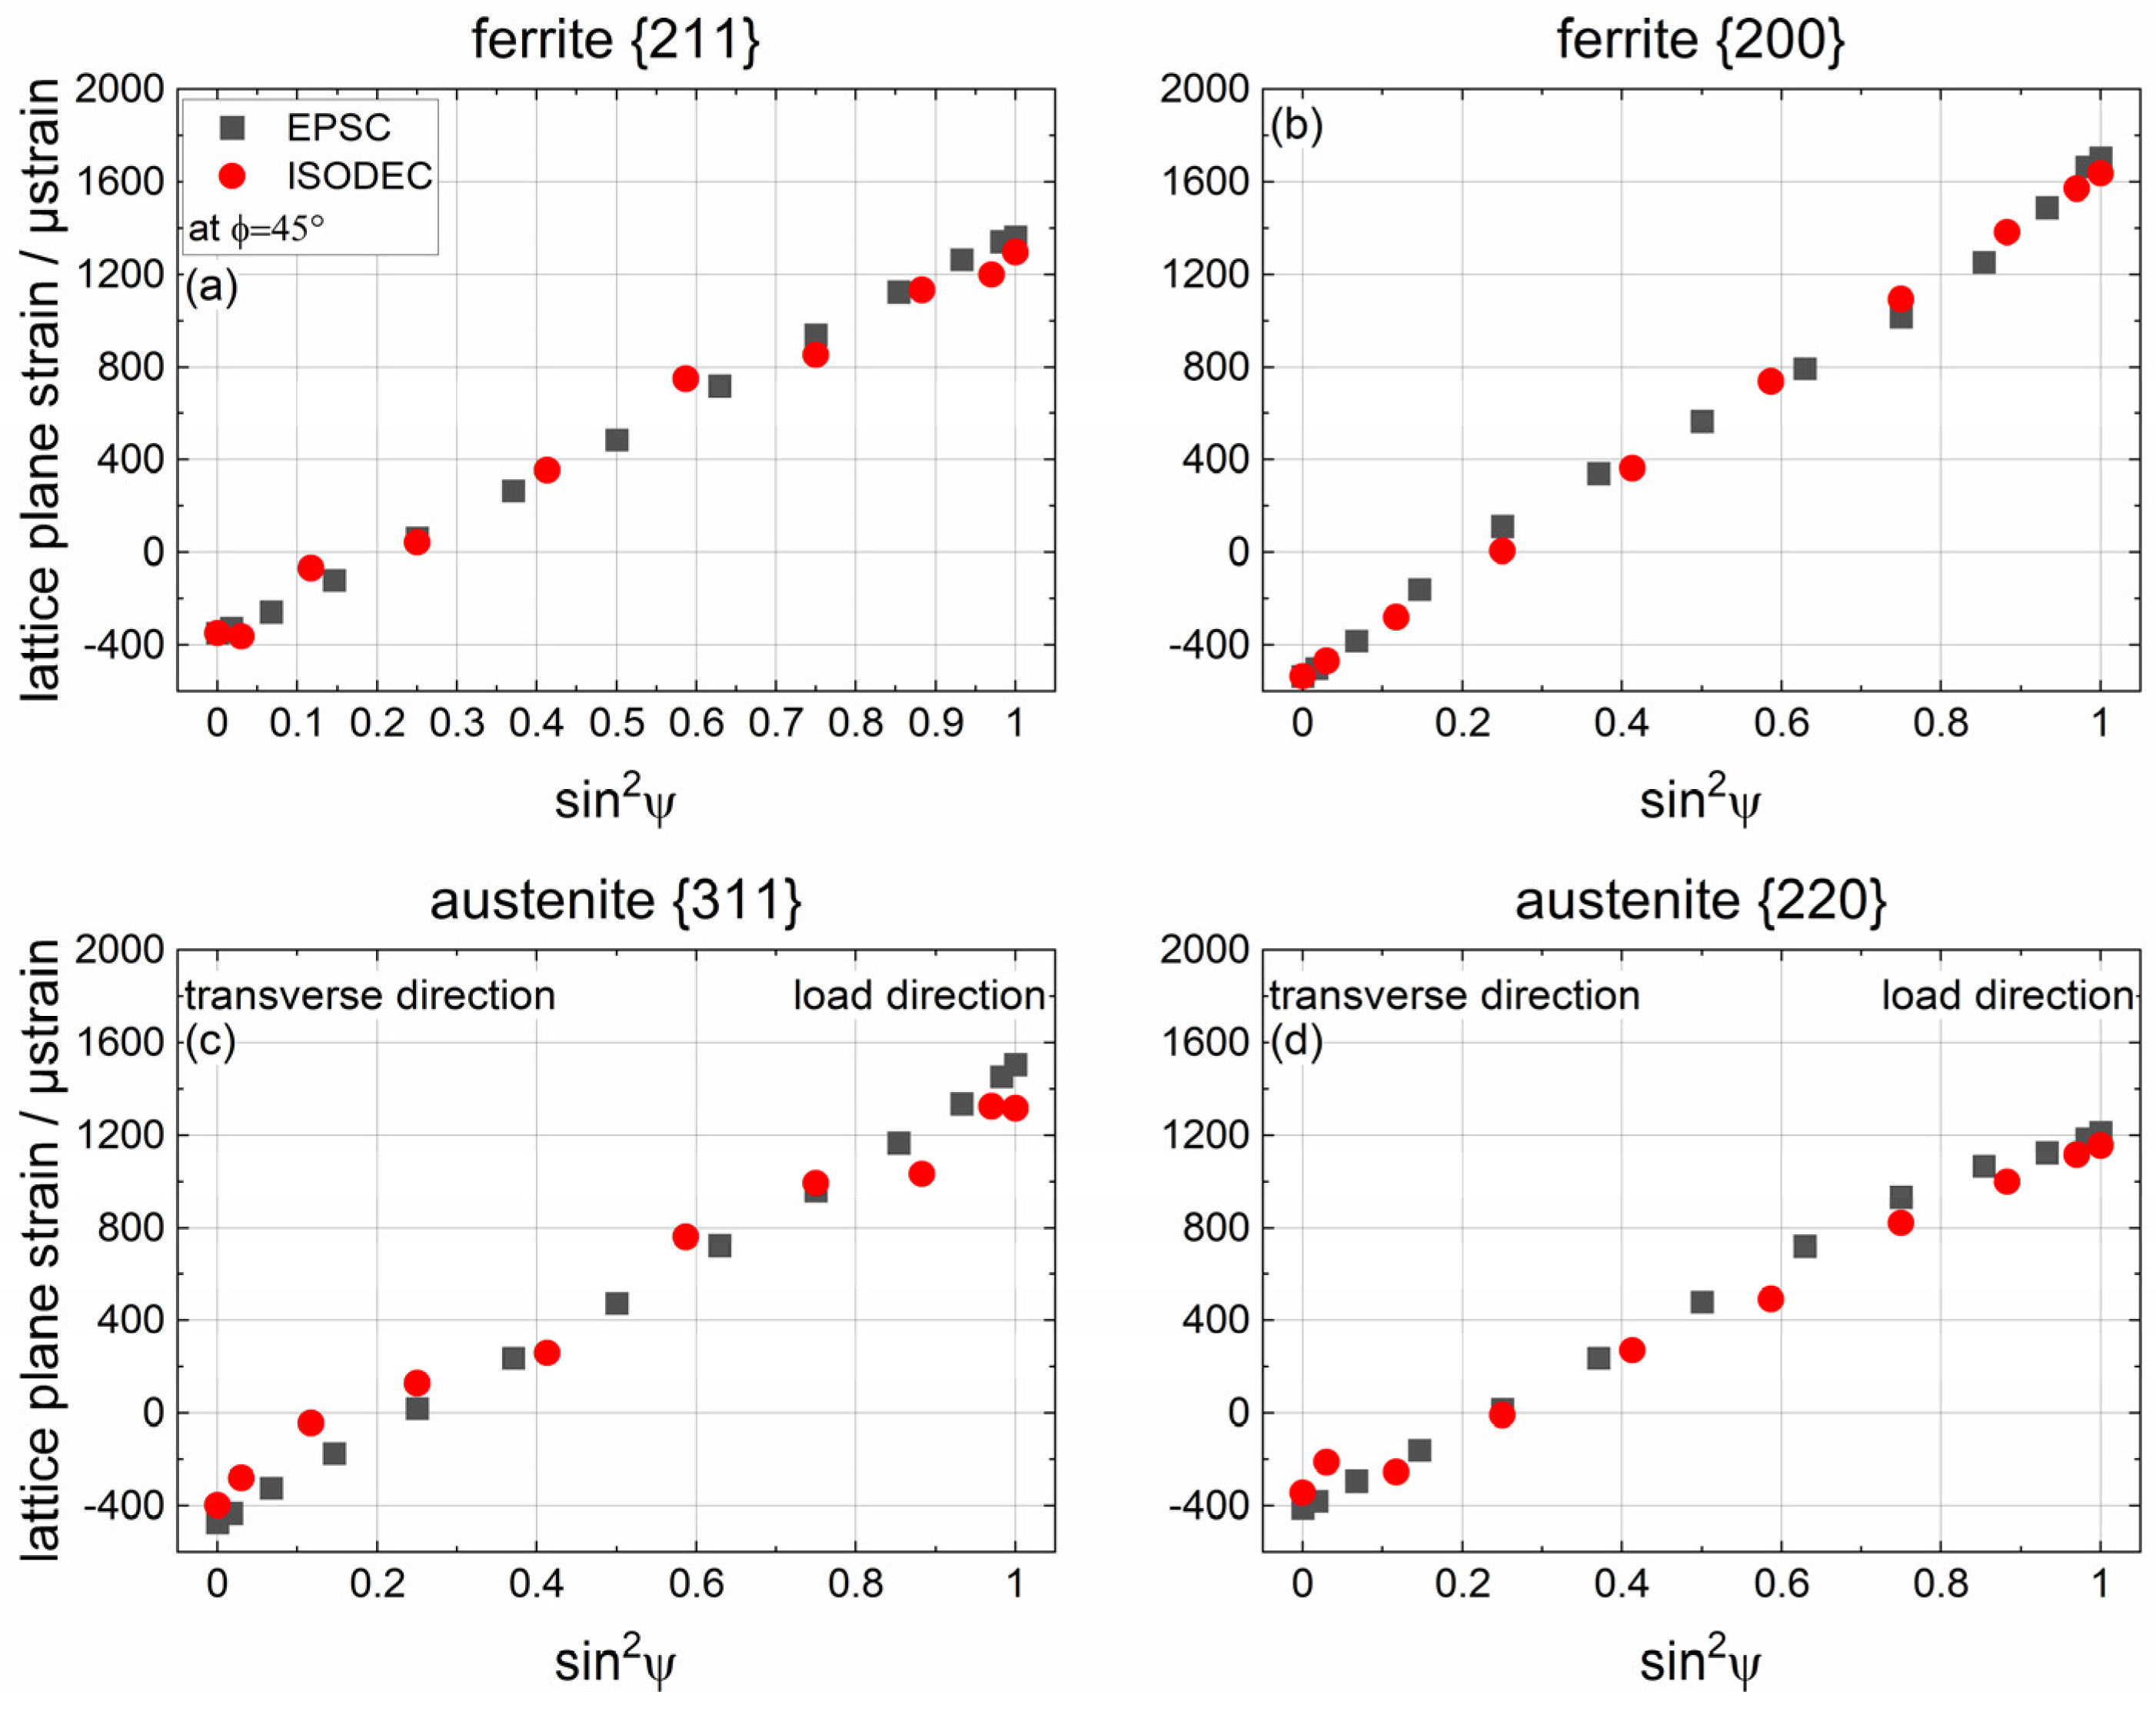
5.2. Validation of EPSC Modelling—Elastic Material Behaviour

Before discussing the results of the EPSC modelling in more detail, validation was carried out. For this purpose, an elastic load case was simulated. This simulation was carried out firstly using the EPSC model presented, but also using the long-established ISODEC software [69,70]. This software provides reliable lattice strain predictions in the purely elastic range for single-phase materials, taking into account their phase-specific texture [69]. For the ISODEC simulations, the same stiffnesses [see Table 2] and phase-specific textures [see Figure 2] were applied as for the EPSC model.
The results for a section at φ = 45° and an assumed unidirectional loading stress of 300 MPa are shown in Figure 9. In Figure 9a,b are the ferrite phase lattice planes {211} and {200}, respectively. In both cases there is very good agreement between the predictions of the EPSC model and the software ISODEC. In Figure 9c,d, the results for the austenite phase lattice planes {311} and {220} are shown. Likewise, for the austenite phase a rather good agreement can be noticed, although there are slightly larger deviations between the two numerical approaches. This is shown by the fact that the ISODEC prediction tends to predict slightly lower lattice plane strains than the EPSC model, and this deviation is slightly more pronounced for the {311} lattice plane than for the {220} lattice plane. The {311} lattice plane of austenite has the largest deviation of about 188 µstrain in the loading direction. Despite this deviation, there is a good agreement based on the data shown in Figure 9, i.e., the EPSC model can be considered suitable for predicting {hkl}-specific lattice strains.

5.3. Results of EPSC Modelling—Elasto-Plastic Material Behaviour

Figure 10 shows the strain PF simulated by means of the multiphase EPSC approach. The results are presented in the same way as the experimental data (cf. Figure 6), i.e., for direct comparison the same {hkl} lattice planes are also considered. Since the lattice strain evolution is always considered in the modelling, i.e., initially the lattice strains are zero, the lattice strain distribution was added at a simulated total strain of 0.2% ( ε t o t  = 0.002), which is slightly below the macroscopic yield point. Qualitatively, the calculated strain PFs are very similar to those determined experimentally (cf. Figure 7). However, there are minor deviations with regard to the absolute value of the lattice strains that were finally determined. Depending on the {hkl} lattice planes, there may be either a slight over- or underestimation of the lattice strains. In Figure 7a, it can be noticed that the intermediate minimum under a tilt angle of about χ = 60° is only pronounced in the elasto-plastic regime, and even at a total applied strain of 1% for data presentation with identical scaling no extraordinary changes can be observed. The most significant deviation is shown in Figure 7c. Here, for the lattice strain of the austenite {220} lattice plane at a total applied strain of 10%, an intermediate maximum at an angle χ ≈ 22° can be noticed. The absence of initial strains or stresses also results in the fact that the lowest applied total strain shown in Figure 10 is 0.2%, i.e., shortly before the phase-specific yield strength is reached.

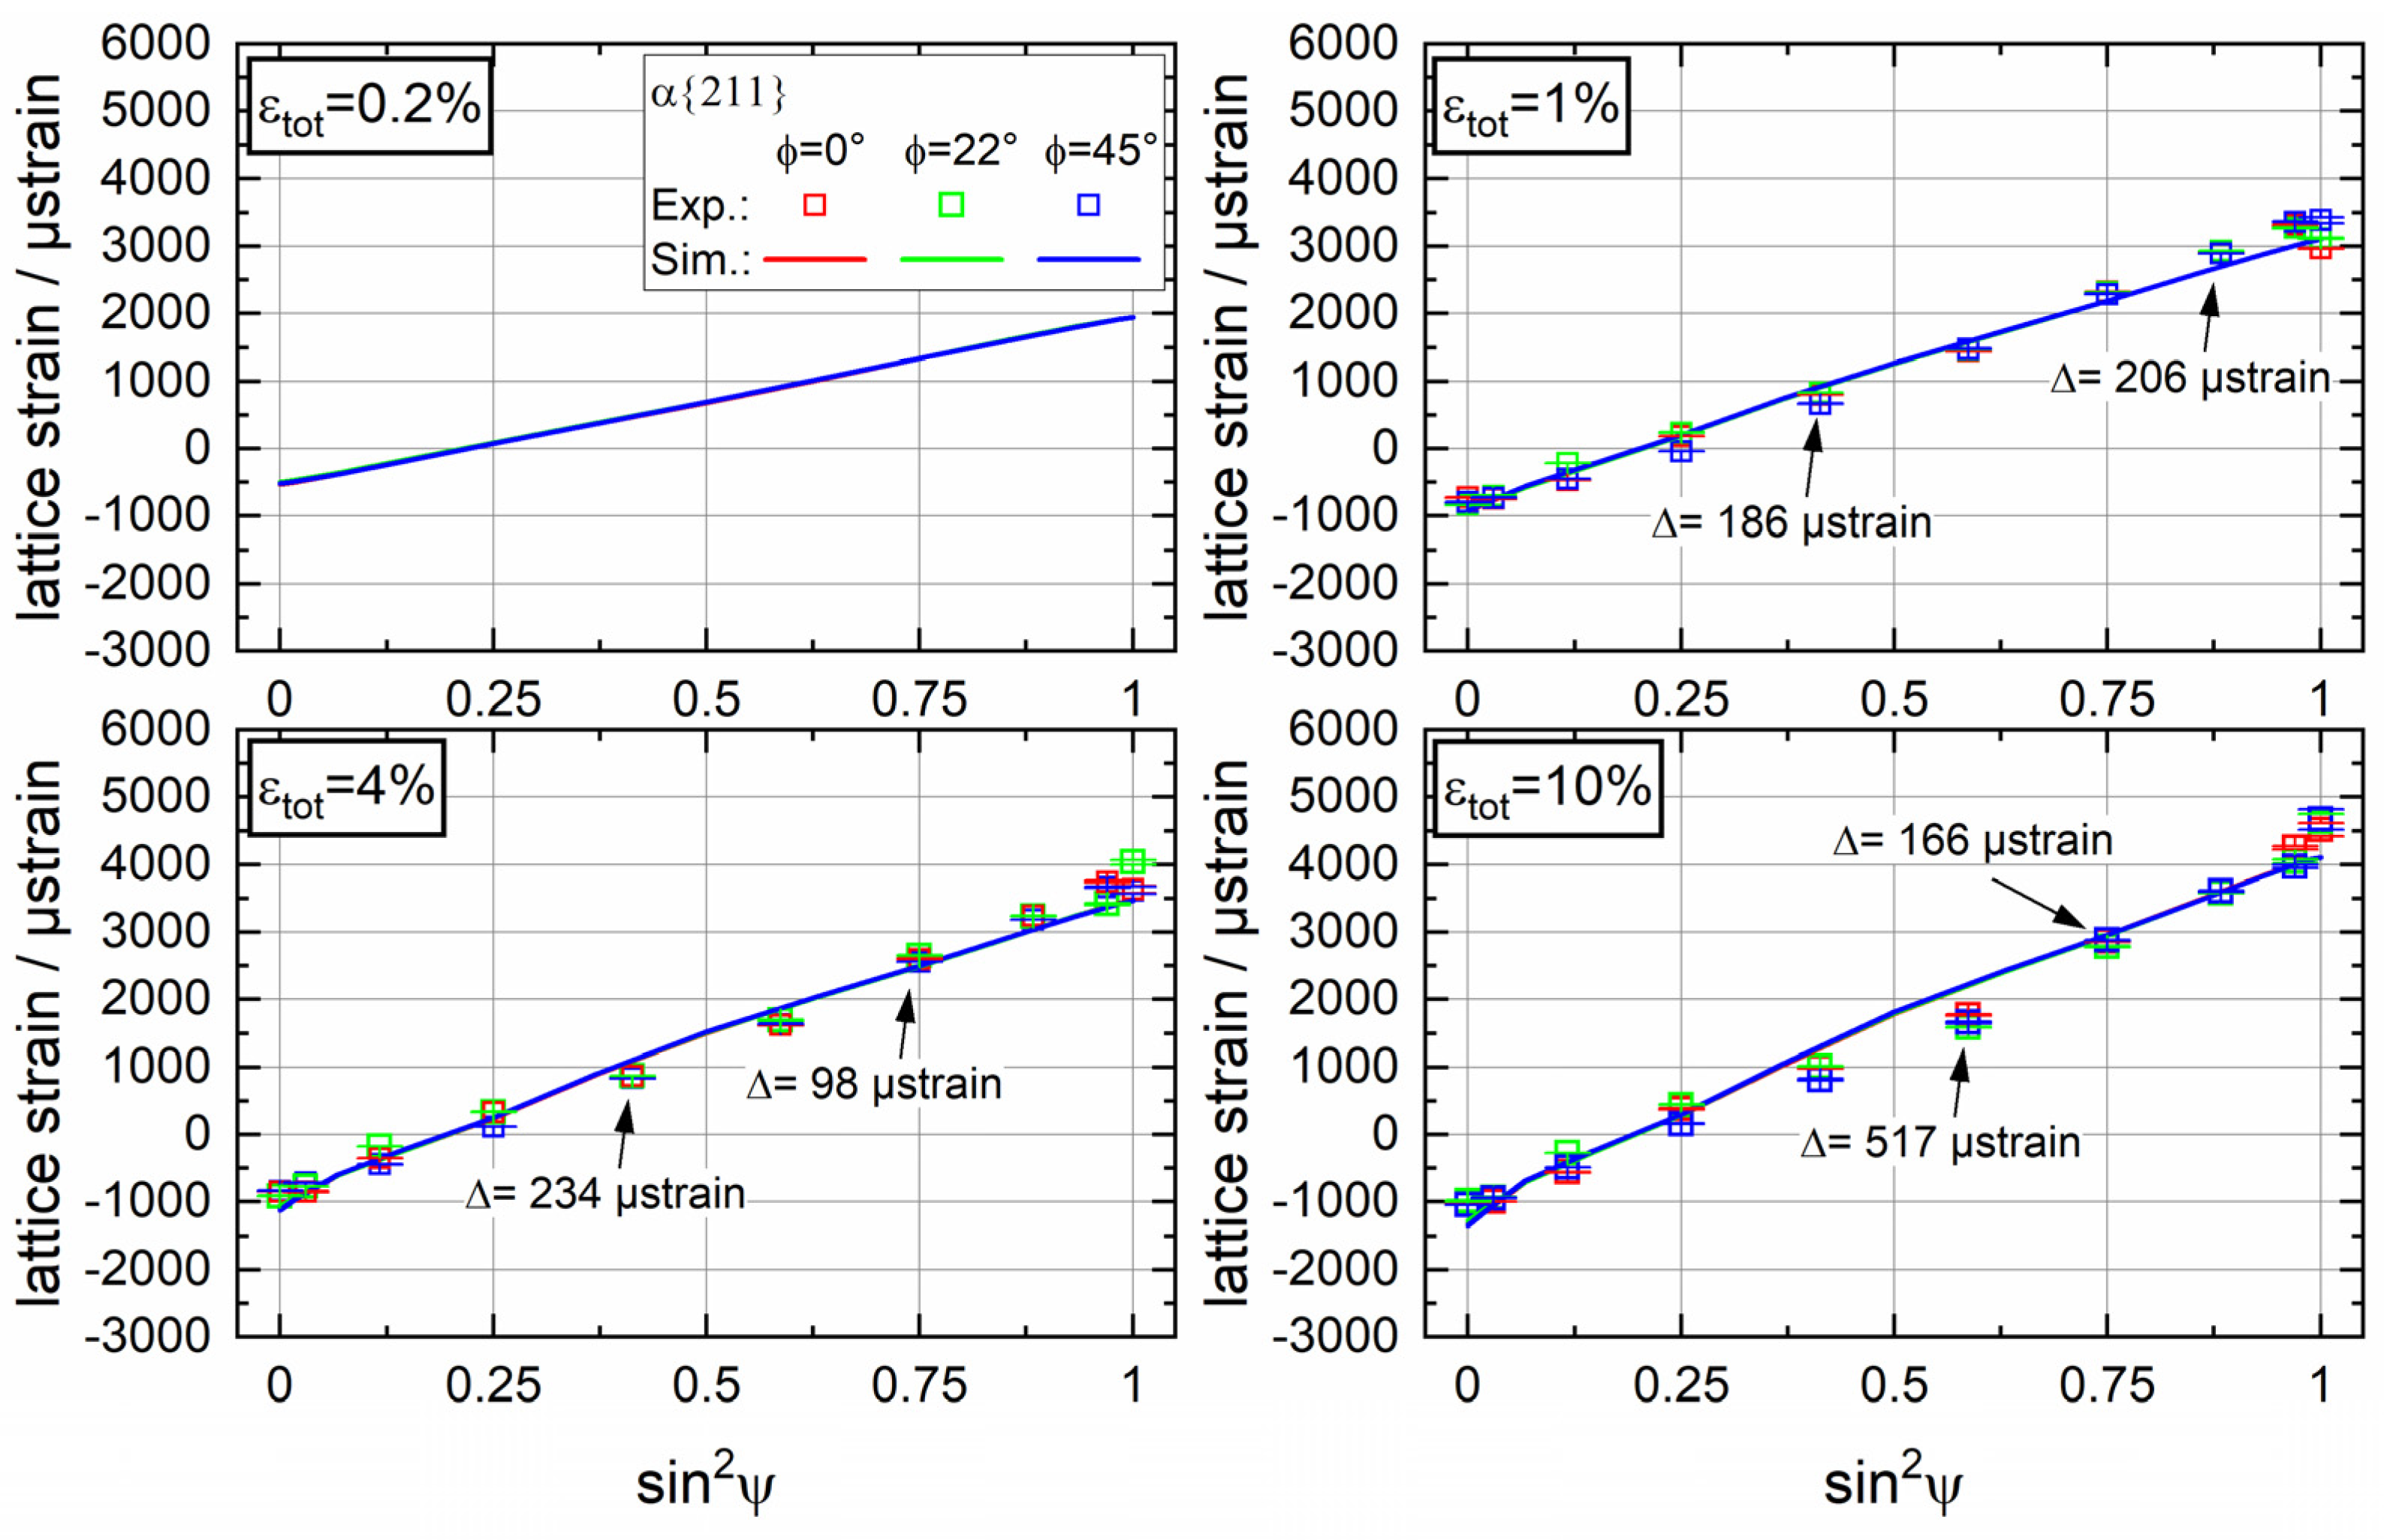
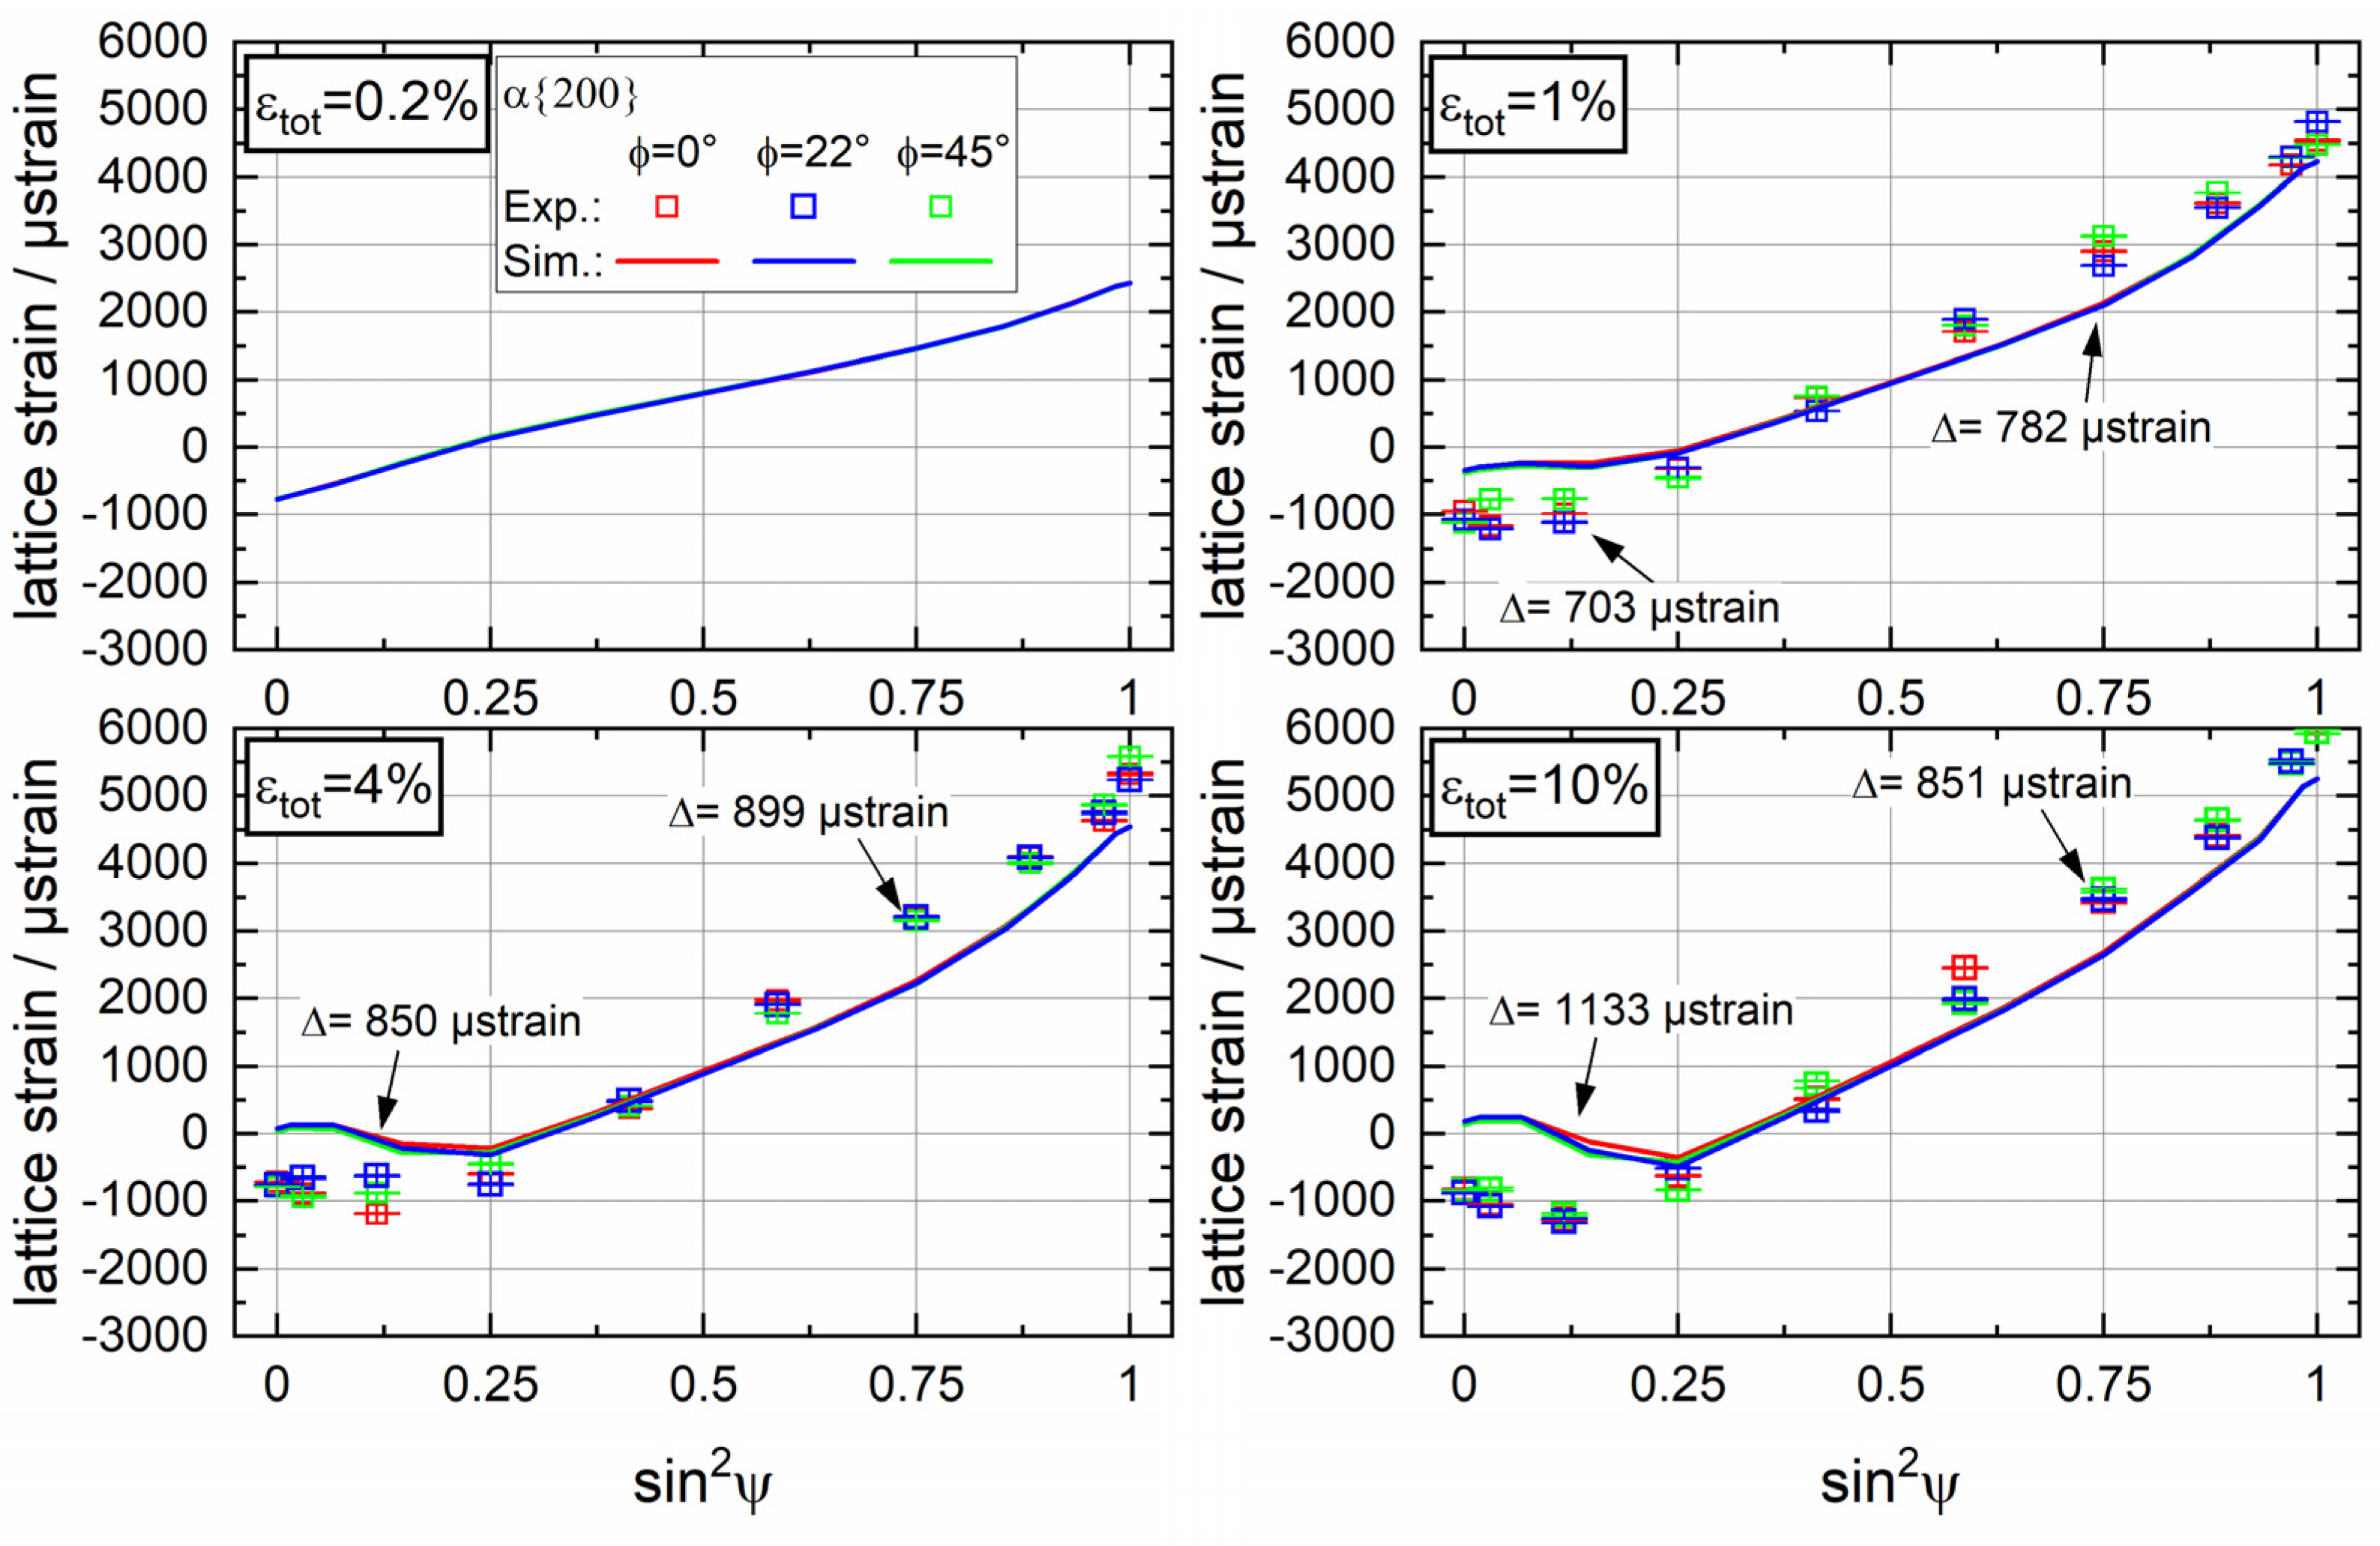
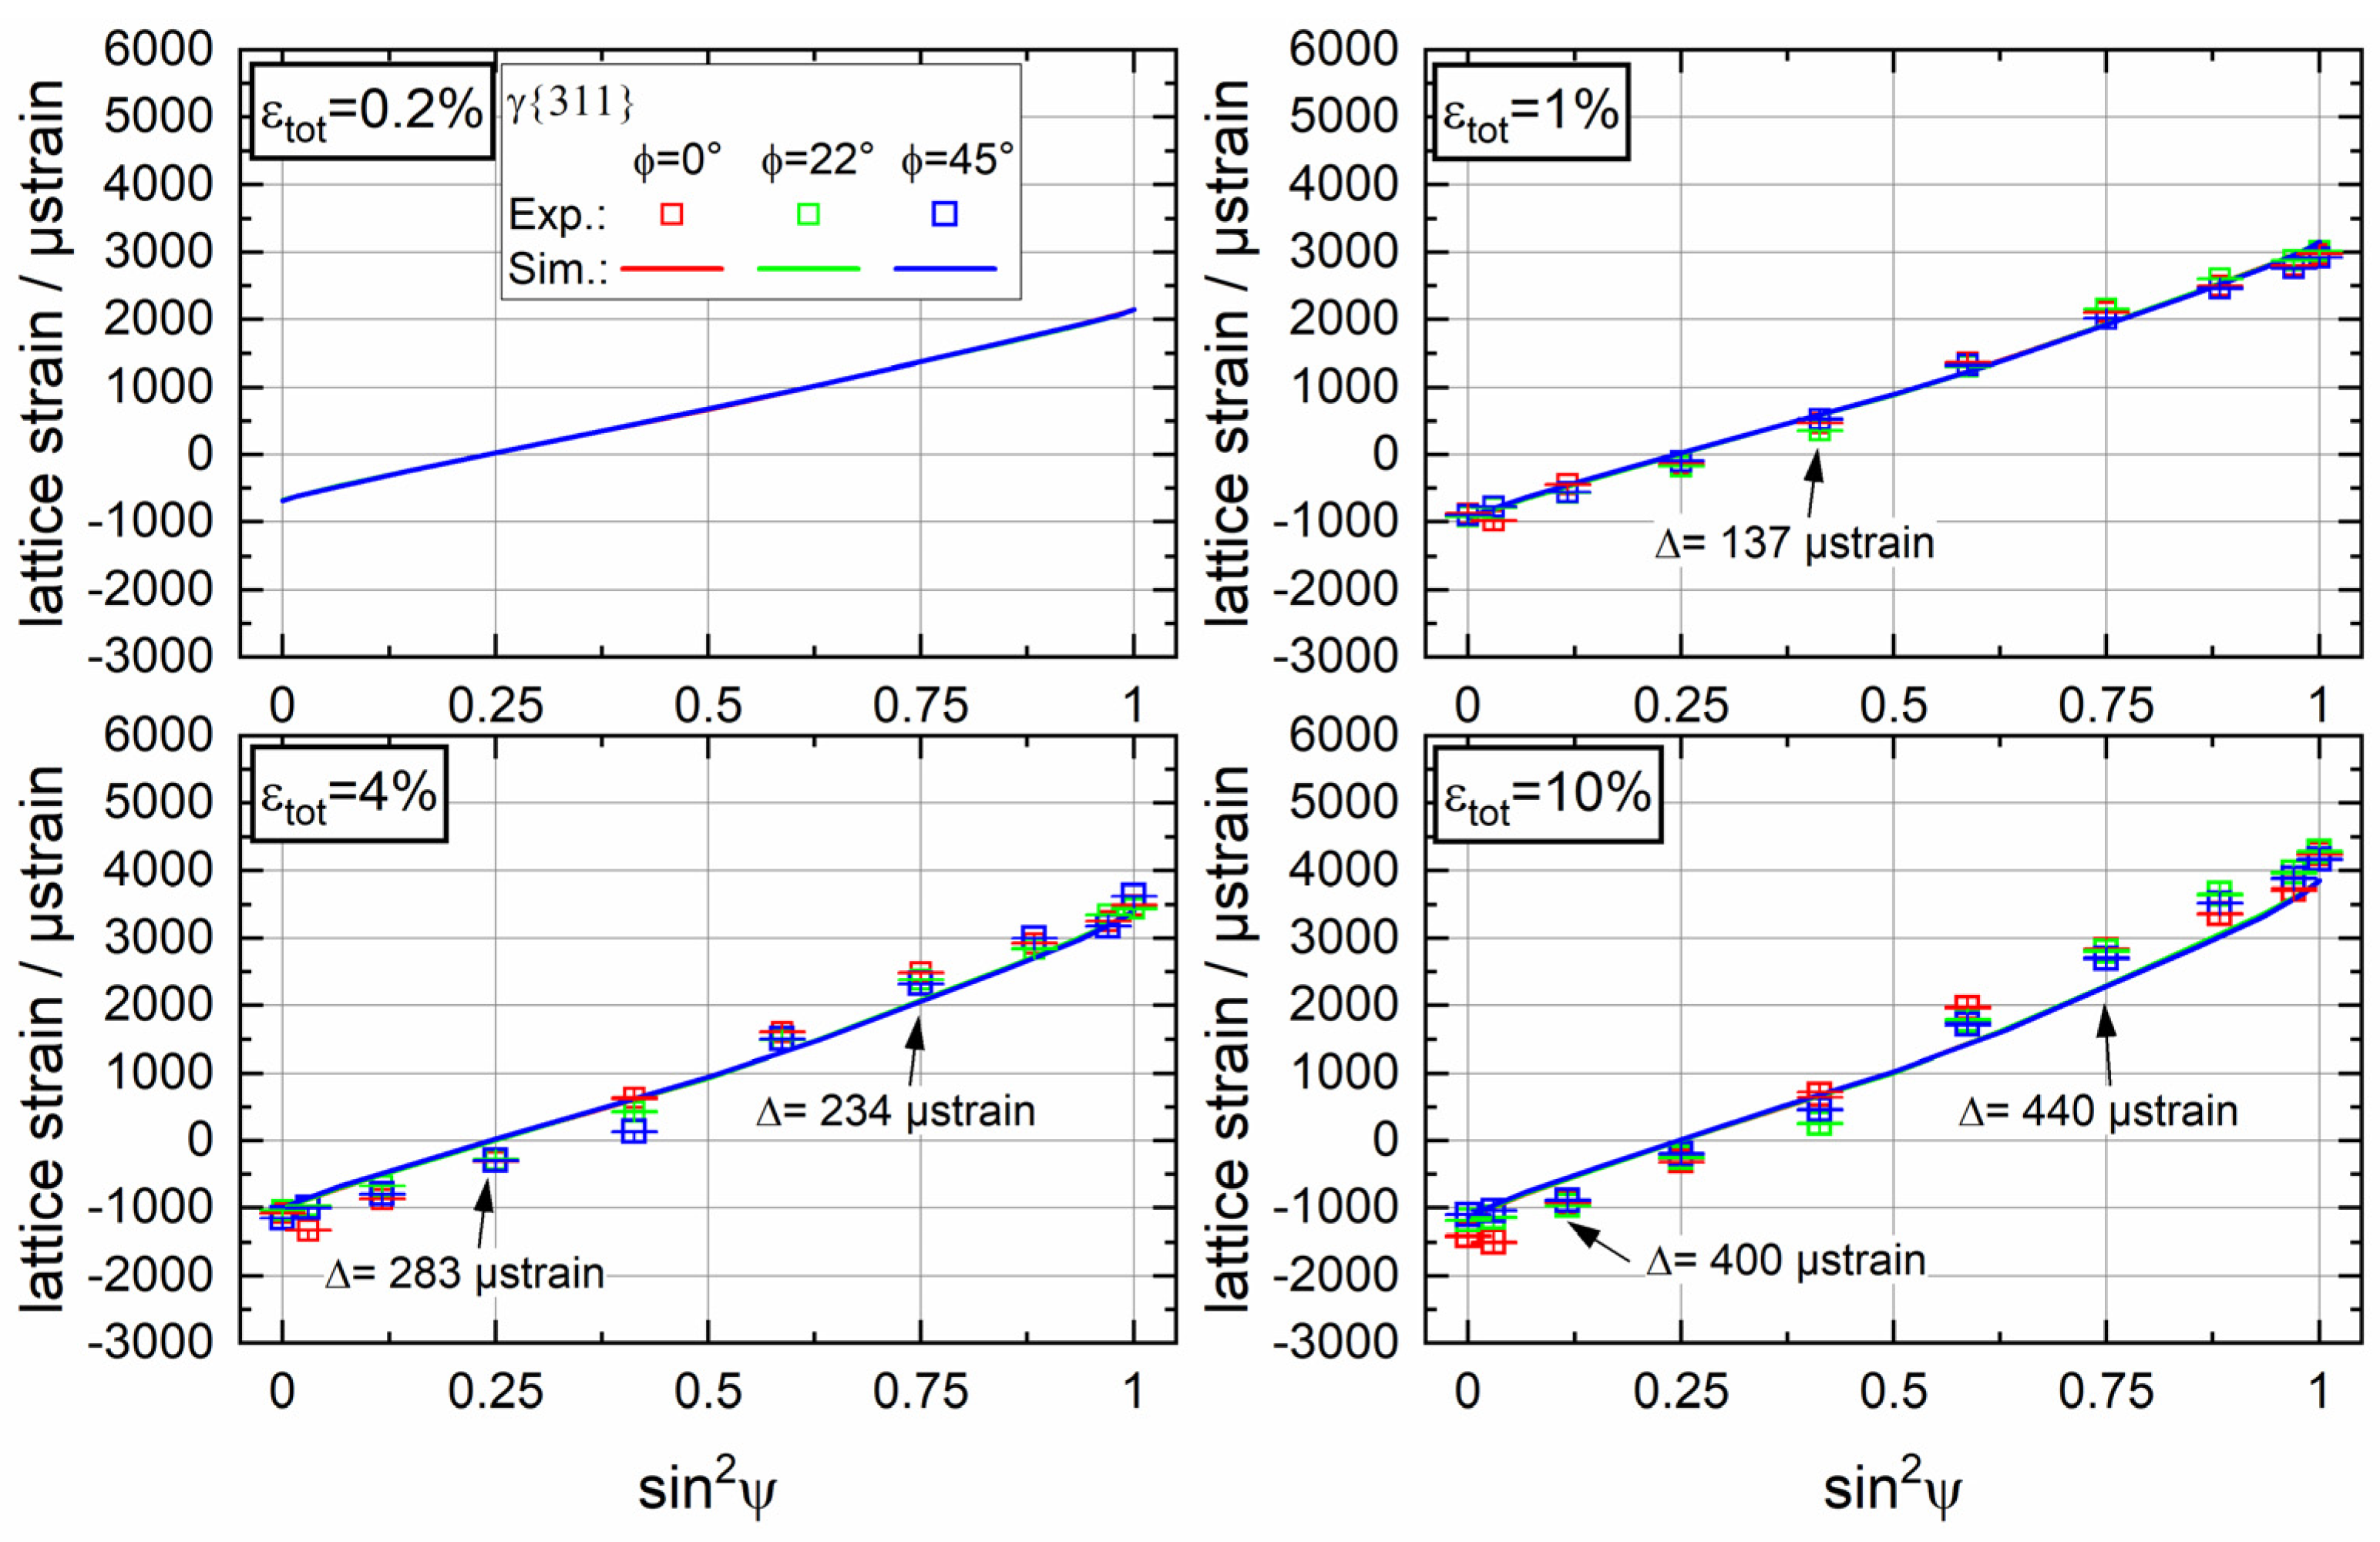
5.4. Comparison of Numerical and Experimental Results

For the comparison of the results of the EPSC modelling and the experiment, lattice strain vs.  s i n 2 ψ  plots were chosen. As stated before, the occurrence of anisotropy effects leads to a curvature of the distribution that is strongly linear for isotropic material states, with no steep gradients of the stress states in the gauge volume, and for sufficiently fine-grained microstructures. The question is whether the EPSC modelling is capable of predicting curvatures or oscillating courses of lattice strain vs.  s i n 2 ψ  distributions due to anisotropy. Conversely, one could also ask whether the EPSC models would be suitable for meaningful residual stress evaluations in the presence of curved or oscillating distributions. Hereby, a direct comparison of the results from the neutron diffraction experiments with the simulation for the purely elastic state is not possible, since the first neutronographic measurements under load were made for a total strain of 1% and were hence already in the elasto-plastic regime. The first assumption is that, in the elastic stress range, a linear relationship between the predicted lattice strain and the corresponding  s i n 2 ψ  (with  ψ = χ 90 ) value exists. In general, the preciseness of the EPSC model in this region could be validated by comparison with the ISODEC predictions, as shown in Figure 9.
In the case of unidirectional loading above the macroscopic yield point, elasto-plastic deformation will occur in at least one of the phases involved. When the macroscopic yield point is significantly exceeded, plastic deformation occurs in both phases. In the present simulation, slipping at the <111>{110} system started in the austenite phase at a loading stress of about 465 MPa ( ε t o t  = 0.22%) and slightly later in the ferrite phase; at a stress of about 533 MPa ( ε t o t  = 0.26%) in the {112}<111> slip system and even later at a load stress of about 566 MPa ( ε t o t  = 0.29%) in the {110}<111> slip system.
For the experimental data plotted vs.  s i n 2 ψ  (corresponding to  s i n 2 ( χ 90 ) ), it can be clearly seen that there are only small variations over the angle of rotation  φ . This can be understood with reference to Figure 2, where the intensity PFs indicate an almost concentric, homogeneous distribution of intensities, i.e., only a very small variation in orientation density for a chosen angle χ for different  φ  orientations. These small variations do not cause significant deviations between the experimental and modelled results at a constant χ and variable  φ . Despite this observation, three angles  φ  are chosen in order to prove this accordingly, i.e., the results are plotted for φ = 0, 22 and 45°.
For the lattice strain vs.  s i n 2 ψ  distribution plotted in Figure 11 for the {211} ferrite lattice planes a slightly oscillating curve is determined. Moreover, the slope increases with increasing strain, as expected. The results of the EPSC modelling for the {211} ferrite lattice planes show a slight non-linearity that becomes more pronounced with increasing plastic deformation. In total, the overall agreement between the experiment and simulation is rather good, while the deviations increase with increasing loads. Here, the curvature of the distribution around  s i n 2 ψ = 0.5  observed for the neutron diffraction data cannot be sufficiently well predicted by means of the applied EPSC model. The increasingly deviant behaviour with increasing plastic deformation is due to the fact that the model obviously does not describe the plasticity effect and the underlying deformation mechanisms sufficiently well, as, for instance, the Hall–Petch effect to describe grain boundary hardening is not yet included. Moreover, a further source of the deviations may be the chosen input parameters, which are based on our search algorithm. Finally, the experimental data has shown that, in the initial case, phase-specific residual stresses exist, which were not considered in the EPSC modelling. Apart from these apparent insufficiencies, the model predictions for the {211} ferrite lattice planes were rather good up to large strains, and larger deviations occurred for the further lattice planes considered here.
For the {200} lattice plane of the b.c.c ferrite phase, the corresponding results are presented in Figure 12. The lattice plane strain vs.  s i n 2 ψ  distributions for the {200} lattice plane exhibit a strong curvature due to elastic and plastic anisotropy. Qualitatively, the associated EPSC modelling predicts this curvature rather well. However, a detailed examination of the values shows clear deviations. The larger deviation in contrast to the results for the {211} lattice plane is due to the fact that the ferrite {200} lattice plane is much more sensitive to plastic anisotropy [12,13,18,59].
In Figure 13, the lattice strain vs.  s i n 2 ψ  plots for the austenite {220} lattice plane are presented. The results indicate that over a wide range there is a good agreement between the numerical simulation and the experiment. Regardless of the rather high scatter of the results, clear differences only occur in the vicinity of the load direction, i.e., close to  s i n 2 ψ  = 1.
For the load case ‘4% total strain’ a further EPSC simulation was performed by omitting the crystallographic texture of the phases (designated as the ‘uniform texture’), with the intention to illustrate the effect of texture on the results and to underline the requirement to consider the phase-specific texture information in the EPSC model. Without texture an almost linear path for lattice strain vs.  s i n 2 ψ  was determined, which is far from the experimentally determined values. Hence, only by adding the experimentally determined phase-specific texture can the present curved distribution be approximated at all. However, this statement should not obscure the fact that deviations between the experimentally determined results and the data from EPSC modelling occur for the austenite phase.
Finally, the corresponding results for the austenite {311} lattice plane are presented in Figure 14. The lattice strain vs.  s i n 2 ψ  plots indicate that there is rather good agreement between the experimental and simulated results. In general, the non-linearities of the plotted  s i n 2 ψ  distributions are rather moderate, which is expected since the {311} plane of the f.c.c. lattice structures is considered, in the literature, e.g., [12,15], to be rather insensitive to plastic anisotropy effects, which furthermore leads to the recommendation of using the {311} plane of f.c.c. for residual stress measurements. This also applies to the {211} lattice plane in the b.c.c. ferrite phase.
Hence, based on the data presentation in Figure 11, Figure 12, Figure 13 and Figure 14 it has been clearly demonstrated that the possible anisotropy effects of the four lattice planes examined are easier to identify in the  s i n 2 ψ  plots, although the strain PF with its colour coding also contains this information.
In summary, from Figure 11, Figure 12, Figure 13 and Figure 14 it can be seen that the EPSC model described is generally suitable for describing and predicting lattice strains for rather large elasto-plastic deformations, up to 10% in case of textured duplex stainless steel, i.e., a two-phase material with large amount of its second phase (around 50% austenite: 50% ferrite), when the phase-specific texture (as an ODF) is used as input data for the model. A comparison of the experimentally determined results and the results from the EPSC modelling generally show good qualitative agreement. Upon closer inspection, the curvature of the distributions becomes more pronounced with increasing plastic deformation, which is due to plastic anisotropy (intergranular strains). Here, the model has obvious deficiencies in describing the plastic anisotropy effect. But the deviating behaviour strongly depends on the {hkl} lattice plane of interest. For the b.c.c. {211} lattice plane and f.c.c. {311} lattice plane, which are both recommended for residual stress analysis using diffraction methods, their insensitivity to intergranular strain effects was confirmed. Despite the discrepancies between the simulation and experiment, the fully simulated strain PF was shown to be a viable tool for assessing the influence of crystallographic textures and/or intergranular strains on the results of an experimental residual stress analysis of real engineering components.
A further improvement of the predictive quality of the used EPSC model can certainly be achieved by including a more comprehensive description of the plastic deformation mechanisms. The model is limited to dislocation strengthening and, if applicable, twinning. However, further strengthening mechanisms are not included so far. Including grain boundary strengthening (Hall–Petch relation) is the subject of our current efforts.
At this point, it must be emphasized that the assessment of the predictive quality of the model is only possible though a relatively large database of diffraction data in the form of strain PFs. For neutronographic (residual) stress analysis, lattice strain is usually analysed only in the assumed principal directions. This assumption can of course be wrong and, furthermore, the knowledge about the previously shown non-linearities caused by plastic anisotropy effects are not accessible, while considering anisotropy effects on the basis of ODF data, for instance, through the application of the well-established ISODEC software package, appears not sufficient. By these means, plastic anisotropy effects cannot be considered or assessed. An improvement can be achieved through EPSC modelling based on metal physical basics. However, the investigations have shown that thorough material characterization is needed to provide meaningful input data. This is elaborate, especially in the case of multiphase materials, and unfortunately this can also depend on the respective material batch (e.g. on variations in phase-specific crystallographic texture or phase- and lattice-plane-specific material values such as crss  τ x p , α ).

6. Conclusions

In the present work, neutronographic diffraction strain analyses were carried out on the duplex stainless steel X2CrNiMoN22-5-3, as a model material for multiphase materials in which the second phase has a high volume fraction, up to large total strain of 10%. The rod-shaped semi-finished product exhibits a rather pronounced phase-specific crystallographic texture due to the rolling process in both its austenite and ferrite phases. In an interrupted test run, strain PFs were recorded for different total strains of 0.2, 1, 4 and 10%. From the strain PFs, lattice strain vs.  s i n 2 ψ  distributions were derived for the ferrite {211} and {200} lattice planes and for the austenite {220} and {311} lattice planes for the assessment of the effect of plastic anisotropy (intergranular strains). These experimental investigations were accompanied by an EPSC model, which was extended to represent multiphase materials.
From these extensive and systematic investigations, the following conclusions can be drawn:
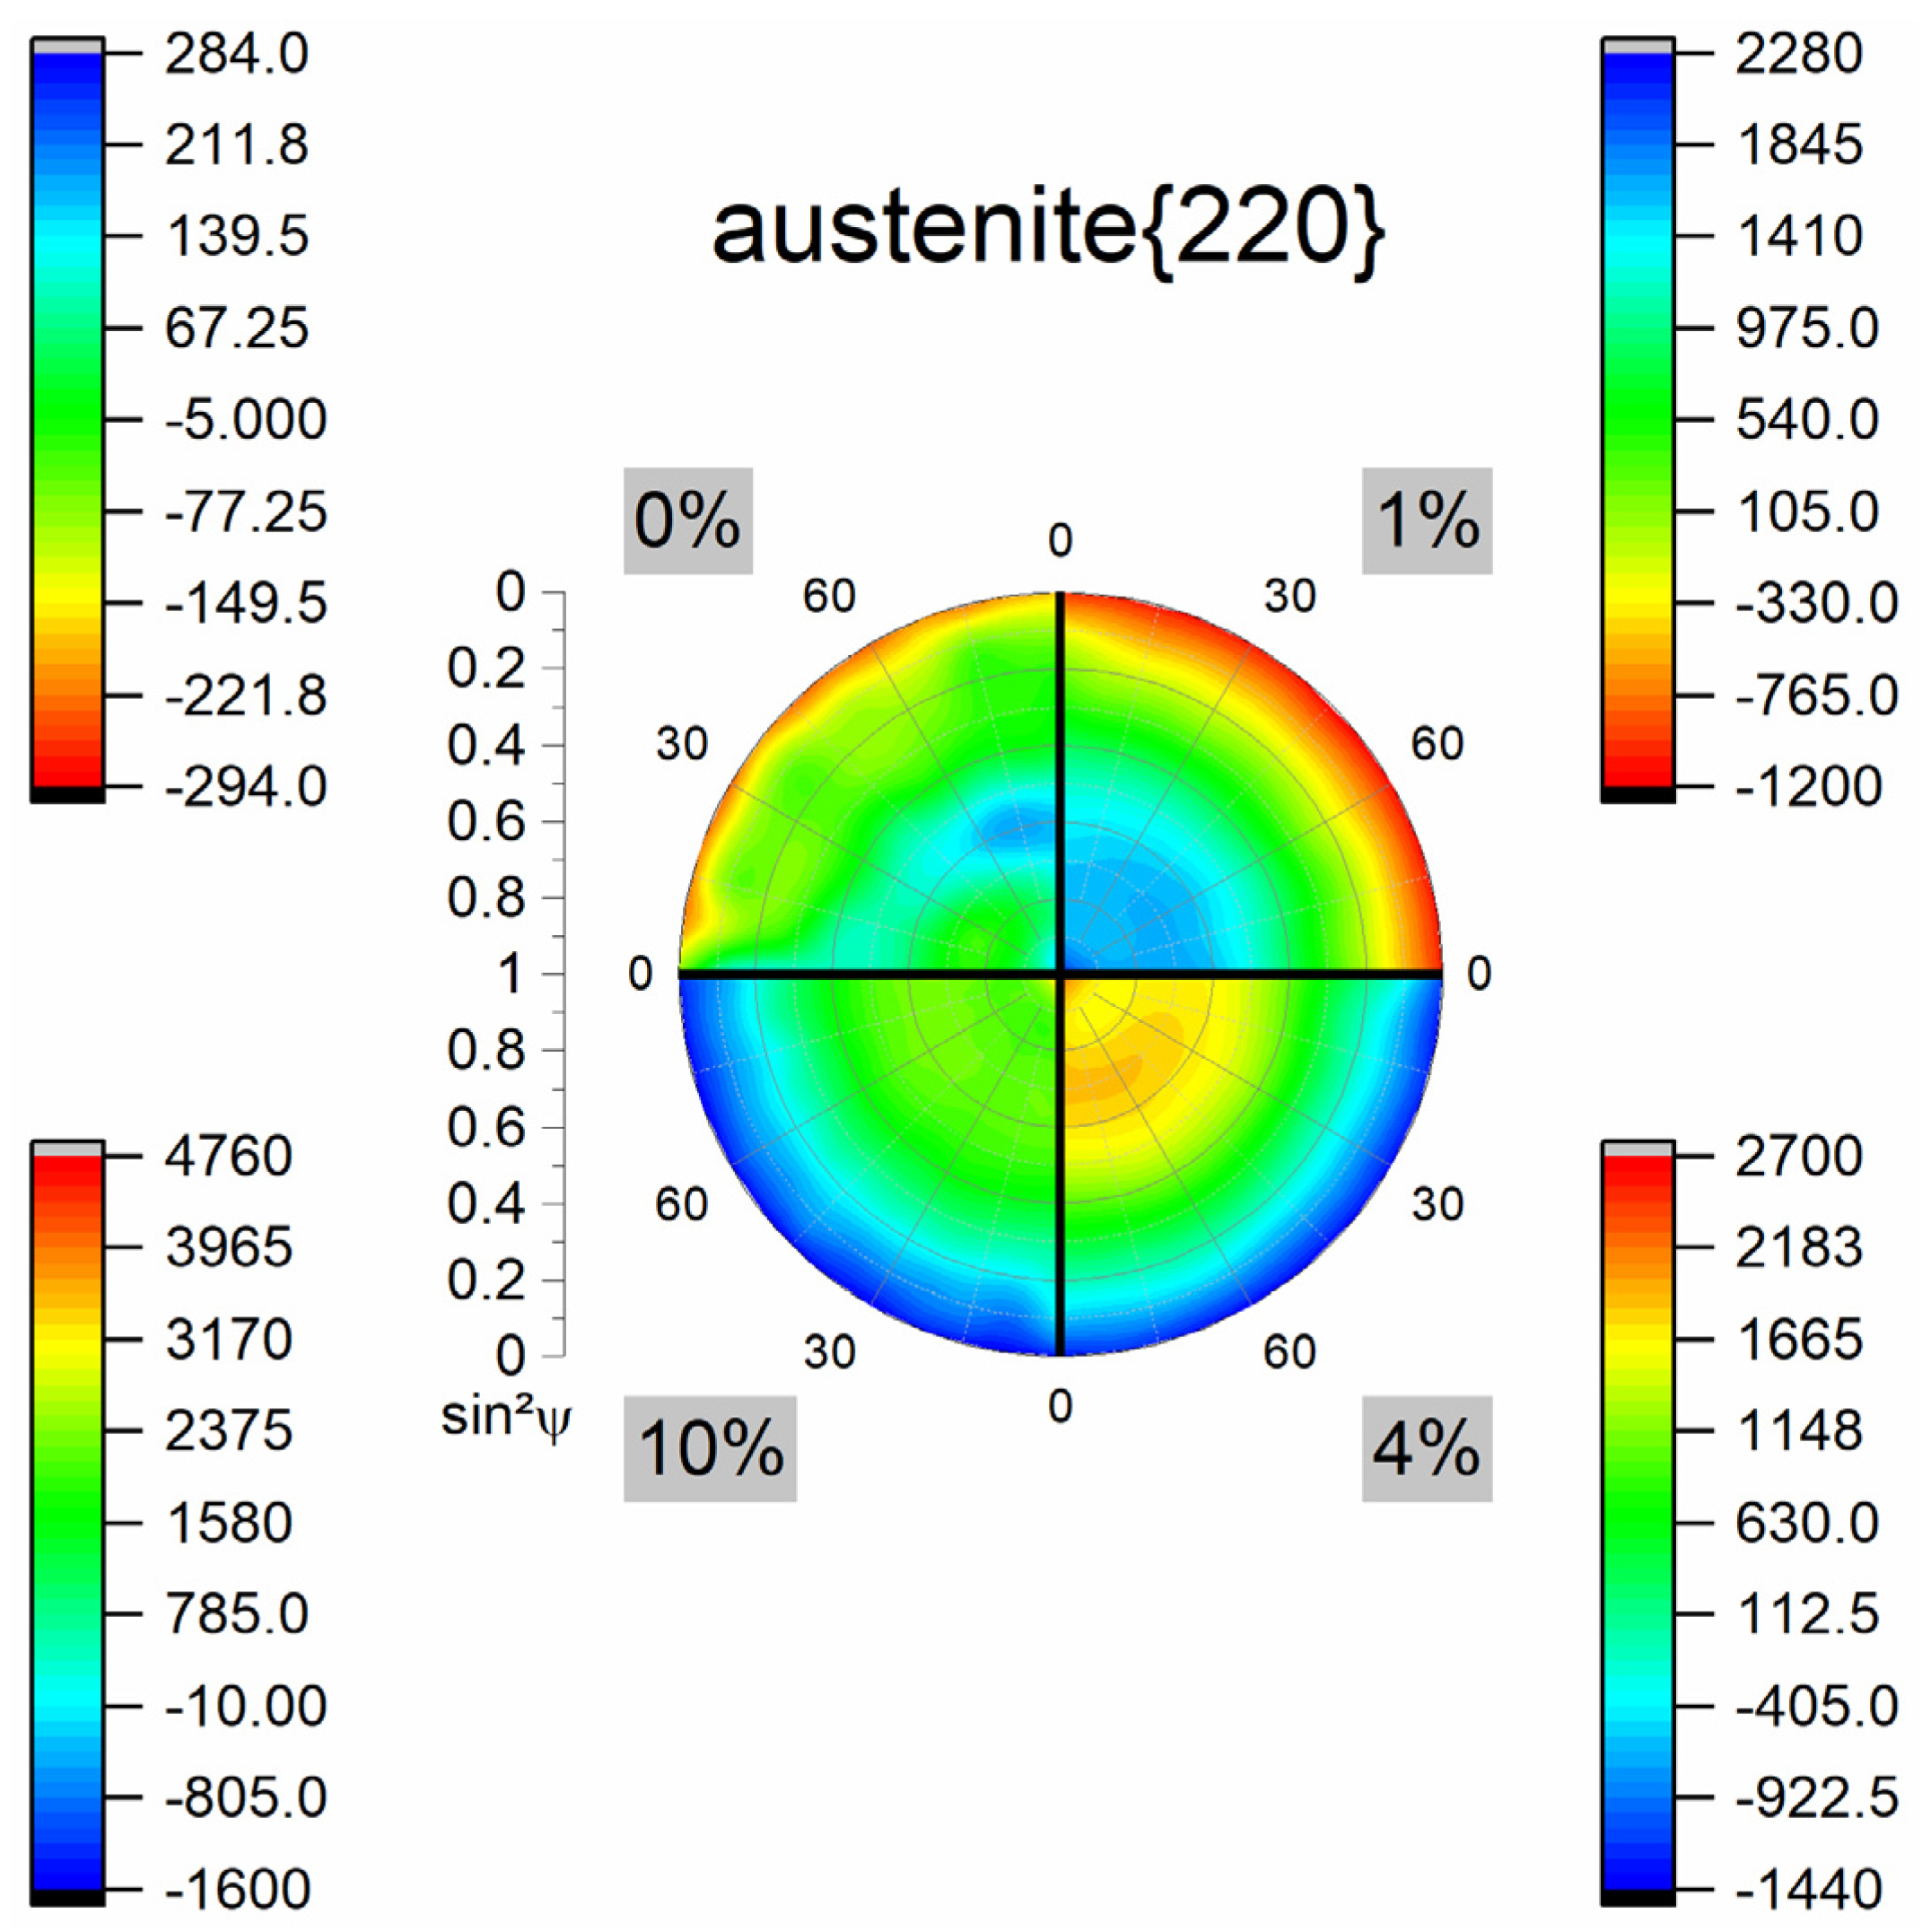
  • The results show that, for the duplex stainless steel, plastic anisotropy effects can be determined for its two phases, austenite and ferrite, which are triggered by existing phase-specific crystallographic textures. As expected, these effects increase with increasing degrees of deformation.
  • Failure to take these effects into account sometimes leads to severely incorrect (residual) stress evaluations.
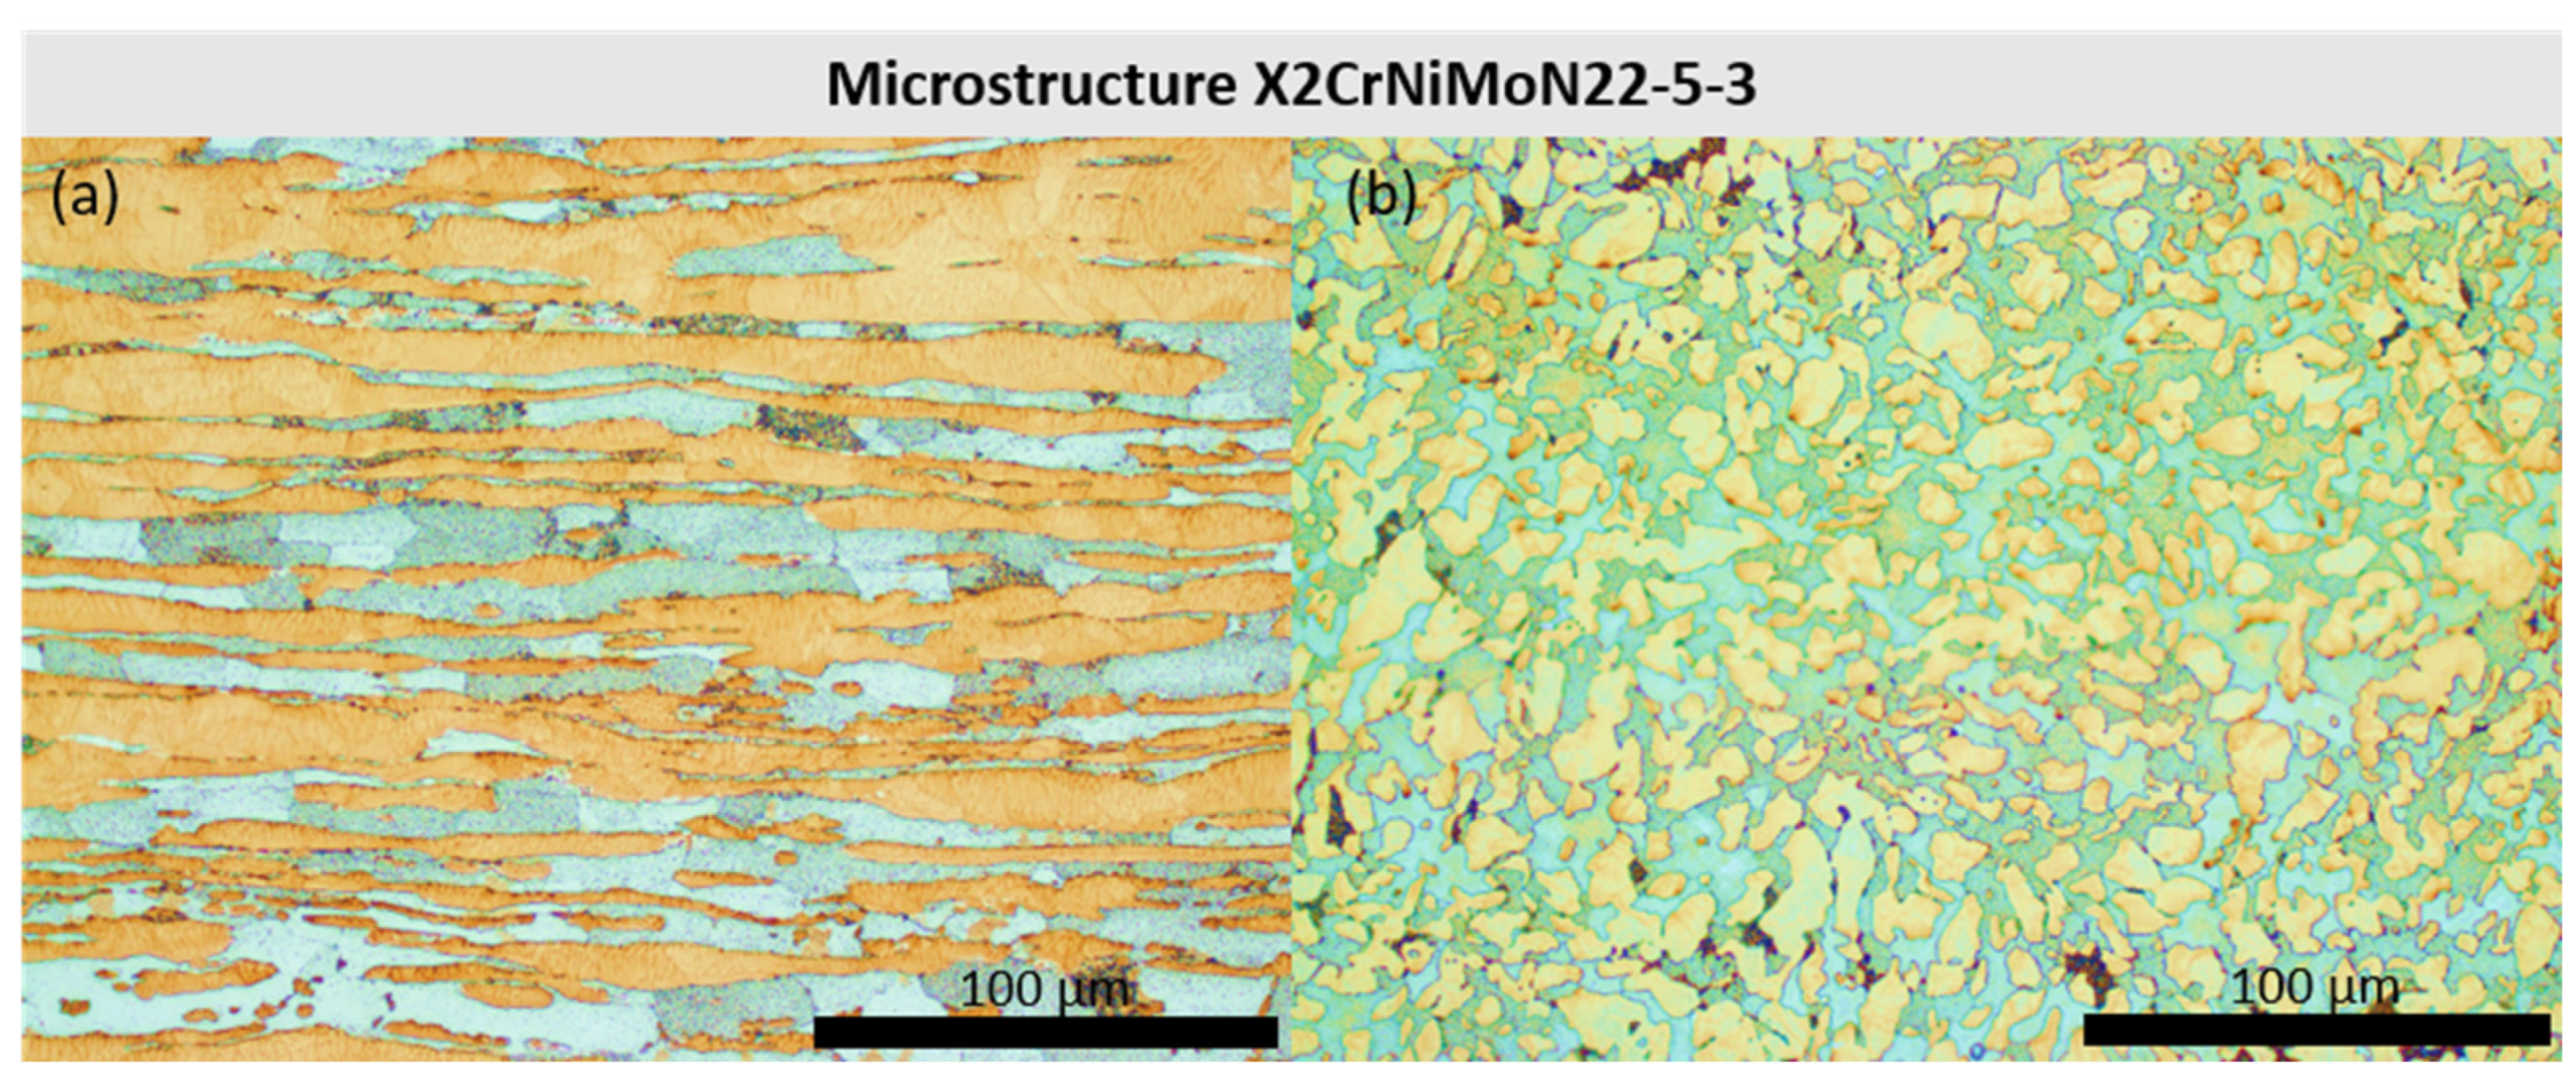
  • The lattice planes that are recommended in the literature for residual stress analyses are also shown to be relatively insensitive to plastic anisotropy effects on the existing material state of the duplex stainless steel X2CrNiMoN22-5-3. The associated lattice strain vs.  s i n 2 ψ  distributions are still sufficiently linear even at high degrees of deformation.
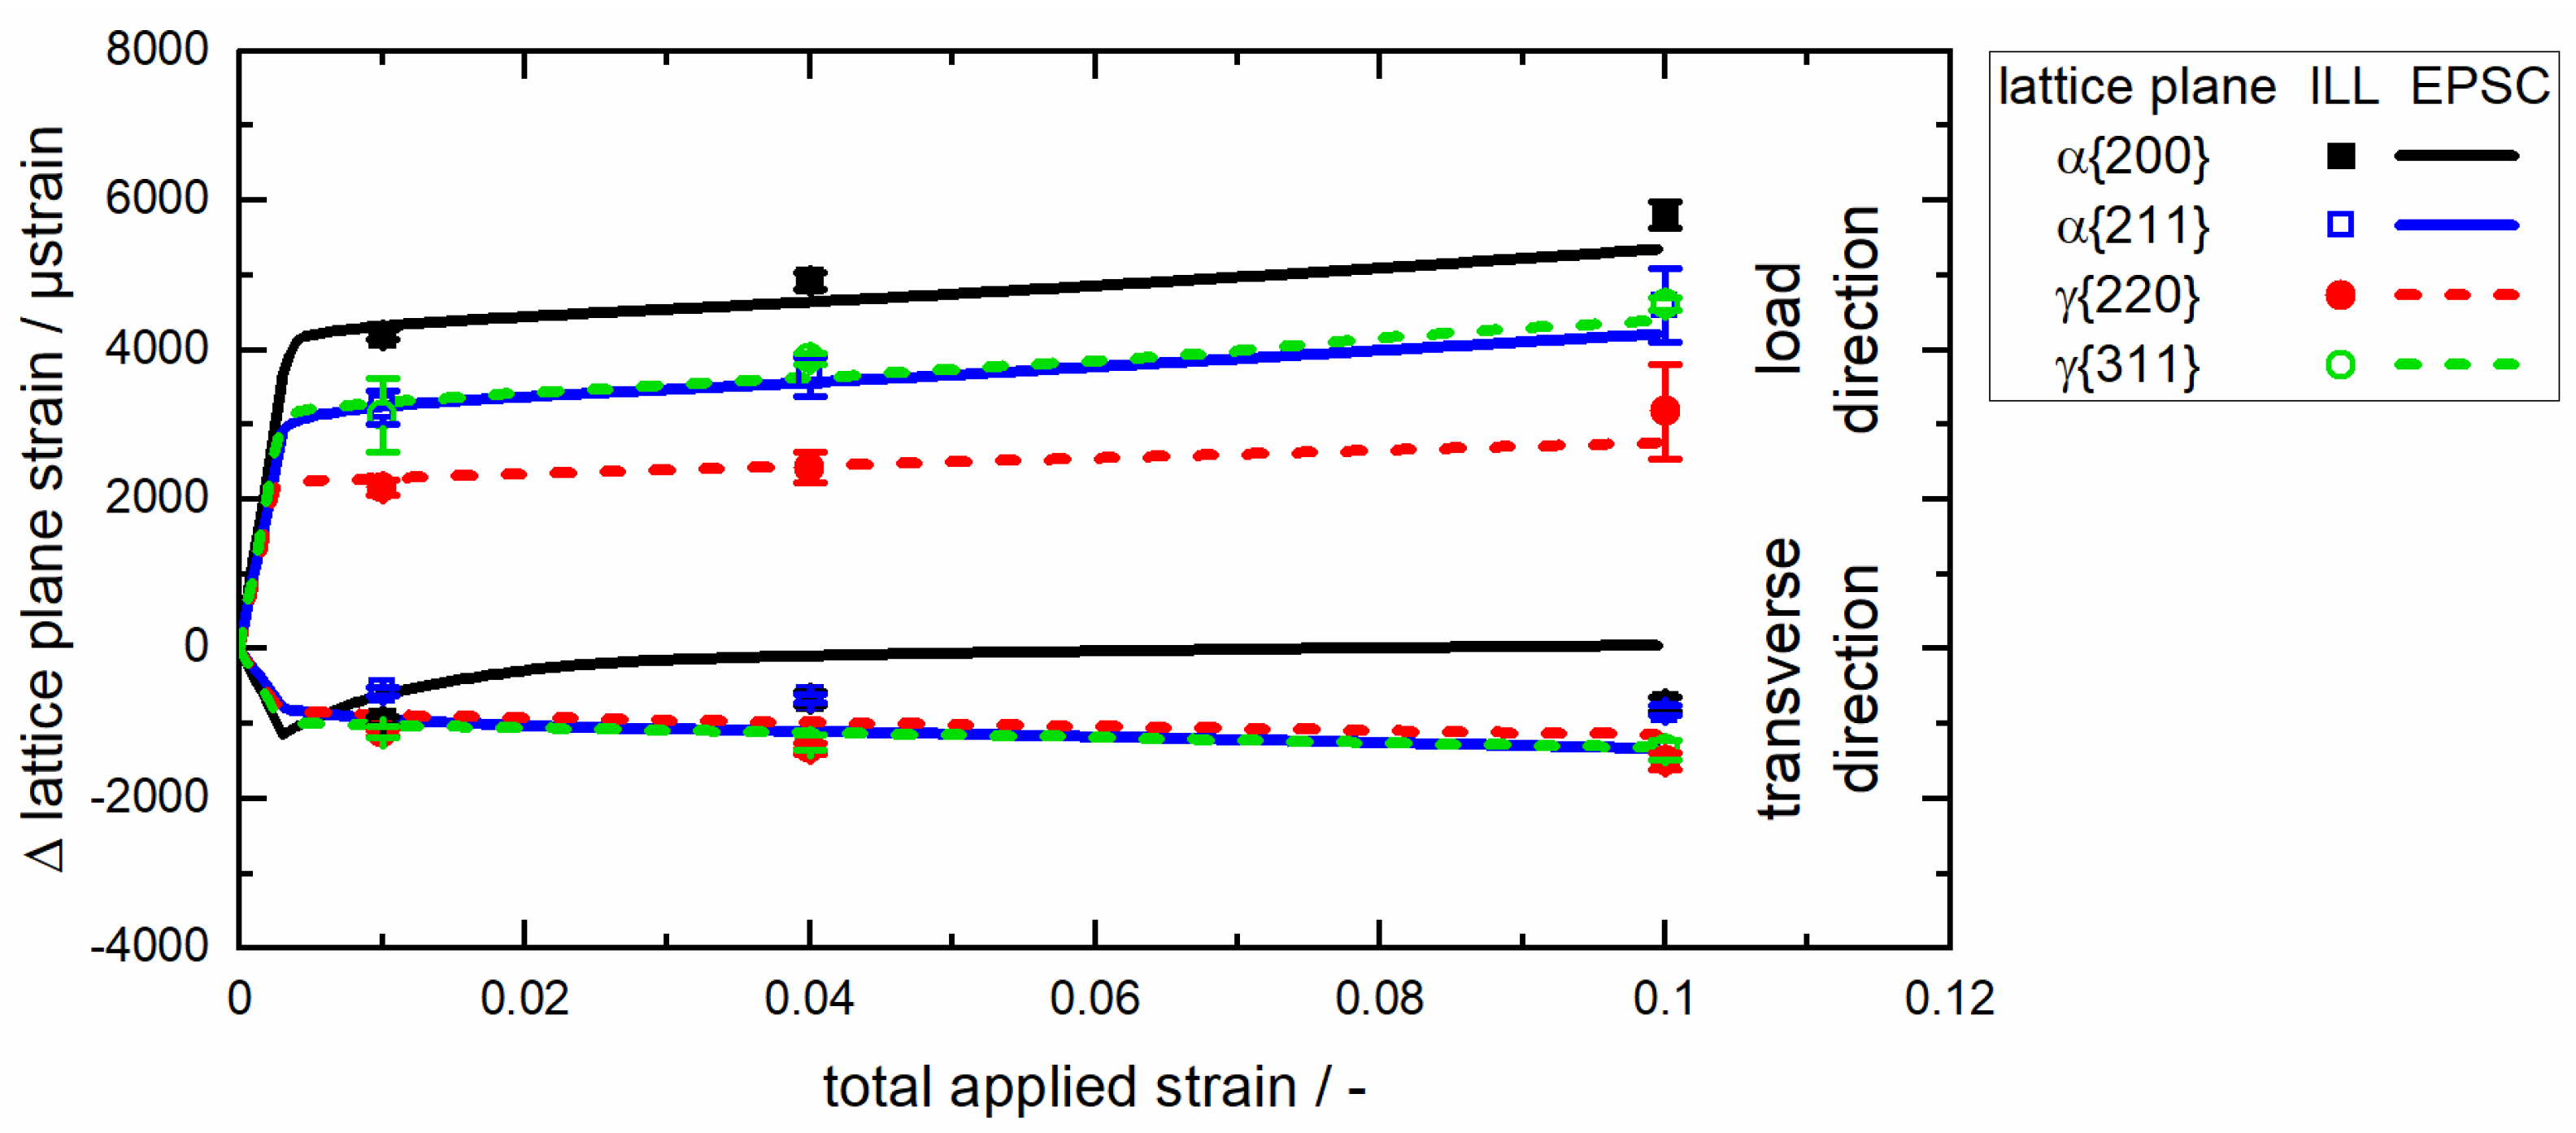
  • The proposed EPSC model, in which the austenite and ferrite phases were coupled accordingly to represent the material behaviour of the duplex stainless steel, appears fundamentally suitable to describe the material’s {hkl}-specific deformation behaviour.
  • However, at relatively high strain deformations of 10%, there are sometimes clear deviations from the neutronographic results. An improvement is planned here by, among other things, further expanding the model to include additional strengthening mechanisms, such as grain boundary strengthening.

Author Contributions

Conceptualization, S.P. and J.G.; methodology, S.P. and J.G.; software, S.P., F.L., H.L., A.P. and J.G.; validation, S.P. and H.L.; formal analysis, S.P.; general investigation, S.P.; neutron diffraction experiment, S.P., J.G., S.C. and T.P.; resources, M.H. and J.G.; data curation, S.P.; writing—original draft preparation, S.P. and J.G.; writing—review and editing, S.P., J.G., M.H., F.L., H.L., A.P., S.C. and T.P.; visualization, S.P.; supervision, J.G.; project administration, M.H. and J.G.; funding acquisition, M.H. and J.G. All authors have read and agreed to the published version of the manuscript.

Funding

This research was funded by the German Research Foundation (DFG) under grant numbers GI 376/11-2 and Ho 3322/4-2 (project number 282874578).

Data Availability Statement

The data presented in this study are openly available from the Institut Laue-Langevin at https://doi.org/10.5291/ILL-DATA.1-02-289, reference number [62]. The initial blocking period is three years from the date of the experiment.

Acknowledgments

We would like to thank the Institute Laue-Langevin—GRENOBLE (France) for granting us beamtime 1-02-289 [62] on the SALSA instrument. We would like to thank Yitian Han for her contribution to the EPSC model’s development as part of her master’s thesis.

Conflicts of Interest

The authors declare no conflicts of interest.

References

  1. Moura, V.S.; Lima, L.D.; Pardal, J.M.; Kina, A.Y.; Corte, R.; Tavares, S. Influence of microstructure on the corrosion resistance of the duplex stainless steel UNS S31803. Mater. Charact. 2008, 59, 1127–1132. [Google Scholar] [CrossRef]
  2. Calderón-Uríszar-Aldaca, I.; Briz, E.; Matanza, A.; Martin, U.; Bastidas, D.M. Corrosion Fatigue Numerical Model for Austenitic and Lean-Duplex Stainless-Steel Rebars Exposed to Marine Environments. Metals 2020, 10, 1217. [Google Scholar] [CrossRef]
  3. Johansson, J. Residual Stresses and Fatigue in a Duplex Stainless Steel. Ph.D. Thesis, Linkoeping Studies in Science and Technology, Linköping, Sweden, 1999. [Google Scholar]
  4. TMR Stainless. Practical Guidelines for the Fabrication of Duplex Stainless Steels, 3rd ed.; International Molybdenum: London, UK, 2014; ISBN 978-1-907470-09-7. [Google Scholar]
  5. Tang, J.; Yang, X.; Wang, Y.; Wang, H.; Xiao, Y.; Apreutesei, M.; Nie, Z.; Normand, B. Corrosion Behavior of 2205 Duplex Stainless Steels in HCl Solution Containing Sulfide. Metals 2019, 9, 294. [Google Scholar] [CrossRef]
  6. Kumar, A.; Khatirkar, R.K.; Chalapathi, D.; Kumar, G.; Suwas, S. Microstructure and Texture Development during Cold Rolling in UNS S32205 and UNS S32760 Duplex Stainless Steels. Metall. Mater. Trans. A 2017, 48, 2349–2362. [Google Scholar] [CrossRef]
  7. Zettl, B.; Schmid, H.; Pulvermacher, S.; Dyck, A.; Böhlke, T.; Gibmeier, J.; Merklein, M. Improvement of process control in sheet metal forming by considering the gradual properties of the initial sheet metal. J. Strain Anal. Eng. Des. 2023. [Google Scholar] [CrossRef]
  8. Simon, N.; Erdle, H.; Walzer, S.; Gibmeier, J.; Böhlke, T.; Liewald, M. Residual stresses in deep-drawn cups made of duplex stainless steel X2CrNiN23-4. Forsch Ingenieurwes 2021, 85, 795–806. [Google Scholar] [CrossRef]
  9. Chalapathi, D.; Sivaprasad, P.V.; Chai, G.; Kanjarla, A.K. Anisotropic work hardening behaviour in duplex stainless steel under uni-axial loading: Interplay between phase morphology and crystallographic texture. Mater. Sci. Eng. A 2022, 849, 143418. [Google Scholar] [CrossRef]
  10. Chalapathi, D.; Bhaskar, L.K.; Sivaprasad, P.V.; Chai, G.; Kumar, R.; Kanjarla, A.K. Biaxial deformation behaviour of duplex stainless steels: Experiments and crystal plasticity based stress predictions. Mater. Sci. Eng. A 2023, 864, 144597. [Google Scholar] [CrossRef]
  11. Pulvermacher, S.; Bücker, T.; Šaroun, J.; Rebelo-Kornmeier, J.; Hofmann, M.; Gibmeier, J. Neutron and X-ray Diffraction Analysis of Macro and Phase-Specific Micro Residual Stresses in Deep Rolled Duplex Stainless Steels. Materials 2021, 14, 1854. [Google Scholar] [CrossRef]
  12. Hutchings, M.T.; Withers, P.J.; Holden, T.M.; Lorentzen, T. Introduction to the Characterization of Residual Stress by Neutron Diffraction, 1st ed.; CRC Press Taylor & Francis Group: Boca Raton, FL, USA, 2005; ISBN 0-415-31000-8. [Google Scholar]
  13. Allen, A.J.; Bourke, M.; David, W.I.F.; Dawes, S.; Hutchings, M.T.; Krawitz, A.D.; Windsor, C.G. Effects of Elastic Anisotropy on the Lattice Strains in Polycrystalline Metals and Composites Measured by Neutron Diffraction. In International Conference on Residual Stresses: ICRS2; Beck, G., Denis, S., Simon, A., Eds.; Springer: Dordrecht, The Netherlands, 1989; pp. 78–83. ISBN 978-94-010-7007-2. [Google Scholar]
  14. Clausen, B.; Brown, D.; Tomé, C.; Balogh, L.; Vogel, S. Engineering related neutron diffraction measurements probing strains, texture and microstructure. In Proceedings of the 31st Riso International Symposium on Materials Science. Technical University of Denmark, Riso National Laboratory for Sustanaible Energy, Roskilde, Denmark, 6–10 September 2010. [Google Scholar]
  15. Clausen, B.; Lorentzen, T.; Bourke, M.A.; Daymond, M.R. Lattice strain evolution during uniaxial tensile loading of stainless steel. Mater. Sci. Eng. A 1999, 259, 17–24. [Google Scholar] [CrossRef]
  16. Daymond, M.R.; Tomé, C.N.; Bourke, M. Measured and predicted intergranular strains in textured austenitic steel. Acta Mater. 2000, 48, 553–564. [Google Scholar] [CrossRef]
  17. Pulvermacher, S.; Pirling, T.; Cabeza, S.; Zuern, M.G.; Hofmann, M.; Gibmeier, J. Neutronographic Analysis of Load Partitioning and Micro Residual Stress Development in Duplex Stainless Steels. Crystals 2022, 12, 1378. [Google Scholar] [CrossRef]
  18. Dye, D.; Stone, H.J.; Reed, R.C. Intergranular and interphase microstresses. Curr. Opin. Solid State Mater. Sci. 2001, 5, 31–37. [Google Scholar] [CrossRef]
  19. ISO 21432:2020; Non-Destructive Testing—Standard Test Method for Determining Residual Stresses by Neutron Diffraction. DIN Deutsches Institut für Normung e. V., DIN German Institute for Standardization, Beuth Verlag GmbH: Berlin, Germany, 2020.
  20. Holden, T.M.; Clarke, A.P.; Holt, R.A. Neutron diffraction measurements of intergranular strains in MONEL-400. Metall. Mater. Trans. A 1997, 28, 2565–2576. [Google Scholar] [CrossRef]
  21. Clausen, B. Characterisation of Polycrystal Deformation by Numerical Modeling and Neutron Diffraction Measurements; Riso National Laboratory: Roskilde, Denmark, 1997. [Google Scholar]
  22. Pang, J.; Holden, T.; Mason, T. In situ generation of intergranular strains in an Al7050 alloy. Acta Mater. 1998, 46, 1503–1518. [Google Scholar] [CrossRef]
  23. Pang, J.W.L.; Holden, T.M.; Mason, T.E. The development of intergranular strains in a high-strength steel. J. Strain Anal. Eng. Des. 1998, 33, 373–383. [Google Scholar] [CrossRef]
  24. Daymond, M.R.; Priesmeyer, H.G. Elastoplastic deformation of ferritic steel and cementite studied by neutron diffraction and self-consistent modelling. Acta Mater. 2002, 50, 1613–1626. [Google Scholar] [CrossRef]
  25. Gloaguen, D.; Girault, B.; Fajoui, J.; Klosek, V.; Moya, M.J. Lattice Strain Pole Figures Analysis in Titanium during Uniaxial Deformation. Mater. Sci. Forum 2017, 905, 74–80. [Google Scholar] [CrossRef]
  26. Larsson, C.; Clausen, B.; Holden, T.M.; Bourke, M. Measurements and predictions of strain pole figures for uniaxially compressed stainless steel. Scr. Mater. 2004, 51, 571–575. [Google Scholar] [CrossRef]
  27. Miller, M.P.; Bernier, J.V.; Park, J.-S.; Kazimirov, A. Experimental measurement of lattice strain pole figures using synchrotron x rays. Rev. Sci. Instrum. 2005, 76, 113903. [Google Scholar] [CrossRef]
  28. Eigenmann, B.; Scholtes, B.; Macherauch, E. Principles and applications of X-ray stress determination in ceramics and ceramic-metal composites. Mater. Werkst. 1989, 20, 314–325. [Google Scholar] [CrossRef]
  29. Clausen, B.; Tomé, C.N.; Brown, D.W.; Agnew, S.R. Reorientation and stress relaxation due to twinning: Modeling and experimental characterization for Mg. Acta Mater. 2008, 56, 2456–2468. [Google Scholar] [CrossRef]
  30. Clausen, B.; Lorentzen, T.; Leffers, T. Self-consistent modelling of the plastic deformation of f.c.c. polycrystals and its implications for diffraction measurements of internal stresses. Acta Mater. 1998, 46, 3087–3098. [Google Scholar] [CrossRef]
  31. Muránsky, O.; Barnett, M.R.; Luzin, V.; Vogel, S. On the correlation between deformation twinning and Lüders-like deformation in an extruded Mg alloy: In situ neutron diffraction and EPSC.4 modelling. Mater. Sci. Eng. A 2010, 527, 1383–1394. [Google Scholar] [CrossRef]
  32. Li, H.; Cai, W.; Fan, Z.; Huang, X.; Wang, Y.; Gong, J.; Chen, B.; Sun, G.; Wang, H.; Li, J.; et al. Compression deformation behavior of Zircaloy-4 alloy changing with activated twinning type at ambient temperature: Experiment and modeling. J. Appl. Crystallogr. 2016, 49, 987–996. [Google Scholar] [CrossRef]
  33. Baczmański, A. Elastoplastic properties of duplex steel determined using neutron diffraction and self-consistent model. Acta Mater. 2004, 52, 1133–1142. [Google Scholar] [CrossRef]
  34. Baczmański, A.; Levy-Tubiana, R.; Fitzpatrick, M.E.; Lodini, A. Elastoplastic deformation of Al/SiCp metal–matrix composite studied by self-consistent modelling and neutron diffraction. Acta Mater. 2004, 52, 1565–1577. [Google Scholar] [CrossRef]
  35. Dakhlaoui, R.; Baczmański, A.; Braham, C.; Wroński, S.; Wierzbanowski, K.; Oliver, E.C. Effect of residual stresses on individual phase mechanical properties of austeno-ferritic duplex stainless steel. Acta Mater. 2006, 54, 5027–5039. [Google Scholar] [CrossRef]
  36. Pirling, T.; Bruno, G.; Withers, P.J. SALSA—A new instrument for strain imaging in engineering materials and components. Mater. Sci. Eng. A 2006, 437, 139–144. [Google Scholar] [CrossRef]
  37. DIN EN 10027-2:2015-07; Bezeichnungssysteme für Stähle_- Teil_2: Nummernsystem; Deutsche Fassung. Beuth Verlag GmbH: Berlin, Germany, 2015.
  38. ThyssenKrupp Materials Europe, Technischer Verkauf/Qualitätsmanagement. Werkstoffblatt TK 1.4462 (X2CrNiMoN22-5-3), 45313 Essen. 03/2006.
  39. DIN EN 10088-3:2014-12; Nichtrostende Stähle_- Teil_3: Technische Lieferbedingungen für Halbzeug, Stäbe, Walzdraht, Gezogenen Draht, Profile und Blankstahlerzeugnisse aus Korrosionsbeständigen Stählen für allgemeine Verwendung. Deutsche Fassung; Beuth Verlag GmbH: Berlin, Germany, 2014.
  40. Bachmann, F.; Hielscher, R.; Schaeben, H. Texture Analysis with MTEX—Free and Open Source Software Toolbox. Solid State Phenom. 2010, 160, 63–68. [Google Scholar] [CrossRef]
  41. Richard, D.; Ferrand, M.; Kearley, G.J. Analysis and visualisation of neutron-scattering data. J. Neutron Res. 1996, 4, 33–39. [Google Scholar] [CrossRef]
  42. Withers; Preuss, P.J.M.; Steuwerb, A.; Pang, J.W.L. Methods for obtaining the strain-free lattice parameter when using diffraction to determine residual stress. Appl. Crystallogr. 2007, 40, 891–904. [Google Scholar] [CrossRef]
  43. Kehrer, L.; Wood, J.T.; Böhlke, T. Mean-Field Homogenization of Thermoelastic Material Properties of a Long Fiber-Reinforced Thermoset and Experimental Investigation. J. Compos. Mater. 2020, 54, 3777–3799. [Google Scholar] [CrossRef]
  44. Willis, J.R. Variational and Related Methods for the Overall Properties of Composites. In Advances in Applied Mechanics; Yih, C.-S., Ed.; Academic Press: New York, NY, USA, 1981; pp. 1–78. ISBN 9780120020218. [Google Scholar]
  45. Eshelby, J.D. The determination of the elastic field of an ellipsoidal inclusion, and related problems. Proc. R. Soc. Lond. A 1957, 241, 376–396. [Google Scholar] [CrossRef]
  46. Neil, C.J.; Wollmershauser, J.A.; Clausen, B.; Tomé, C.N.; Agnew, S.R. Modeling lattice strain evolution at finite strains and experimental verification for copper and stainless steel using in situ neutron diffraction. Int. J. Plast. 2010, 26, 1772–1791. [Google Scholar] [CrossRef]
  47. Turner, P.A.; Tomé, C.N. A study of residual stresses in Zircaloy-2 with rod texture. Acta Metall. Mater. 1994, 42, 4143–4153. [Google Scholar] [CrossRef]
  48. Han, Y. Weiterentwicklung eines selbst-konsistenten Materialmodells zur Beschreibung des phasenspezifischen, elasto-plastischen Verhaltens grob mehrphasiger Werkstoffe. Master’s Thesis, KIT, IAM-WK, Department “Structur and Stress Analysis”, Karlsruhe, Germany, 2020. [Google Scholar]
  49. Tomé, C.N.; Oliver, E.C.; Wollmershauser, J.A. EPSC4 Manual; Los Alamos National Laboratory: Los Alamo, NM, USA, 2010. [Google Scholar]
  50. Loebich, F. Bestimmung der Verbund-REK des Werkstoffs 1.4462 und Implementierung eines Ansatzes zur Kopplung Mehrerer Phasen in ein bestehendes EPSC-Modell; Seminararbeit/Term paper, KIT, IAM-WK, Department “Structur and Stress Analysis”, Engelbert-Arnold-Straße 4, 76131 Karlsruhe, Germany. 2022. [Google Scholar]
  51. Beyerlein, I.J.; Tomé, C.N. A dislocation-based constitutive law for pure Zr including temperature effects. Int. J. Plast. 2008, 24, 867–895. [Google Scholar] [CrossRef]
  52. Raghunathan, S.L.; Stapleton, A.M.; Dashwood, R.J.; Jackson, M.; Dye, D. Micromechanics of Ti–10V–2Fe–3Al: In situ synchrotron characterisation and modelling. Acta Mater. 2007, 55, 6861–6872. [Google Scholar] [CrossRef]
  53. Stapleton, A.M.; Raghunathan, S.L.; Bantounas, I.; Stone, H.J.; Lindley, T.C.; Dye, D. Evolution of lattice strain in Ti–6Al–4V during tensile loading at room temperature. Acta Mater. 2008, 56, 6186–6196. [Google Scholar] [CrossRef]
  54. Warwick, J.; Coakley, J.; Raghunathan, S.L.; Talling, R.J.; Dye, D. Effect of texture on load partitioning in Ti-6Al-4V. Acta Mater. 2012, 60, 4117–4127. [Google Scholar] [CrossRef]
  55. Shi, R.; Li, G.; Nie, Z.; Fan, Q. Determination of the single-phase constitutive relations of α/β dual phase TC6 titanium alloy. Mater. Sci. Eng. A 2016, 675, 138–146. [Google Scholar] [CrossRef]
  56. Hounkpati, V.; Fréour, S.; Gloaguen, D.; Legrand, V.; Kelleher, J.; Kockelmann, W.; Kabra, S. In situ neutron measurements and modelling of the intergranular strains in the near-β titanium alloy Ti-β21S. Acta Mater. 2016, 109, 341–352. [Google Scholar] [CrossRef]
  57. Dvorak, G. Micromechanics of Composite Materials; Springer: Dordrecht, The Netherlands, 2013. [Google Scholar]
  58. Kachanov, M.; Sevostianov, I. Micromechanics of Materials, with Applications; Springer International Publishing: Cham, Switzerland, 2018. [Google Scholar]
  59. Liu, H. Advancement of a Self-Consistent Material Model for the Numerical Simulation of the Phase-Specific, Elasto-Plastic Behaviour of Duplex Steels. Master’s Thesis, KIT, IAM-WK, Department “Structur and Stress Analysis”, Karlsruhe, Germany, 2021. [Google Scholar]
  60. Du, C.; Maresca, F.; Geers, M.; Hoefnagels, J. Ferrite slip system activation investigated by uniaxial micro-tensile tests and simulations. Acta Mater. 2018, 146, 314–327. [Google Scholar] [CrossRef]
  61. Dakhlaoui, R.; Baczmański, A.; Braham, C.; Wroński, S.; Wierzbanowski, K.; Oliver, E.C. Neutron Diffraction Study of Duplex Stainless Steel during Loading at 200 °C. Mater. Sci. Forum 2008, 571, 175–180. [Google Scholar] [CrossRef]
  62. Gibmeier, J.; Cabeza, S.; Hofmann, M.; Pirling, T.; Pulvermacher, S.; Rebelo Kornmeier, J. In-Situ Determination of Grain-Orientation-Dependent Intergranular Strain during Defined Uniaxial Loading of Duplex Stainless Steel; Institut Laue-Langevin: Grenoble, France, 2021. [Google Scholar] [CrossRef]
  63. Dakhlaoui, R.; Braham, C.; Baczmański, A. Mechanical properties of phases in austeno-ferritic duplex stainless steel—Surface stresses studied by X-ray diffraction. Mater. Sci. Eng. A 2007, 444, 6–17. [Google Scholar] [CrossRef]
  64. Behnken, H.; Hauk, V. Berechnung der röntgenographischen Spannungsfaktoren texturierter Werkstoffe-Vergleich mit experimentellen Ergebnissen. Int. J. Mater. Res. 1991, 82, 154–158. [Google Scholar] [CrossRef]
  65. Behnken, H. Mikrospannungen in Vielkristallinen und Heterogenen Werkstoffen; Shaker: Aachen, Germany, 2003; ISBN 3832213848. [Google Scholar]
  66. Simon, N.; Schell, N.; Gibmeier, J. On the Oscillating Course of dhkl−sin2ψ Plots for Plastically Deformed, Cold-Rolled Ferritic and Duplex Stainless Steel Sheets. Crystals 2023, 13, 419. [Google Scholar] [CrossRef]
  67. Daymond, M.R. The determination of a continuum mechanics equivalent elastic strain from the analysis of multiple diffraction peaks. J. Appl. Phys. 2004, 96, 4263–4272. [Google Scholar] [CrossRef]
  68. Simon, N.; Krause, M.; Heinemann, P.; Erdle, H.; Böhlke, T.; Gibmeier, J. Phase-Specific Strain Hardening and Load Partitioning of Cold Rolled Duplex Stainless Steel X2CrNiN23-4. Crystals 2020, 10, 976. [Google Scholar] [CrossRef]
  69. Gnäupel-Herold, T. ISODEC: Software for calculating diffraction elastic constants. J. Appl. Crystallogr. 2012, 45, 573–574. [Google Scholar] [CrossRef]
  70. Gnäupel-Herold, T. A software for diffraction stress factor calculations for textured materials. Powder Diffr. 2012, 27, 114–116. [Google Scholar] [CrossRef]
Figure 1. Micrographs of the sample cross-section. In (a) the cross-section is in the longitudinal direction. This corresponds to the load direction in the load experiment. In (b) the cross-section is in the radial plane. The microstructures were developed using Beraha II etchant. The bright blue areas correspond to the ferrite phase.
Crystals 14 00206 g001
Figure 2. Results of crystallographic texture analysis for the as-received material’s state, as used for input data in the EPSC modelling. On the left, (a) the  φ 2 = 45 °  cut (Bunge notation) through the orientation density function (ODF), and on the right, (b) PFs for the {200} and {211} lattice planes for the ferrite phase and {220} and {311} for the austenite phase, respectively. The PFs were recalculated from the phase-specific ODFs using the open source toolbox MTEX [40] in MATLAB.
Crystals 14 00206 g002
Figure 3. Macroscopic stress–strain curve of the performed strain pole figure experiment. After reaching the target strain ( ε t o t =  1, 4 or 10%), the sample was held under position control for 15 min before the measurements were started to allow for the relaxation of time-dependent effects that might affect the results of the neutron diffraction analysis.
Crystals 14 00206 g003
Figure 4. Experimental set-up used for SALSA/ILL [36]. In (a) the mounting of the tension–compression rig in the Eulerian cradle at the tilt position χ = 0° is shown, and the beam path is indicated, including the primary and secondary collimators. In (b) the tension–compression rig at a tilting angle χ = 90° is presented, and the rotation angles χ and φ are indicated.
Crystals 14 00206 g004
Figure 5. Coordinate system that is applied for the graphical illustration of the determined intensities and lattice strain data. In (a) a 2D plot with the axes Φ and χ is presented, which forms the basis of the presentation of the pole figure (in quadrants). For the illustration of the change of the determined values with the applied load strain, the applied macroscopic load strain in each quadrant of the image is indicated in a grey box. The normal to the sample surface points out from the image plane at the origin of the diagram; in (b) the rotation axes χ and φ are indicated for the schematical set-up, which are relevant for pole figure determination.
Crystals 14 00206 g005
Figure 6. Comparison of the experimentally determined phase-specific lattice strains for different {hkl} planes for the duplex stainless steel X2CrNiMoN22-5-3 under load, i.e., longitudinal direction and transverse direction [62] of the above-described strain pole figure experiment, with the results of the multiphase EPSC material model.
Crystals 14 00206 g006
Figure 7. Experimentally determined strain PFs for the (a) ferrite {200}, (b) ferrite {211}, (c) austenite {220} and (d) austenite {311} lattice planes. The lattice strain distribution in the initial state and at total strains of 1%, 4% and 10% are shown in each case in a separate quadrant of the strain PFs.
Crystals 14 00206 g007
Figure 8. Lattice strain PFs for the austenite {220} lattice plane (same data as in Figure 7), plotted versus  s i n 2 Ψ . The lattice strain distribution in the initial state and at total strains of 1%, 4% and 10% are shown, in each case, in a separate quadrant of the strain PFs. In contrast to Figure 7, a suitable uniform scaling was dispensed with here, as a result of which minor inhomogeneities in the strain distribution become visible.
Crystals 14 00206 g008
Figure 9. Comparison of lattice strains calculated for a section at φ = 45° using two simulation approaches, i.e., using the software ISODEC and the presented EPSC model for identical material data (cf. Table 1 and Figure 2), and a loading stress of 300 MPa. In (a) and (b) are the ferrite phase lattice planes {211} and {200}. In the bottom row are the austenite phase lattice planes (c) {311} and (d) {220}. All data were plotted vs.  s i n 2 ψ  with  ψ = χ 90 .
Crystals 14 00206 g009
Figure 10. Strain PFs simulated using the EPSC model for the four considered phase-specific {hkl} lattice planes for an applied total strain of 0.2, 1, 4 and 10%, respectively. (a) The ferrite {200}, (b) the ferrite {211}, (c) the austenite {220} and (d) the austenite {311} lattice planes.
Crystals 14 00206 g010
Figure 11. Chosen lattice strain distributions of the ferrite {211} lattice plane versus  s i n 2 ψ  for various macroscopic total strains. Data points from the neutron diffraction experiment and the EPSC model for three different orientations φ (φ = 0, 22 and 45°).
Crystals 14 00206 g011
Figure 12. Chosen lattice strain distributions of the ferrite {200} lattice plane versus  s i n 2 ψ  for various macroscopic total strains. Data points from the neutron diffraction experiment and the EPSC model for three different orientations φ (φ = 0, 22 and 45°).
Crystals 14 00206 g012
Figure 13. Chosen lattice strain distributions of the austenite {220} lattice plane versus  s i n 2 ψ  for various macroscopic total strains. Data points from the neutron diffraction experiment and the EPSC model for three different orientations φ (φ = 0, 22 and 45°). In addition, for the 4% total strain diagram, an EPSC simulation of a texture-free (uniform texture) sample is also plotted.
Crystals 14 00206 g013
Figure 14. Chosen lattice strain distributions of the austenite {311} lattice plane versus  s i n 2 ψ  for various macroscopic total strains. Data points from the neutron diffraction experiment and the EPSC model for three different orientations φ (φ = 0, 22 and 45°).
Crystals 14 00206 g014
Table 1. Chemical composition of the duplex stainless steel X2CrNiMoN22-5-3 [38], according to the supplier’s data sheet (Balance: Fe). All values are according to DIN EN 10088-3 [39] in mass–%.
CSiMnPSCrMoNiN
0–0.030–1.00–2.00–0.0350–0.01521.0–23.02.5–3.54.5–6.50.1–0.22
Table 3. Phase-specific initial CRSS  τ 0 p , α  for the slip systems considered in the EPSC model. Adjusted on the basis of [59].
ExperimentFerriteAustenite
{110}<111>{112}<111><111>{110}
Applied282 MPa282 MPa178 MPa
Table 4. Selection of the determined CRSS/MPa, or those used in ESPC models, for the duplex stainless steel X2CrNiMoN22-5-3 (1.4462/UR45N). The lower section lists the input values used for the EPSC models that are based on the “Hardening Parameters”  τ 0 p h  and  θ 0 p h .
SourceFerriteAustenite
{110}<111>{112}<111><111>{110}
Baczmański et al. [33]23024575
Pulvermacher et al. [17]272282195
Hardening parameterHardening parameter
  τ 0 p h   θ 0 p h   τ 0 p h   θ 0 p h
Baczmański et al. [34]220110140225
350110140225
360110120225
410190150380
Dakhlaoui et al. [63]2458075190
Dakhlaoui et al. [35]220120140200
125120125200
Disclaimer/Publisher’s Note: The statements, opinions and data contained in all publications are solely those of the individual author(s) and contributor(s) and not of MDPI and/or the editor(s). MDPI and/or the editor(s) disclaim responsibility for any injury to people or property resulting from any ideas, methods, instructions or products referred to in the content.

