Article

Estimation of Ionic Impurities in Poly(propylene Glycol) Diacrylate Monomers/Liquid Crystal E7 Mixtures Using Dielectric Spectroscopy

1
Laboratoire Physico-Chimie des Matériaux et Environnement (LPCME), Faculté des Sciences Exactes et Informatique, University of Djelfa, P.O. Box 3117, Djelfa 17000, Algeria
2
Unité Matériaux et Transformations (UMET), UMR 8207, CNRS, INRAE, Centrale Lille, University Lille, 59000 Lille, France
3
Laboratoire de Chimie Organique et Substances Naturelles (COSNA), Faculté des Sciences Exactes et Informatique, University of Djelfa, P.O. Box 3117, Djelfa 17000, Algeria
4
Unité de Dynamique et Structure des Matériaux Moléculaires (UDSMM), UR 4476, Université du Littoral—Côte d’Opale, CS 80699, 62228 Calais, France
5
Laboratoire Physico-Chimique des Matériaux, Catalyse et Environnement (LPCMCE), Université des Sciences et de la Technologie Mohammed Boudiaf d’Oran (USTO-MB), Oran 31000, Algeria
*
Author to whom correspondence should be addressed.
Crystals 2024, 14(3), 286; https://doi.org/10.3390/cryst14030286
Submission received: 13 February 2024 / Revised: 11 March 2024 / Accepted: 13 March 2024 / Published: 20 March 2024
(This article belongs to the Topic Recent Advances in Liquid Crystals)

Abstract

:
The study investigated the effect of the molecular weight of three difunctional poly(propylene glycol) diacrylates on the temperature-dependent ionic conductivity of these monomers and their blends with an eutectic nematic liquid crystal mixture (E7). The results revealed two distinct regions. At low temperatures, ionic conduction can be described by the Vogel–Tamman–Fulcher (VTF) equation, while at high temperatures, the conductivity data follow the prediction of the Arrhenius model. The Arrhenius and VTF parameters and their corresponding activation energies were determined using the least squares method. In addition, a conductivity analysis based on an ionic hopping model is proposed. Estimates of ion concentrations and diffusion constants were calculated. It was found that both the ionic concentration and the diffusion constant decrease with the increase in the molecular weight of the monomers. The static dielectric permittivity decreases in the following order: TPGDA, PPGDA540, and PPGDA900. This can be explained by the higher dipole moment of TPGDA, which is caused by an enhanced volume density of carbonyl groups.

1. Introduction

Polymer-dispersed liquid crystal (PDLC) films are composite materials composed of micron-sized LC domains phase-separated by a polymer matrix [1,2,3,4]. These materials are still undergoing intensive studies due to their intriguing properties and potential applications, such as optical shutters, intelligent windows, information displays, and holographic devices [1,2,5,6]. Several techniques with which to produce these materials are available, including radiation-induced polymerization and crosslinking. This process begins with the irradiation of a homogeneous mixture of low-molecular-weight LC and reactive monomers. [4,7,8] As the polymer network grows, the thermodynamic miscibility between the network and the LC decreases, resulting in phase separation and the formation of randomly distributed LC domains within the polymer matrix.
Inorganic impurities (ions) present in the initial monomer/LC mixtures can have adverse effects on the resulting PDLC materials. These effects include increased electrical conductivity, which can lead to a loss of electro-optical or optical properties such as long response time, persistence, and screen flickering [9,10]. Therefore, it is necessary to investigate the dielectric permittivity and electrical conductivity of the initial monomer/LC materials.
Low-frequency dielectric properties have garnered significant attention due to the process of charge carrier transport. Several authors [11,12,13,14] have studied ion transport diffusion in liquids using dielectric theory. Raymond et al. [15] demonstrated that the properties of organosiloxane liquids and polymers are highly dependent on conductivity in relation to humidity. Several studies have investigated the ionic conduction of polymer electrolytes [16,17,18] to develop multifunctional energy-producing composites, such as structural batteries. In particular, researchers have utilized poly(ethylene glycol) (PEG)-based materials [19,20,21] and have demonstrated their high conductivity. Several authors [22,23,24] have studied ionic impurities in organic materials, particularly in LCs, using Iwamoto’s hopping model [25] to describe their conductivity behavior.
The purpose of this study is to investigate the dielectric permittivity and electrical conductivity of a model system composed of difunctional acrylic monomers and blends of these monomers with a eutectic nematic LC mixture composed of cyanobiphenyl derivatives (commercially known as E7). Three acrylic polypropylene glycol diacrylate (PPGDA) monomers were used, with reactive chains of different molecular weights between their two acrylic end groups. These materials were chosen because they have already been studied in the UMET laboratory and present interesting electro-optical, thermophysical, and mechanical properties [26,27,28].
The study will investigate the effect of monomer chain length (i.e., molecular weight) and the presence of ionic impurities on static permittivity and ionic conductivity over a wide range of frequencies and temperatures. The electrical conductivity of the samples, which are in the form of films sandwiched between two electrodes, will be analyzed using the Iwamoto model. This model allows for the estimation of ion concentration and diffusion constants. The conductivity data obtained from the investigated monomer and monomer/E7 samples will be analyzed as a function of temperature using the Arrhenius and Vogel–Tamman–Fulcher (VTF) models [29,30,31,32,33].

2. Materials and Methods

2.1. Materials

This study utilized three acrylic difunctional propylene glycol-based monomers with identical chemical structures, differing only in their chain lengths, as determined by their molecular weights: tripropylene glycol diacrylate (TPGDA) with Mn = 300 g/.mol, polypropylene glycol diacrylate with Mn = 540 g/mol (PPGDA540), and polypropylene glycol diacrylate with Mn = 900 g/mol (PPGDA900); Mn represents the number average of the molecular weight, as given by the sales companies (Cray Valley and Sigma-Aldrich, see below).
Samples were prepared by mixing X weight–percent (wt.-%) LC with (100–X) wt.-% of the monomer. All products were used as received.
The TPGDA material was purchased from Cray Valley Company (Paris, France), and the other monomers (PPGDA540 and PPGDA900) were purchased from Aldrich Chemical Company (Saint-Quentin-Fallavier, France), while the eutectic nematic LC mixture E7 was obtained from Merck Company (Tokyo, Japan).

2.2. Methods

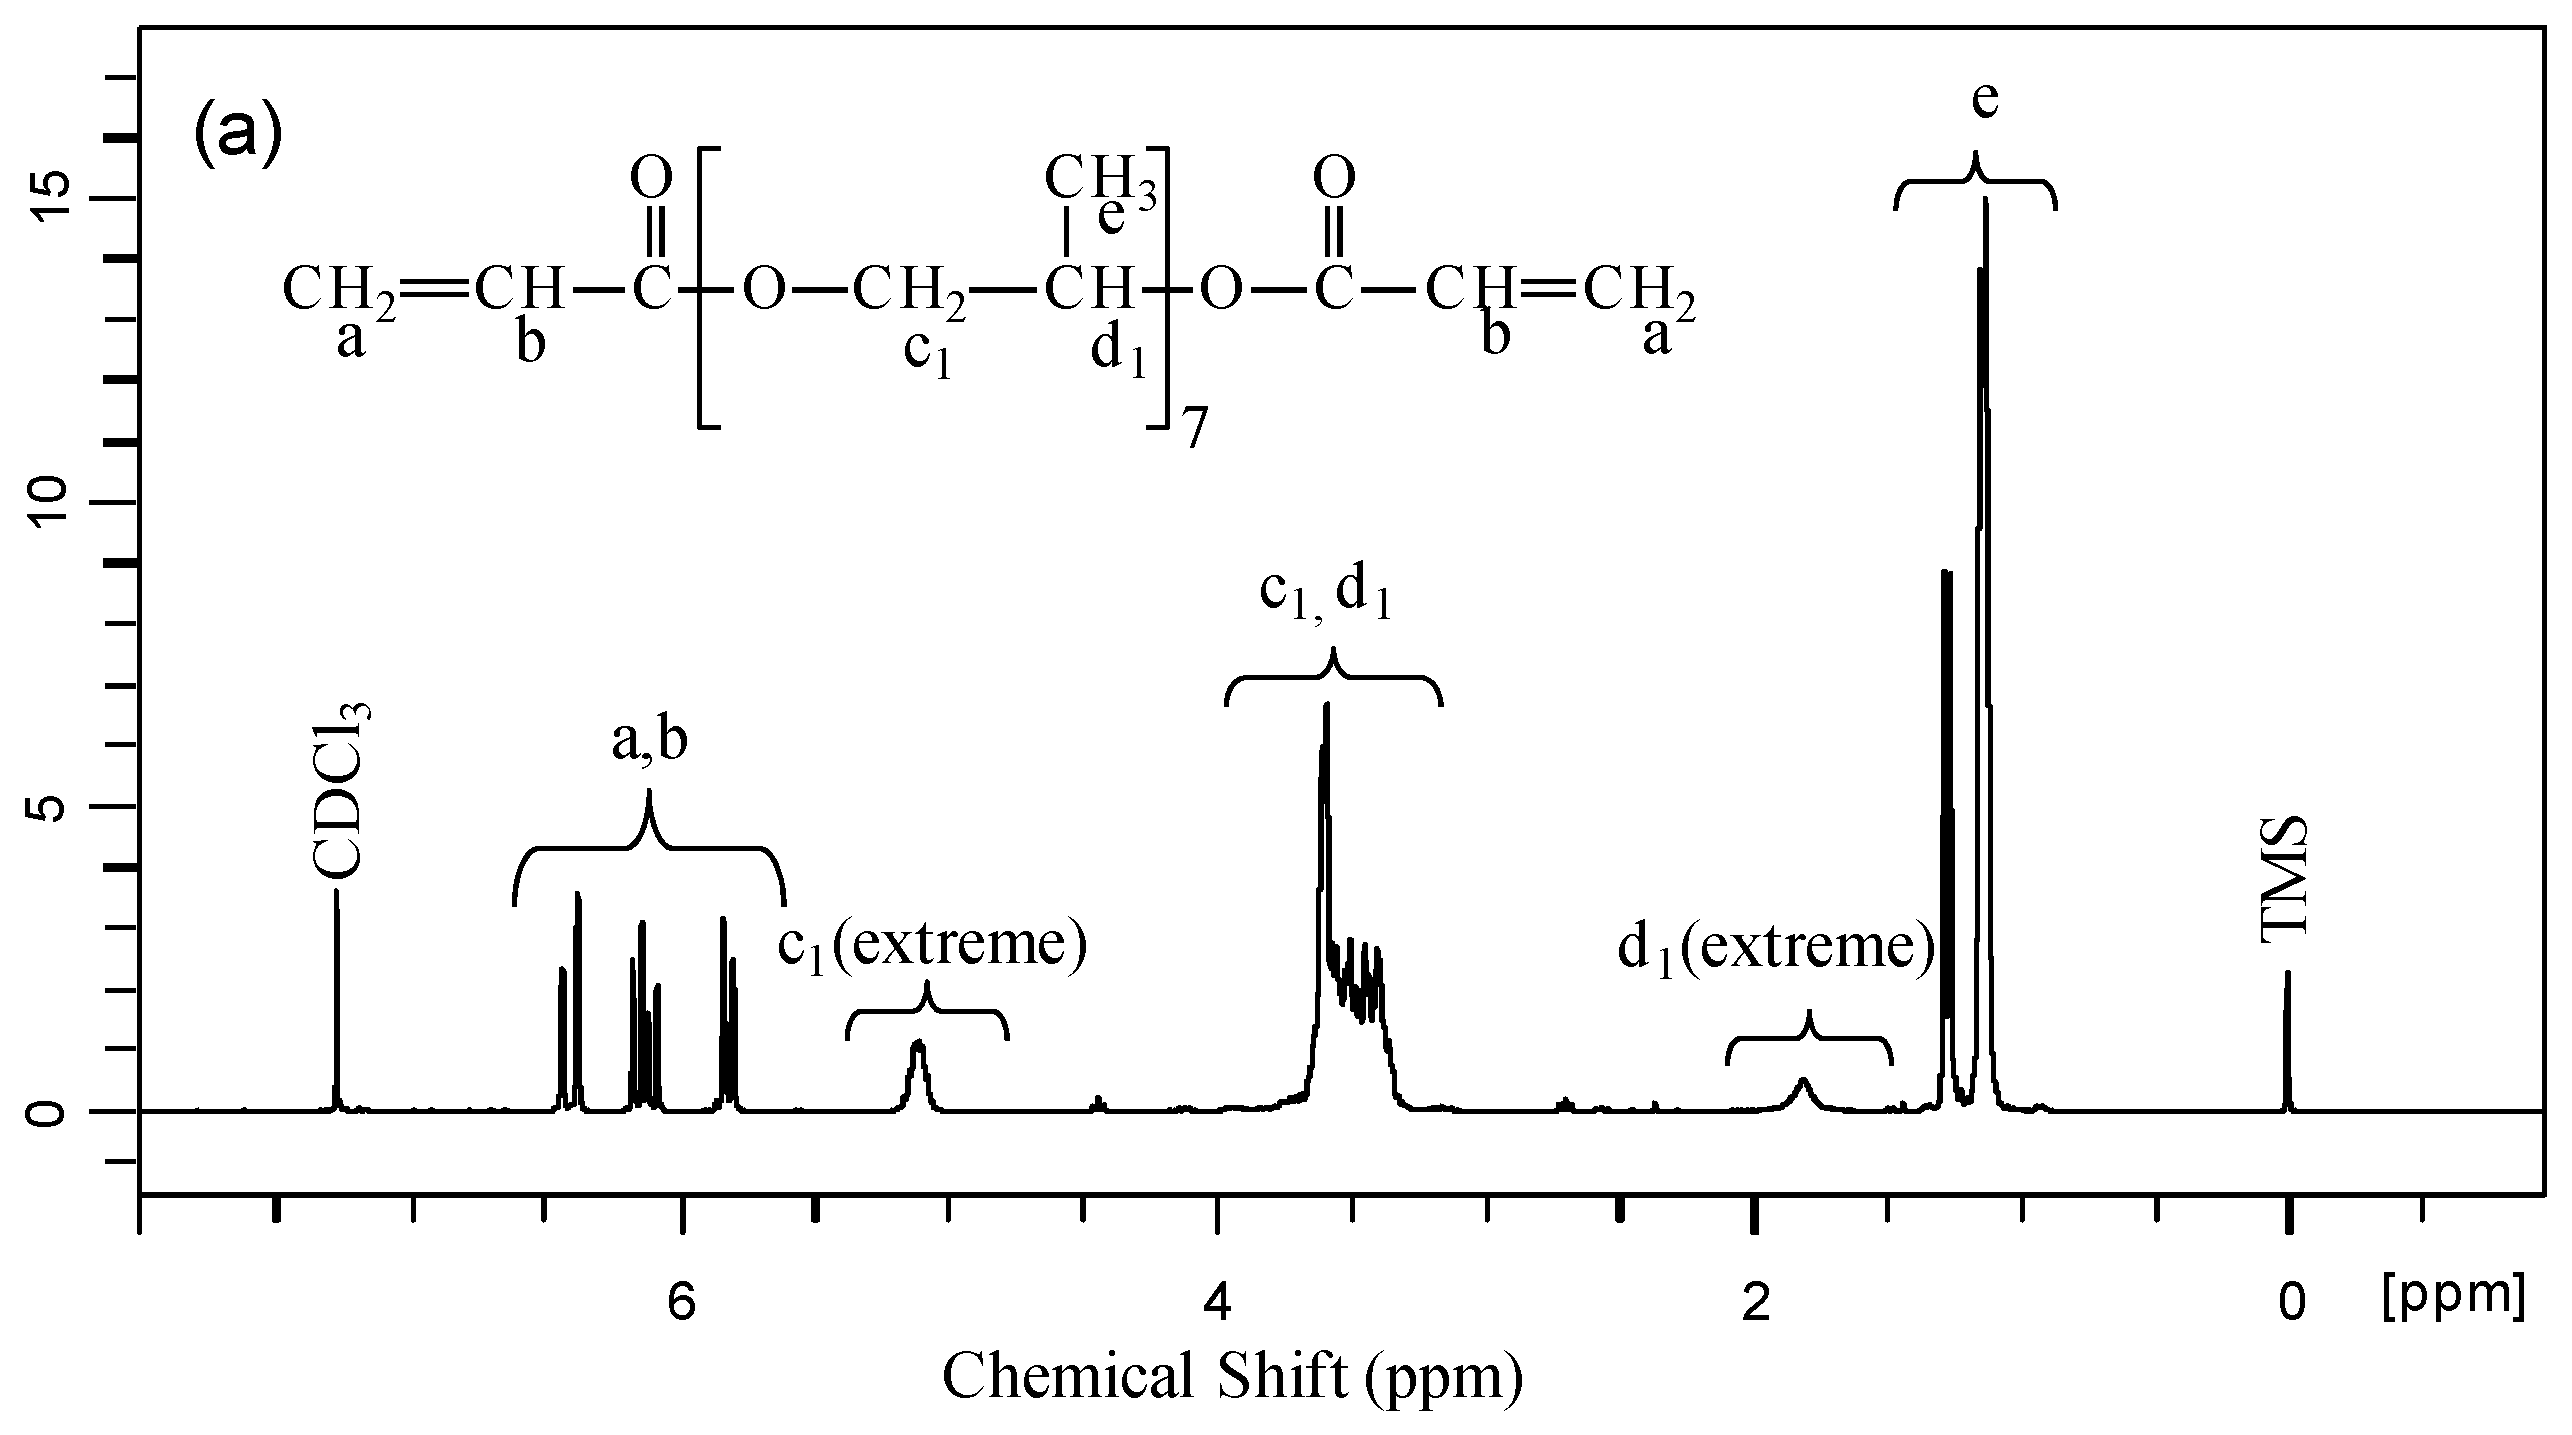
2.2.1. Nuclear Magnetic Resonance Spectroscopy

To determine the chemical composition of the monomers and the number of repetition units, we utilized the proton nuclear magnetic resonance technique (1H-NMR). The materials were dissolved in deuterated solvent, specifically deuterated chloroform ( C D C l 3 ) (10 mg/mL). The 1H-NMR spectra were recorded on a Bruker AC300 spectrometer (Bruker, Billerica, MA, USA) operating at 300 MHz. The data are reported in ppm relative to tetramethylsilane (TMS).

2.2.2. Gel Permeation Chromatography

The monomers were dissolved in THF at a concentration of 3 mg/mL. The gel permeation chromatography (GPC) technique was used to measure the molar masses at T = 25 °C. Waters apparatus, including a Waters 515 pump, a Waters 717 plus auto-sampler, a differential refractometer Waters 410, and Stryragel columns HR3 and HR 3E (WatersTM, Milford, MA, USA), was used for the measurement. The experiment lasted nearly 1 h with a flow rate of 1 mL/min.
The GPC measurements yield distinct peaks based on the retention time of each component. The molar mass of each monomer sample was determined by utilizing the calibration curve polynomial.

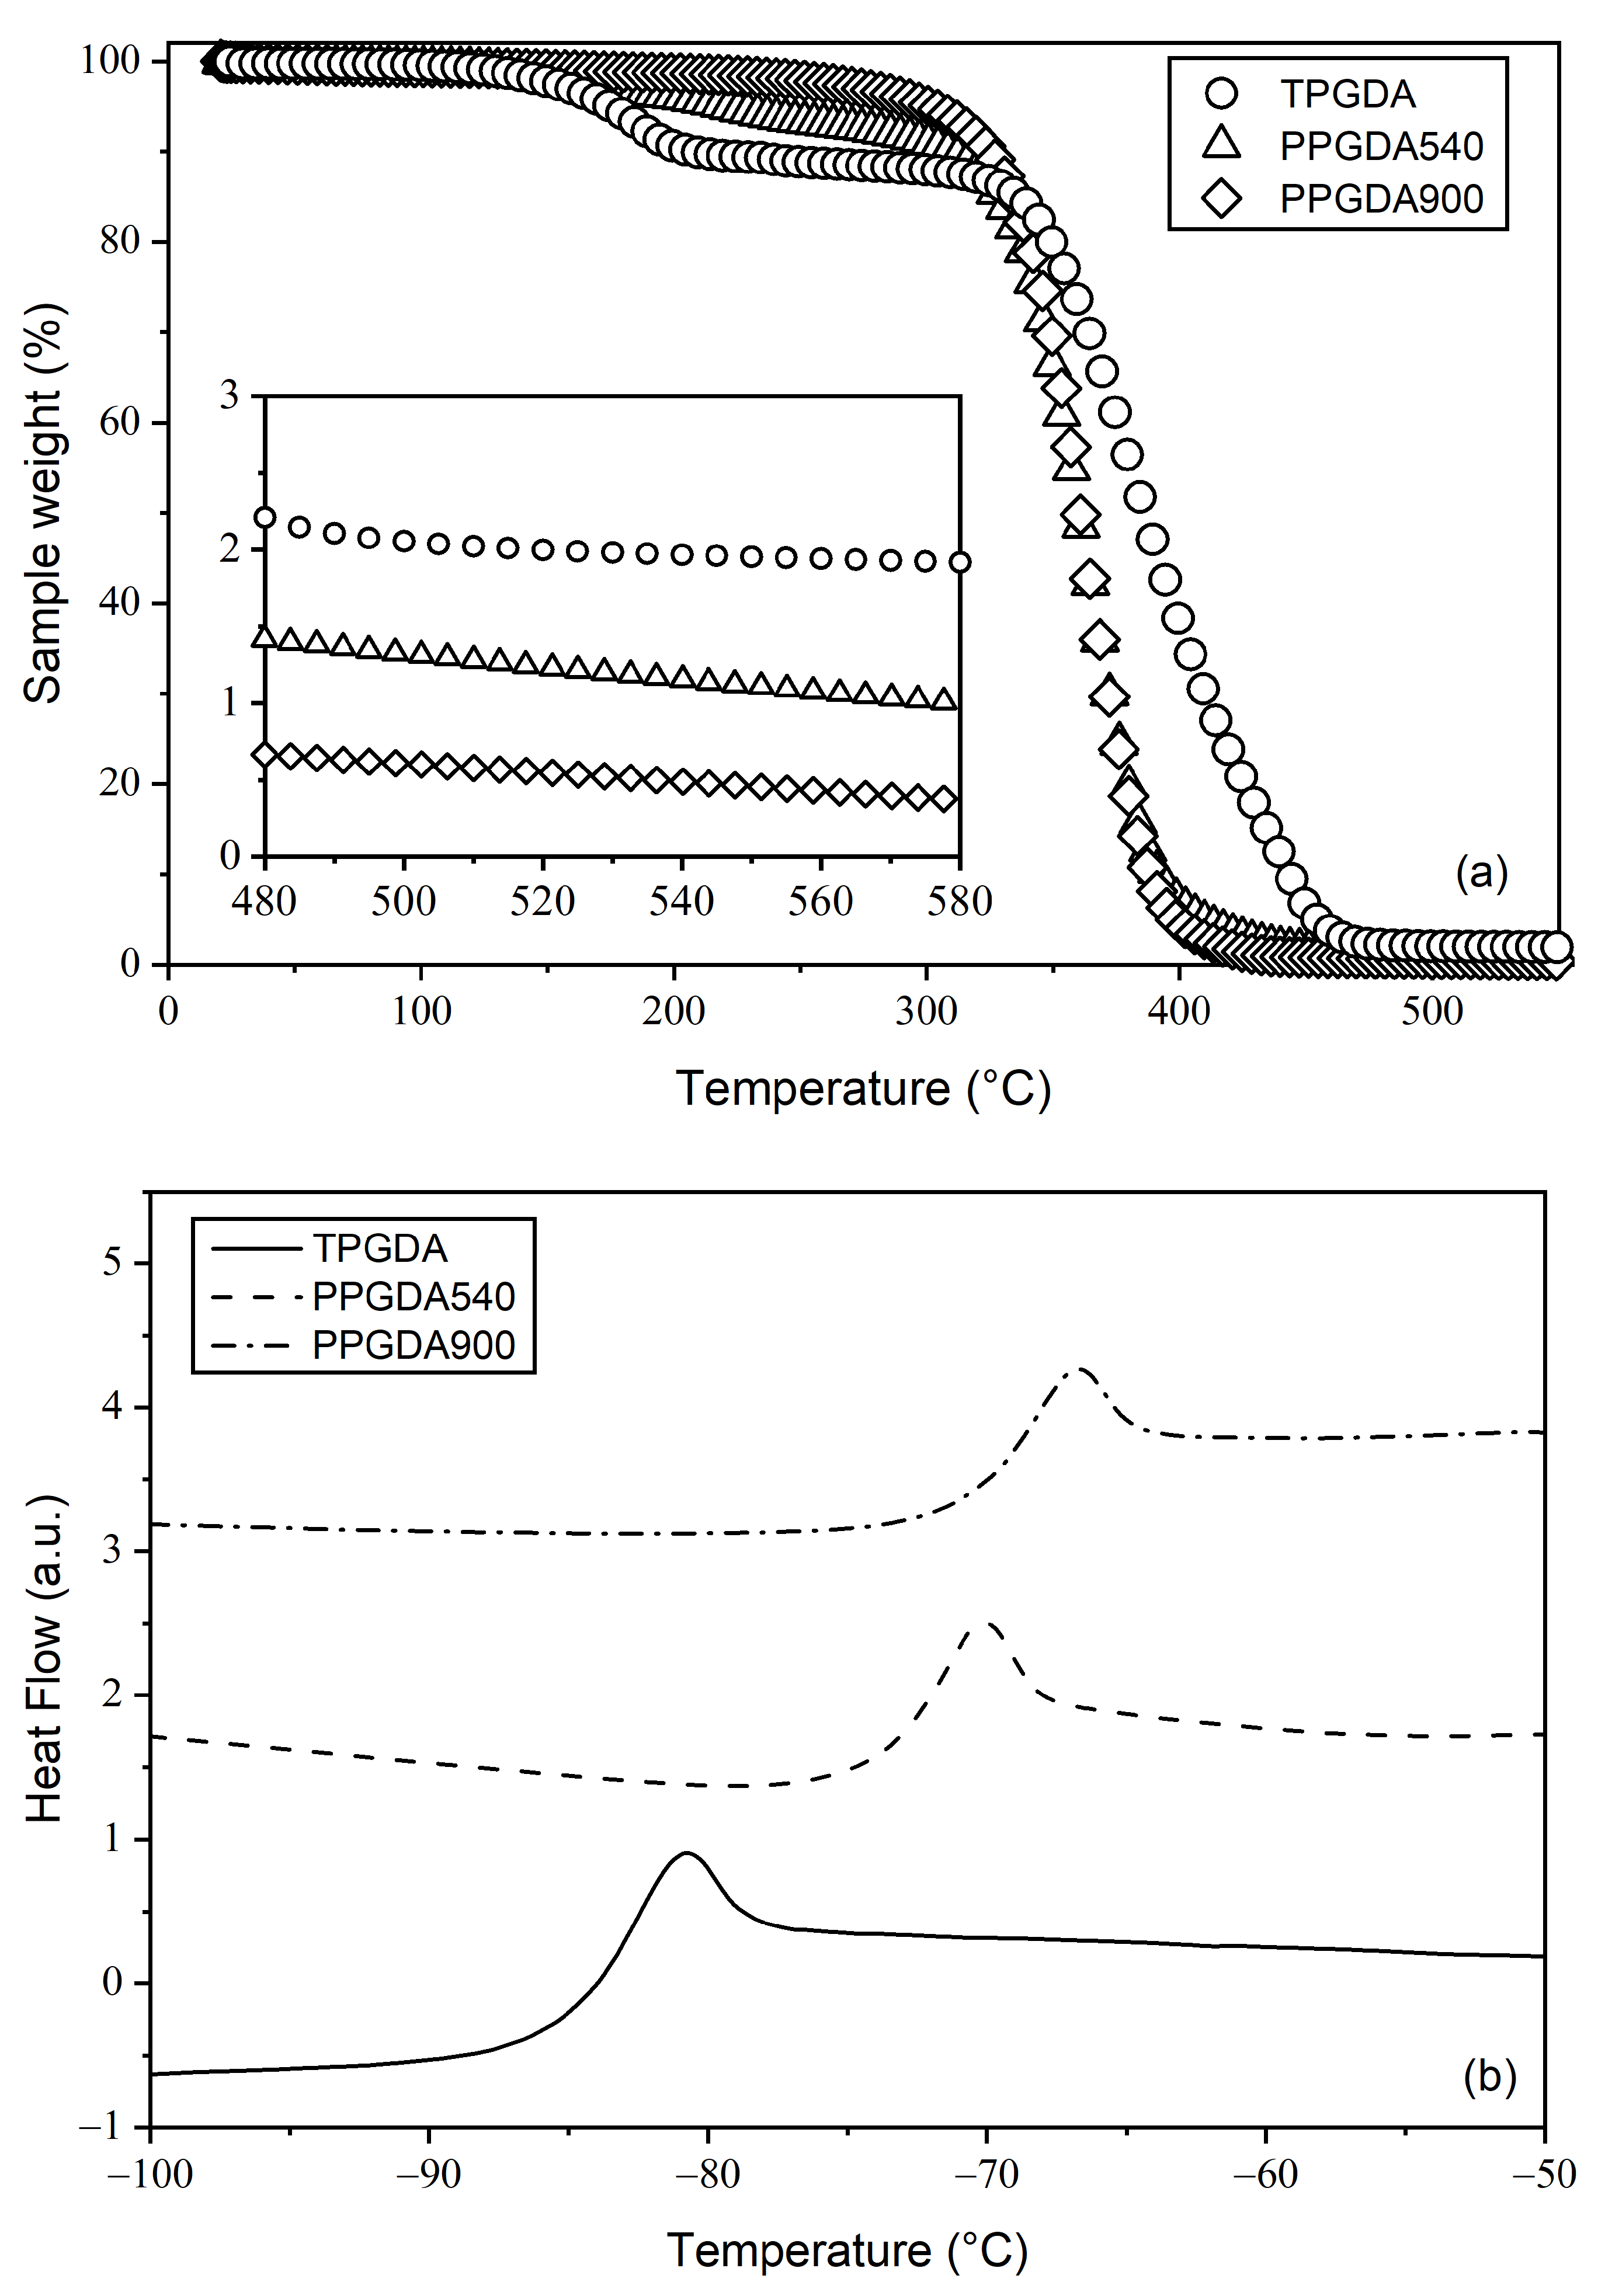
2.2.3. Thermogravimetric Analysis

Thermogravimetric analysis (TGA) was performed using a Perkin Elmer Pyris 1 analyzer (Perkin-Elmer Company, Shelton, CT, USA) with a mass resolution of 1 μg on HT platinum plates. The samples, with an average weight of 8 mg, were analyzed under a nitrogen atmosphere with a flow rate of 20 mL/min. A heating ramp of 10 °C/min was applied to the samples in the temperature range of 25 to 600 °C.
This analysis is informative because it provides data on the critical temperature (TC) of the material at the beginning of the thermal degradation processes. TC is considered as the upper temperature limit for DSC analysis.

2.2.4. Differential Scanning Calorimetry

The thermal properties of monomer and monomer/LC materials were determined using the differential scanning calorimetry (DSC) technique (see, for example, in [34]). DSC measurements were performed on a Seiko DSC 220C (Seiko Instruments Inc., Chiba, Japan) equipped with a liquid nitrogen system for cooling experiments. The DSC cell was purged with 50 mL/min of nitrogen. Heating and cooling rates of 10 °C/min and 30 °C/min, respectively, were used in the temperature range from −120 °C to +100 °C. The program begins by cooling the sample, followed by three cycles of heating and cooling to account for any thermal events related to the sample’s preparation history. The results presented in this work were obtained from the first heating ramps. At least three duplicate samples, with the same composition and prepared independently, were used in each case to verify the reproducibility of the results. The glass transition temperatures (Tg) were determined by taking the midpoint of the transition range in the thermograms.

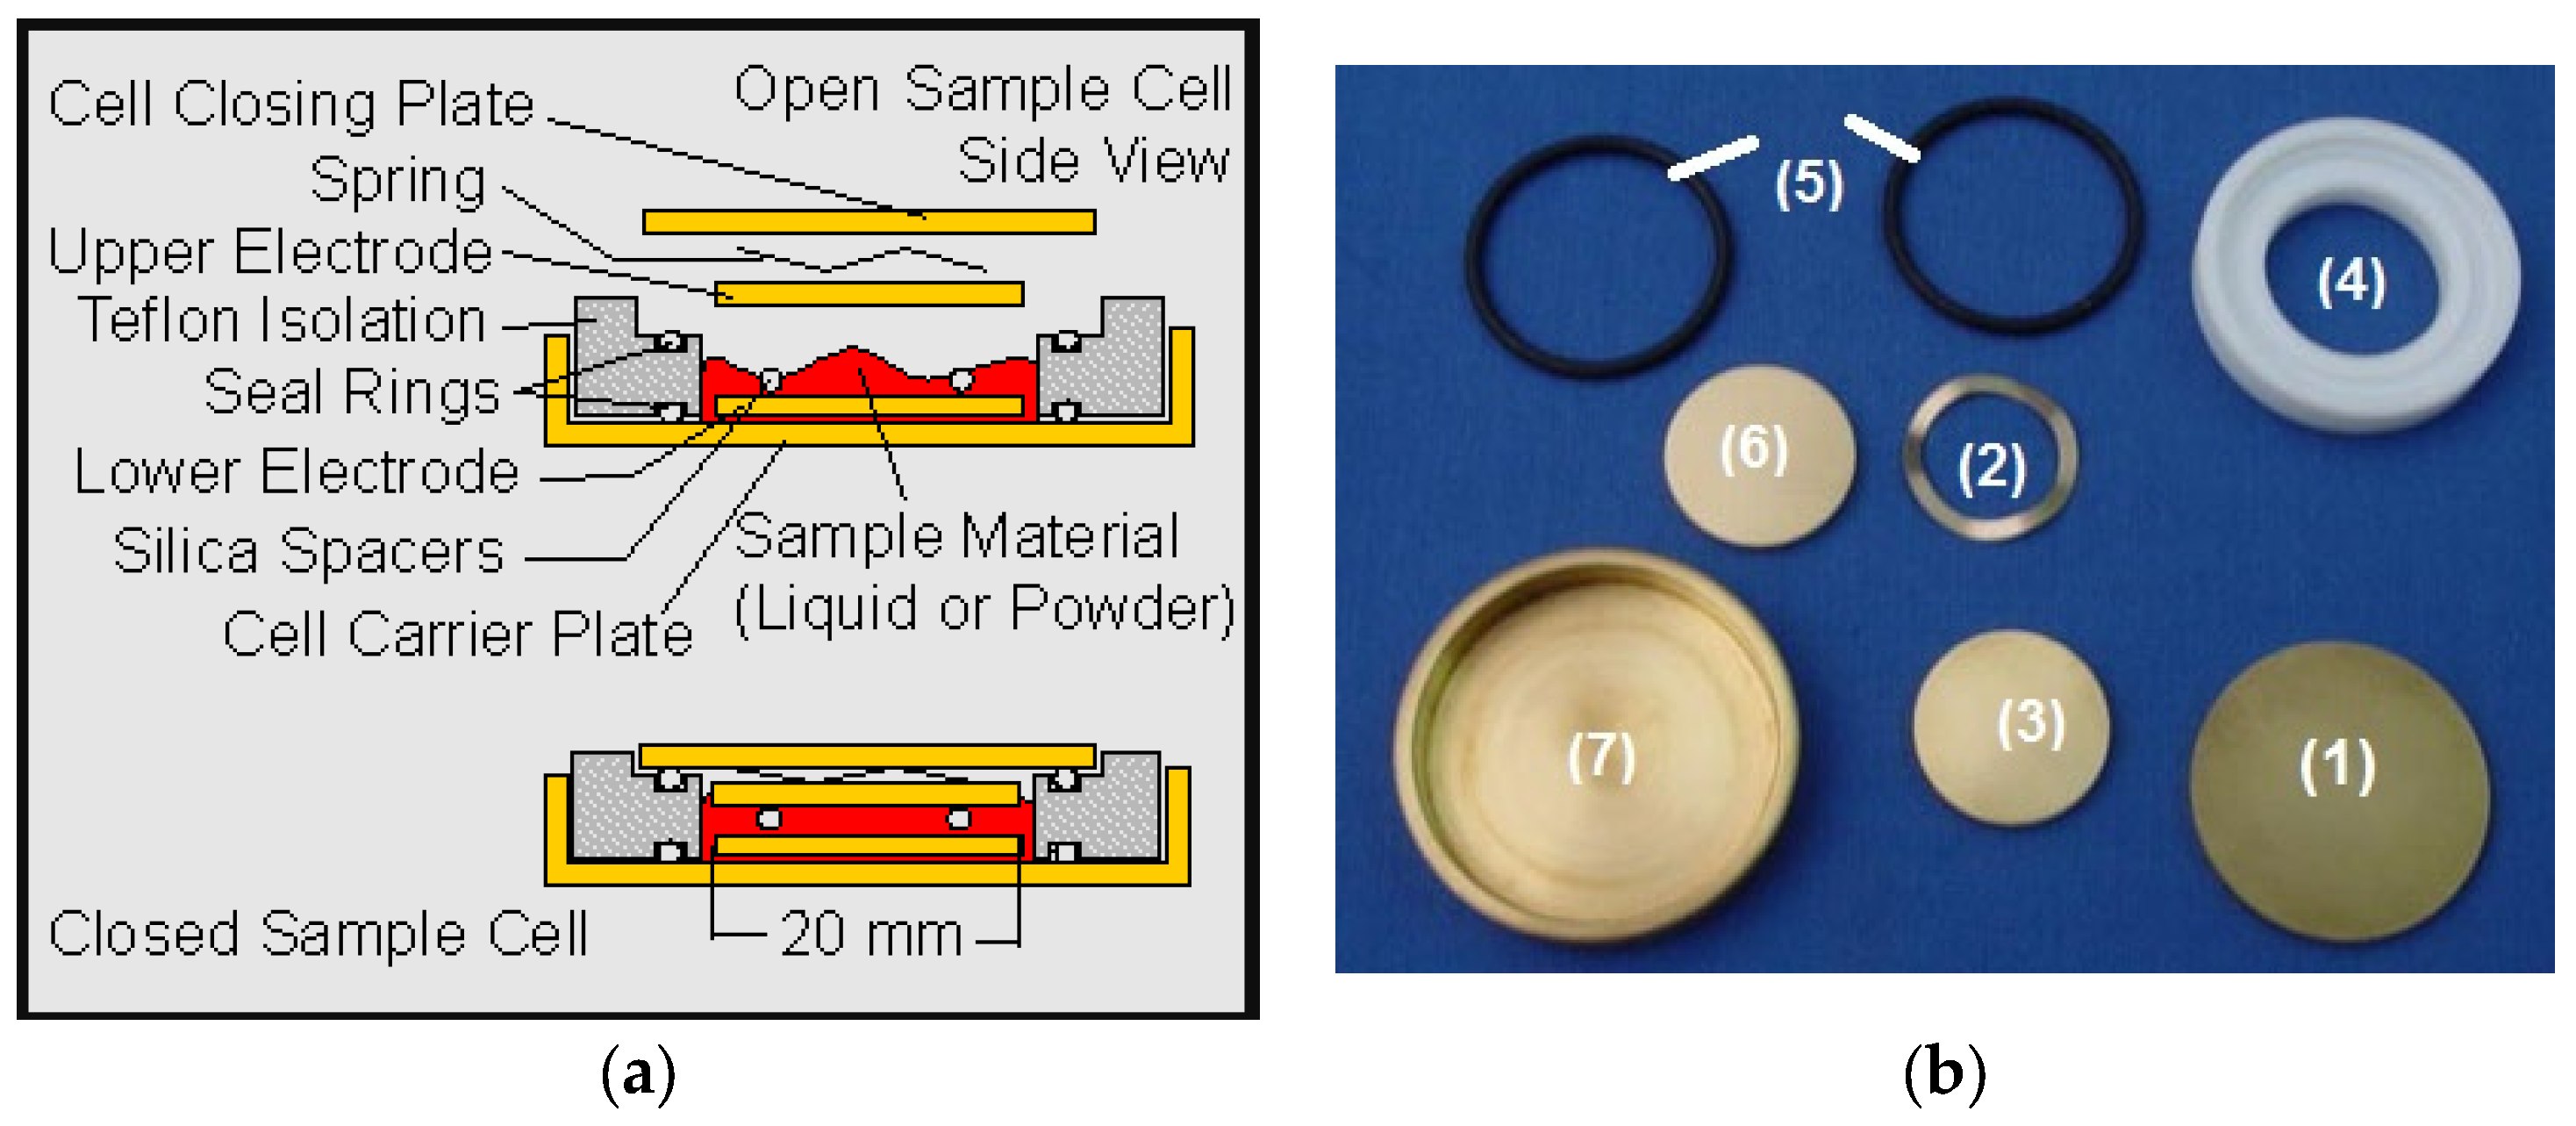
2.2.5. Dielectric Spectroscopy

The dielectric measurement spectroscopy was performed using the Concept 80 dielectric spectrometer from Novocontrol® GmbH (Novocontrol Technologies Company, Montabaur, Germany) (more details are given in [35]). The measurements were performed in the frequency range of 0.1 Hz–1 MHz. The real and imaginary parts of the complex dielectric constant ( ε * = ε j ε ) were calculated from the measured capacitance C m and conductance G m at each frequency f :
ε ( f ) = C m ( f ) C 0
ε ( f ) = G m ( f ) 2 π f C 0
The capacitance of the empty cell C 0 was measured prior to cell filling. The samples were prepared as 50 µm thick films and placed between two polished brass electrodes covered with a thin layer of gold (20 mm in diameter) (see Figure 1). They were then inserted into a temperature-controlled sample cell designed for liquid samples. Temperature was regulated using a nitrogen gas cryostat with a stability of better than 0.1 °C.

3. Results and Discussion

3.1. Chemical and Structural Properties of Materials

The three materials studied belong to the PPGDA monomer family. The repeating unit consists of a poly(propylene) glycol group. The monomer tripropyleneglycol diacrylate (TPGDA) corresponds to n = 3, where n represents the number of repeating units. The other two materials are commercially known as PPGDA540 and PPGDA900.
Figure 2a presents the 1H NMR spectrum obtained from PPGDA540. The spectrum shows three peaks between 5.5 and 6.5 ppm, corresponding to the six acrylic protons (a and b). Protons (d1 extreme) and (c1 extreme) appear between 1.5 and 2 ppm and between 4.5 and 5.5 ppm, respectively. The other protons (c1 and d1) and the methyl protons (e) are observed between 3 and 4 ppm and between 1 and 1.5 ppm, respectively. The 1H-NMR spectra of the TPGDA and PPGDA900 monomers exhibit identical peaks to those shown in Figure 2a. The spectral analysis shows that the TPGDA, PPGDA540, and PPGDA900 monomers correspond to n = 3, 7, and 12, respectively, as determined by calculating and comparing integration ratios.
The molecular weights and molecular weight distributions were determined using the GPC method, in addition to the results obtained by 1H-NMR spectroscopy. This technique can analyze materials of even lower molecular weight by using the appropriate column material [37]. Figure 2b displays the chromatograms of the three monomers. The measured values Mw of the average molecular weight of the three monomers are 460, 765, and 1120 daltons. Figure 2b shows that the monomers have a polydisperse character in terms of their molecular weight distribution.
Figure 3a presents the TGA analysis results for TPGDA, PPGDA540, and PPGDA900. The figure shows that the TPGDA monomer degrades faster than the other monomers. It remains stable up to 140 °C, after which it degrades to 90% of its initial weight between 195 °C and 325 °C, followed by a second degradation. At 465 °C, the TPGDA monomer is almost completely degraded (2% of the initial mass). The initial degradation may be attributed to lower molar masses (see Figure 2b). The residual material (2%) observed at 465 °C can be linked to the presence of inorganic impurities. It is worth noting that the PPGDA540 monomer degrades at a slower rate than the TPGDA monomer. The substance remains stable up to a temperature of 152 °C, after which it undergoes a weight decrease until it loses 12% of its original weight at 313 °C. The material experiences rapid degradation, with complete degradation occurring at 327 °C. The degradation of 12% between 152 to 313 °C suggests the presence of inorganic impurities in the monomer, although less than in TPGDA monomer. The PPGDA900 monomer is the most stable of the three monomers, undergoing a slow decrease rather than a sudden drop. Its degradation begins at 221 °C and reaches total degradation at 443 °C. This monomer also contains inorganic impurities (see Figure 3a).
TGA limits the working temperature range for other analyses, such as DSC and dielectric measurements. During this study, the maximum applied temperature did not exceed 100 °C. Upon closer examination in Figure 3a (450 °C–600 °C), it is observed that the concentration of inorganic impurities varies inversely with the molecular weight of the monomers.
Figure 3b presents DSC thermograms for the three monomers, which clearly show glass transitions with different Tg values. The glass transition temperature of TPGDA, PPGDA540, and PPGDA900 were found to be −85 °C, −74 °C and −70 °C, respectively. The increase in Tg with the monomeric chain length is in good agreement with the classical behavior of low-molecular-weight polymeric chains. The relationship between Tg and MW can be described by the well-known Fox–Flory equation [38].

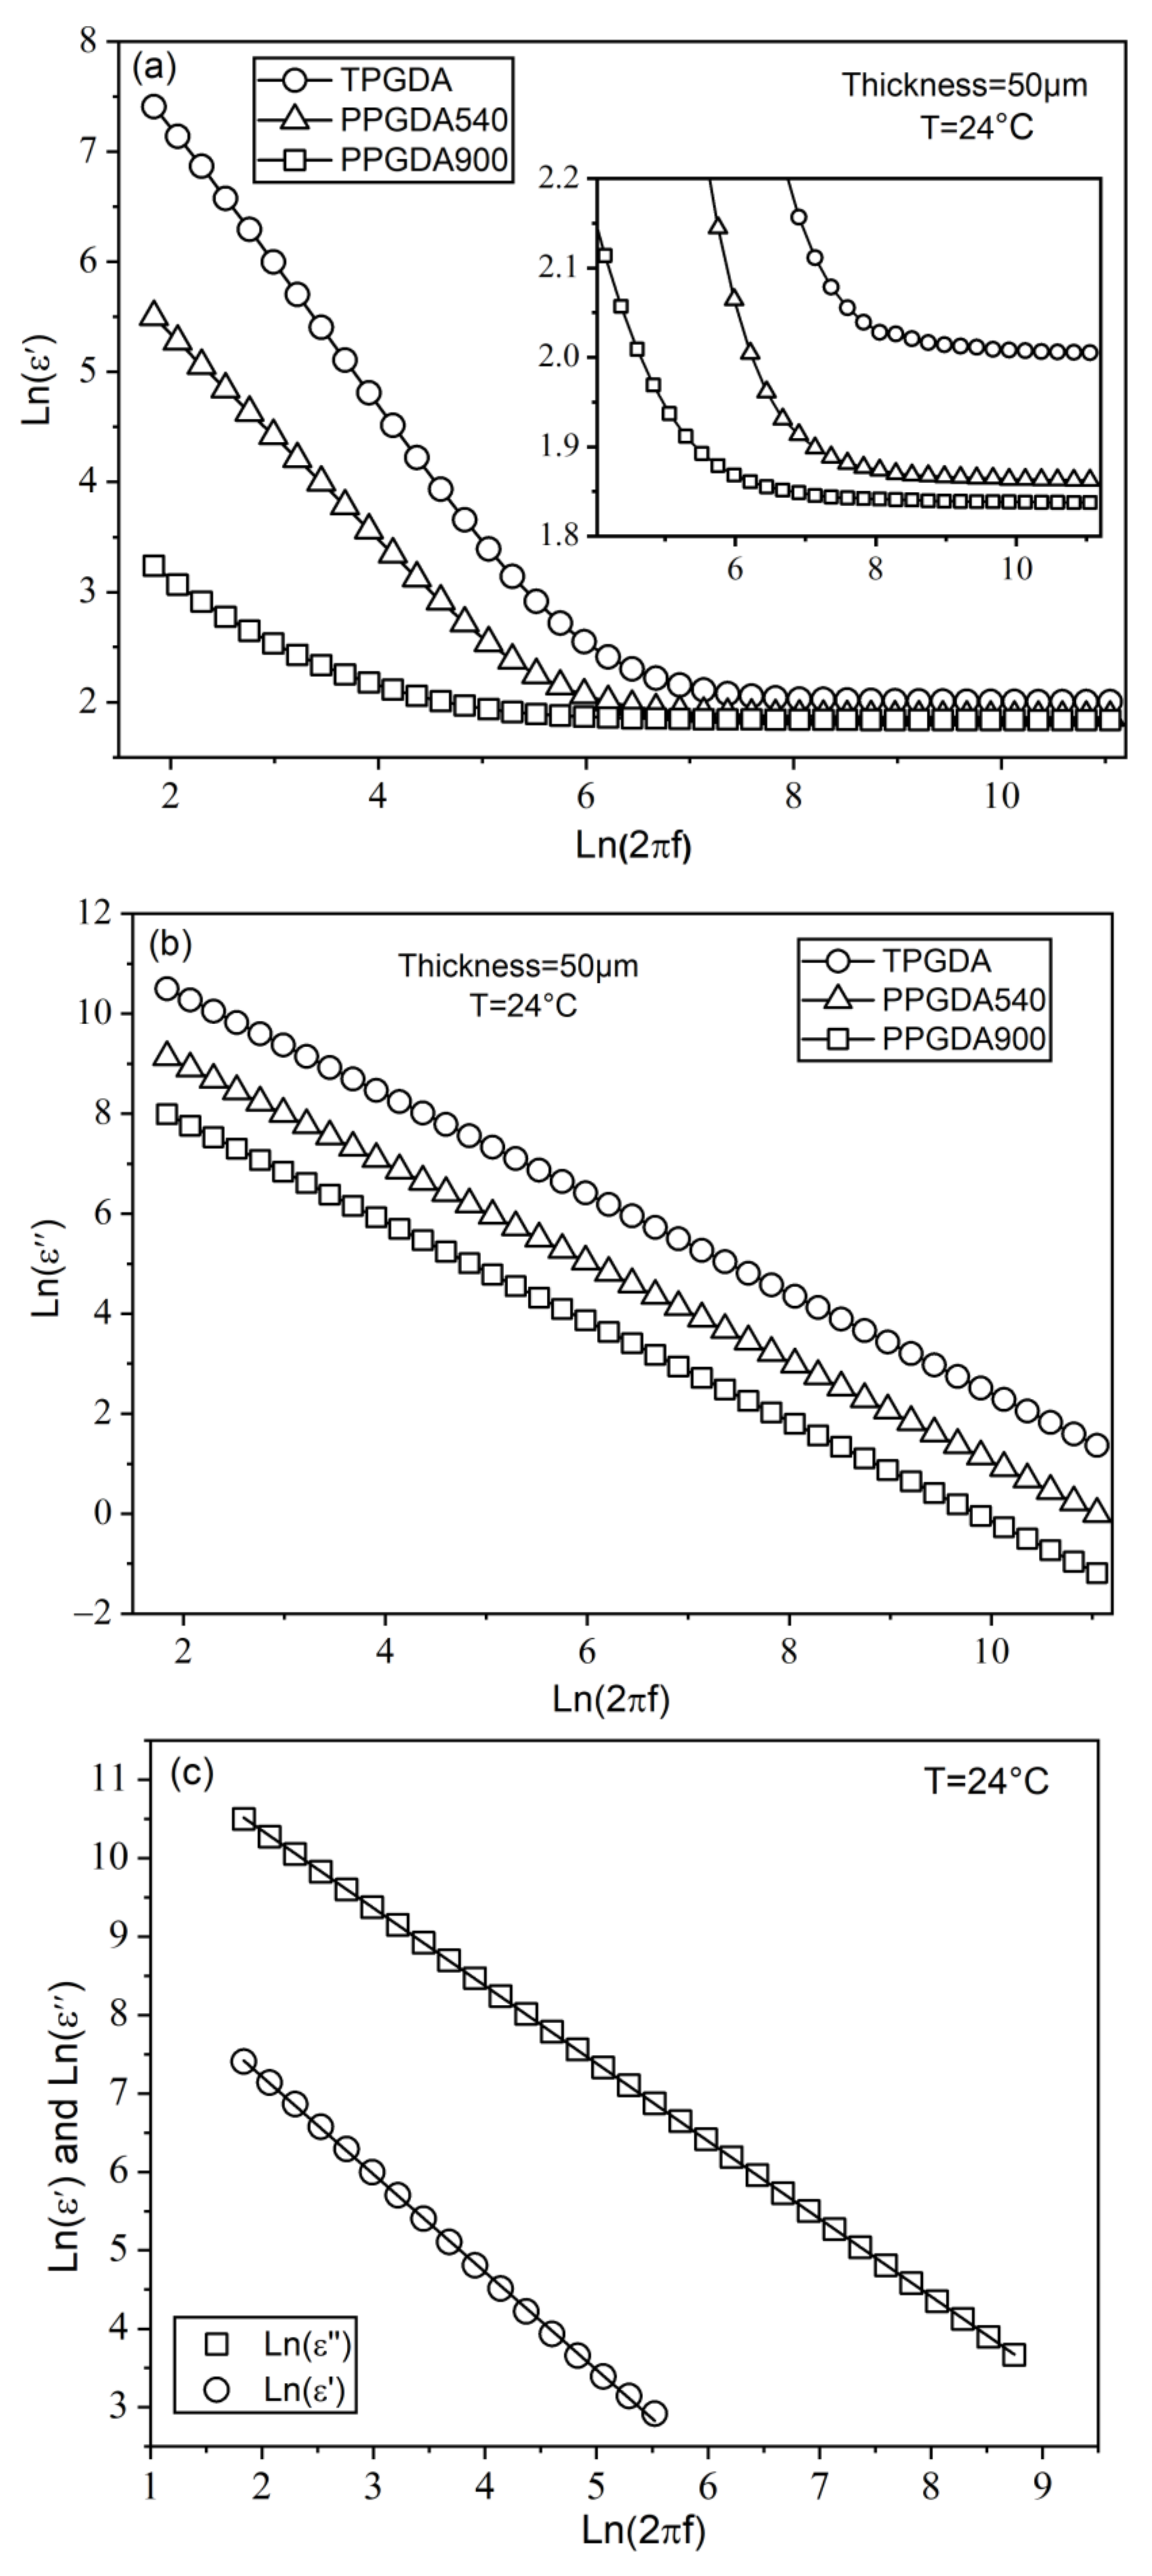
3.2. Dielectric Characterization

As an example, Figure 4a,b present the results of dielectric measurements at room temperature. Two contributions to the dielectric response [39,40,41,42] can be distinguished: the first concerns the response of the dipolar moment ( ε d * ) and the second is linked to the contribution of ionic impurities (conductivity) ( ε i o n * ) . On the l n   ( ε (f)) plot for TPGDA for example (Figure 4a), two distinct behaviors are evident: at high frequencies (f > 1 kHz), ε remains constant and measures the static dielectric constant of the monomer (dipolar moment response), with a value of 7.4. At low frequencies, ε increases as f decreases due to the accumulation of ionic charges near the electrodes. The contribution of ions can also be observed on the ε ( f ) plot, specifically in the linear range between 1 Hz and 10 kHz. It is important to note that none of the three monomers exhibit a relaxation process in the studied frequency range at room temperature. This includes the absence of the α relaxation process due to the low Tg of these monomers in comparison to room temperature.

3.3. Conductivity

The dielectric spectra typically describe the ionic contribution using the following formulas [39].
ε i o n = A 2 π f m + 1 σ ε 0 2
ε i o n = σ 2 π f ε 0 B 2 π f m + 1 σ ε 0 2
where σ represents the ionic conductivity, and A and B are constants that depend on the interface between monomer and electrodes. They take into account the effects of electrode polarization, ε0 is the dielectric permittivity of vacuum, and m is a real number between 0 and 1. Figure 4c shows the experimental plots of l n ( ε ) and l n ( ε ) as a function of l n ( 2 π f ) . When the plot of l n ( ε ) versus l n ( 2 π f ) yields a linear relationship, and its slope is equal to –1, the conductivity σ will only be ionic (see for example Figure 3.1a and 3.16a in reference [30]). The data in Figure 4b and the top curve in Figure 4c, as representative examples, exhibit slopes equal to −1, which is also the case for all other samples examined. This indicates the absence of electrode polarization effects and other phenomena. As a result, only the contribution of the ionic conductivity in σ is present. Equations (3) and (4) were simultaneously applied in the fitting procedure of the experimental data, allowing for the extraction of the different parameters A, B, m, and σ. On the right-hand side of Equation (4), it was found that the weight of the right term (( B 2 π f m + 1 σ ε 0 2 ) is much smaller than that of the left term ( σ 2 π f ε 0 ) .
As a result, Figure 4d presents the Arrhenius plot of the monomers, displaying the temperature-dependent evolution of the calculated ionic conductivity, which increases with temperature. The curves of the three monomers exhibit a curve-like behavior below a certain temperature, which becomes nearly linear above that temperature. The non-linearity of the Arrhenius plot has been reported in several papers and indicates that the ionic transport is correlated with the segmental motion of the polymer chain [40,41,42]. In this case, the results can be more effectively represented by using the VTF equation (Equation (5)).
σ = σ 1 T 1 2 e x p E v k ( T T 0 )
where T is the absolute temperature; σ 1 , E v and T 0 are the fitting constants; k represents the Boltzmann constant; and σ 1 stands for a pre-exponential factor, which is related to the number of charge carriers. E v is the pseudo-activation energy, and T 0 is the critical temperature (ideal glass transition) at which the conductivity becomes zero [43]. Typically, T 0 is set to be 30 50   K below T g . The T g values were obtained from DSC measurements. T 0 was calculated as T 0 = T g   40 K. Figure 4e,f show the plot of L n ( σ T 1 2 ) versus 1000 T T 0 for the three monomers and the PPGDA900/E7 mixtures as examples. The data indicate a strong correlation between the VTF theory and the low-temperature data. However, in the high-temperature region (I), the curve deviates from the VTF equation. The transition from the VTF equation to the Arrhenius equation is clearly visible in this region. This behavior is commonly observed in polymer electrolyte systems. The data in region (I) can be fitted using the Arrhenius equation:
σ = σ 0 e x p E a k T
where σ 0 is the pre-exponential factor, and E a stands for the activation energy of the thermally activated process. The values obtained for the TPGDA monomer are σ 0 = 0.21 × 10 1 S / m and E a = 0.230   e V . The fitting parameters obtained from the Arrhenius and VTF equations for the three monomers are shown in Table 1, and those for the monomer/E7 mixtures are presented in Table 2.
To complete this section on conductivity, it is assumed that the ionic diffusion phenomena can be described by Iwamoto’s non-linear model for ionic hopping [25]. Iwamoto’s model considers the presence of a diffusion process and an electrostatic interaction between ions, while also assuming the absence of a space-accumulating charge field at the electrodes. The dielectric spectra are described by the following equations:
ε 8 q 2 L 2 π 4 k T ε 0 × n i o n 1 1 + x 2 + 1 81 + x 2 + 1 625 + x 2 + ε s
ε 8 q 2 L 2 π 4 k T ε 0 × n i o n x 1 + x 2 + x 9 81 + x 2 + x 25 625 + x 2
where x = ( 2 L 2 / π D ) f , n i o n is the ionic concentration, q represents the electronic charge, D stands for the diffusion constant, L is the cell thickness, and T corresponds to the environmental temperature. Figure 4a,b present the experimental plots of ε and ε as a function of frequency for PPGDA monomers and PPGDA/E7 mixtures at room temperature (T = 24 °C). The fits in the range of 1–1000 Hz show good agreement with Equations (7) and (8), allowing us to extract different parameters such as n i o n and D . The spectra ε and ε were fitted together using Origin software. Table 3 and Table 4 report the calculated values of D and n i o n .
Figure 5 displays the relationship between the ionic concentration n i o n and the diffusion constant D, as a function of the molecular weight of the monomers at 24 °C. The plots show that as the molecular weight increases, both the ionic concentration and diffusion constant decrease. The decrease in the mobility of the monomer chain with higher molecular weight is likely responsible for the latter effect. The findings align with the thermal diffusion behavior observed in the binary aqueous solutions studied by Kishikawa et al. [44]. The relationship between D and the mobility (electrophoretic mobility) η is given by D = ( k T / q ) η. It can be inferred that the movement of the chain facilitates ionic migration towards the electrodes. The concentration of impurities in the monomers may be linked to the residues observed on the TGA analysis (inset of Figure 3a).
Figure 6 displays the variation of ionic concentrations ( n i o n ) in the monomer/LC mixtures as a function of the E7 concentration for the three PPGDA compounds. The decrease in the concentration of impurity observed when adding E7 to the three monomers can be attributed to the significantly lower ionic concentration of the pure LC compared to that of the monomers.

4. Conclusions

This report investigates some of the thermophysical and dielectric responses of PPGDA monomers as a function of their molecular weight, as well as PPGDA mixed with nematic LCs E7. The molecular weights of the three monomers, TPGDA, PPGDA540, and PPGDA900, were determined using 1H-NMR analysis and found to be 350, 520, and 870 g.mol−1, respectively. These data represent average values, as the GPC analysis revealed some polydispersity effects on the molecular weights. The TGA analysis indicated that all monomers are thermally stable up to 100 °C. The residues at the end of each experiment (at 600 °C) are likely to be of inorganic nature. DSC analysis of the monomers showed increasing Tg values as the molecular weight increased.
The static dielectric permittivity increases in the following order: PPGDA900, PPGDA540, and TPGDA. This can be explained by the higher dipole moment of TPGDA, which is caused by an enhanced volume density of carbonyl groups [7,8].
The electrical conductivity of the PPGDA and PPGDA/E7 blends was modeled using the Arrhenius and VTF models, both of which are applicable in describing the effects of conductivity in acrylic systems. The concentrations of ionic impurities and diffusion constants were estimated using the ionic hopping model. This approach shows that the ionic impurities and diffusion constants are inversely proportional to the molecular weight of PPGDA.
The investigation concludes that all monomer/LC blends contain ionic impurities, which can result in significant electrical conductivities. This may have a negative impact on the electro-optical properties of the resulting PDLC materials. The data presented in Figure 6 demonstrate a significant difference in ion concentrations between pure monomers and monomer/E7 blends. Consequently, the monomers have a much higher ionic content than E7. Therefore, it is essential to perform thorough purification procedures on the monomers to remove any ions before using them in PDLC materials.

Author Contributions

Conceptualization, Y.D. and U.M.; methodology, Y.D. and U.M.; investigation, T.B., Y.D., L.S.; formal analysis, F.D., A.B., Z.B.; data curation, T.B., L.S., Y.D.; writing—original draft preparation, Y.D.; writing—review and editing, F.D. and U.M.; visualization, A.B. and Z.B.; supervision, U.M.; project administration, U.M. All authors have read and agreed to the published version of the manuscript.

Funding

This research received no external funding.

Data Availability Statement

Data are contained within the article.

Acknowledgments

The authors gratefully acknowledge the support of the Algerian Ministry of Higher Education and Scientific Research (MESRS), the General Directorate of Scientific Research and Technological Development (DGRSDT) of Algeria, the University of Djelfa/Algeria, the French Ministry of Higher Education and Research (MENESR), the CNRS, and the University and the CROUS of Lille/France.

Conflicts of Interest

The authors declare no conflicts of interest.

Nomenclature

C m Capacitance (F)
E a Activation energy (eV)
E v Pseudo-activation energy (eV)
f Frequency (Hz)
G m Conductance ( S )
k Boltzmann constant ( k = 8.617 × 10 5 e V . K 1 )
M w Molecular weight (g.mol−1)
qElectronic charge ( q = 1.602 × 10 19 C )
T g Glass transition temperature (K)
ε ( f ) Relative permittivity spectrum
ε ( f ) Loss factor spectrum
ε 0 Permittivity of free space ( ε 0 = 885 × 10 14 F . m 1 )
σ Conductivity (S.m−1)
σ 1 Pre-exponential factor ( S . K 1 / 2 . m 1 )
TPGDATri(propylene glycol) diacrylate (n = 3, CAS Number: 42978-66-5)
PPGDA540Poly(propylene glycol) diacrylate (n = 7, CAS Number: 52496-08-9)
PPGDA900Poly(propylene glycol) diacrylate (n = 12, CAS Number: 52496-08-9)

References

  1. Bronnikov, S.; Kostromin, S.; Zuev, V. Polymer-Dispersed Liquid Crystals: Progress in Preparation, Investigation, and Application. Soft Mater. 2013, 52, 1718–1735. [Google Scholar] [CrossRef]
  2. Sasani Ghamsari, M.; Carlescu, I. An overview of polymer-dispersed liquid crystals composite films and their applications. In Liquid Crystal and Display Technology; IntechOpen: London, UK, 2020; Chapter 2; p. 11. [Google Scholar]
  3. Jeon, Y.-J.; Bingzhu, Y.; Rhee, J.-T.; Cheung, D.-L.; Jamil, M. Application and new developments in polymer-dispersed liquid crystal simulation studies. Macromol. Theory Simul. 2007, 16, 643–659. [Google Scholar] [CrossRef]
  4. Maschke, U.; Coqueret, X.; Benmouna, M. Electro-Optical Properties of Polymer-Dispersed Liquid Crystals. Macromol. Rapid Commun. 2002, 23, 159–170. [Google Scholar] [CrossRef]
  5. Saeed, M.H.; Zhang, S.; Cao, Y.; Zhou, L.; Hu, J.; Muhammad, I.; Xiao, J.; Zhang, L.; Yang, H. Recent advances in the Polymer Dispersed Liquid Crystal Composite and its Applications. Molecules 2020, 25, 5510. [Google Scholar] [CrossRef]
  6. Islam, M.S.; Chan, K.-Y.; Thien, G.S.H.; Low, P.-L.; Lee, C.-L.; Wong, S.K.; Noor, E.E.M.; Au, B.W.-C.; Ng, Z.-N. Performances of Polymer-Dispersed Liquid Crystal Films for Smart Glass Applications. Polymers 2023, 15, 3420. [Google Scholar] [CrossRef] [PubMed]
  7. Derouiche, Y.; Koynov, K.; Dubois, F.; Douali, R.; Legrand, C.; Maschke, U. Optical, electro-optical, and dielectric properties of acrylic tripropyleneglycol based polymer network systems including LCs. Mol. Cryst. Liq. Cryst. 2012, 561, 124–135. [Google Scholar] [CrossRef]
  8. Derouiche, Y.; Dubois, F.; Douali, R.; Legrand, C.; Maschke, U. Some properties of nematic liquid crystal E7/acrylic polymer networks. Mol. Cryst. Liq. Cryst. 2011, 541, 201–210. [Google Scholar] [CrossRef]
  9. Garbovskiy, Y.; Glushchenko, I. Nano-objects and ions in liquid crystals: Ion trapping effect and related phenomena. Crystals. 2015, 5, 501–533. [Google Scholar] [CrossRef]
  10. Neyts, K.; Beunis, F. Ion transport in liquid crystals. In Handbook of Liquid Crystals, 2nd ed.; Goodby, J.W., Tschierske, C., Raynes, P., Gleeson, H., Kato, T., Collings, P.J., Eds.; Wiley-VCH Verlag GmbH & Co. KGaA.: Weinheim, Germany, 2014; Volume 2, Part 1, Chapter 11. [Google Scholar]
  11. Wojnarowska, Z.; Lange, A.; Taubert, A.; Paluch, M. Ion and proton transport in aqueous/nonaqueous acidic ionic liquids for fuel-cell applications-insight from high-pressure dielectric studies. ACS Appl. Mater. Interfaces 2021, 13, 30614–30624. [Google Scholar] [CrossRef]
  12. Kumbhakar, K.; Pham, T.-D.; Lee, K.-K.; Kwak, K.; Cho, M. Dielectric relaxation spectroscopy for the characterization of ion transport in solid polymer electrolytes in Li-ion cells. Electrochim. Acta 2023, 462, 142759. [Google Scholar] [CrossRef]
  13. Dan, L.; Zhang, K.; Huang, Z.; Wang, F.; Wang, Q.; Li, J. Molecular-level evaluation of ionic transport under external electric fields in biological dielectric liquids. J. Mol. Liq. 2021, 340, 116883. [Google Scholar] [CrossRef]
  14. Cîrcu, V.; Ganea, C.P.; Secu, M.; Manaila-Maximean, D.; Marinescu, G.C.; Popescu, R.G.; Pasuk, I. Columnar Liquid Crystals of Copper (I) Complexes with Ionic Conductivity and Solid State Emission. Molecules 2023, 28, 4196. [Google Scholar] [CrossRef] [PubMed]
  15. Raymond, M.H.; Ronald, G.O.; St-Onge, H. The Dielectric Properties of Silicone Fluids. IEEE Trans. Dielectr. Electr. Insul. 1977, EI-12, 360–370. [Google Scholar]
  16. Mazuki, N.F.; Kufian, M.Z.; Saari, M.M.; Samsudin, A.S. Influencing of [EDIMP]TFSI in PMMA-PLA doped LiTFSI based hybrid gel polymer electrolyte on the variation in crystallinity phase and ionic conduction properties. J. Non-Cryst. Solids 2023, 621, 122634. [Google Scholar] [CrossRef]
  17. Tominaga, Y.; Tsunesada, N.; Miura, S.; Kodama, H.; Furukawa, T. Dielectric relaxation and ionic conduction in solid polymer electrolyte based on a random copolymer of ethylene carbonate and ethylene oxide. Electrochim. Acta 2023, 465, 142995. [Google Scholar] [CrossRef]
  18. Tian, L.; Wang, M.; Liu, Y.; Su, Z.; Niu, B.; Zhang, Y.; Dong, P.; Long, D. Multiple ionic conduction highways and good interfacial stability of ionic liquid-encapsulated cross-linked polymer electrolytes for lithium metal batteries. J. Power Sources 2022, 543, 231848. [Google Scholar] [CrossRef]
  19. Jeon, H.; Kim, D. Simultaneous establishment of high conductivity and mechanical stability via pore-filling of porous PTFE substrate with poly(ethylene glycol) and ionic liquid for lithium secondary battery. J. Membr. Sci. 2021, 624, 119029. [Google Scholar] [CrossRef]
  20. Lufrano, E.; Coppol, L.; Nicotera, I.; Simari, C. UV-cured gel polymer electrolytes based on poly(ethylene glycol) and organo-modified nanoclays for lithium ions batteries. Appl. Clay Sci. 2023, 246, 107163. [Google Scholar] [CrossRef]
  21. Hamrahjoo, M.; Hadad, S.; Dehghani, E.; Salami-Kalajahi, M.; Roghani-Mamaqani, M. Poly(poly(ethylene glycol) methyl ether methacrylate-co-acrylonitrile) gel polymer electrolytes for high performance lithium ion batteries: Comparing controlled and conventional radical polymerization. Eur. Polym. J. 2022, 173, 111276. [Google Scholar] [CrossRef]
  22. Costa, M.-R.; Altafim, R.A.C.; Mammana, A.-P. Ionic impurities in nematic liquid crystal displays. Liq. Cryst. 2001, 28, 1779–1783. [Google Scholar] [CrossRef]
  23. Son, J.-H.; Park, S.B.; Zin, W.-C.; Song, J.-K. Ionic impurity control by a photopolymerisation process of reactive mesogen. Liq. Cryst. 2013, 40, 458–467. [Google Scholar] [CrossRef]
  24. Shcherbinin, D.P.; Konshina, E.A. Ionic impurities in nematic liquid crystal doped with quantum dots CdSe/ZnS. Liq. Cryst. 2017, 44, 648–655. [Google Scholar] [CrossRef]
  25. Iwamoto, M. The dielectric dispersion of insulating films with long-range movements of charge carriers. J. Appl. Phys. 1995, 77, 5314–5321. [Google Scholar] [CrossRef]
  26. Bouchakour, M.; Derouiche, Y.; Bouberka, Z.; Beyens, C.; Mechernène, L.; Riahi, F.; Maschke, U. Optical properties of electron beam- and UV-cured polypropyleneglycoldiacrylate/liquid crystal E7 systems. Liq. Cryst. 2015, 42, 1527–1536. [Google Scholar]
  27. Bouchakour, M.; Derouiche, Y.; Bouberka, Z.; Beyens, C.; Supiot, P.; Dubois, F.; Riahi, F.; Maschke, U. Chapter 4—Electron beam curing of monomer/liquid crystal blends. In Polymer-Modified Liquid Crystals; Dierking, I., Ed.; Soft Matter Series No. 8; RSC: London, UK, 2019. [Google Scholar]
  28. Zair, L.; Berrayah, A.; Arabeche, K.; Bouberka, Z.; Best, A.; Koynov, K.; Maschke, U. Temperature Controlled Mechanical Reinforcement of Polyacrylate Films Containing Nematic Liquid Crystals. Polymers 2022, 14, 5024. [Google Scholar] [CrossRef] [PubMed]
  29. De la Fuente, R.; Dunmur, D. Dielectric properties of liquid crystals. In Handbook of Liquid Crystals, 2nd ed.; Goodby, J.W., Tschierske, C., Raynes, P., Gleeson, H., Kato, T., Collings, P.J., Eds.; Wiley-VCH Verlag GmbH & Co. KGaA.: Weinheim, Germany, 2014; Volume 2, Part 1, Chapter 4. [Google Scholar]
  30. Kremer, F.; Schönhals, A. Broadband Dielectric Spectroscopy, 1st ed.; Springer: Berlin/Heidelberg, Germany; New York, NY, USA, 2003. [Google Scholar]
  31. Vogel, H. Das Temperaturabhaengigkeitsgesetz der Viskositaet von Fluessigkeiten. Phys. Zeitschr. 1921, 22, 645. [Google Scholar]
  32. Fulcher, G.-S. Analysis of recent measurements of the viscosity of glasses. J. Am. Chem. Soc. 1925, 8, 339–355. [Google Scholar] [CrossRef]
  33. Tamman, G.; Hesse, W.; Anorg, Z. Die Abhaengigkeit der Viskositat von der Temperatur bei unterkiihlten Fliissigkeiten. Allg. Chem. 1926, 156, 245–257. [Google Scholar] [CrossRef]
  34. Maschke, U.; Roussel, F.; Buisine, J.-M.; Coqueret, X. Liquid crystal-polymer composite materials: A thermophysical and electro-optical study. J. Therm. Anal. 1998, 51, 737–746. [Google Scholar] [CrossRef]
  35. Kozanecki, M.; Pastorczak, M.; Okrasa, L.; Ulanski, J.; Yoon, J.-A.; Kowalewski, T.; Matyjaszewski, K.; Koynov, K. Evolution of high-temperature molecular relaxations in poly(2-(2-methoxyethoxy)ethyl methacrylate) upon network formation. Colloid Polym. Sci. 2015, 293, 1357–1367. [Google Scholar] [CrossRef] [PubMed]
  36. Liquid parallel plate sample cell BDS1308. Available online: https://www.novocontrol.de/php/sa_cell_liquid.php (accessed on 6 March 2024).
  37. Chakraborty, S.; Bandyopadhyay, S.; Dasgupta, S.; Mukhopadhyay, R.; Deuri, A.-S. Application of GPC in characterization of MP resin through correlation of softening point and methylol content with weight average molecular weight. Polym. Test. 2006, 25, 12–15. [Google Scholar] [CrossRef]
  38. Fox, T.G.; Flory, P.J. The glass temperature and related properties of polystyrene. Influence of molecular weight. J. Polym. Sci. 1954, 14, 315–319. [Google Scholar] [CrossRef]
  39. Cherfi, A.; Santos, A.F.; Pinto, J.C.; Seytre, G.; Boiteux, G.; McKenna, T.F.; Fevotte, G. Application of dielectric analysis to the measurement of conversion during batch solution copolymerizations. Chem. Eng. Process. 2003, 42, 121–128. [Google Scholar] [CrossRef]
  40. Coelho, R.; Aladenize, B. Les Diélectriques; Editions Hermes Science: Paris, France, 1993. [Google Scholar]
  41. Jonscher, A.K. Dielectric Relaxation in Solids; Chelsea Dielectrics Press: London, UK, 1983. [Google Scholar]
  42. Williams, M.L.; Landell, R.F.; Ferry, J.D. The Temperature Dependence of Relaxation Mechanisms in Amorphous Polymers and Other Glass-forming Liquids. J. Am. Chem. Soc. 1955, 77, 3701–3707. [Google Scholar] [CrossRef]
  43. Kim, S.H.; Kim, J.Y.; Kim, H.S.; Chao, H.N. Ionic conductivity of polymer electrolytes based on phosphate and polyether copolymers. Solid State Ion. 1999, 116, 63–71. [Google Scholar] [CrossRef]
  44. Kishikawa, Y.; Shinohara, H.; Maeda, K.; Nakamura, Y.; Weigand, S.; Kita, R. Temperature dependence of thermal diffusion for aqueous solutions of monosaccharides, oligosaccharides, and polysaccharides. Phys. Chem. Chem. Phys. 2012, 14, 10147–10153. [Google Scholar] [CrossRef] [PubMed]
Figure 1. (a) Synoptic diagram of dielectric measurement cell. (b) Photo of the open cell: (1) cell closing plate, (2) spring, (3) upper electrode, (4) Teflon isolation, (5) seal rings, (6) lower electrode, (7) cell carrier plate (reproduced from [36]).
Crystals 14 00286 g001
Figure 2. (a) 1H NMR spectrum of the monomer PPGDA540 (n = 7), (b) GPC chromatograms of the monomers.
Crystals 14 00286 g002aCrystals 14 00286 g002b
Figure 3. (a) TGA thermograms of the monomers and (b) DSC thermograms of the monomers.
Crystals 14 00286 g003
Figure 4. (a) Low-frequency evolution of L n ( ε f ) . (b) Low-frequency evolution of L n ( ε f ) , (c) Evolution of permittivities ε′ and ε″ of TPGDA as a function of frequency: T = 24 °C, 1 Hz < f < 1 kHz, A = 2.487 × 10⁻⁷, B = 6.067 × 10⁻⁷, m = 2.319 × 10⁻¹, σ = 2.247 × 10⁻⁶ S/m. (d) Temperature evolution of the conductivity of the monomers. (e) Conductivity of the three monomers. (f) Conductivity of PPGDA900 monomer/E7 mixtures.
Crystals 14 00286 g004aCrystals 14 00286 g004b
Figure 5. Evolution of the diffusion constant and ionic concentration as a function of molecular weight of the monomers at 24 °C.
Crystals 14 00286 g005
Figure 6. Influence of the E7 concentration on the ionic concentration of the monomer/LC mixtures at 24 °C.
Crystals 14 00286 g006
Table 1. Arrhenius and VTF equation fitting parameters of the monomers.
Monomer σ 0 S / m ( × 10 1 ) E a   ( e V ) σ 1 S . K 1 2 . m 1 ( × 10 2 ) E v   ( e V ) T 0   ( K )
TPGDA 0.21 0.230 6.46 0.095148
PPGDA540 3.15 0.342 3.27 0.094159
PPGDA900 1.30 0.348 0.91 0.090163
Table 2. Arrhenius and VTF equation fitting parameters of the monomer/E7 mixtures.
Monomer/E7 Mixture σ 0 S / m ( × 10 1 ) E a   ( e V ) σ 1 S . K 1 2 . m 1 × 10 1 E v   ( e V ) T 0   ( K )
70wt%TPGDA–30wt%E7 3.33 0.291 5.10 0.104157
50wt%TPGDA–50wt%E7 11.7 0.304 2.40 0.098157
30wt%TPGDA–70wt%E7 13.3 0.311 11.70 0.109157
70wt%PPGDA540–30wt%E7 5.90 0.319 2.24 0.101162
50wt%PPGDA540–50wt%E7 2.25 0.291 1.15 0.094163
30wt%PPGDA540–70wt%E7 2.62 0.262 8.95 0.113163
70wt%PPGDA900–30wt%E7 15.6 0.355 2.22 0.107162
50wt%PPGDA900–50wt%E7 31.9 0.350 17.4 0.118166
30wt%PPGDA900–70wt%E7 21.1 0.334 9.60 0.116165
Table 3. Static permittivity ε s , diffusion constant D, and ionic concentration nion of the monomers at T = 24 °C (50 µm thick samples).
Monomerεs
n i o n c m 3   ( × 10 15 )
D ( c m 2 / s )   ( × 10 6 )
TPGDA7.412.773.19
PPGDA5406.472.061.16
PPGDA9006.250.830.45
Table 4. Static permittivity ε s , diffusion constant D, and ionic concentration nion for monomer/E7 mixtures at T = 24 °C (50 µm thick samples).
Monomer/E7 Mixture ε s n ion ( cm 3 )   ( × 10 13 ) D   ( cm 2 / s )   ( × 10 6 )
70wt%TPGDA–30wt%E79.10 0.74 7.11
50wt%TPGDA–50wt%E710.30 1.99 7.80
30wt%TPGDA–70wt%E710.00 1.49 0.13
70wt%PPGDA540–30wt%E78.60 0.70 4.38
50wt%PPGDA540–50wt%E79.00 1.40 4.40
30wt%PPGDA540–70wt%E710.201.22 5.38
70wt%PPGDA900–30wt%E78.43 0.39 3.45
50wt%PPGDA900–50wt%E79.56 1.03 8.22
30wt%PPGDA900–70wt%E711.25 0.70 8.41
Disclaimer/Publisher’s Note: The statements, opinions and data contained in all publications are solely those of the individual author(s) and contributor(s) and not of MDPI and/or the editor(s). MDPI and/or the editor(s) disclaim responsibility for any injury to people or property resulting from any ideas, methods, instructions or products referred to in the content.

