

Enhancing Vapochromic Properties of Platinum(II) Terpyridine Chloride Hexaflouro Phosphate in Terms of Sensitivity through Nanocrystalization for Fluorometric Detection of Acetonitrile Vapors

 ,
,
Abstract

1. Introduction
2. Experimental
2.1. Reagents
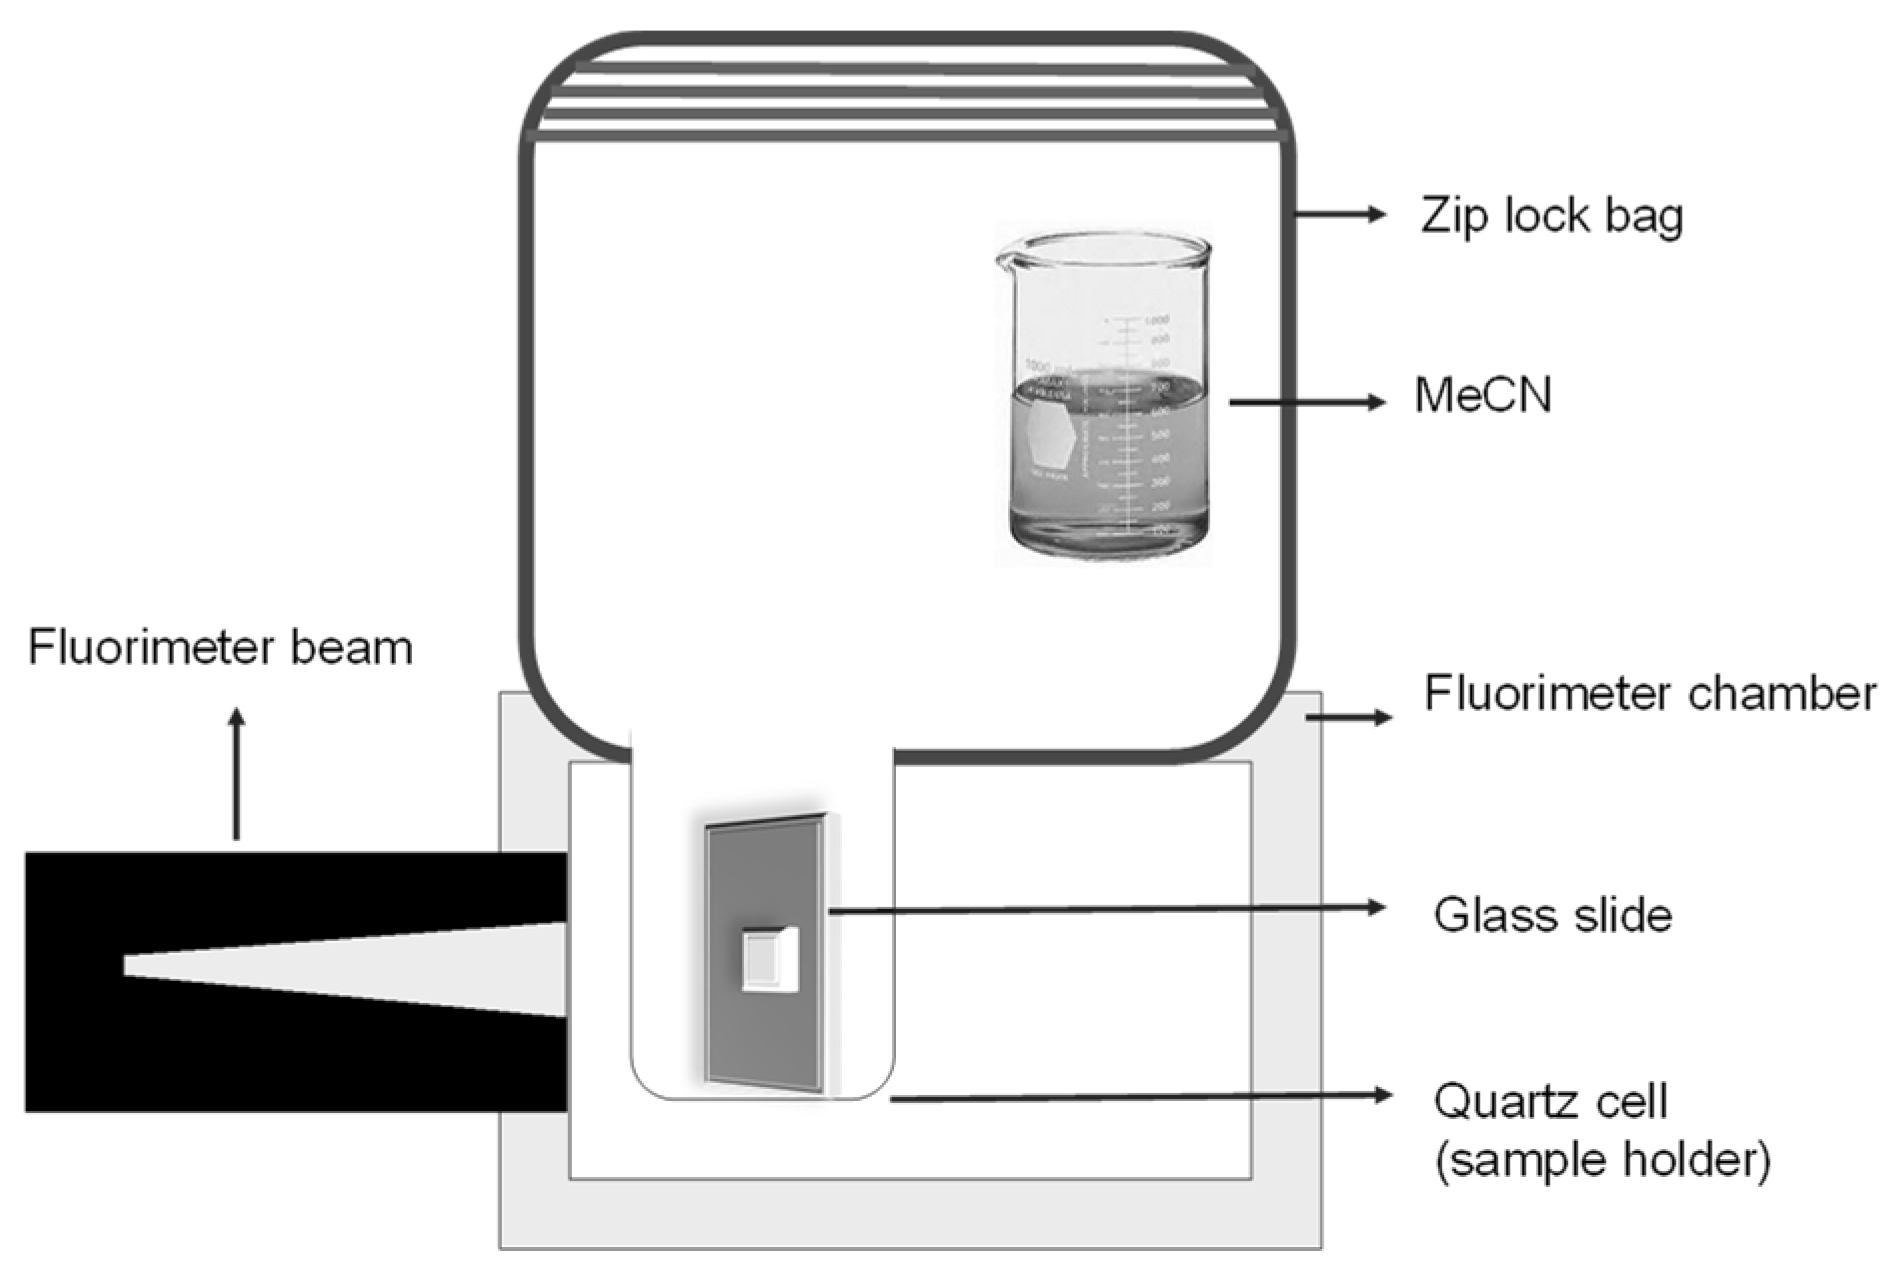
2.2. Apparatus
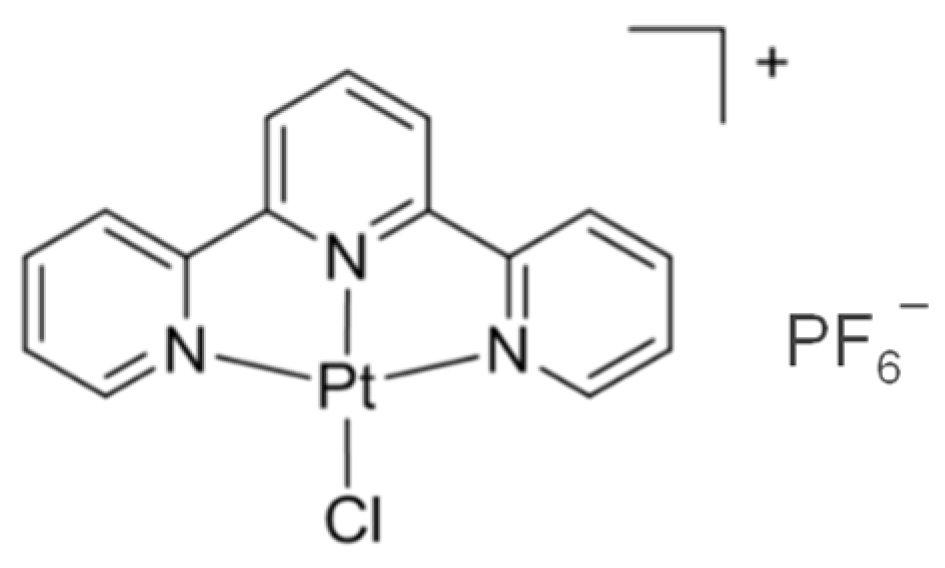
2.3. Synthesis of [Pt(tpy)Cl](PF6)
2.4. Vapochromic Studies of [Pt(tpy)Cl](PF6) Crystals
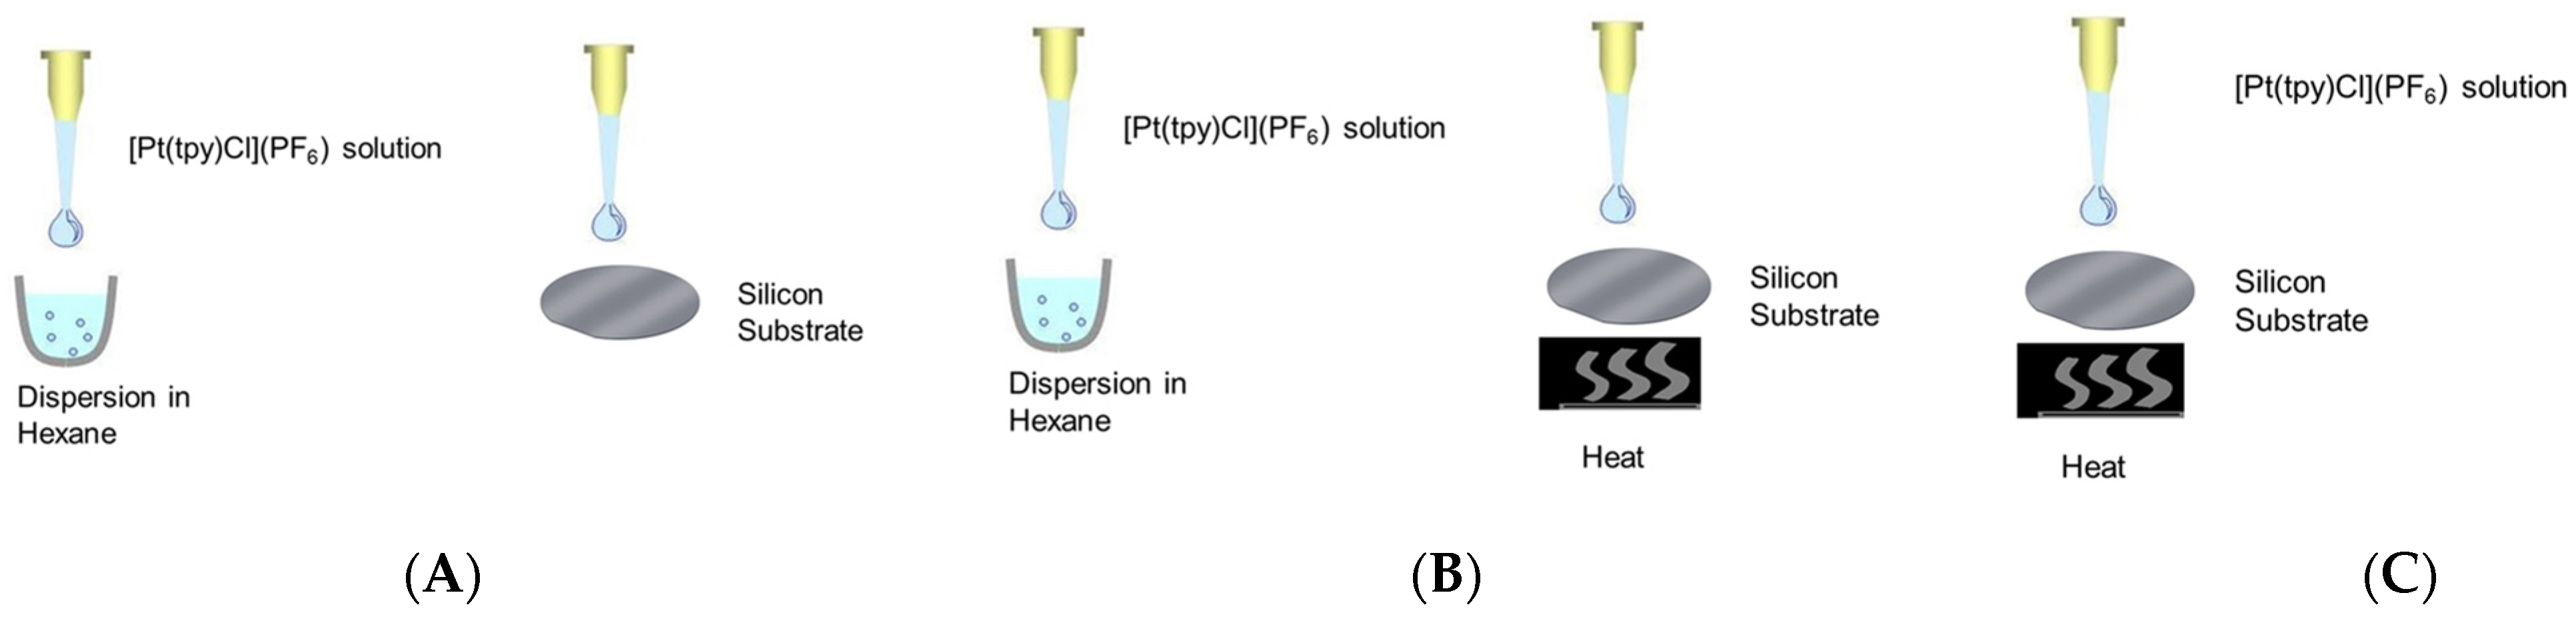
2.5. Synthesis of Pt[(tpy)Cl]PF6 Nanocrystals
2.6. Vapochromic Studies of [Pt(tpy)Cl](PF6) Nanocrystals
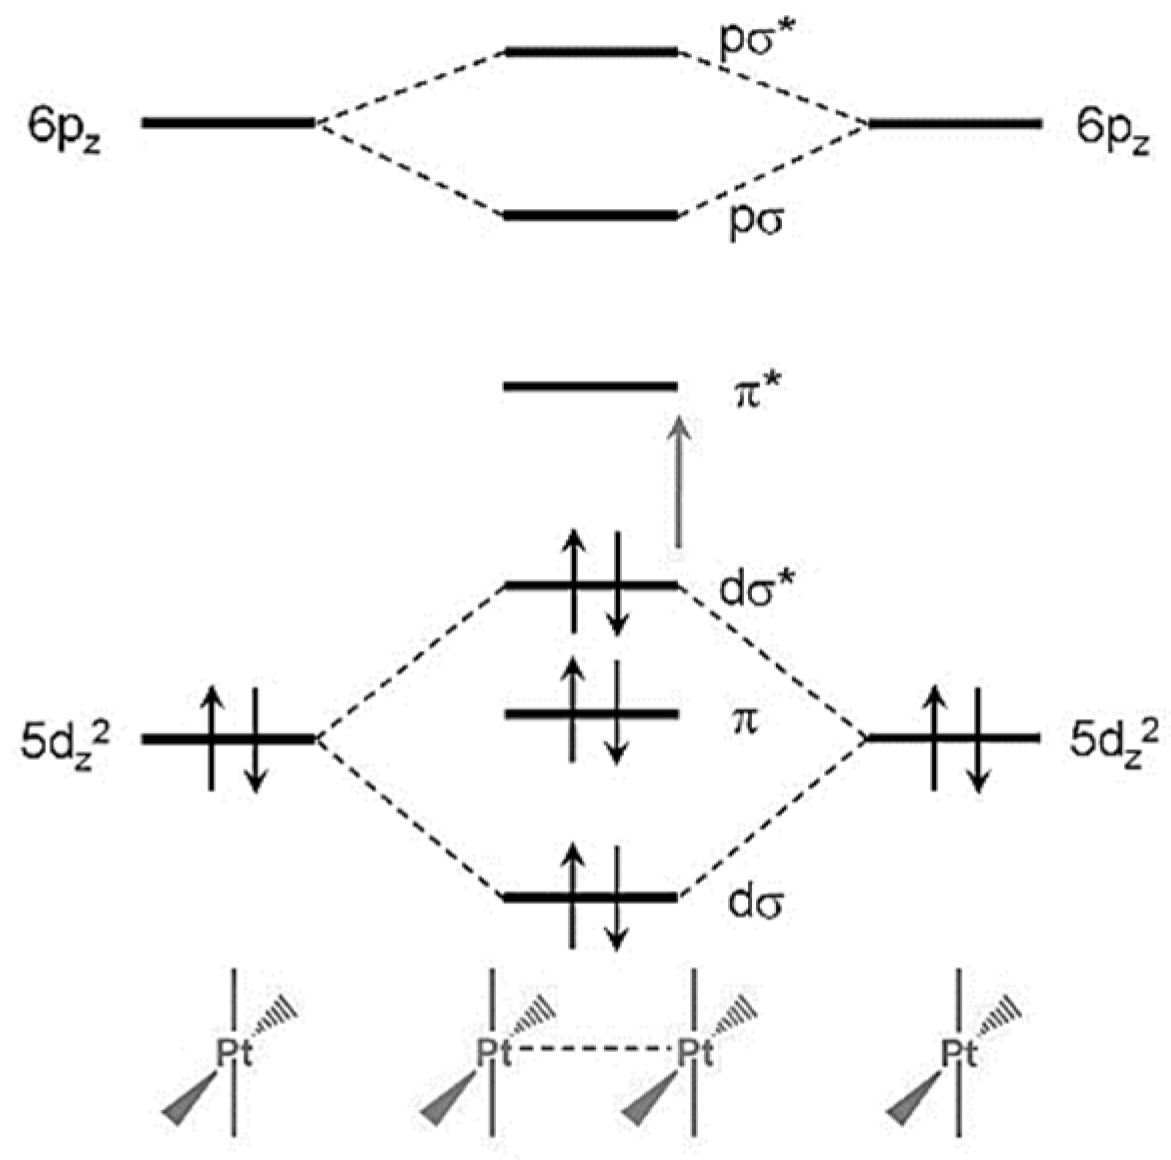
3. Results and Discussion
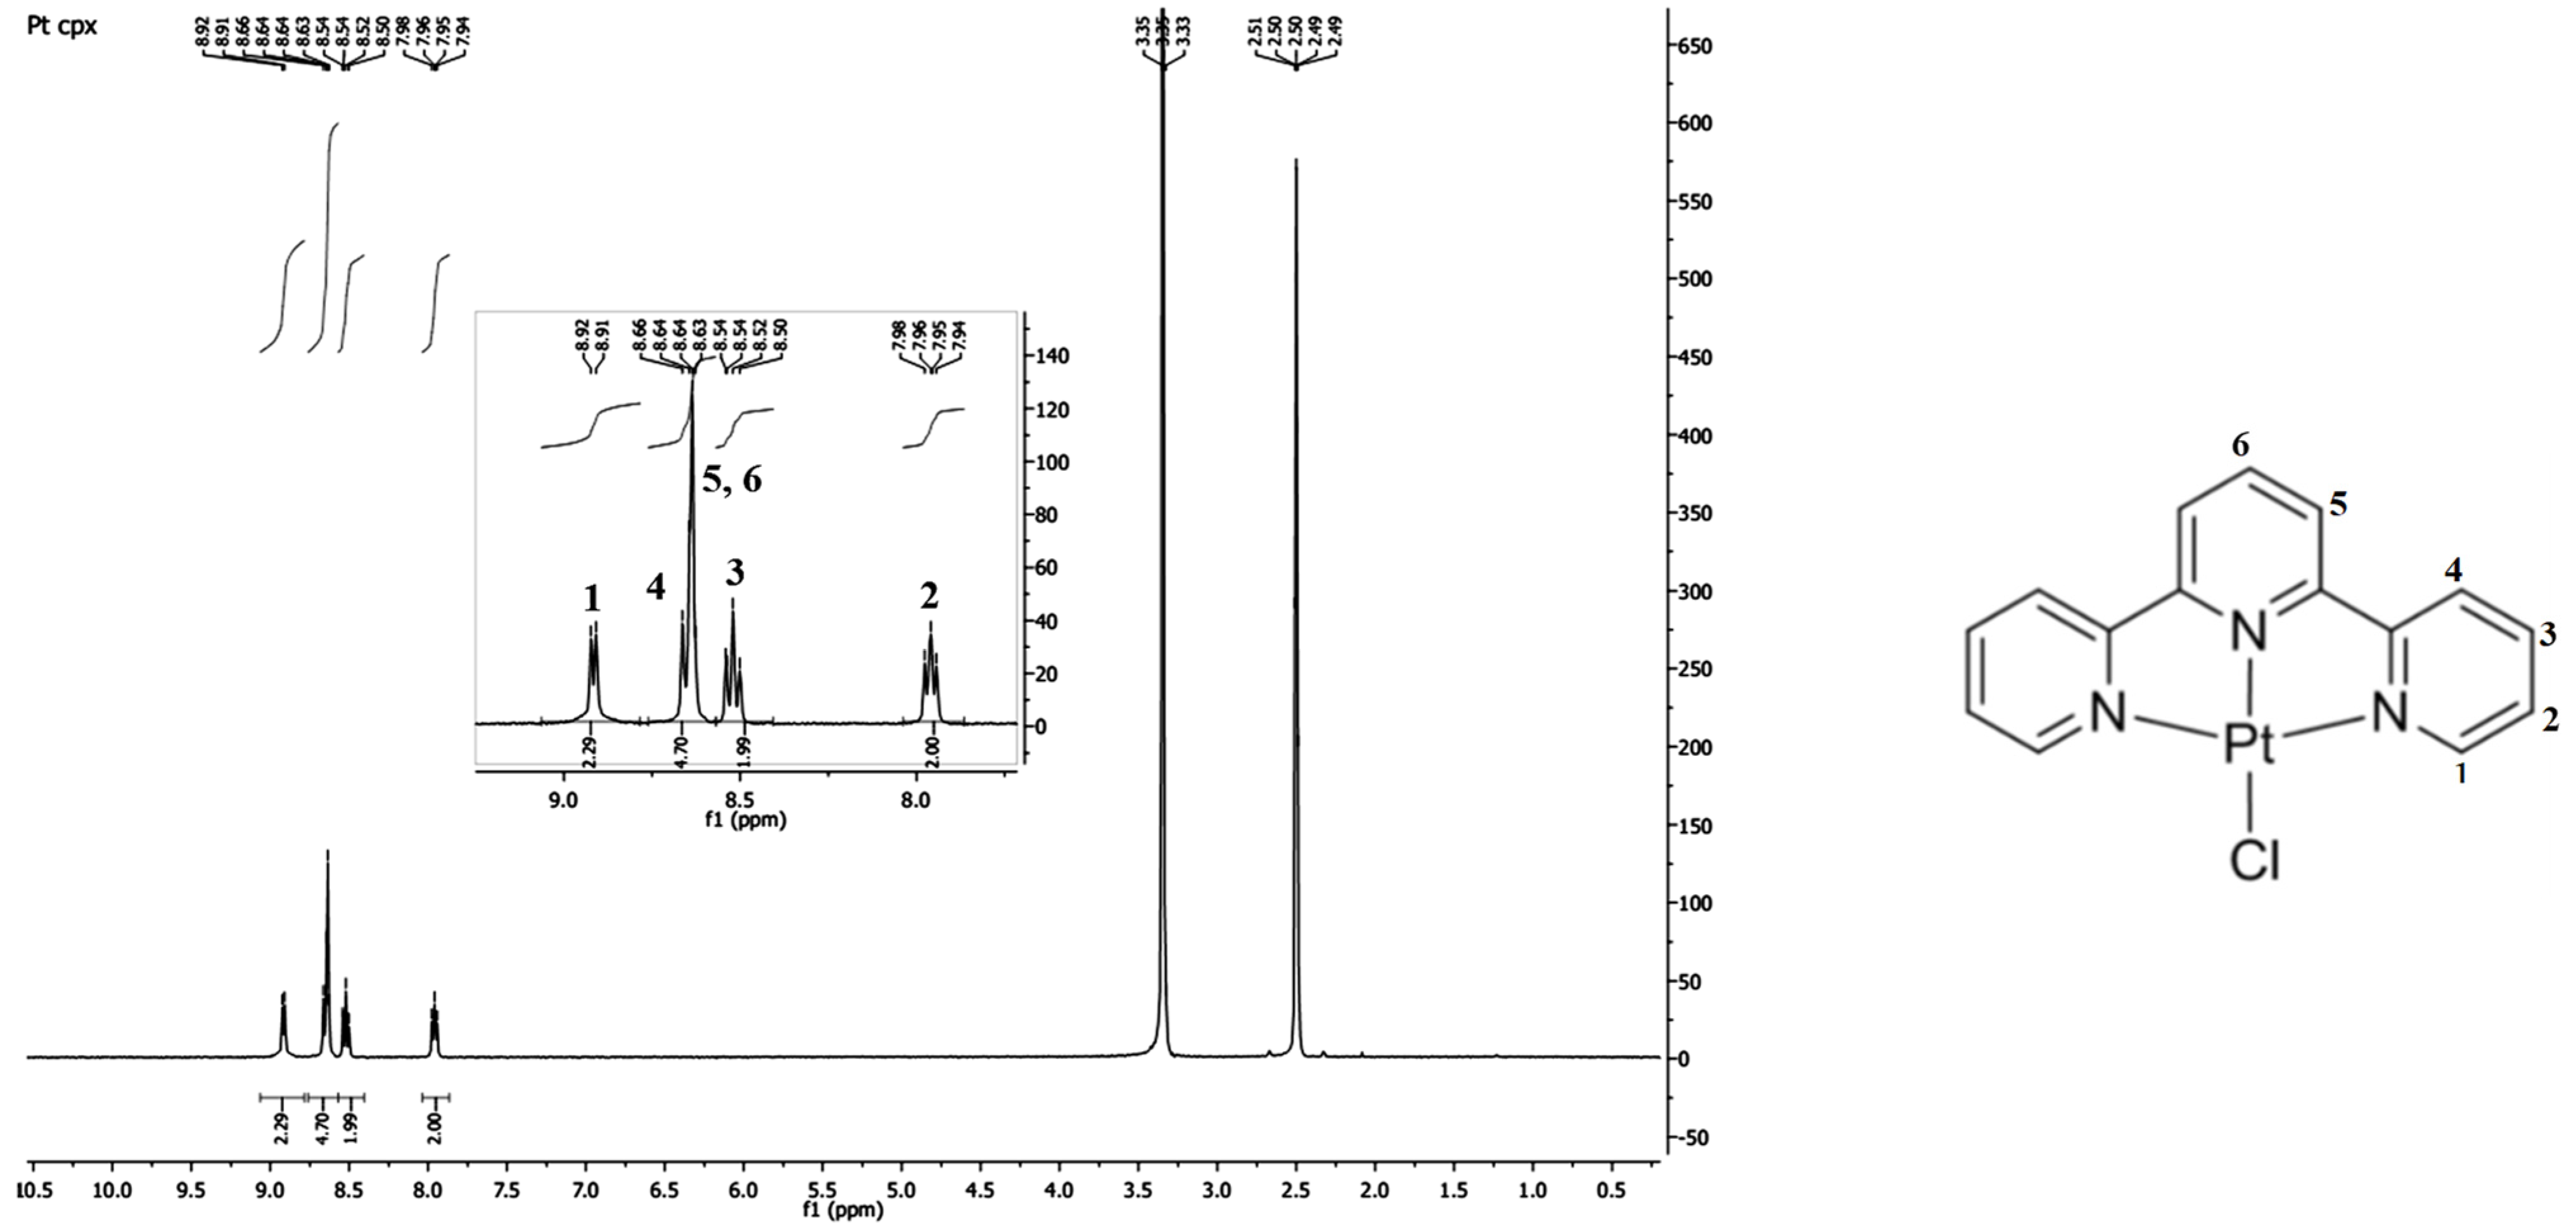
3.1. Characterization of [Pt(tpy)Cl](PF6) Crystals by 1HNMR
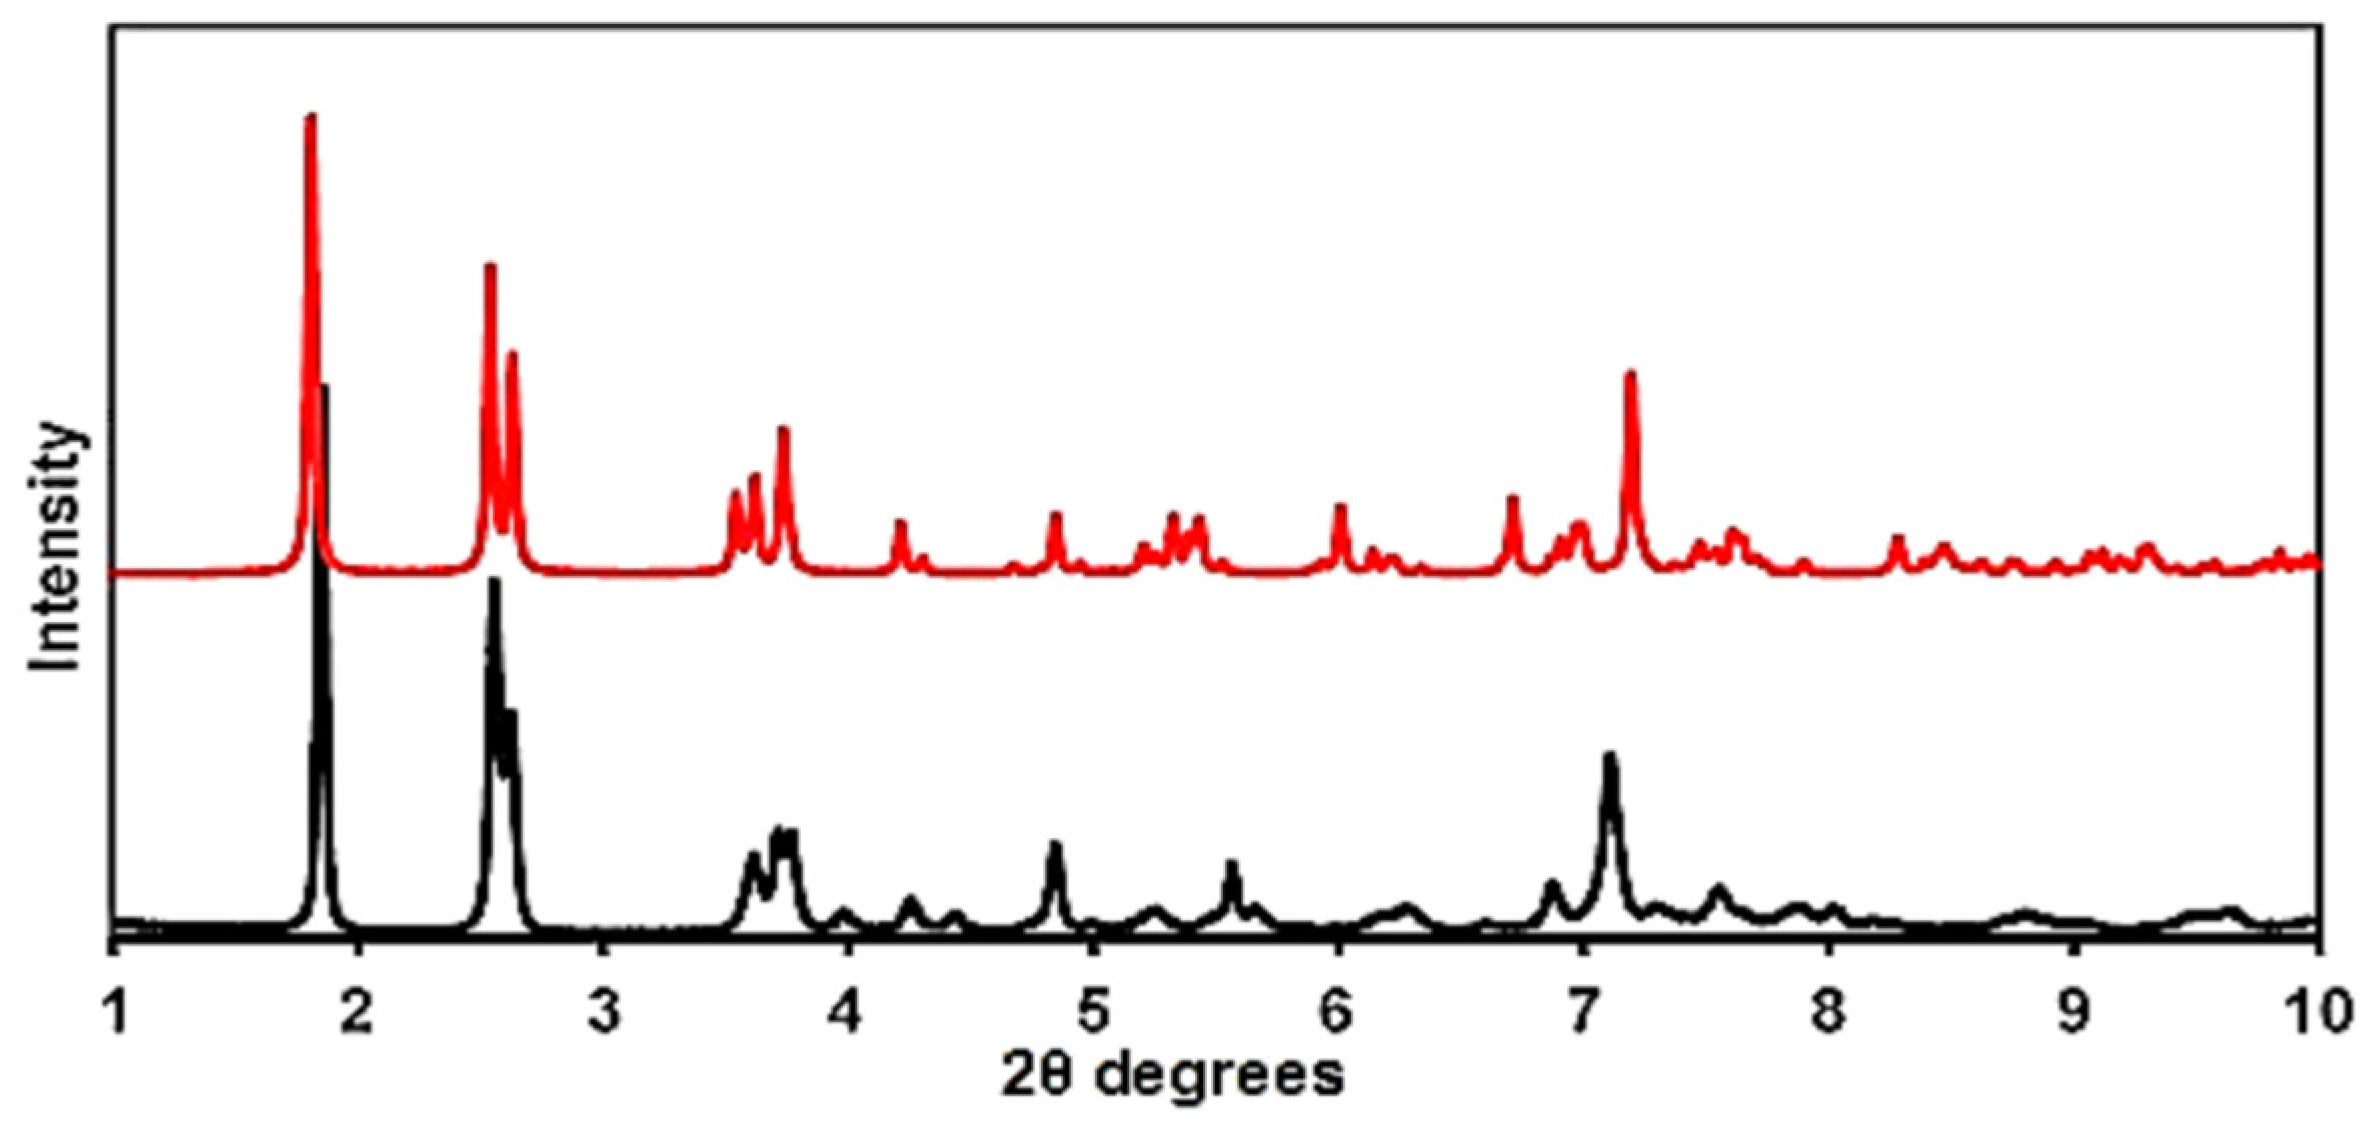
3.2. Characterization of [Pt(tpy)Cl](PF6) Crystals by X-ray Powder Diffraction
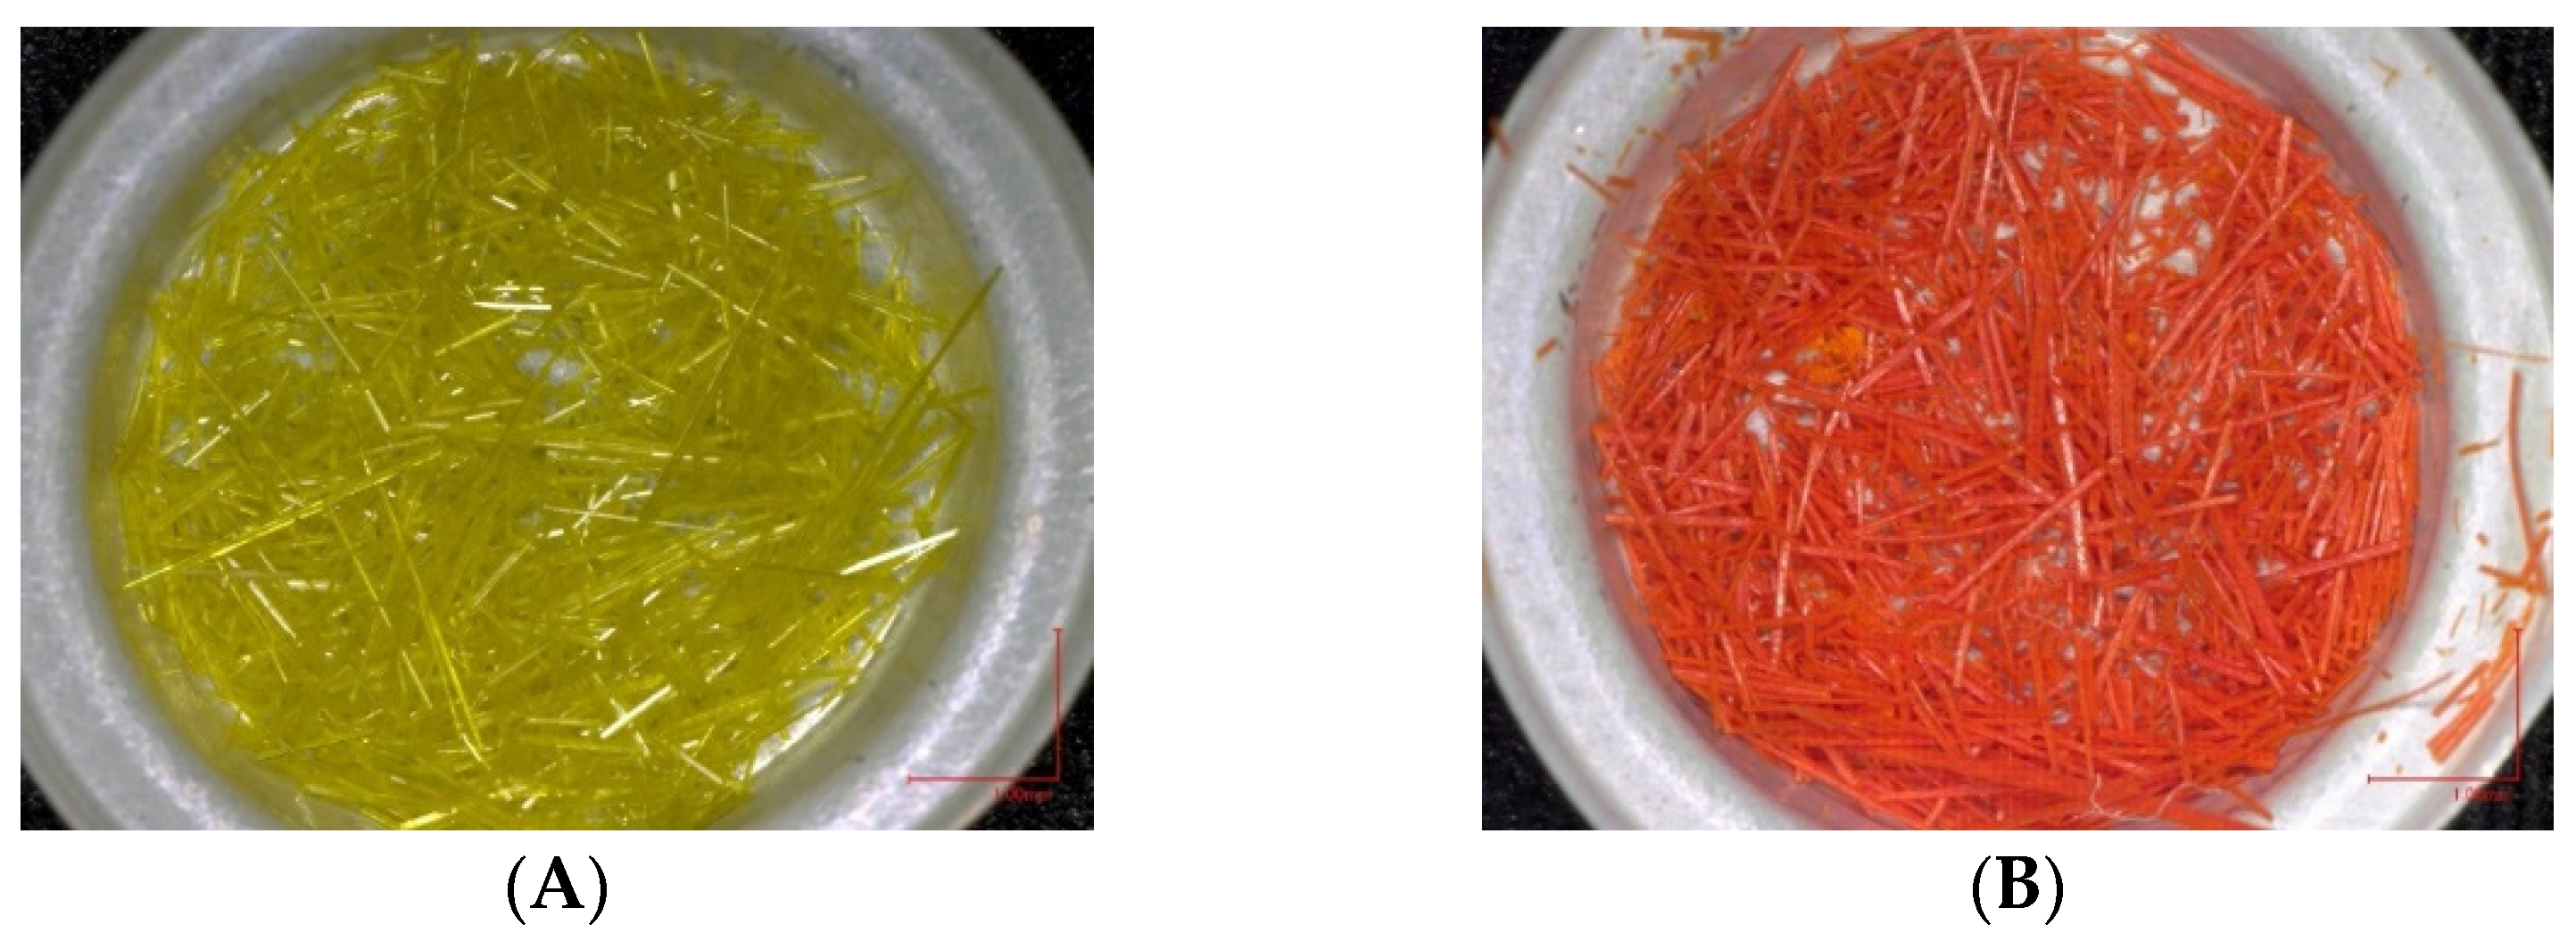
3.3. Vapochromic Studies of the [Pt(tpy)Cl](PF6) Crystals
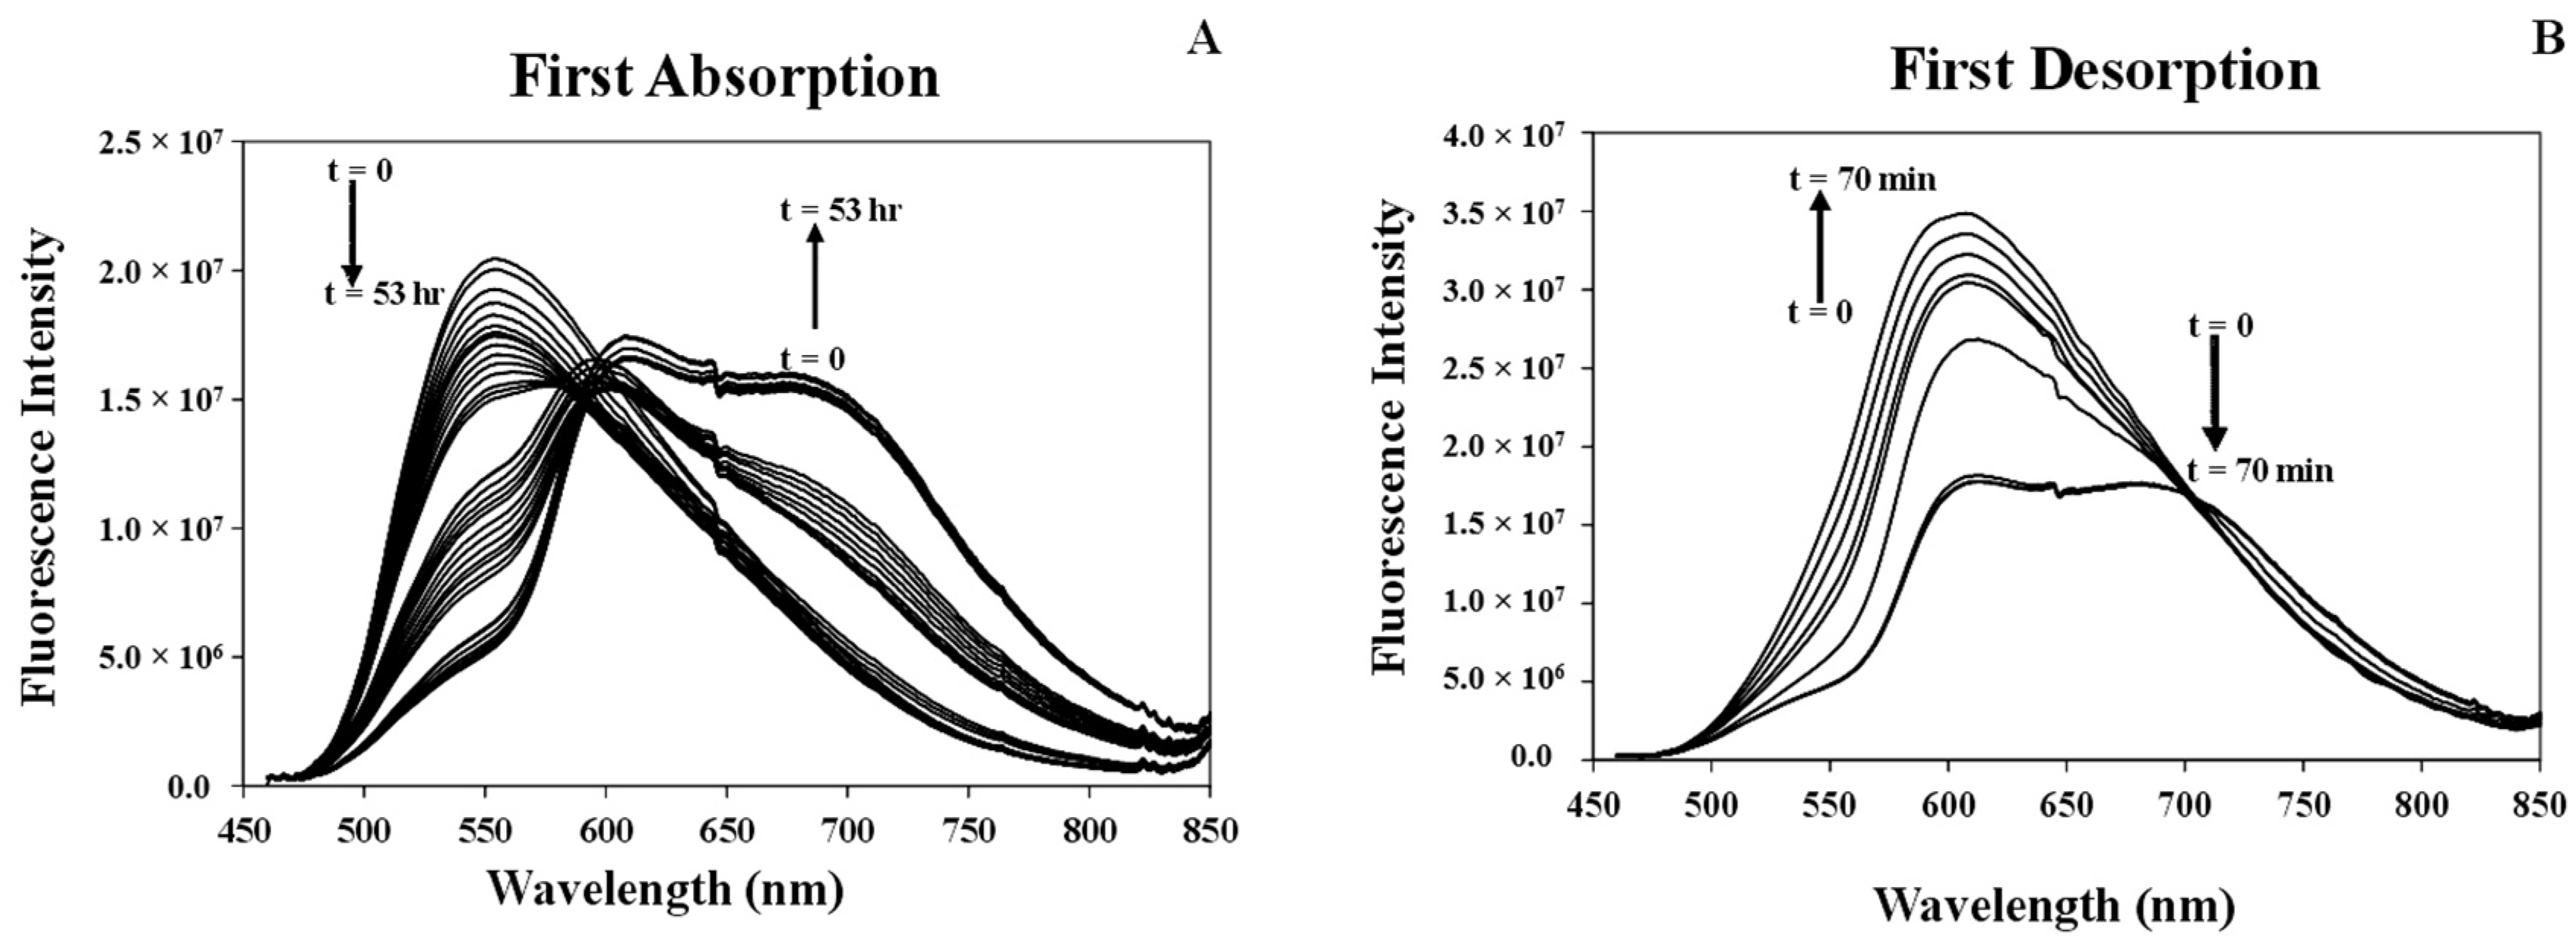
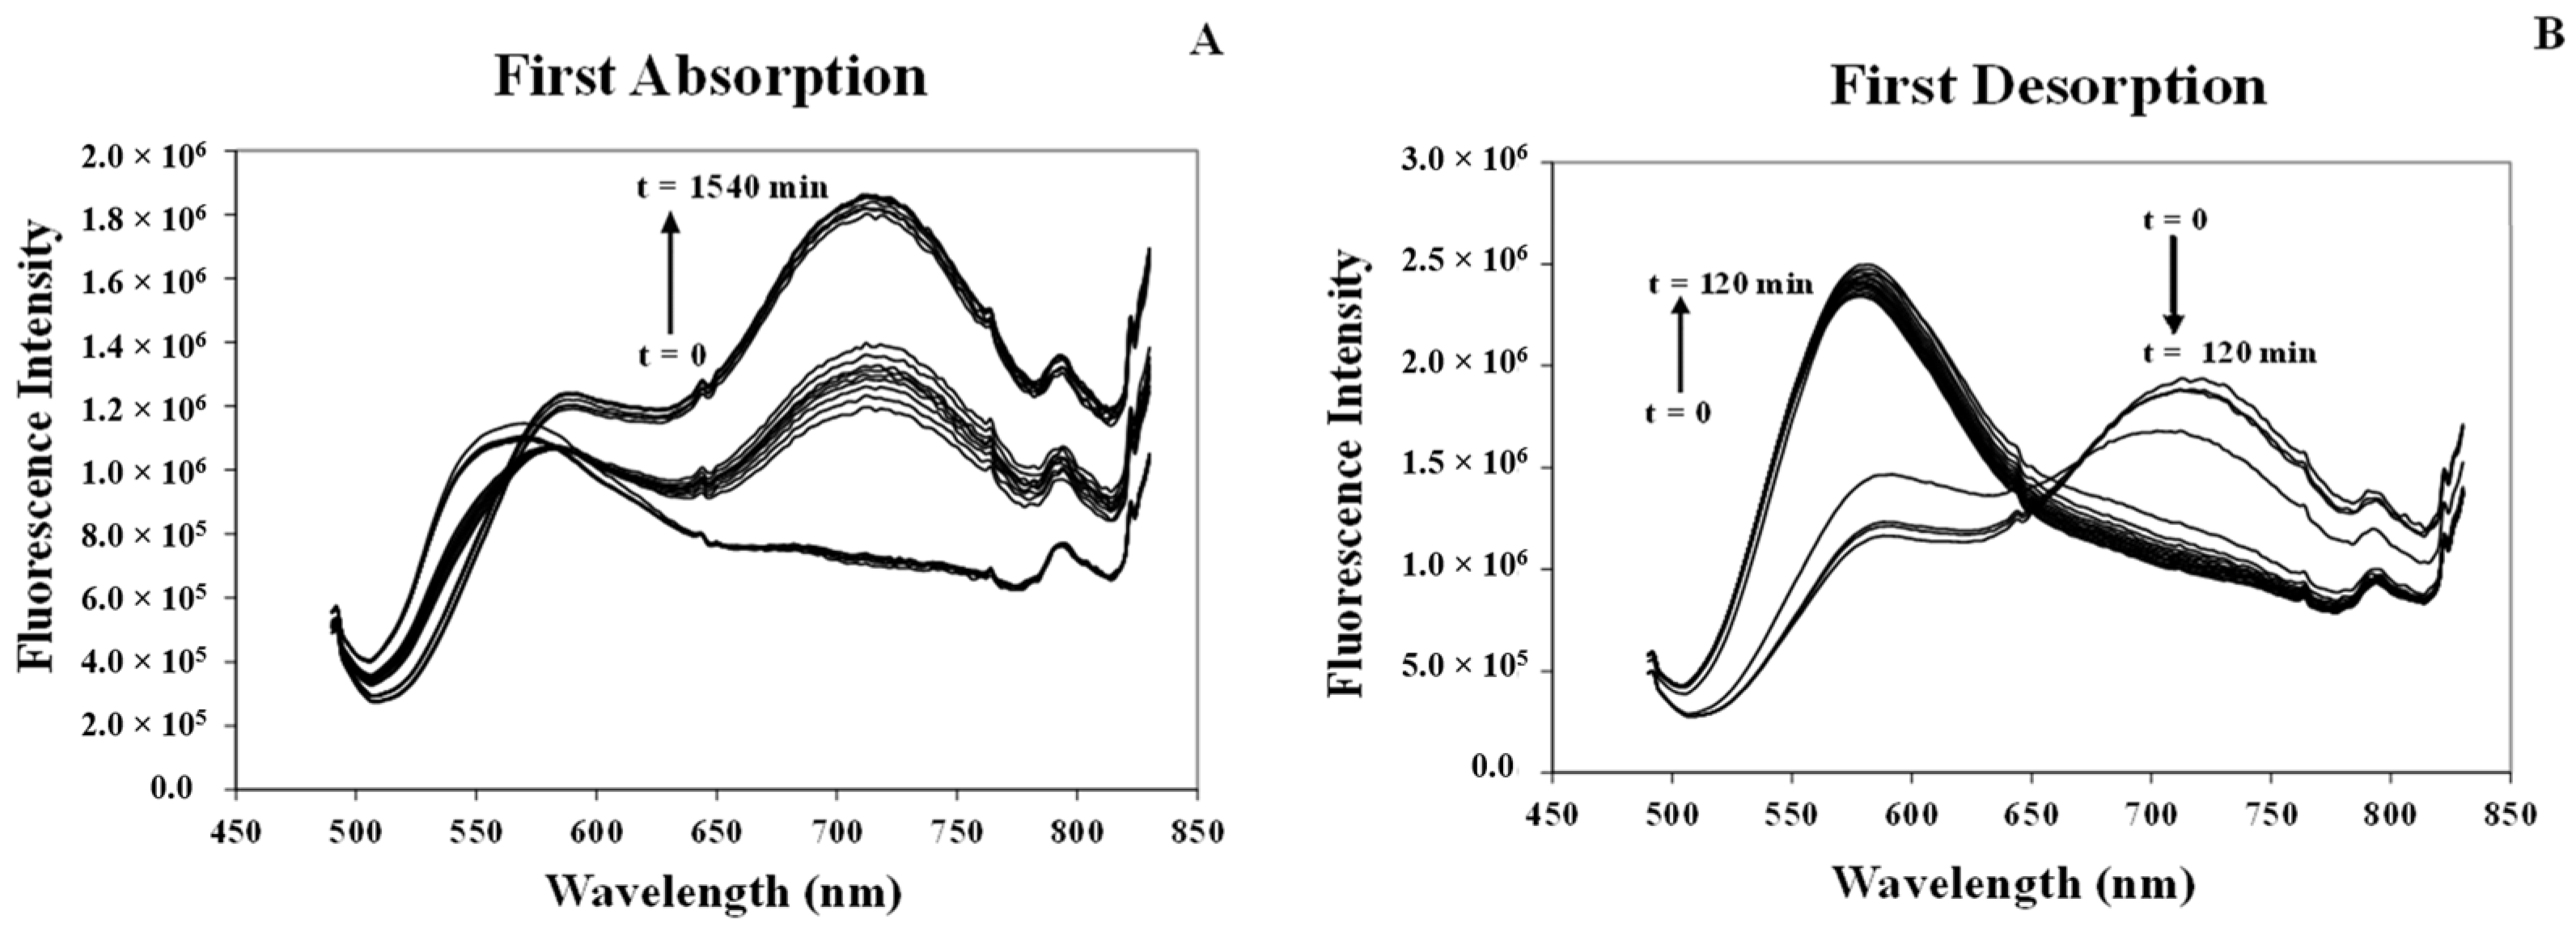
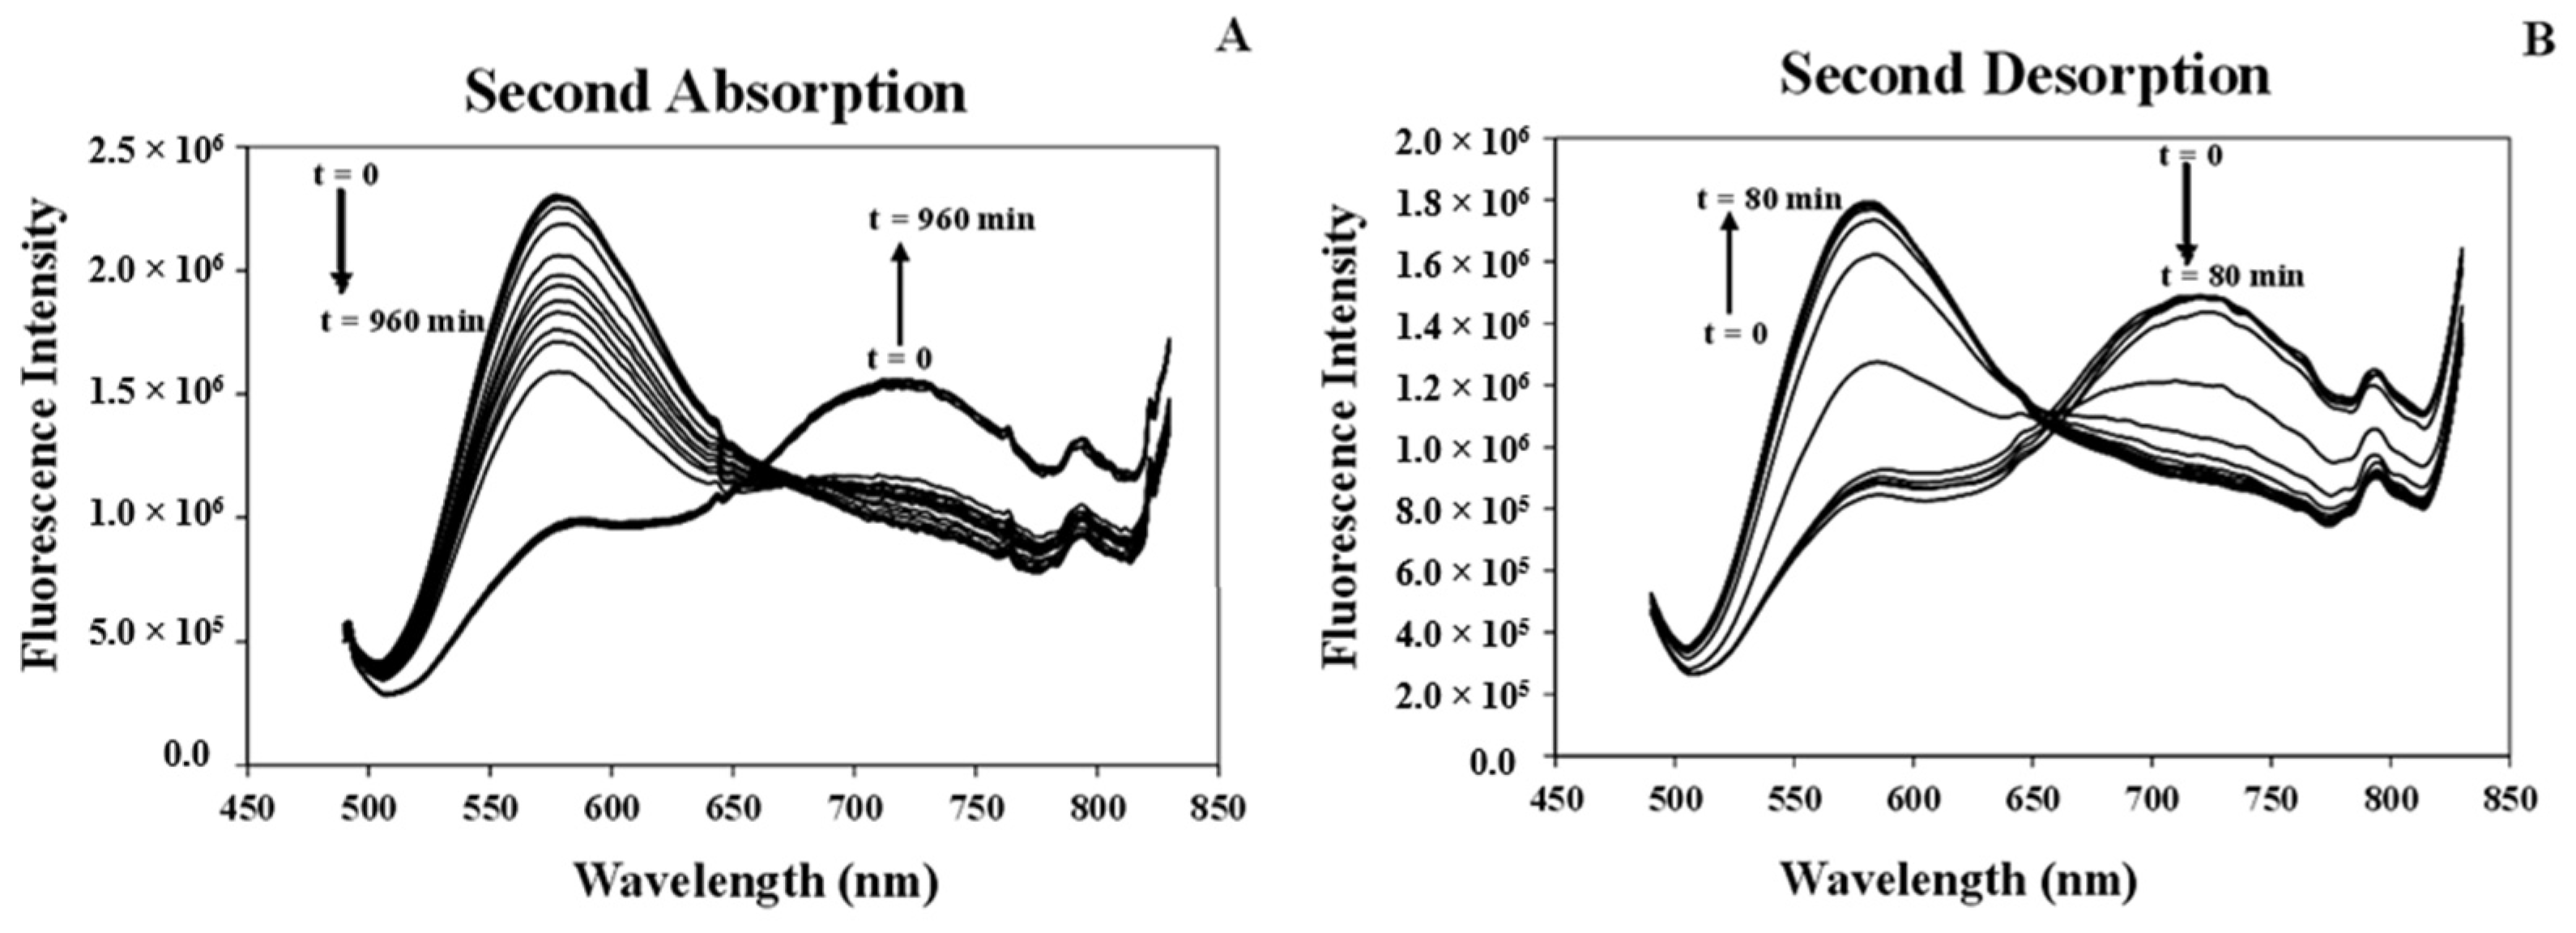
3.3.1. Studying Absorption/Desorption Cycle of MeCN Vapor in the Structure of [Pt(tpy)Cl](PF6) Crystals
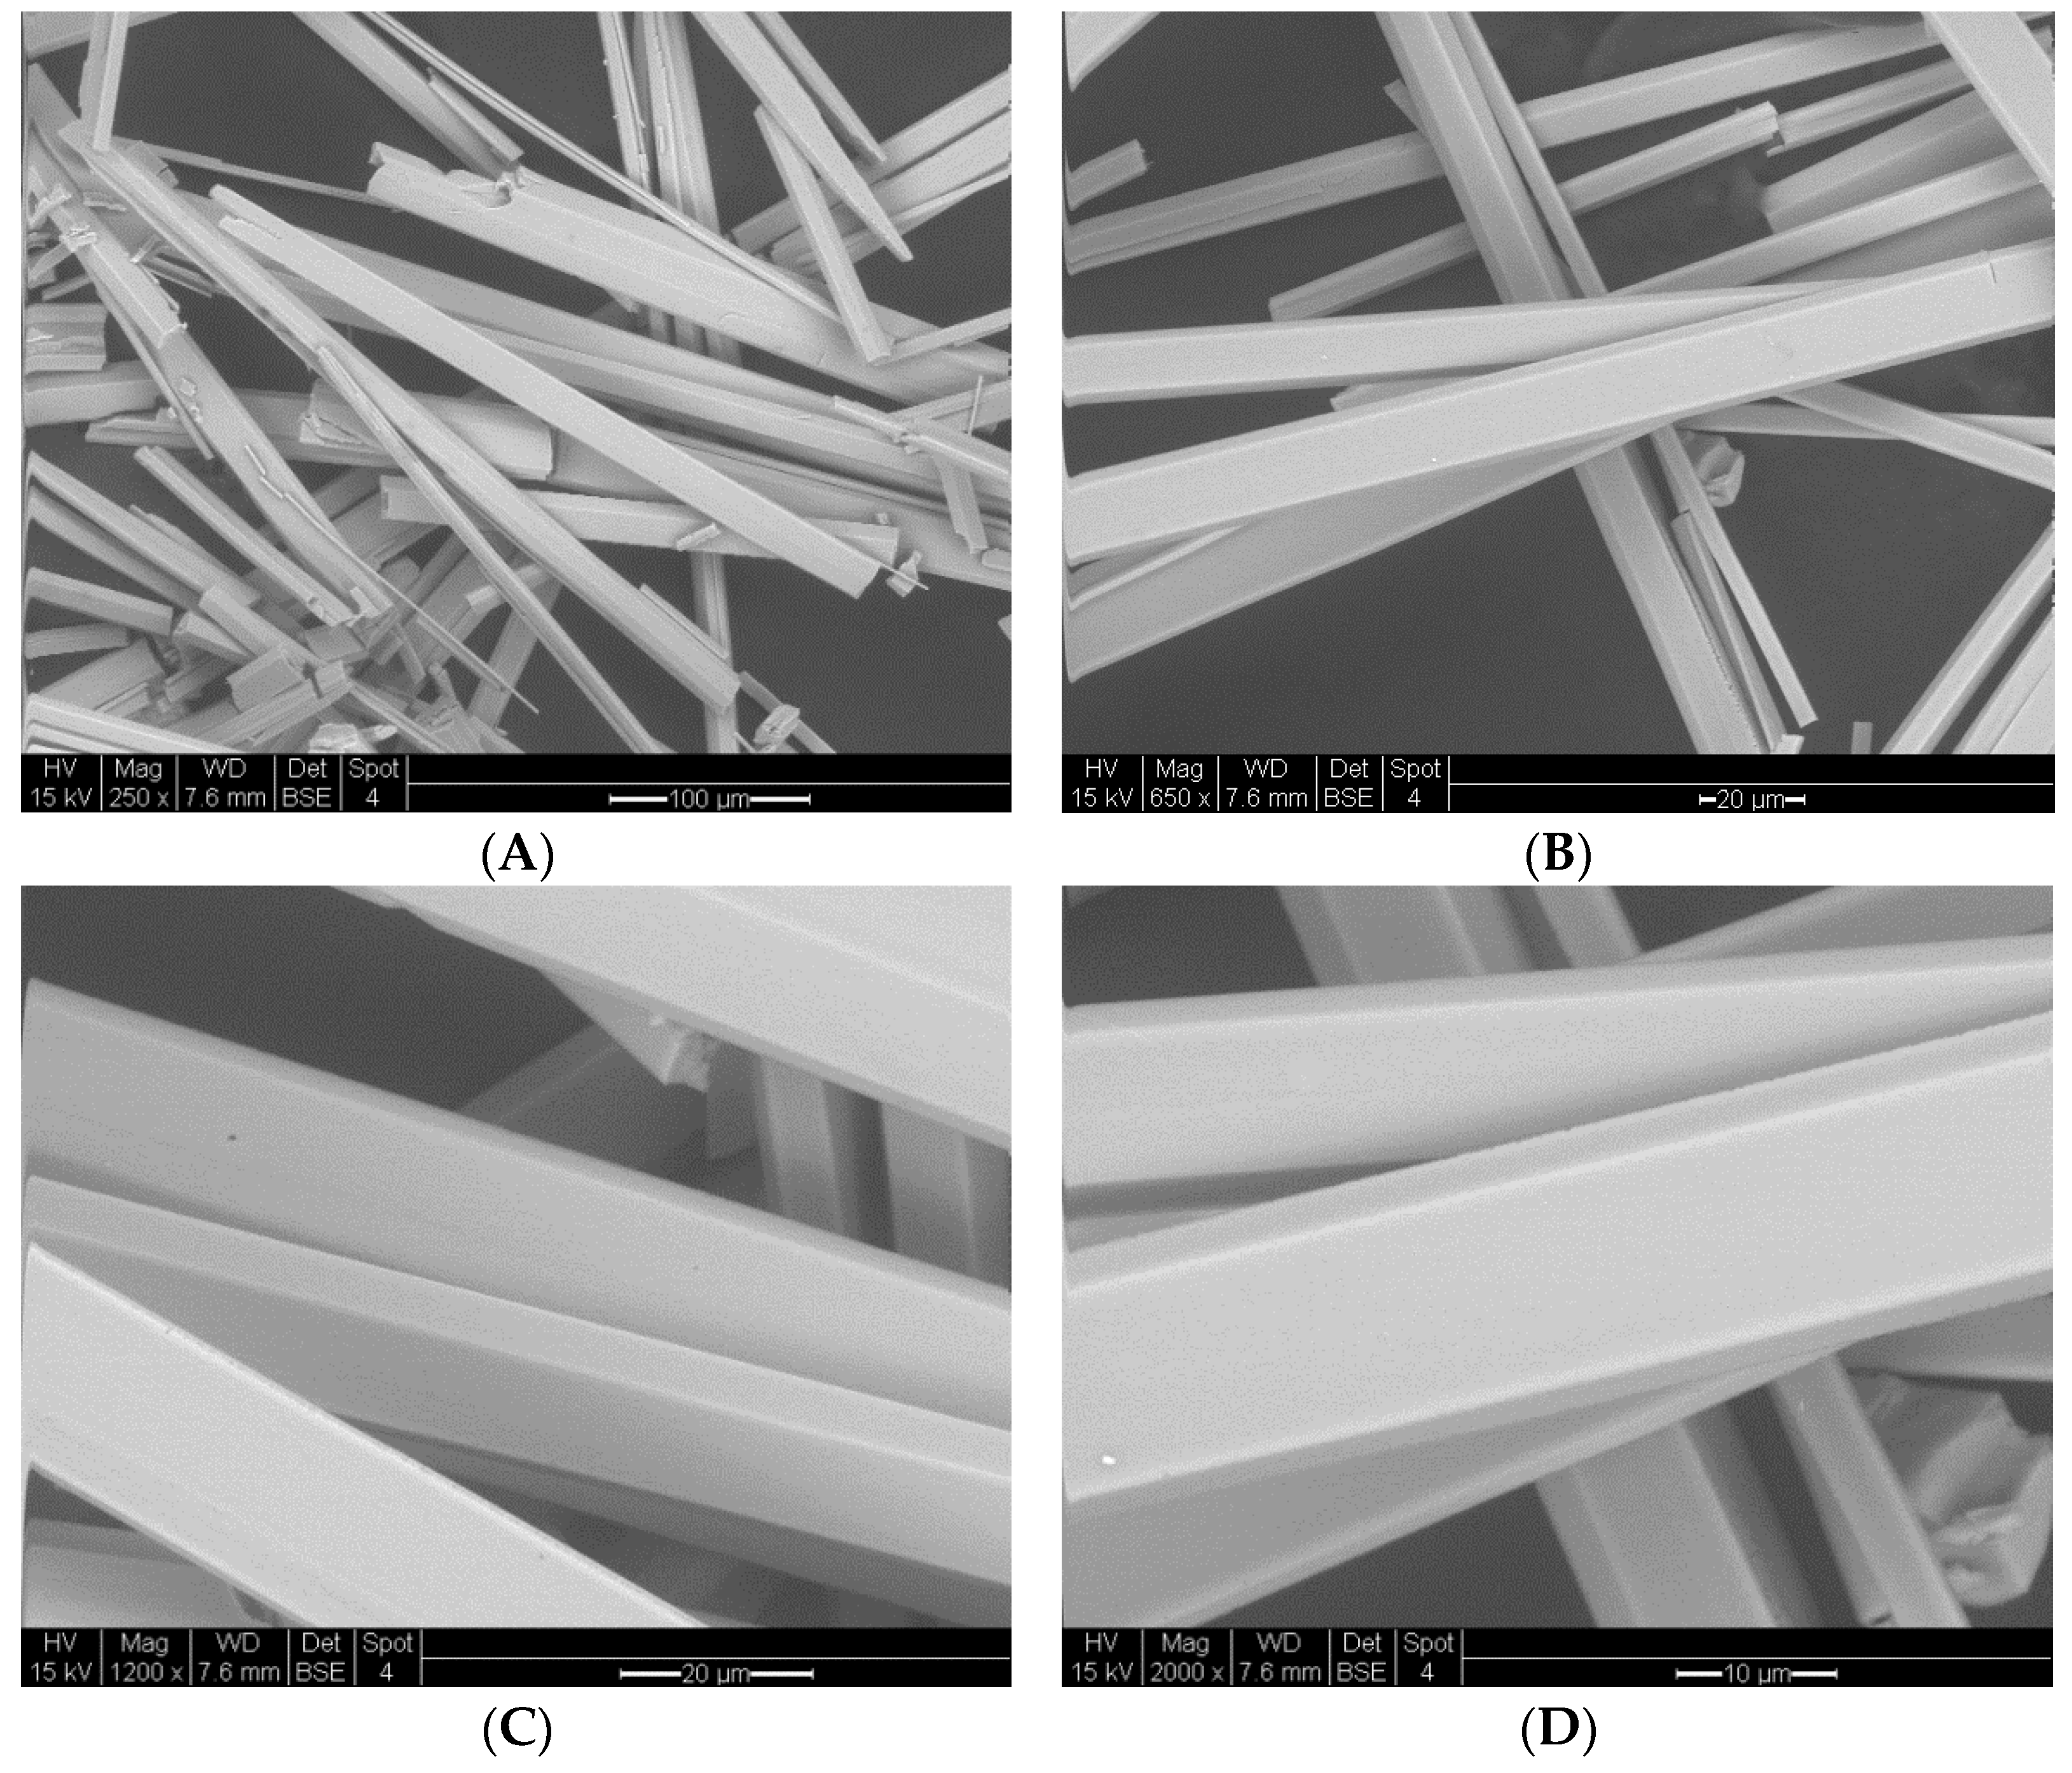
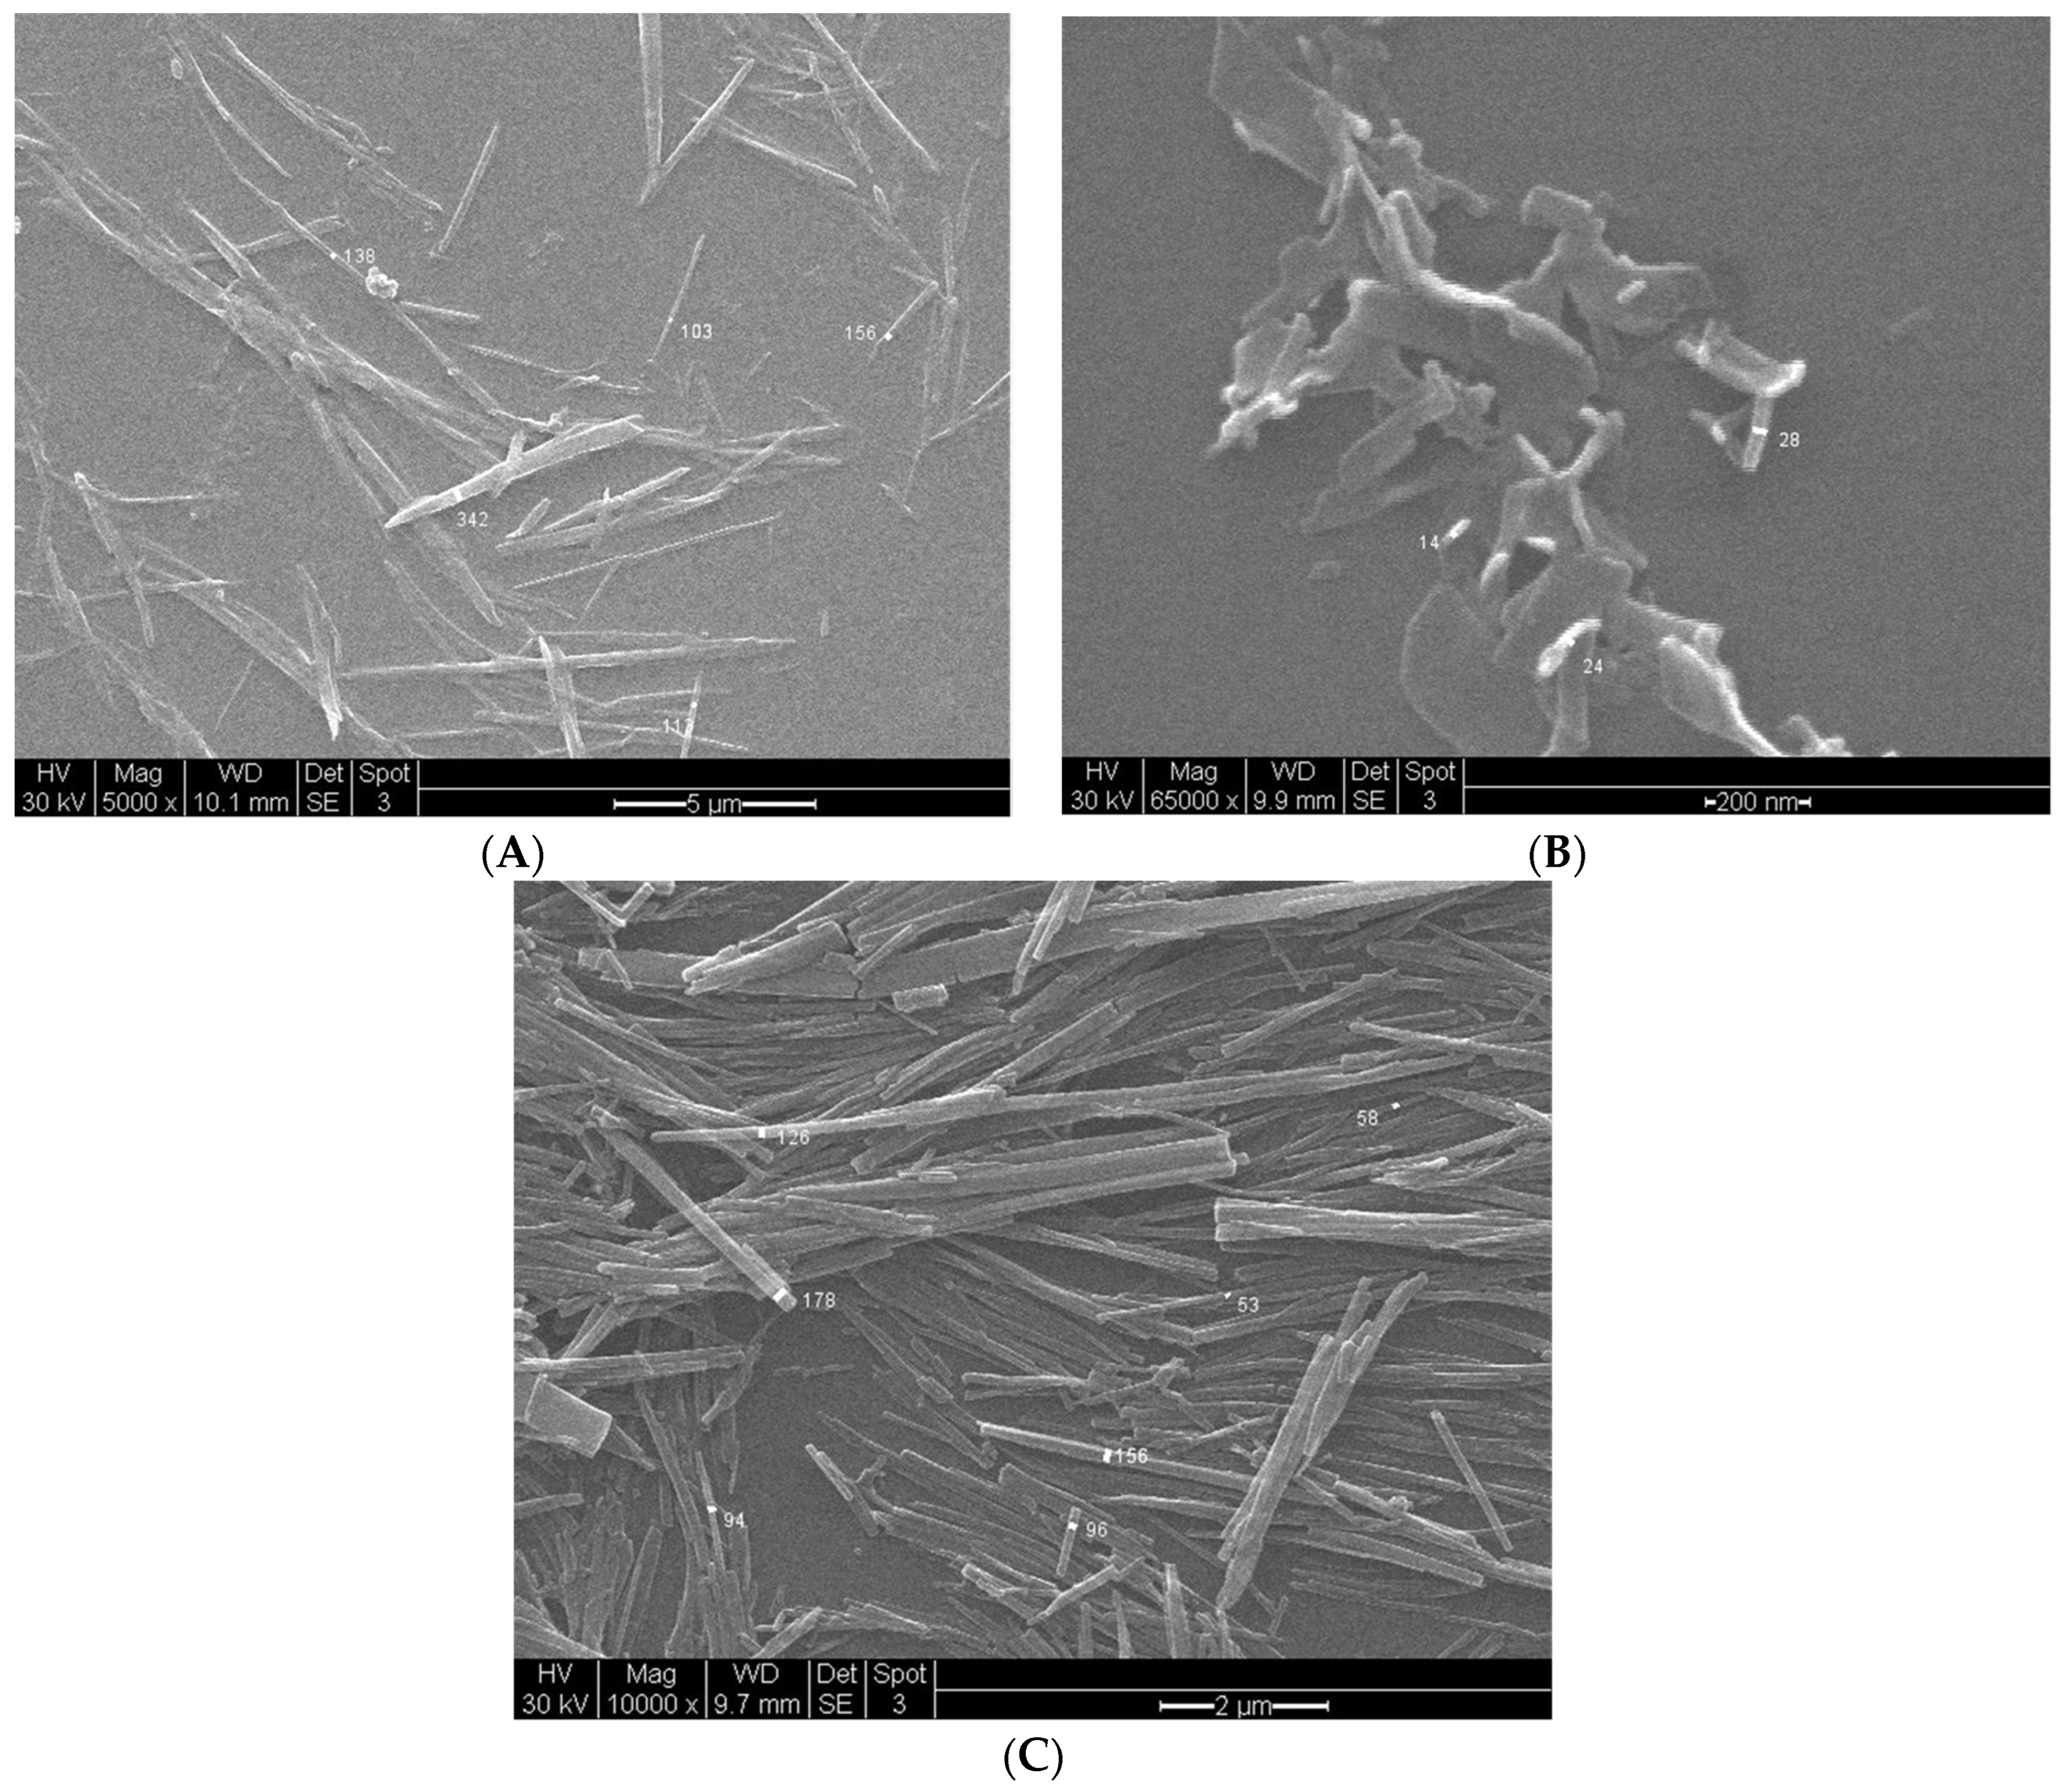
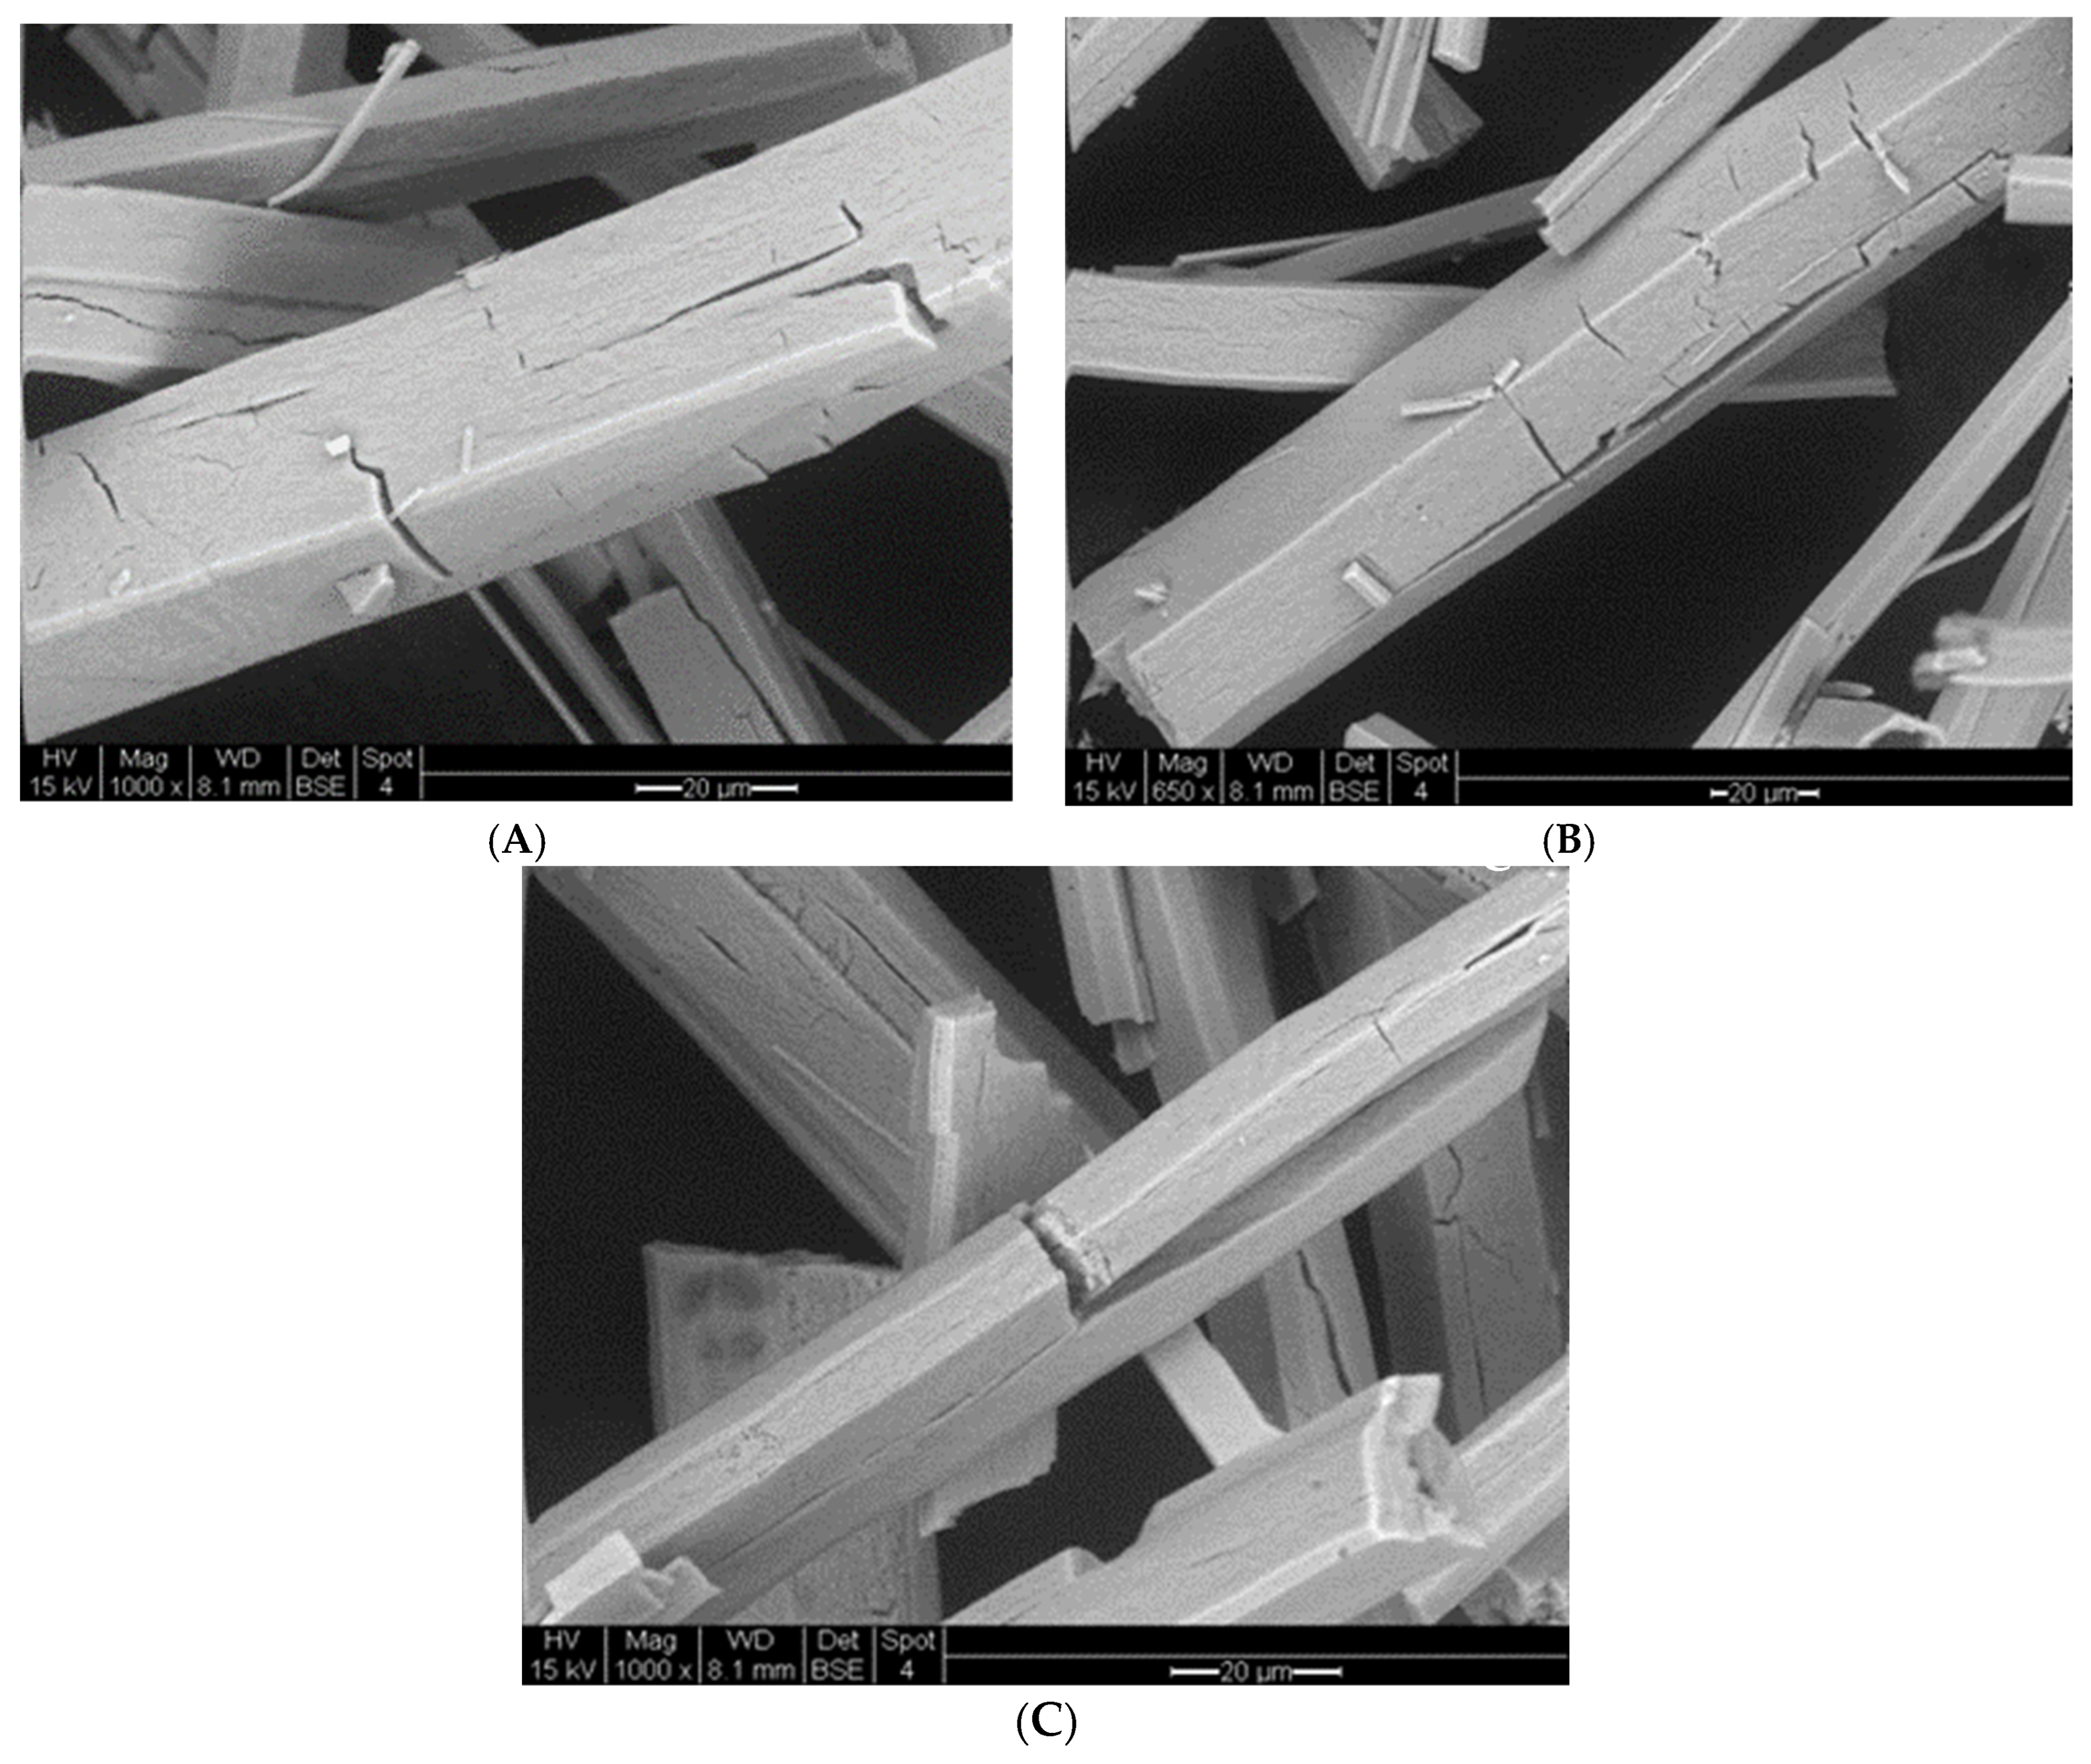
3.3.2. Vapochromic Studies on the Microscopic and SEM Images of the [Pt(tpy)Cl](PF6) Crystals before and after Being Exposed to MeCN Vapor
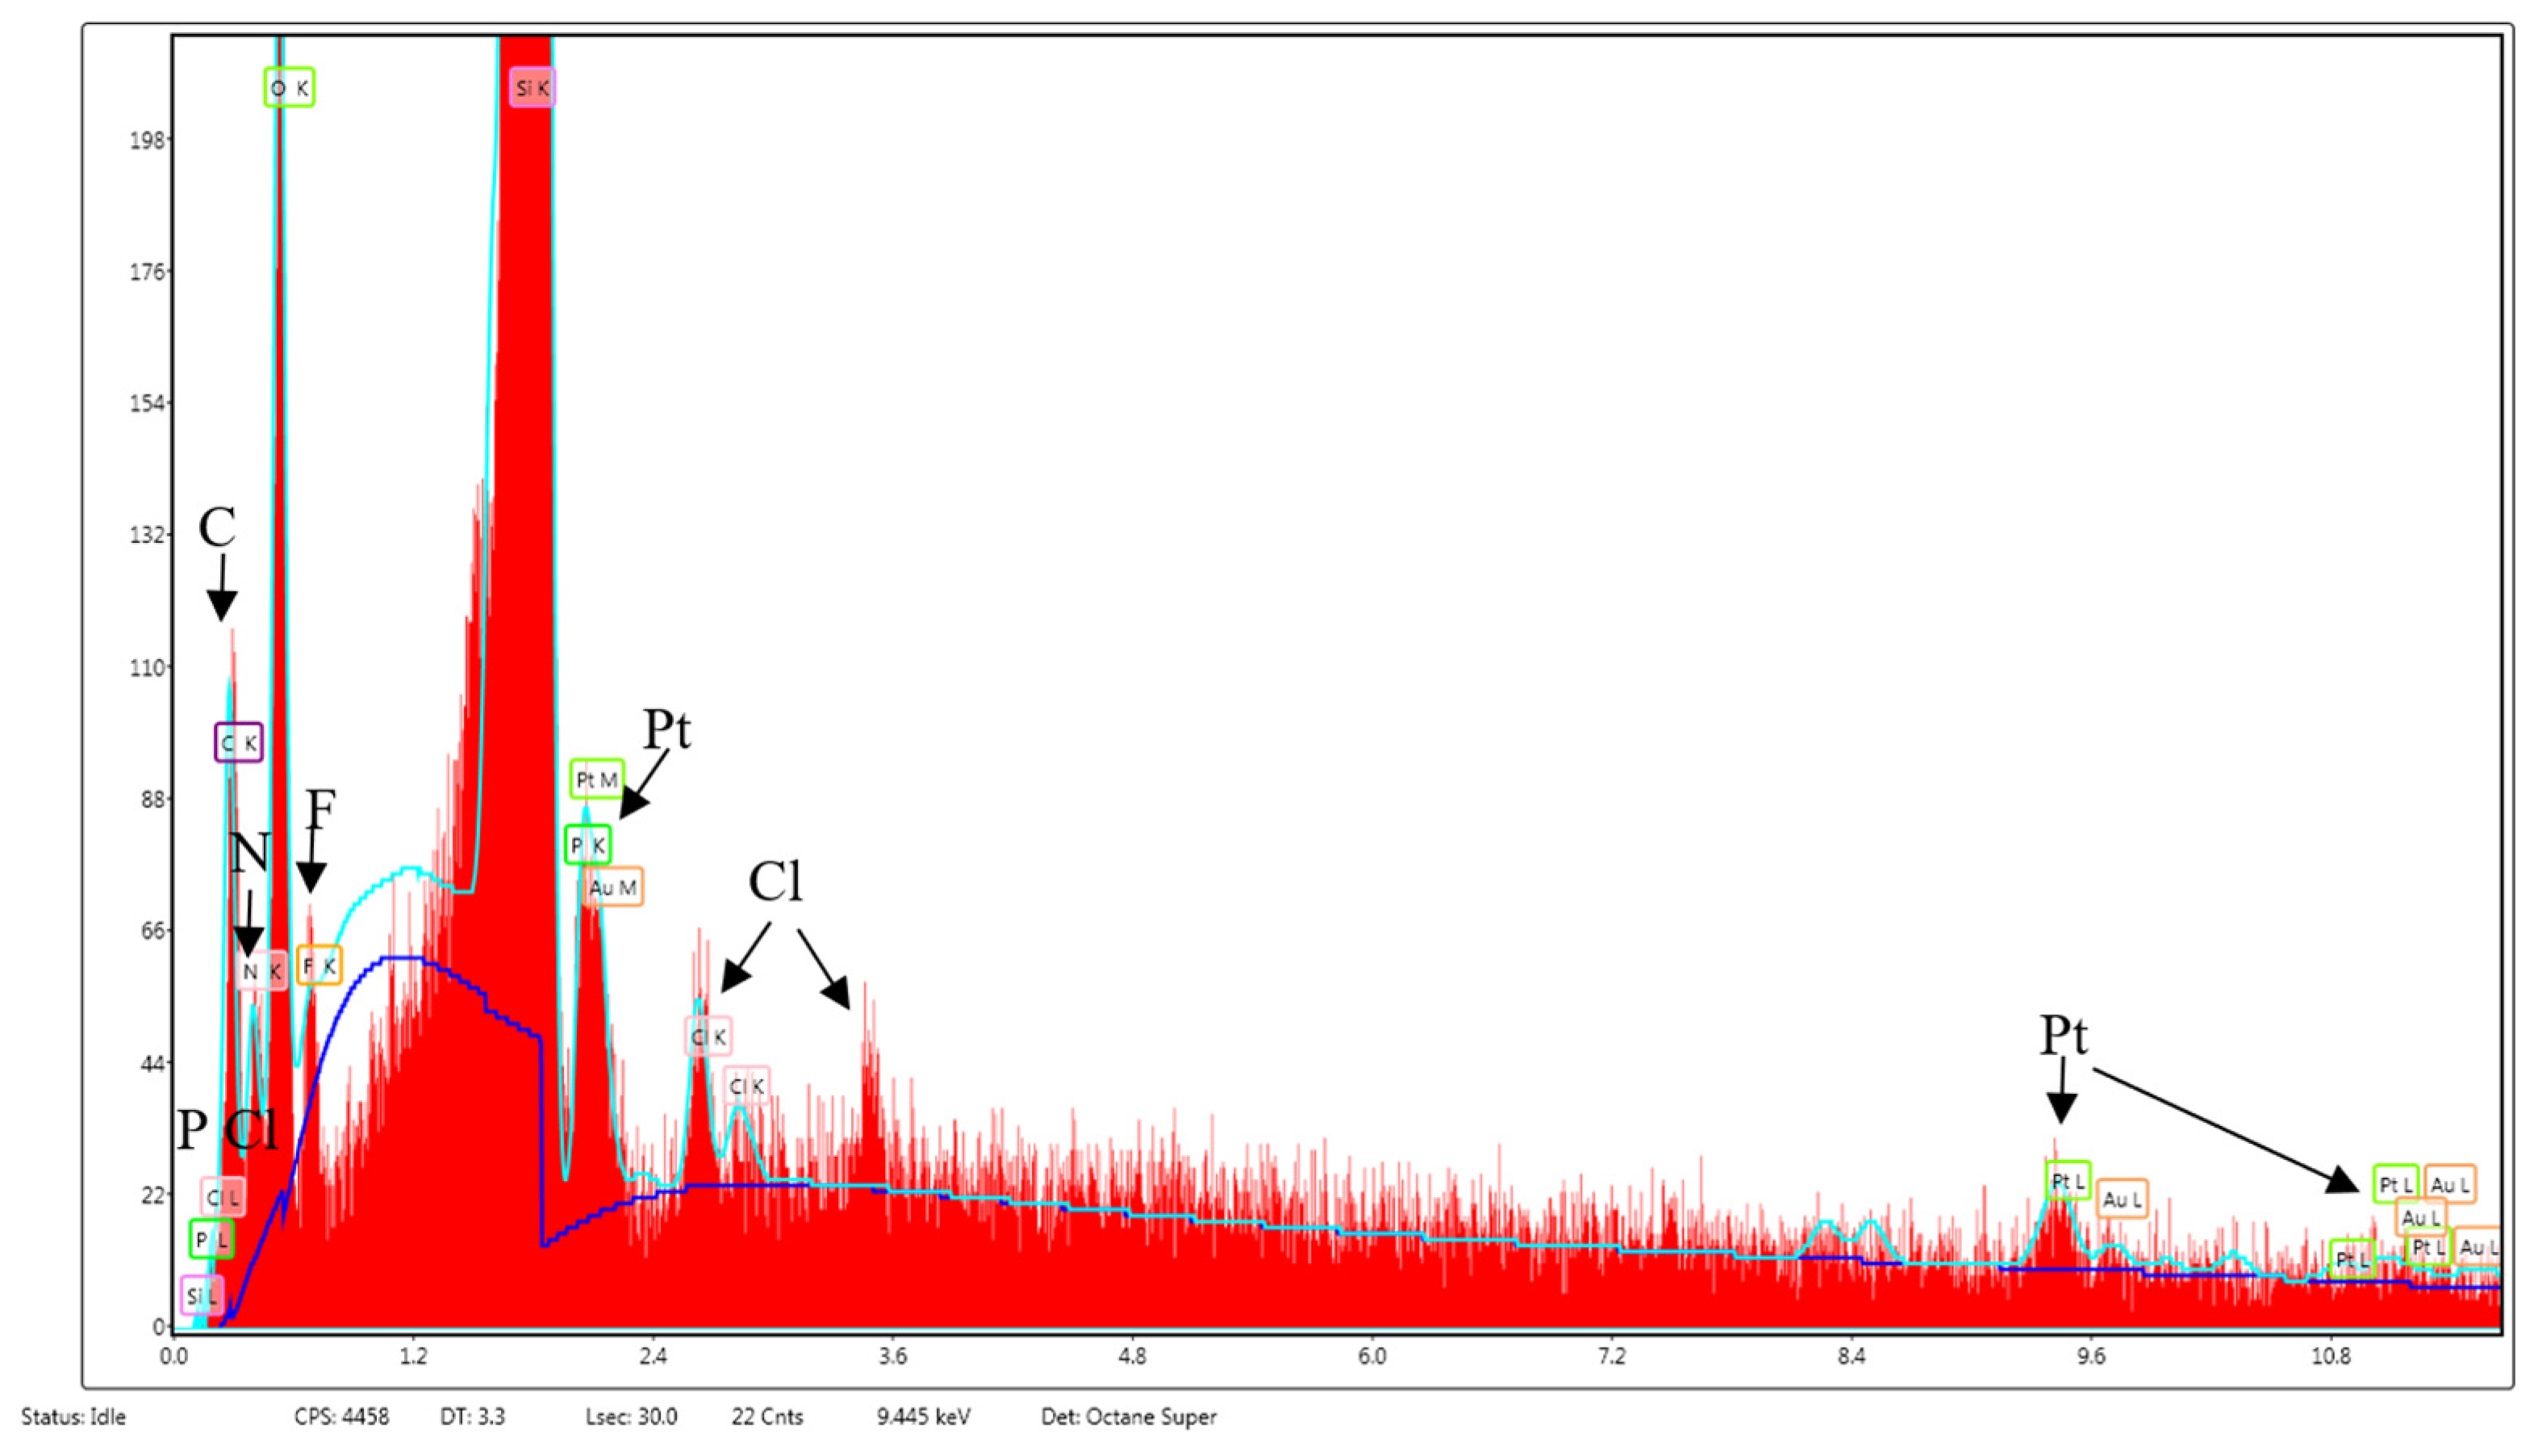
3.4. Characterization of [Pt(tpy)Cl](PF6) Nanocrystals by Mass Spectroscopy
3.5. Investigation of the Effect of Dispersion and Heat on [Pt(tpy)Cl](PF6) Nanocrystal Sizes
3.6. Effect of Pt[(tpy)Cl]PF6 Stock Solution Concentration on Nanocrystal Structures
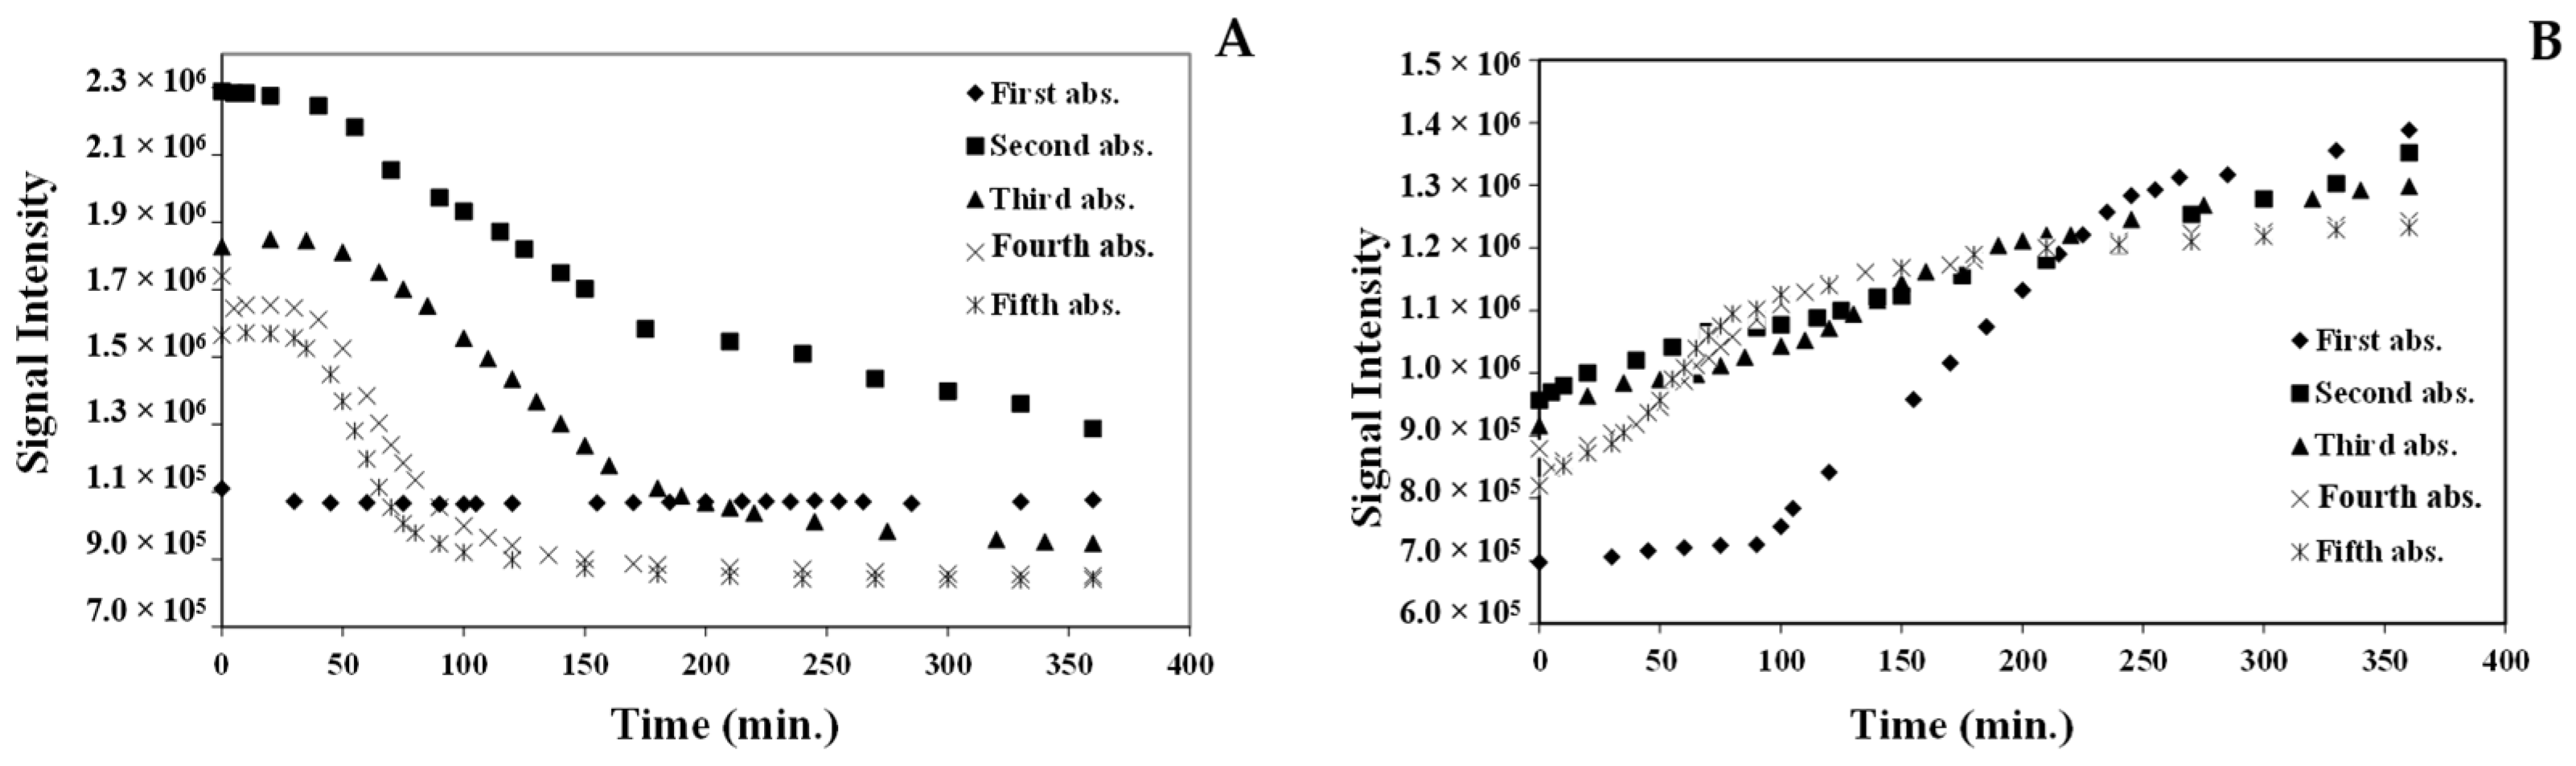
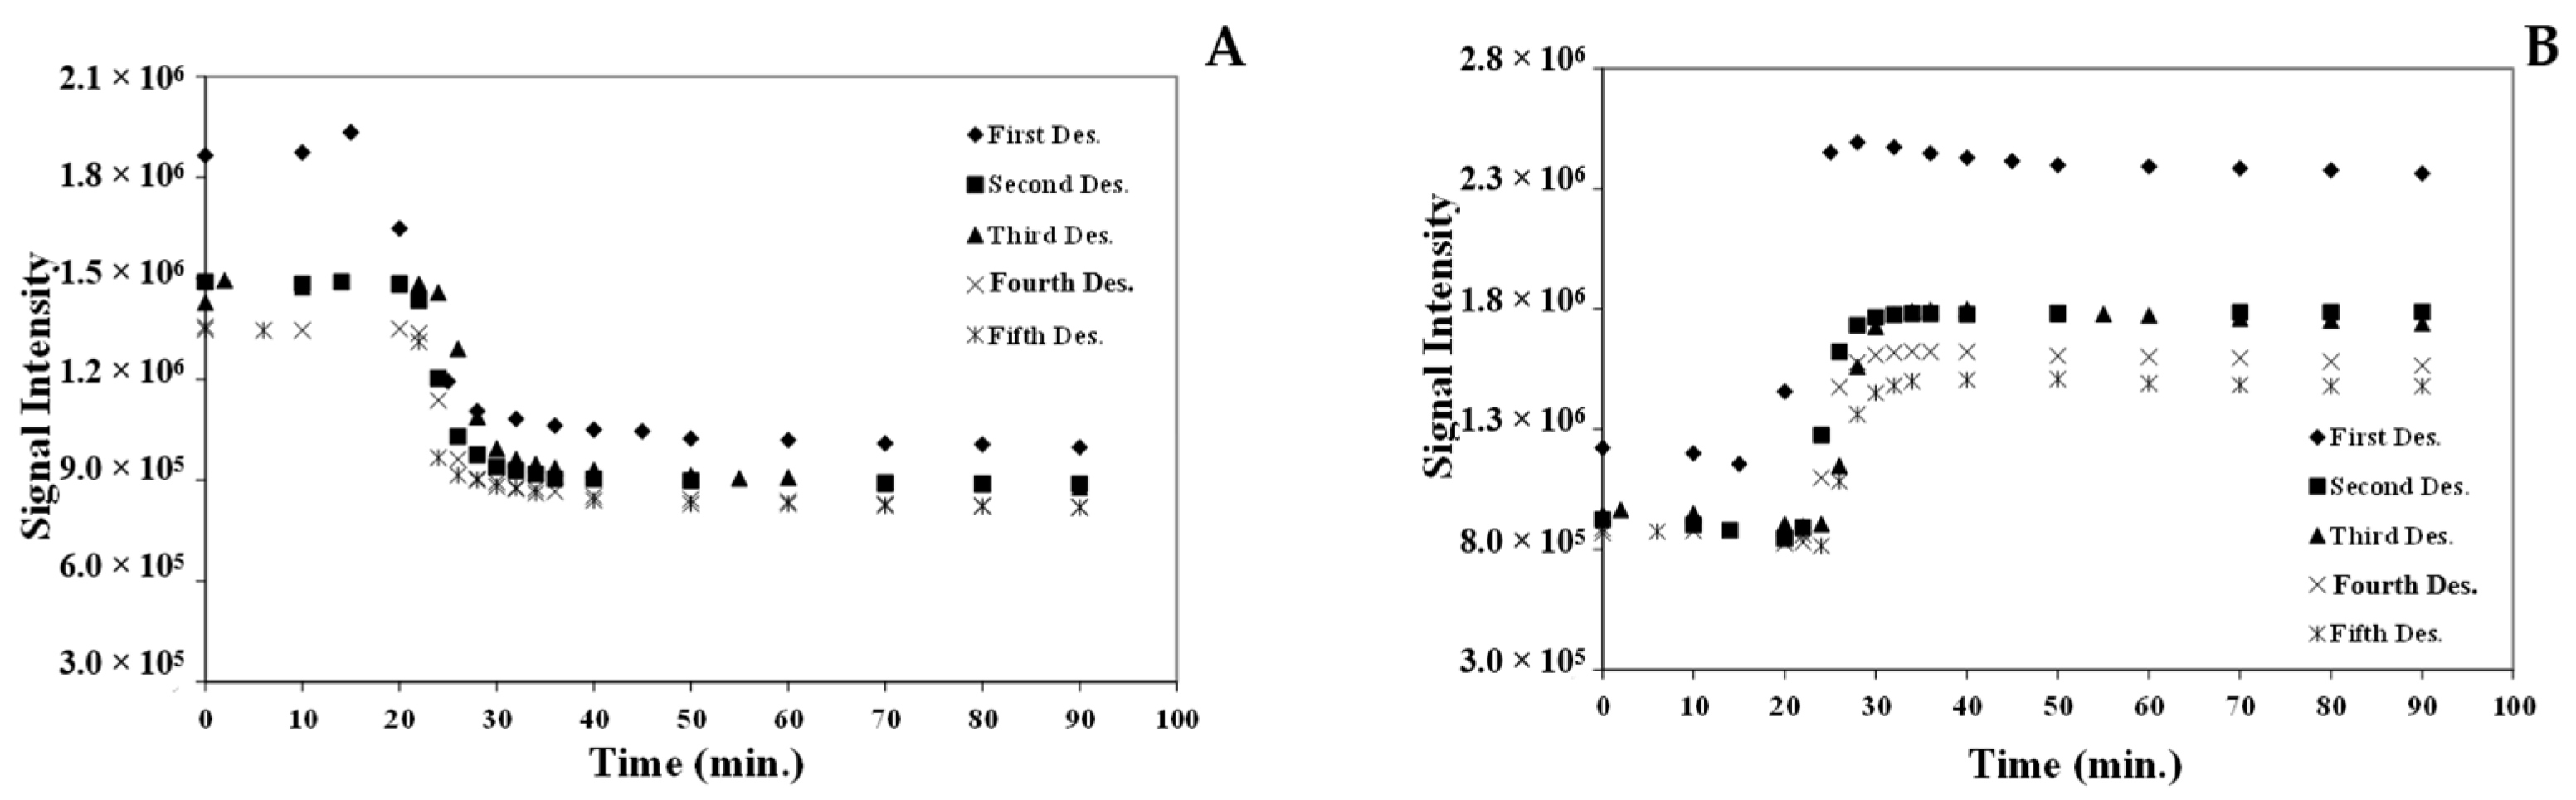
3.7. Vapochromic Studies of [Pt(tpy)Cl](PF6) Nanocrystals
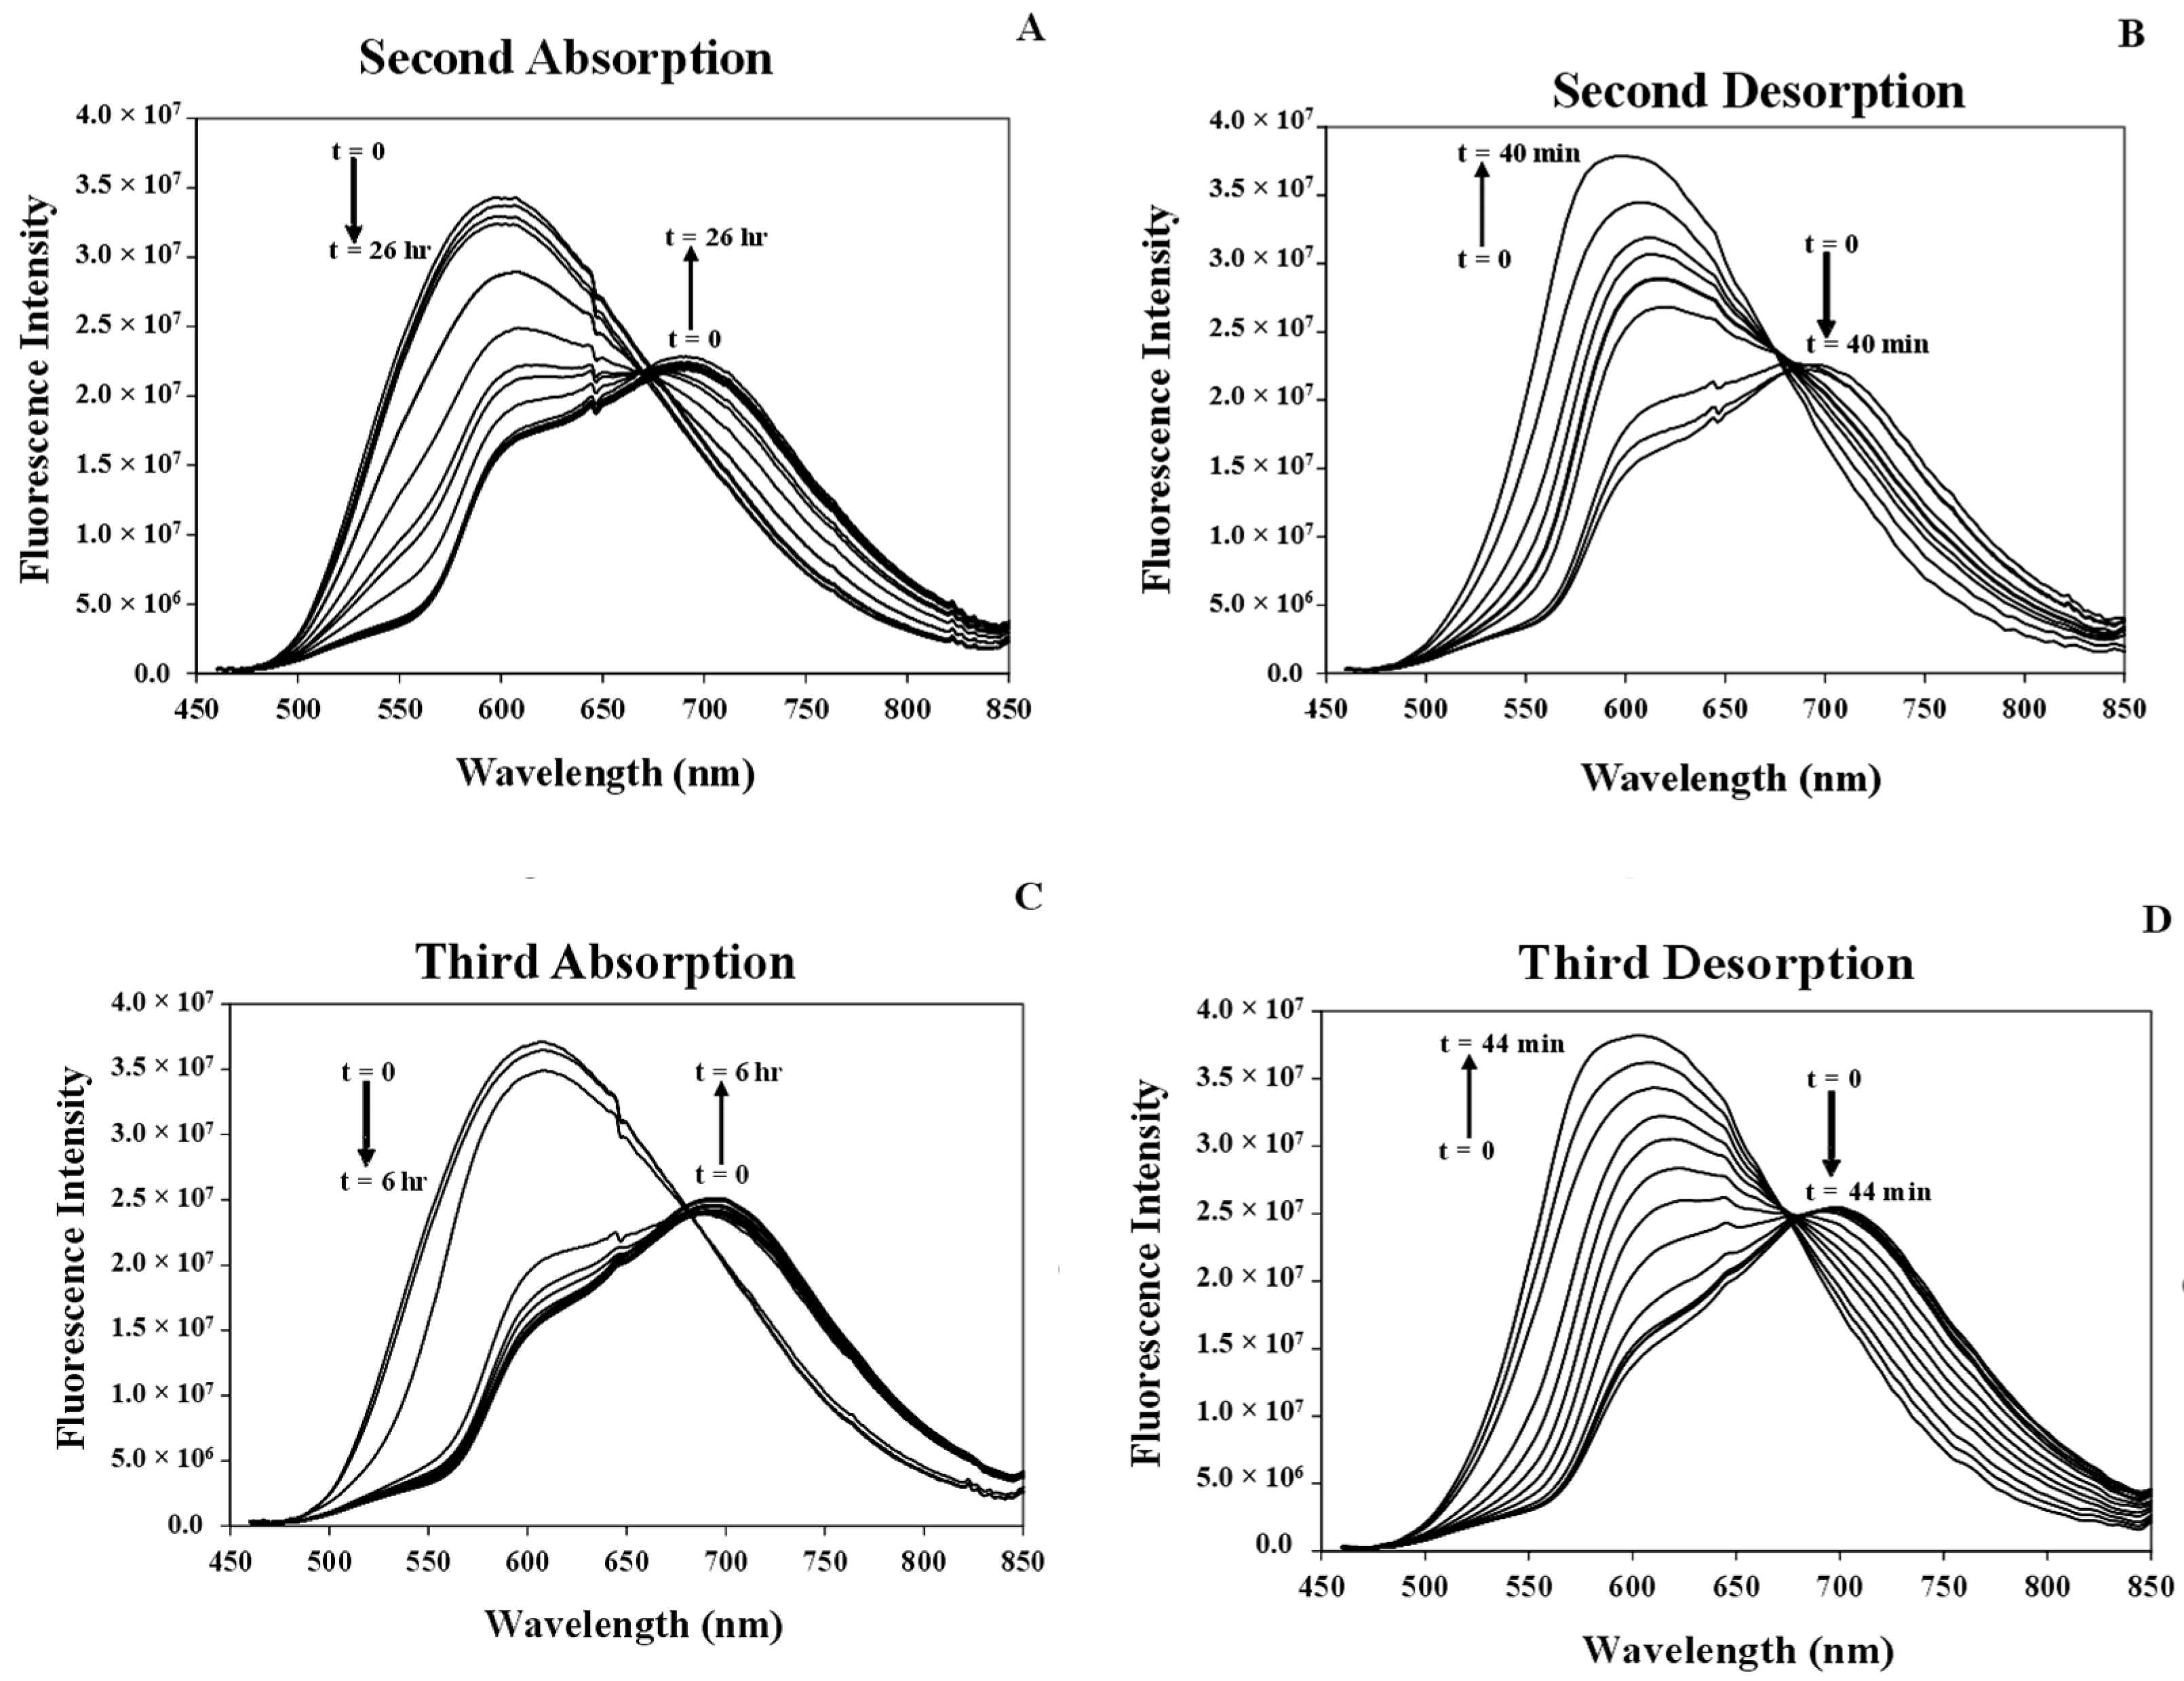
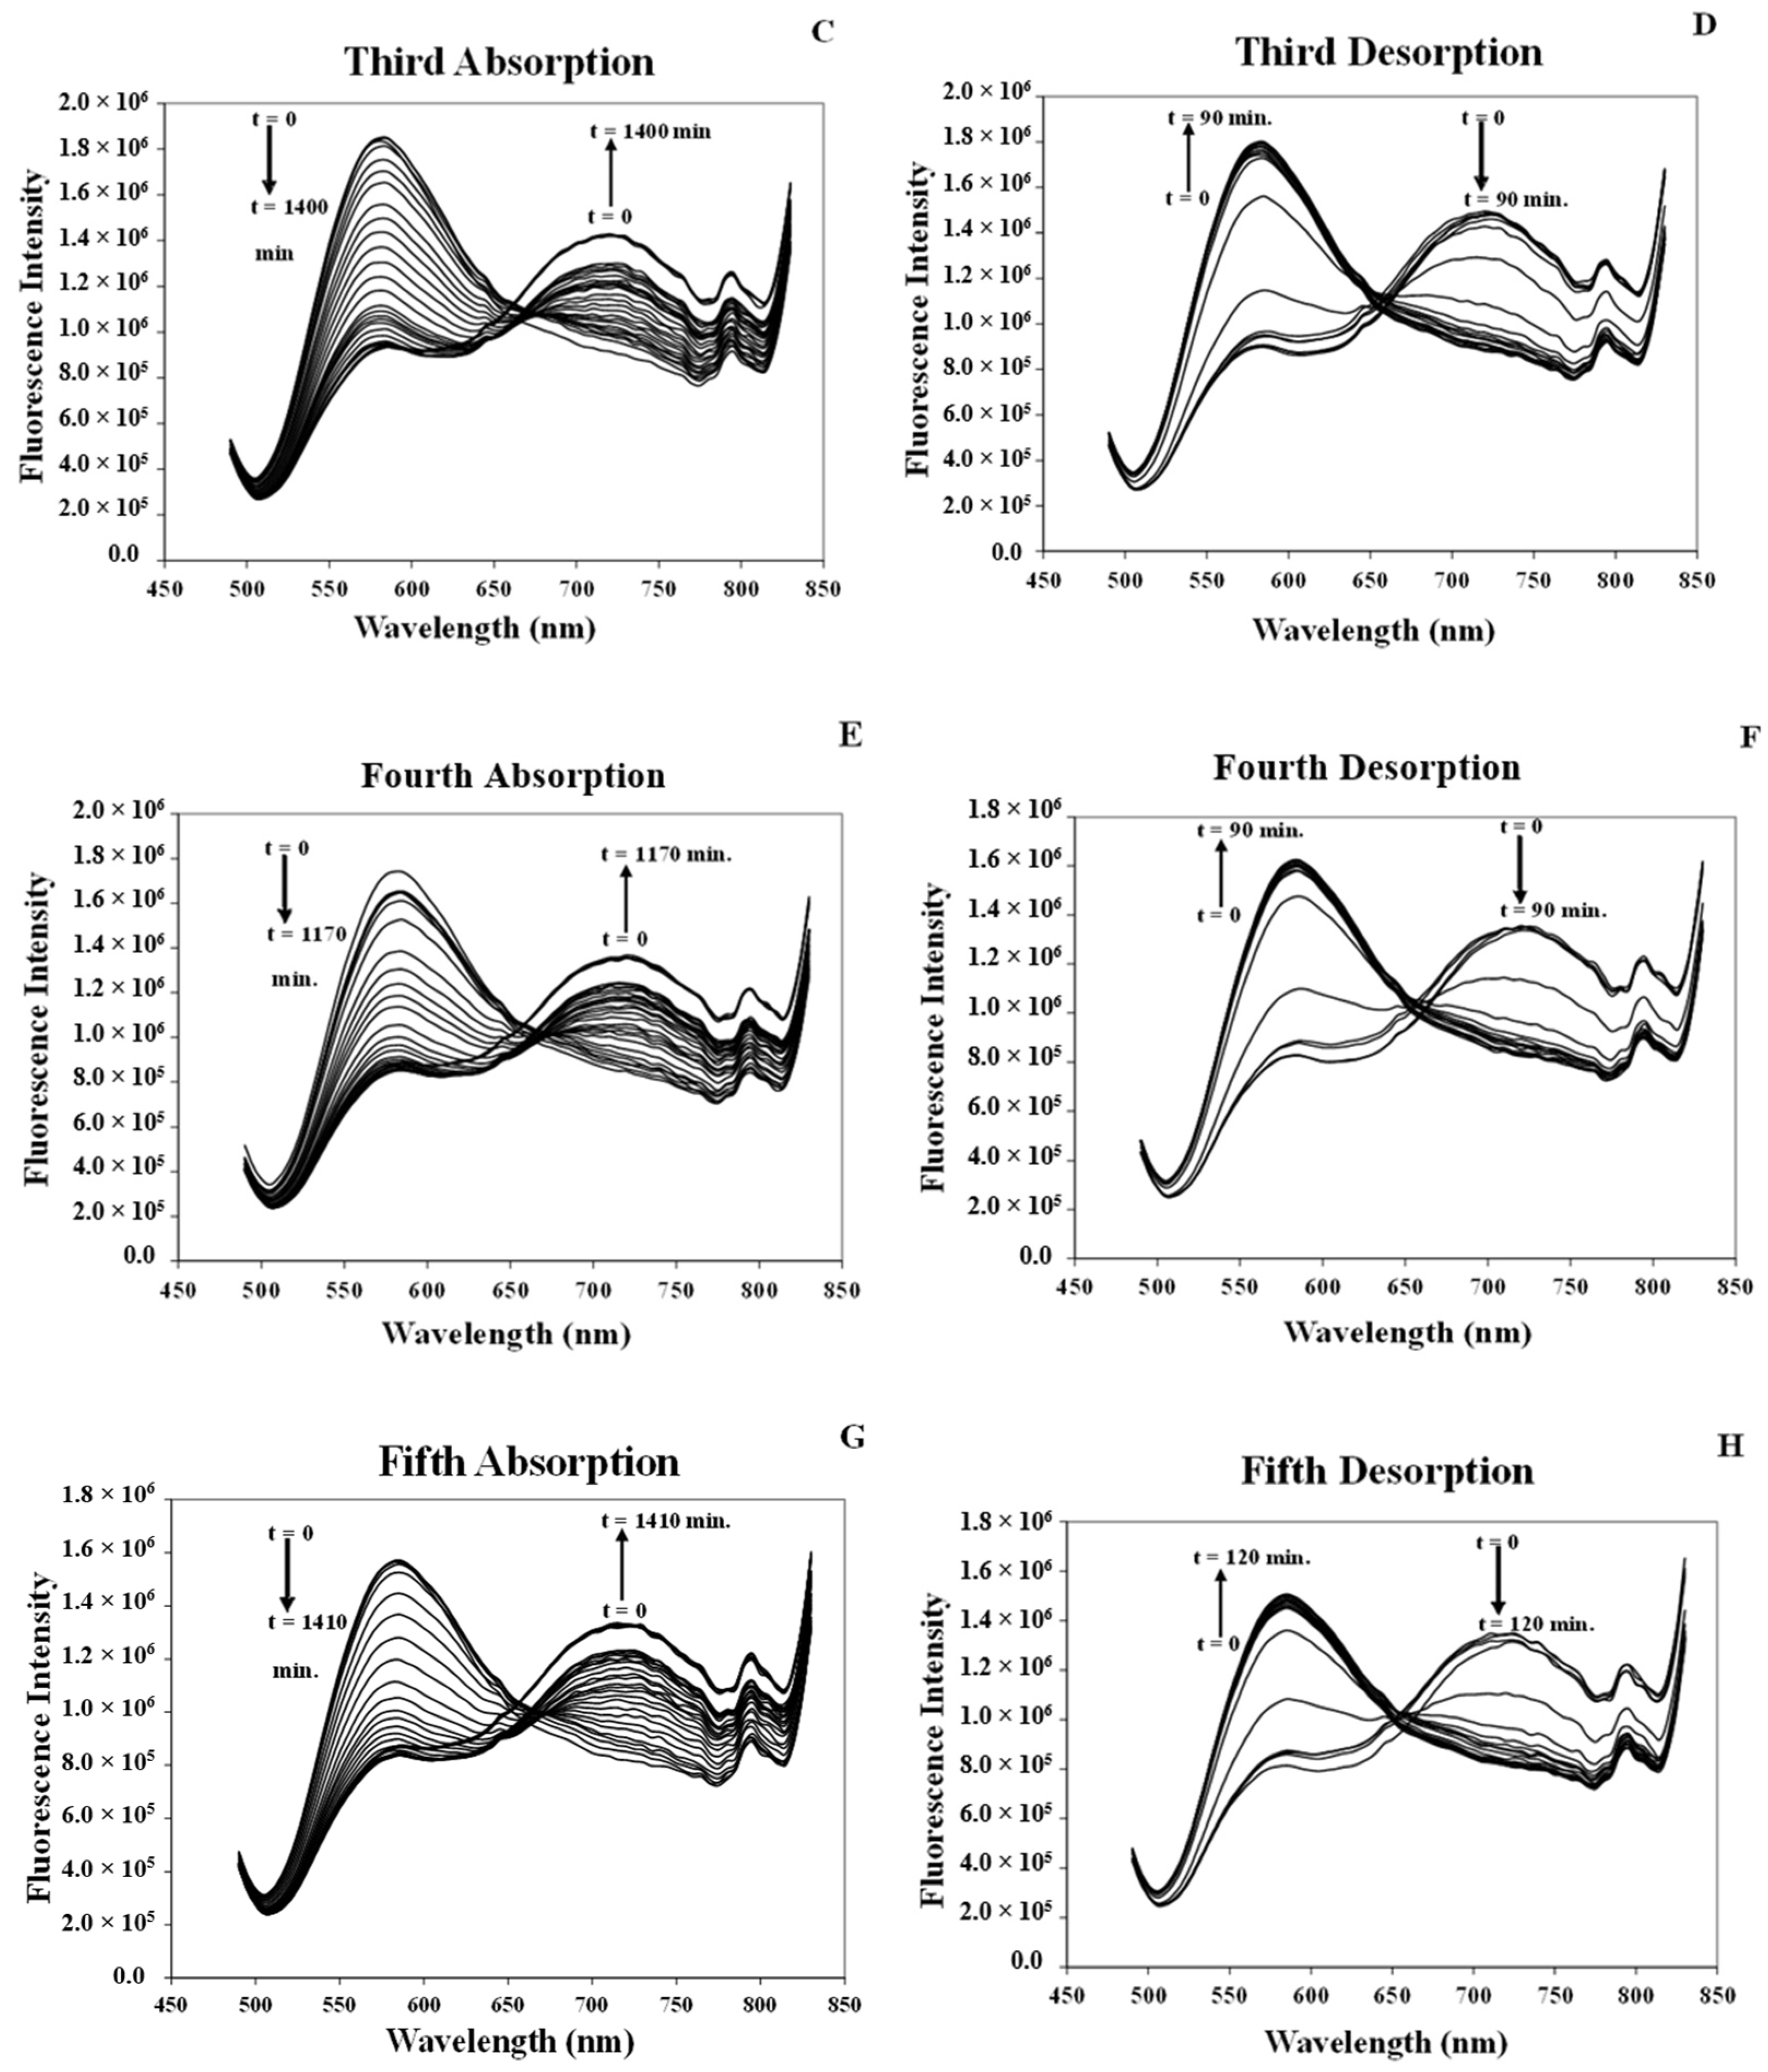
3.7.1. Studying Absorption/Desorption of MeCN Vapor in the Structure of [Pt(tpy)Cl](PF6) Nanocrystals
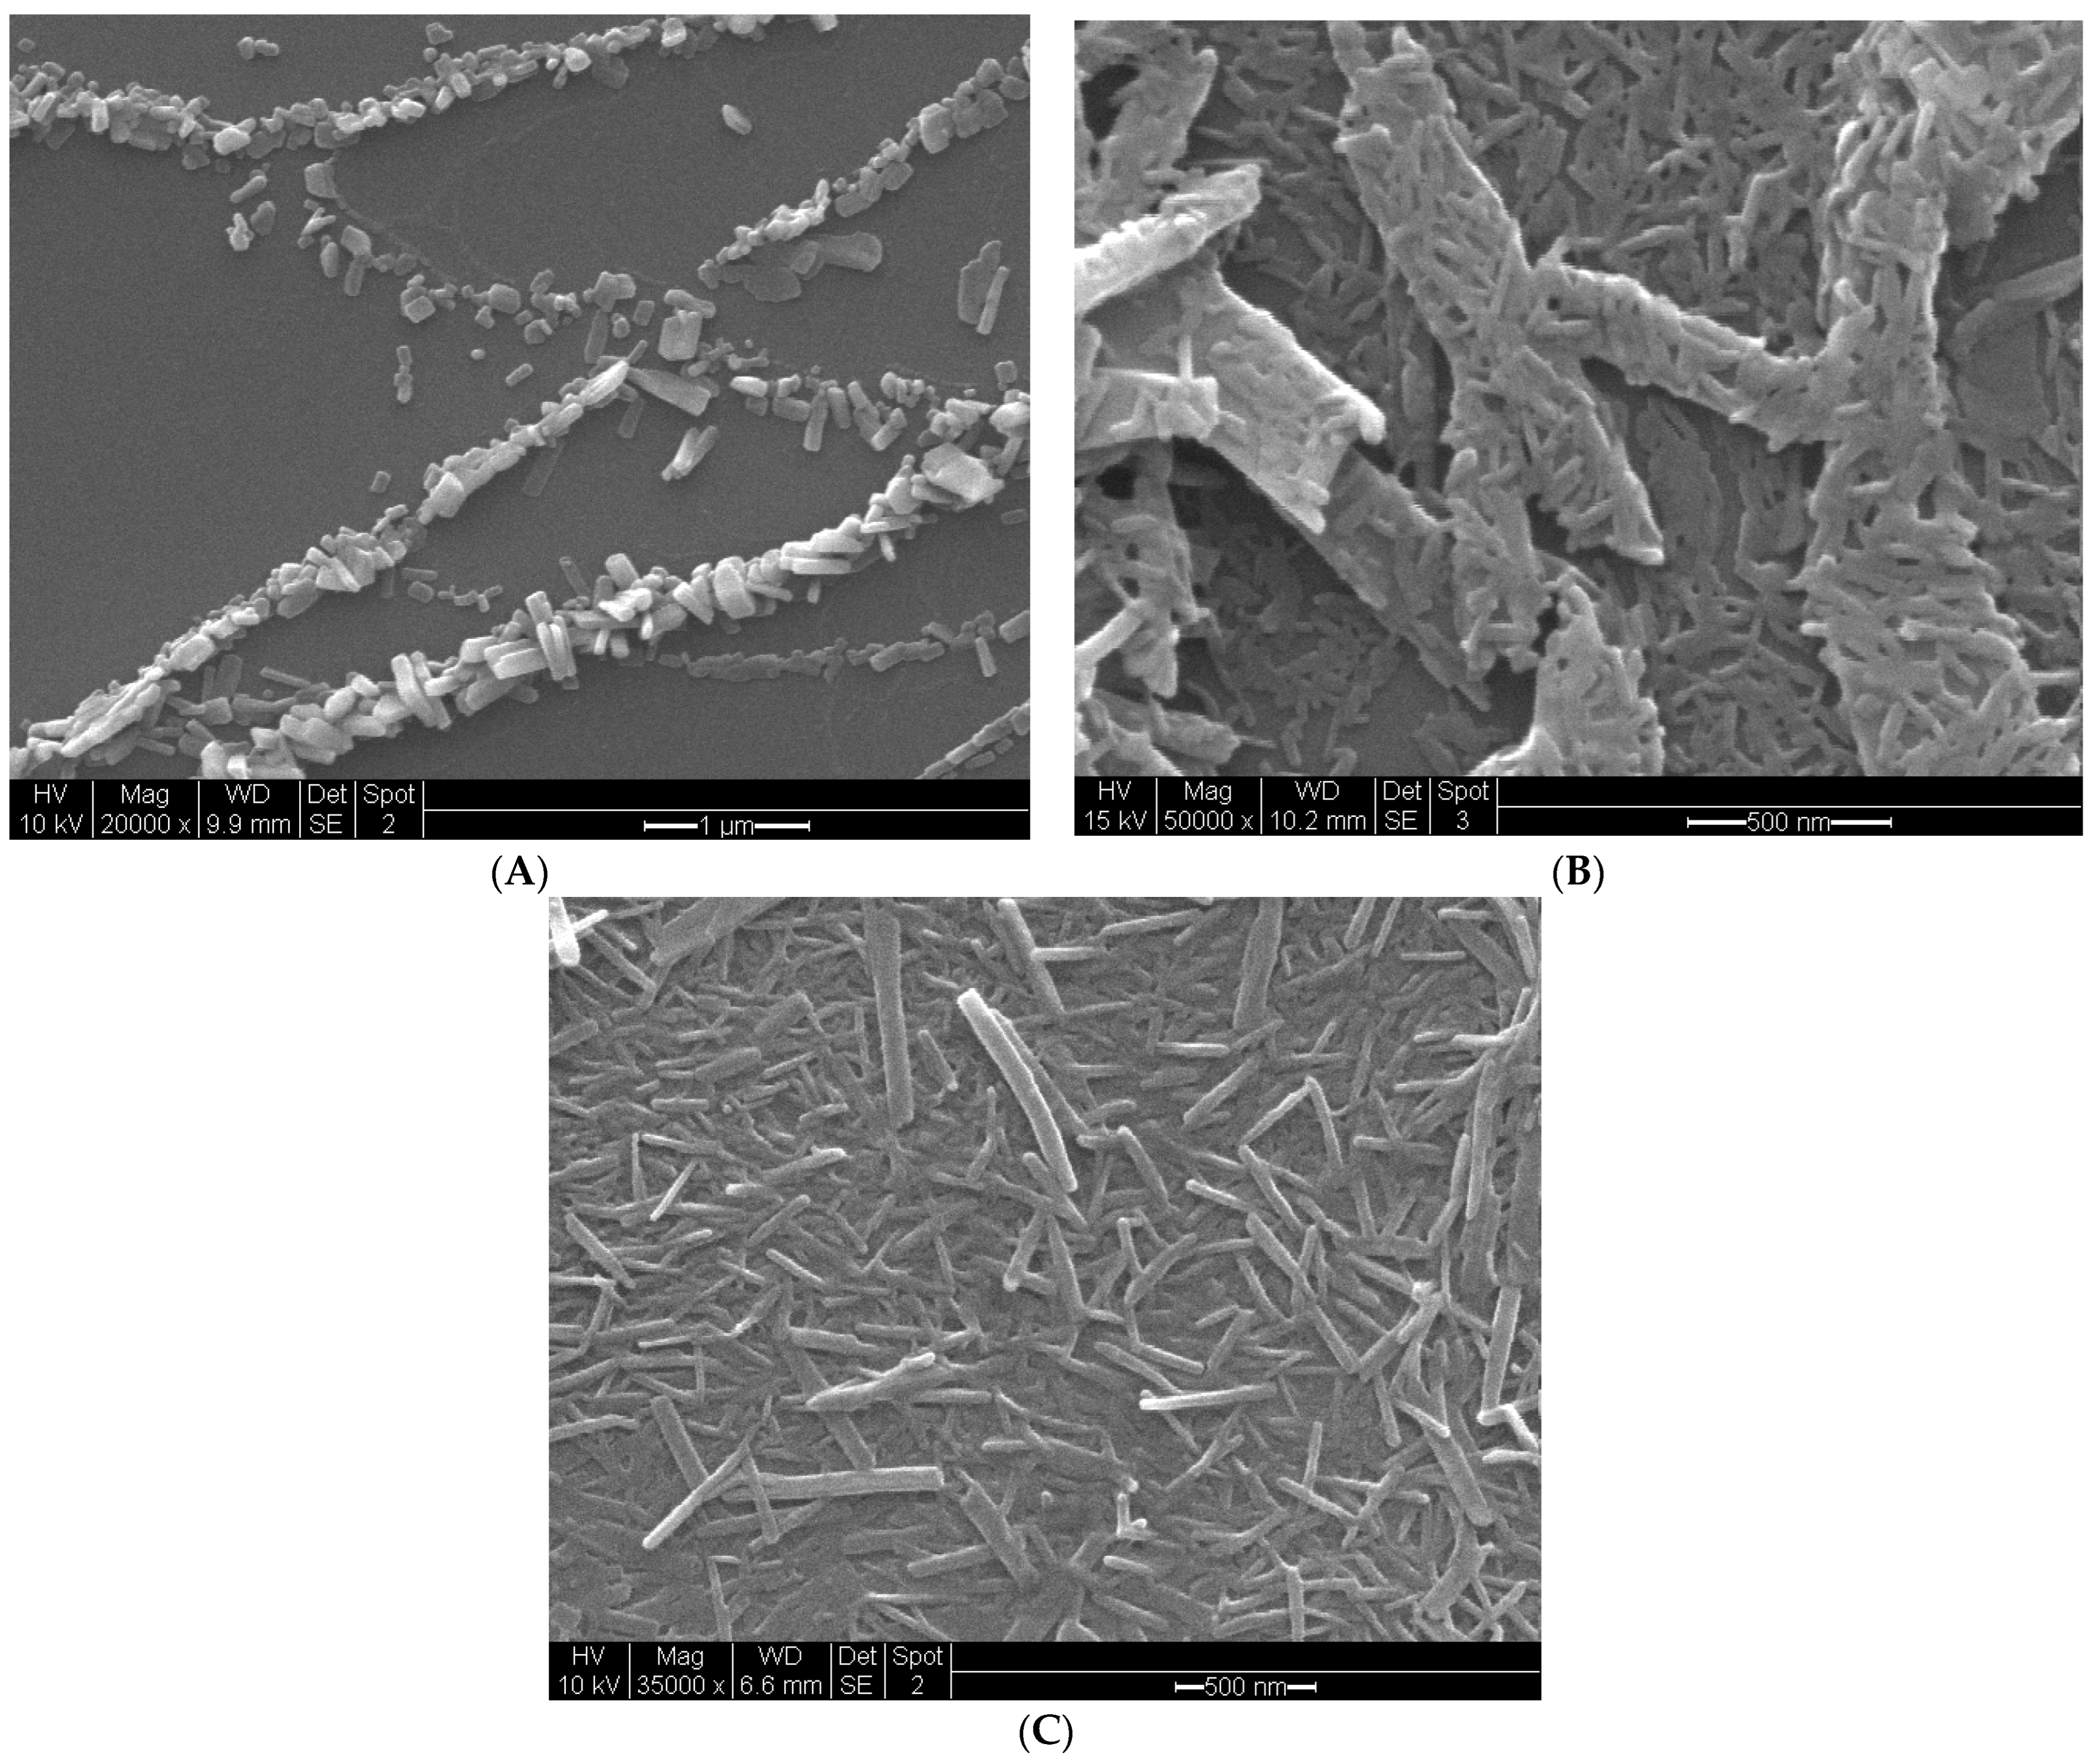
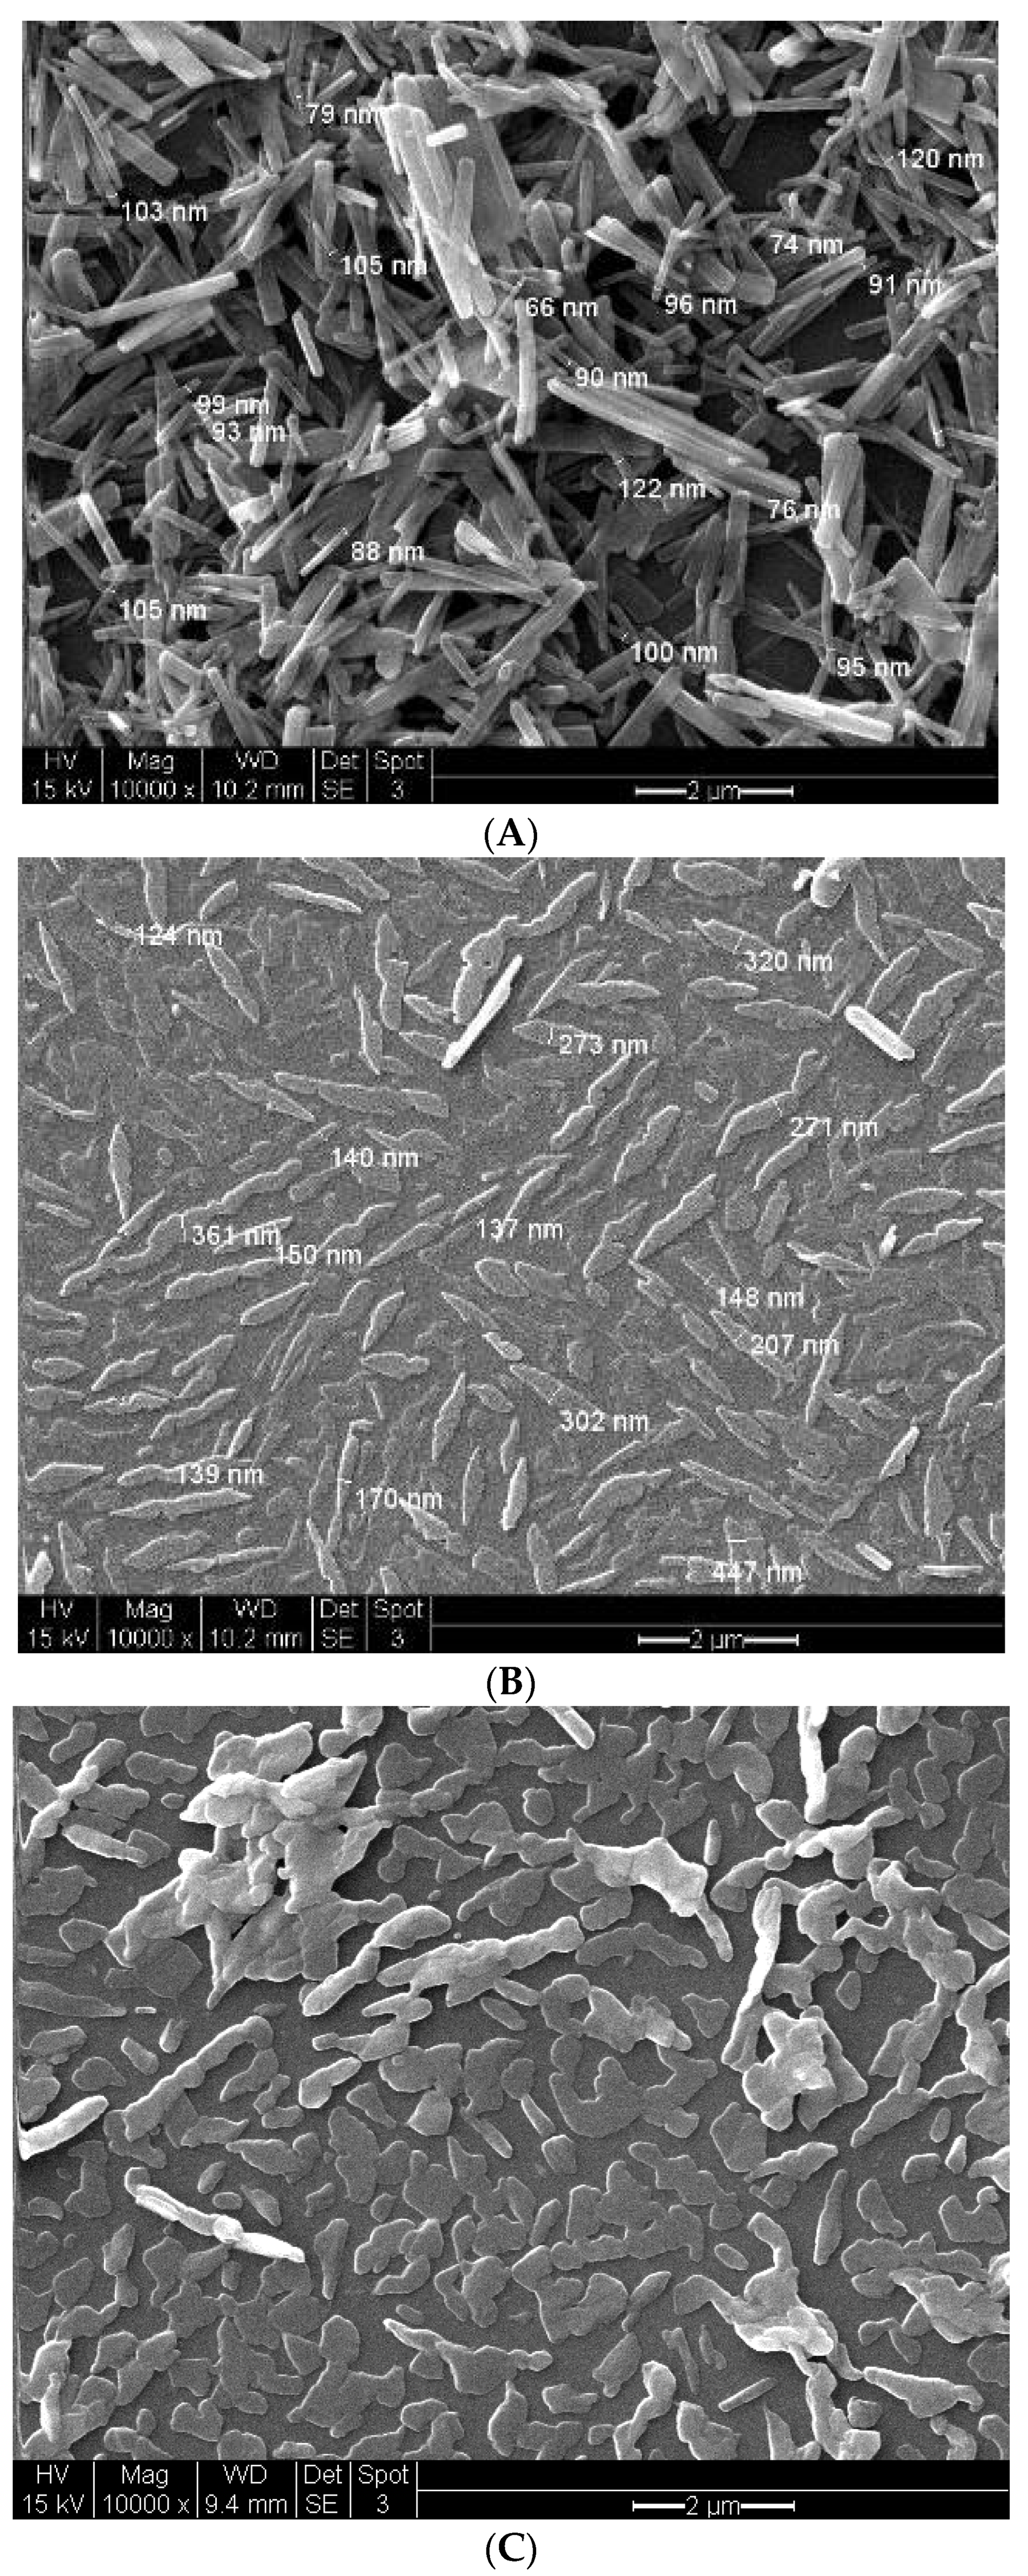
3.7.2. Vapochromic Studies on the SEM Images of the [Pt(tpy)Cl](PF6) Nanocrystals before and after Being Exposed to MeCN Vapor
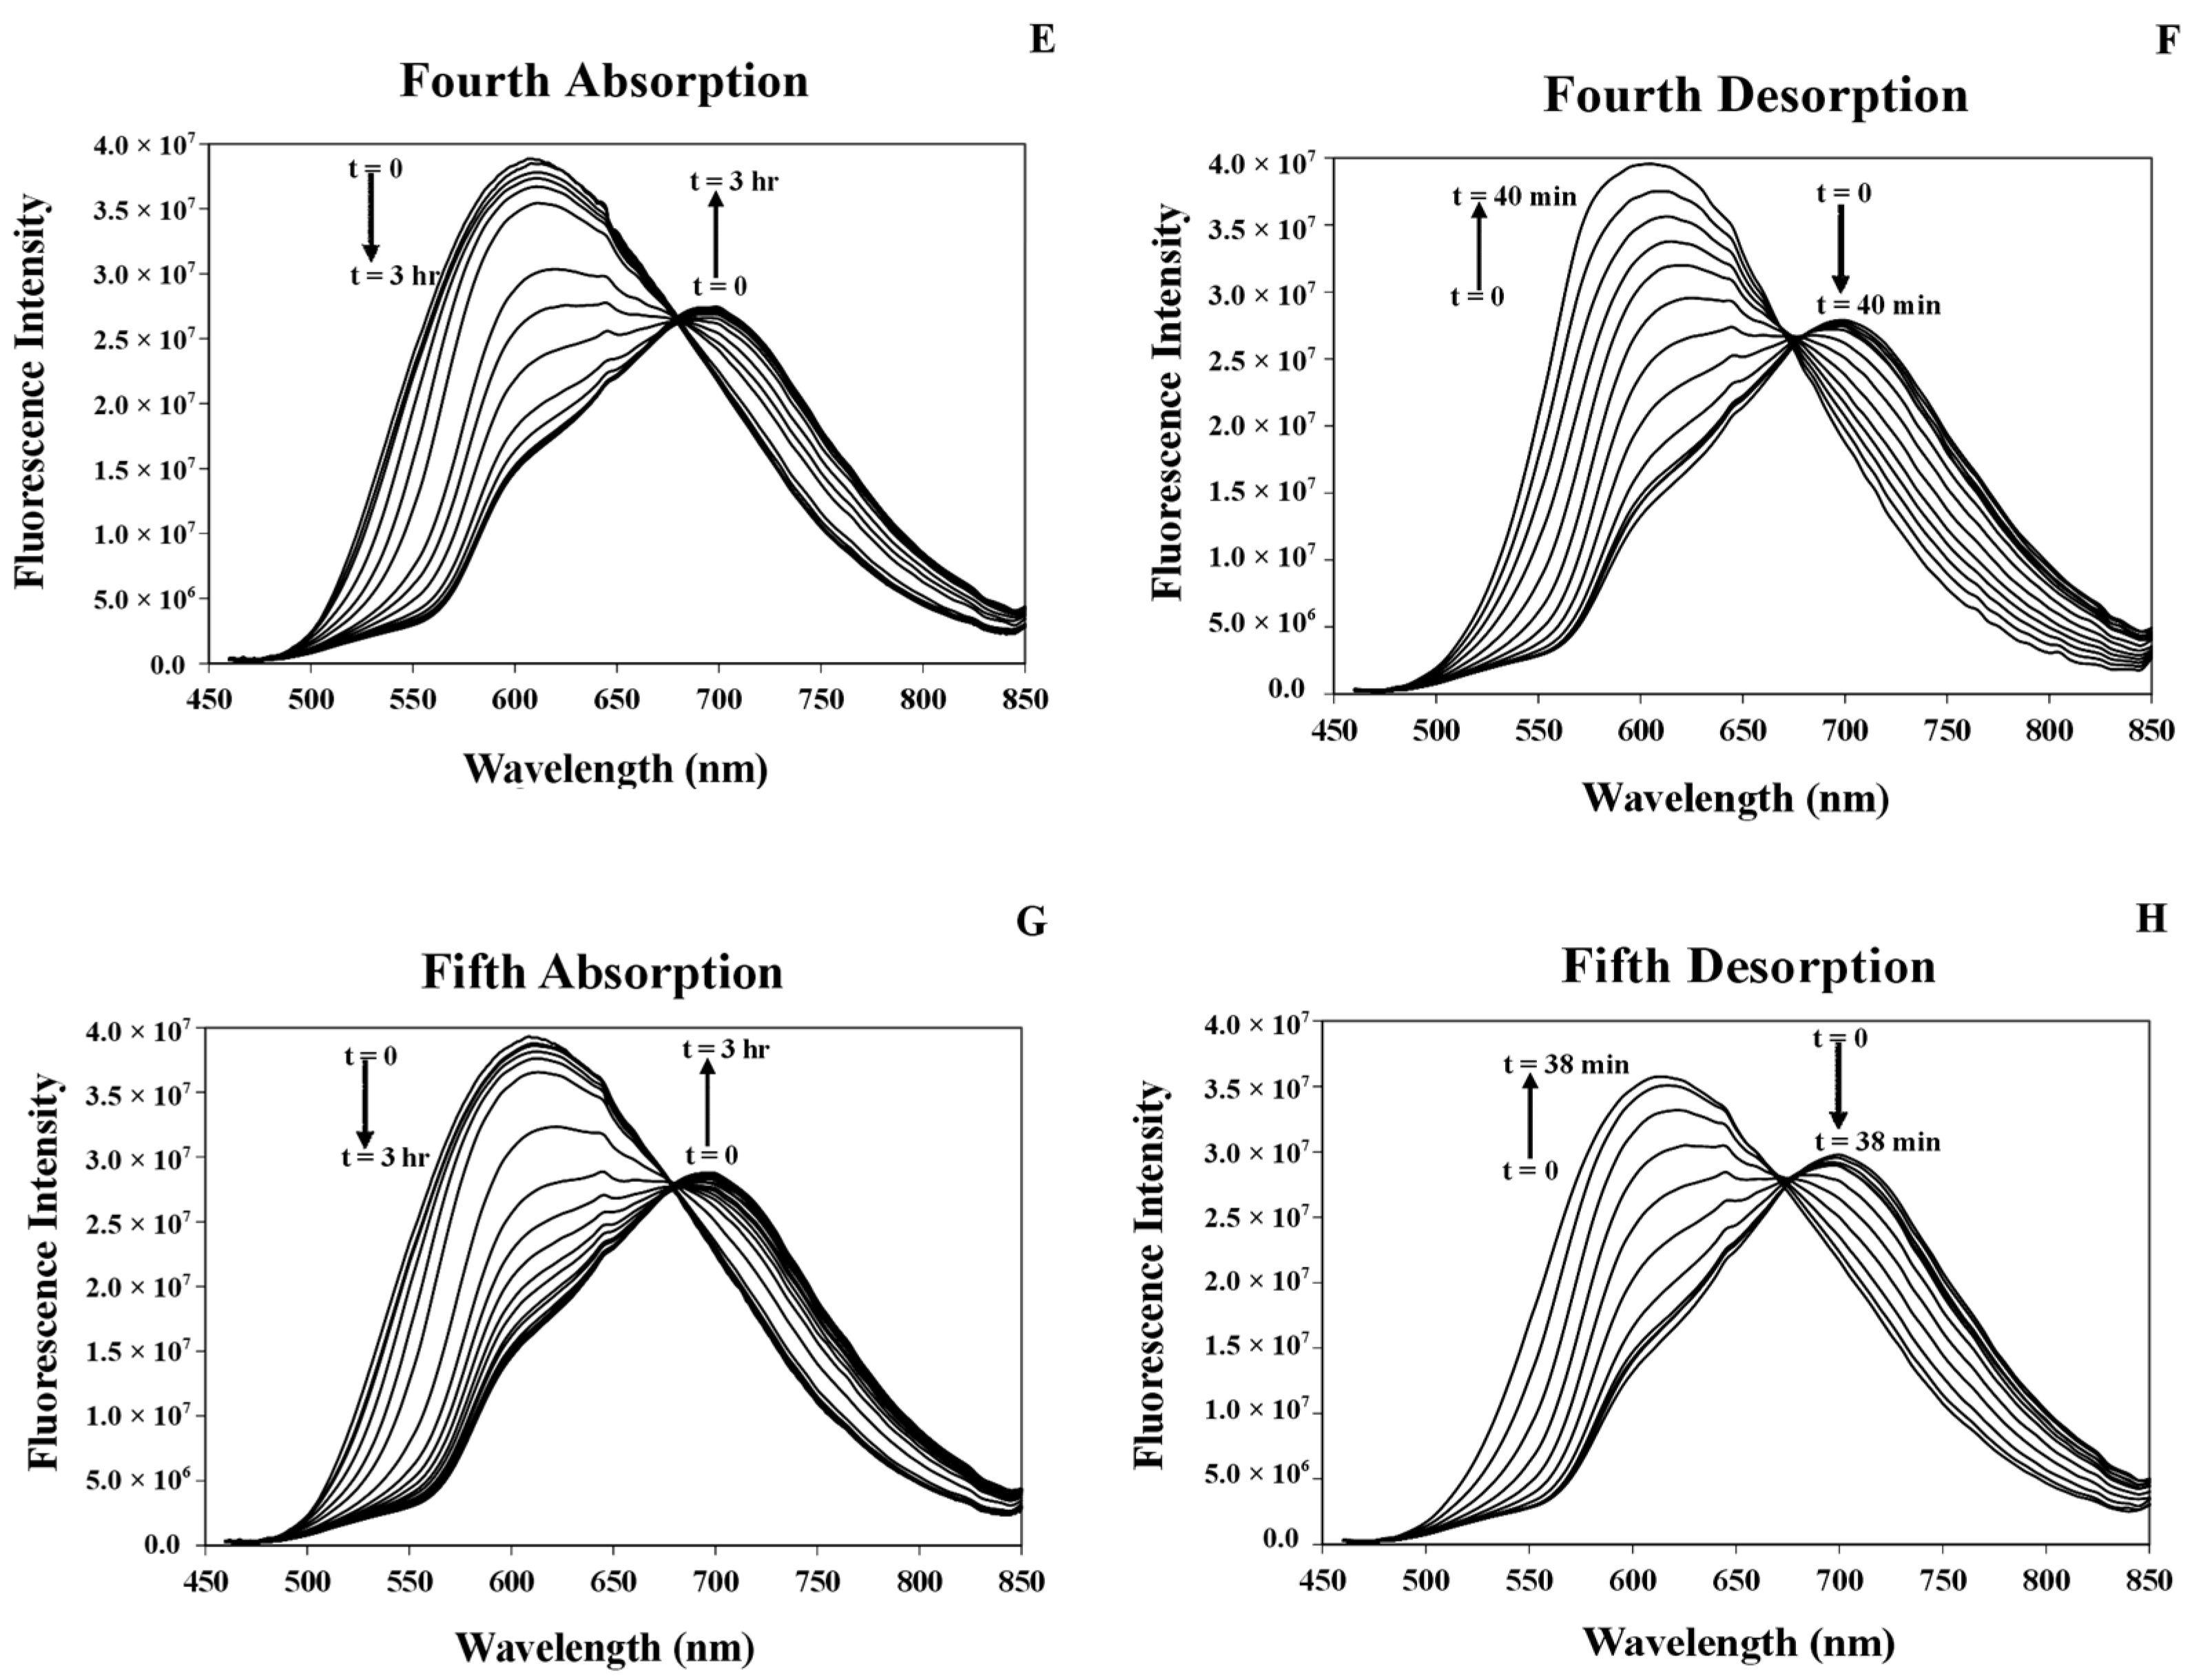
3.7.3. Response Time of the [Pt(tpy)Cl](PF6) Nanocrystals for the Absorption/Desorption of MeCN Vapor
3.8. Comparison of the Response Times of MeCN Vapor Absorption/Desorption of the [Pt(tpy)Cl](PF6) Crystals and Nanocrystals
4. Conclusions
Author Contributions
Funding
Data Availability Statement
Acknowledgments
Conflicts of Interest
References
- Kato, M.; Ito, H.; Hasegawa, M.; Ishii, K. Soft Crystals: Flexible Response Systems with High Structural Order. Chem. A Eur. J. 2019, 25, 5105–5112. [Google Scholar] [CrossRef]
- Evariste, S.; Khalil, A.M.; Kerneis, S.; Xu, C.; Calvez, G.; Costuas, K.; Lescop, C. Luminescent Vapochromic Single Crystal to Single Crystal Transition in One-Dimensional Coordination Polymer Featuring the First Cu(I) Dimer Bridged by an Aqua Ligand. Inorg. Chem. Front. 2020, 7, 3402–3411. [Google Scholar] [CrossRef]
- Utrera-Melero, R.; Huitorel, B.; Cordier, M.; Mevellec, J.-Y.; Massuyeau, F.; Latouche, C.; Martineau-Corcos, C.; Perruchas, S. Combining Theory and Experiment to Get Insight into the Amorphous Phase of Luminescent Mechanochromic Copper Iodide Clusters. Inorg. Chem. 2020, 59, 13607–13620. [Google Scholar] [CrossRef]
- Sergeenko, A.S.; Ovens, J.S.; Leznoff, D.B. Copper(II) Dihalotetracyanoplatinate(IV) Coordination Polymers and Their Vapochromic Behavior. Inorg. Chem. 2017, 56, 7870–7881. [Google Scholar] [CrossRef]
- Karabacak, S.; Qun, D.L.C.; Ammanath, G.; Yeasmin, S.; Yagmurcukardeş, M.; Alagappan, P.; Liedberg, B.; Yıldız, Ü.H. Polarity Induced Vapochromism and Vapoluminescence of Polythiophene Derivatives for Volatile Organic Compounds Classification. Sens. Actuators B Chem. 2023, 389, 133884. [Google Scholar] [CrossRef]
- Zhang, X.; Li, B.; Chen, Z.-H.; Chen, Z.-N. Luminescence Vapochromism in Solid Materials Based on Metal Complexes for Detection of Volatile Organic Compounds (VOCs). J. Mater. Chem. 2012, 22, 11427. [Google Scholar] [CrossRef]
- Yam, V.W.-W.; Au, V.K.-M.; Leung, S.Y.-L. Light-Emitting Self-Assembled Materials Based on D8 and D10 Transition Metal Complexes. Chem. Rev. 2015, 115, 7589–7728. [Google Scholar] [CrossRef]
- Li, E.; Jie, K.; Liu, M.; Sheng, X.; Zhu, W.; Huang, F. Vapochromic Crystals: Understanding Vapochromism from the Perspective of Crystal Engineering. Chem. Soc. Rev. 2020, 49, 1517–1544. [Google Scholar] [CrossRef]
- Taylor, S.D.; Howard, W.; Kaval, N.; Hart, R.; Krause, J.A.; Connick, W.B. Solid-State Materials for Anion Sensing in Aqueous Solution: Highly Selective Colorimetric and Luminescence-Based Detection of Perchlorate Using a Platinum(II) Salt. Chem. Commun. 2010, 46, 1070. [Google Scholar] [CrossRef]
- Taylor, S. Solid-State Structures and Electronic Properties of Platinum(II) Terpyridyl Complexes: Implications for Vapor and Aqueous Anion Sensing; University of Cincinnati: Cincinnati, OH, USA, 2011. [Google Scholar]
- Ni, J.; Zheng, W.; Qi, W.-J.; Guo, Z.-C.; Liu, S.-Q.; Zhang, J.-J. Synthesis, Structure and Luminescent Switching Properties of Cycloplatinated(II) Complexes Bearing Phenyl β-Diketone Ligands. J. Organomet. Chem. 2021, 952, 122048. [Google Scholar] [CrossRef]
- Ohno, K.; Shiraishi, K.; Sugaya, T.; Nagasawa, A.; Fujihara, T. Cyclometalated Platinum(II) Complexes in a Cis-N, N Configuration: Photophysical Properties and Isomerization to Trans Isomers. Inorg. Chem. 2022, 61, 3420–3433. [Google Scholar] [CrossRef]
- Li, B.; Liang, Z.; Yan, H.; Li, Y. Visual Self-Assembly and Stimuli-Responsive Materials Based on Recent Phosphorescent Platinum(II) Complexes. Mol. Syst. Des. Eng. 2020, 5, 1578–1605. [Google Scholar] [CrossRef]
- Soto, M.A.; Kandel, R.; MacLachlan, M.J. Chromic Platinum Complexes Containing Multidentate Ligands. Eur. J. Inorg. Chem. 2021, 2021, 894–906. [Google Scholar] [CrossRef]
- Shiotsuka, M.; Ono, R.; Kurono, Y.; Asano, T.; Sakae, Y. Photoluminescence of Platinum(II) Diethynylphenanthroline Organometallic Complexes with Bis-Arylethynyl Derivatives in Solution and Solid State. J. Organomet. Chem. 2019, 880, 116–123. [Google Scholar] [CrossRef]
- Shiotsuka, M.; Asano, T.; Kurono, Y.; Ono, R.; Kawabe, R. Synthesis and Photophysical Characterization of Phosphorescent Platinum(II) Bis-(Trimethylsilyl)Ethynyl-Phenanthroline Organometallic Complexes with Bis-Arylethynyl Derivatives. J. Organomet. Chem. 2017, 851, 1–8. [Google Scholar] [CrossRef]
- Shiotsuka, M.; Goto, A.; Miura, S.; Uekusa, H.; Ono, R. Vapochromism and Vapoluminescence of Platinum(II) 3,8-Bis-(3-Hydroxy-3-Methylbut-1-Yn-1-Yl)-Phenanthroline Organometallic Complexes with Bis-Arylethynyl Derivatives. J. Organomet. Chem. 2020, 929, 121554. [Google Scholar] [CrossRef]
- Shiotsuka, M.; Ogihara, M.; Hanada, T.; Kasai, K. Multicolor Detection with Vapochromism of Platinum(II) 3,8-Bis-(2-Triethylsilylethynyl)-Phenanthroline Organometallic Complexes with Bis-Arylethynyl Derivatives. J. Organomet. Chem. 2022, 965–966, 122334. [Google Scholar] [CrossRef]
- Norton, A.E.; Karimi Abdolmaleki, M.; Zhao, D.; Taylor, S.D.; Kennedy, S.R.; Ball, T.D.; Bovee, M.O.; Connick, W.B.; Chatterjee, S. Vapoluminescence Hysteresis in a Platinum(II) Salt-Based Humidity Sensor: Mapping the Vapochromic Response to Water Vapor. Sens. Actuators B Chem. 2022, 359, 131502. [Google Scholar] [CrossRef]
- Ni, J.; Guo, Z.; Zhu, Q.; Liu, S.; Zhang, J. The Two-Stepwise Luminescent Switching Properties of Triple-Stimuli-Responsive Platinum(II) Complexes Bearing 4,4′-Bis(2-Phenylethynyl)-2,2′-Bipyridine Ligand. Dye. Pigment. 2023, 217, 111406. [Google Scholar] [CrossRef]
- Kobayashi, A.; Kato, M. Vapochromic Platinum(II) Complexes: Crystal Engineering toward Intelligent Sensing Devices. Eur. J. Inorg. Chem. 2014, 2014, 4469–4483. [Google Scholar] [CrossRef]
- Lai, S.-W.; Chan, M.C.W.; Cheung, K.-K.; Che, C.-M. Spectroscopic Properties of Luminescent Platinum(II) Complexes Containing 4,4′,4″-Tri-Tert-Butyl-2,2′:6′,2″-Terpyridine (tBu3Tpy). Crystal Structures of [Pt(tBu3Tpy)Cl]ClO4 and [Pt(tBu3Tpy){CH2C(O)Me}]ClO4. Inorg. Chem. 1999, 38, 4262–4267. [Google Scholar] [CrossRef]
- Büchner, R.; Cunningham, C.T.; Field, J.S.; Haines, R.J.; McMillin, D.R.; Summerton, G.C. Luminescence Properties of Salts of the [Pt(4′Ph-Terpy)Cl]+ Chromophore: Crystal Structure of the Red Form of [Pt(4′Ph-Terpy)Cl]BF4 (4′Ph-Terpy = 4′-Phenyl-2,2′:6′,2″-Terpyridine). J. Chem. Soc. Dalton Trans. 1999, 999, 711–718. [Google Scholar] [CrossRef]
- Hill, M.G.; Bailey, J.A.; Miskowski, V.M.; Gray, H.B. Spectroelectrochemistry and Dimerization Equilibria of Chloro(Terpyridine)Platinum(II). Nature of the Reduced Complexes. Inorg. Chem. 1996, 35, 4585–4590. [Google Scholar] [CrossRef]
- Kui, S.C.F.; Law, Y.-C.; Tong, G.S.M.; Lu, W.; Yuen, M.-Y.; Che, C.-M. Spectacular Luminescent Behaviour of Tandem Terpyridyl Platinum(II) Acetylide Complexes Attributed to Solvent Effect on Ordering of Excited States, “Ion-Pair” Formation and Molecular Conformations. Chem. Sci. 2011, 2, 221–228. [Google Scholar] [CrossRef]
- Yam, V.W.-W.; Chan, K.H.-Y.; Wong, K.M.-C.; Zhu, N. Luminescent Platinum(II) Terpyridyl Complexes: Effect of Counter Ions on Solvent-Induced Aggregation and Color Changes. Chem. A Eur. J. 2005, 11, 4535–4543. [Google Scholar] [CrossRef]
- Bailey, J.A.; Hill, M.G.; Marsh, R.E.; Miskowski, V.M.; Schaefer, W.P.; Gray, H.B. Electronic Spectroscopy of Chloro(Terpyridine)Platinum(II). Inorg. Chem. 1995, 34, 4591–4599. [Google Scholar] [CrossRef]
- Kato, M.; Kishi, S.; Wakamatsu, Y.; Sugi, Y.; Osamura, Y.; Koshiyama, T.; Hasegawa, M. Outstanding Vapochromism and PH-Dependent Coloration of Dicyano(4,4′-Dicarboxy-2,2′-Bipyridine)Platinum(II) with a Three-Dimensional Network Structure. Chem. Lett. 2005, 34, 1368–1369. [Google Scholar] [CrossRef]
- National Library of Medicine. Available online: https://pubchem.ncbi.nlm.nih.gov (accessed on 29 May 2023).
- Karimi Abdolmaleki, M. Synthesis, Characterization, Thermodynamic, and Kinetic Studies of Vapochromic Pt(II) Complexes; University of Cincinnati: Cincinnati, OH, USA, 2018. [Google Scholar]
- Taylor, S.D.; Norton, A.E.; Hart, R.T.; Abdolmaleki, M.K.; Krause, J.A.; Connick, W.B. Between Red and Yellow: Evidence of Intermediates in a Vapochromic Pt(II) Salt. Chem. Commun. 2013, 49, 9161–9163. [Google Scholar] [CrossRef]


| Method | Mean Width (nm) (n = 10) | Mean Length (nm) (n = 10) | Mean Aspect Ratio (n = 10) |
|---|---|---|---|
| 1 a | 170.0 | 3960.0 | 26.1 |
| 2 b | 22.0 | 101.3 | 4.5 |
| 3 c | 89.0 | 2519.0 | 26.4 |
| Cycles | Whole Absorption Time (h) | Absorption Response (min.) | Whole Desorption Time (min.) | Desorption Response (min.) | ||||
|---|---|---|---|---|---|---|---|---|
| Crystal | Nanocrystal | Crystal (I700/I600) | Nanocrystal (I720/I585) | Crystal | Nanocrystal | Crystal (I600/I700) | Nanocrystal (I585/I720) | |
| 1 | 48 | 11.5 | 11 h | 100 | 70 | 36 | 45 | 20 |
| 2 | 18 | 7.5 | 9 h | 10 | 40 | 36 | 25 | 24 |
| 3 | 2 | 9.3 | 75 | 10 | 44 | 34 | 28 | 24 |
| 4 | 2 | 6.0 | 75 | 10 | 40 | 36 | 24 | 24 |
| 5 | 2 | 6.0 | 75 | 10 | 38 | 60 | 26 | 26 |
Disclaimer/Publisher’s Note: The statements, opinions and data contained in all publications are solely those of the individual author(s) and contributor(s) and not of MDPI and/or the editor(s). MDPI and/or the editor(s) disclaim responsibility for any injury to people or property resulting from any ideas, methods, instructions or products referred to in the content. |
© 2024 by the authors. Licensee MDPI, Basel, Switzerland. This article is an open access article distributed under the terms and conditions of the Creative Commons Attribution (CC BY) license (https://creativecommons.org/licenses/by/4.0/).
Share and Cite
Barzegar, S.; Karimi Abdolmaleki, M.; Connick, W.B.; Absalan, G. Enhancing Vapochromic Properties of Platinum(II) Terpyridine Chloride Hexaflouro Phosphate in Terms of Sensitivity through Nanocrystalization for Fluorometric Detection of Acetonitrile Vapors. Crystals 2024, 14, 347. https://doi.org/10.3390/cryst14040347
Barzegar S, Karimi Abdolmaleki M, Connick WB, Absalan G. Enhancing Vapochromic Properties of Platinum(II) Terpyridine Chloride Hexaflouro Phosphate in Terms of Sensitivity through Nanocrystalization for Fluorometric Detection of Acetonitrile Vapors. Crystals. 2024; 14(4):347. https://doi.org/10.3390/cryst14040347
Chicago/Turabian StyleBarzegar, Sedigheh, Mahmood Karimi Abdolmaleki, William B. Connick, and Ghodratollah Absalan. 2024. "Enhancing Vapochromic Properties of Platinum(II) Terpyridine Chloride Hexaflouro Phosphate in Terms of Sensitivity through Nanocrystalization for Fluorometric Detection of Acetonitrile Vapors" Crystals 14, no. 4: 347. https://doi.org/10.3390/cryst14040347
APA StyleBarzegar, S., Karimi Abdolmaleki, M., Connick, W. B., & Absalan, G. (2024). Enhancing Vapochromic Properties of Platinum(II) Terpyridine Chloride Hexaflouro Phosphate in Terms of Sensitivity through Nanocrystalization for Fluorometric Detection of Acetonitrile Vapors. Crystals, 14(4), 347. https://doi.org/10.3390/cryst14040347