Abstract
This article investigates the environmentally friendly synthesis and characterization of carbon dots (CDs) derived from soybean biomass, in conjunction with their composites containing potassium chloride (KCl) or zeolite. By using an environmentally sustainable synthetic approach, this study sought to unlock the potential of these materials for various applications. The physicochemical properties of the CDs and composites were comprehensively analyzed using various techniques including scanning electron microscopy, transmission electron microscopy, X-ray photoelectron spectroscopy, and X-ray diffraction analysis. In addition, various optical properties such as UV–Vis absorption, band gap, and excitation–emission behavior were investigated. A key finding to arise from this study was that the inclusion of a doping agent such as KCl or zeolite significantly reduced the size of the resulting CDs. In this light, whereas the undoped species are associated with average sizes of 8.86 ± 0.10 nm, those doped with either zeolite or KCl were associated with average sizes of 3.09 ± 0.05 and 2.07 ± 0.05 nm, respectively. In addition, it was shown that doping with either zeolite or KCl resulted in an alteration of the elemental composition of the CDs and influenced their optical properties, especially their excitation-dependent emission. These promising results point to potential applications in environmental sensing and energy-related fields.
1. Introduction
Carbon-based nanomaterials, such as carbon dots, have attracted the attention of scientists and researchers due to their unique properties and characteristics. These materials are both affordable and relatively easy to synthesize. In addition, they possess desirable optical properties, have excellent physical and chemical properties, are environmentally friendly, and have surface functional groups (e.g., carboxylic acid residues) that allow easy functionalization with various additives [1,2,3]. Carbon dots (CDs) derived from natural materials offer several advantages, including environmental sustainability and biocompatibility. In this regard, a plethora of readily available and environmentally friendly biomass sources, including plant leaves, crops, fruit peels, and vegetables, are all viable precursors from which CDs may be produced. Glycine max (L.) Merr., commonly known as soybean, is a legume native to East Asia. It is rich in important nutrients, including carbohydrates (33%), fats (20%), and proteins (40%) [4], with an approximate 6% nitrogen content [5]. This nitrogen content renders soybean an excellent source of N in carbon dots through a process known as self-doping. Utilizing soybeans for self-doping proves to be environmentally friendly compared to methods employing nitrogen doping with ammonia or urea as nitrogen precursors. Nitrogen plays a crucial role in the formation of carbon dots, enhancing their photoluminescence and efficacy in various applications including bioimaging, sensors, and optoelectronics [6]. Furthermore, nitrogen doping contributes to the stability of carbon dots across diverse environmental conditions, encompassing variations in temperature, pH, and exposure to light. This characteristic expands the potential applications of carbon dots, particularly in fields like biological imaging and catalysis [7]. Moreover, the presence of nitrogen heteroatoms within the carbon matrix facilitates charge transfer processes, proving advantageous in applications such as photocatalysis, solar cells, and electrochemical sensors [8]. Lastly, N-doping improves the conductivity of carbon dots, thereby enhancing electron transfer kinetics [9]. This unique composition makes soybeans an excellent choice as a non-toxic, low-cost, widely available, and renewable carbon source for the synthesis of carbon dots.
Compared with conventional organic dyes, which are frequently prone to photobleaching, the comparatively greater photostability of CDs means that they are useful alternatives to typical organic dyes for various applications involving photochemistry [10]. These applications include fluorescent sensors for substances such as glutathione [11,12], Fe(III) [13], Hg(II) [14], Cu(II) [15], Cr(VI) [16,17], methylene blue [18], and 4-nitrophenol [17]. Carbon dots have also been shown to have applications in the realm of both photocatalysis and bioimaging [19,20,21,22], and even in anti-counterfeit printing [23]. In addition, the tunable excitation and emission behavior of carbon dots provides different colors or even white light, which is of great importance for energy applications [24,25].
Studies have shown that manipulating the surface of carbon dots by functionalization and core doping changes their properties [26]. For example, doped carbon dots have been shown to exhibit zero-dimensional carbon with a diameter of less than 10 nm and desirable fluorescent properties [27]. Doping carbon dots with metal ions alters the charge density and charge transitions between the metal ion and the graphene matrix, a crucial factor in tuning their properties [28]. The doping of graphene quantum dots with potassium, for example, introduces new orbitals (energy levels) into the matrix and changes the nature of the electronic transitions [29]. This interaction with the matrix increases the number of dangling bonds, as well as the surface area, which is crucial for fine-tuning the optical properties of quantum dots for various applications. Potassium chloride has been used as a dopant in lignin carbon dots to increase their peroxidase activity, resulting in improved sensitivity and stability in the detection of glutathione in human serum. It is hypothesized that an oxidation reaction occurs during synthesis, in the presence of KCl, that alters the surface state such that the oxygen-containing functional groups are converted to C=O and COOH groups [12].
Zeolites, ordered nanoporous materials with well-confined spaces and high thermal and chemical stability, serve as excellent hosts for the incorporation of functional guests such as carbon dots. When carbon dots are embedded in the zeolite host matrix in the solid state, specific optical properties occur, including multicenter photoluminescence, long lifetime, and phosphorescence [30,31,32,33]. In addition, owing to the fact that zeolites have inherently large surface areas, ranging from 50 to 1000 m2, they are particularly amenable to processes where a large surface area is desirable, e.g., in the context of both sensing and catalysis [34].
Carbon dots can be synthesized through a variety of methods. One of these is pyrolysis, a thermal synthesis technique that enables the dehydration, decomposition, and carbonization of organic materials under inert conditions. This method leads to significant changes in the physical and chemical properties of the organic substrates, which ultimately results in the formation of solid carbonaceous products. Parameters such as pressure, duration of pyrolysis, and temperature are carefully controlled throughout the process to achieve the desired results [35]. A notable advantage of pyrolysis for the synthesis of carbon dots is its versatility in producing uniform and well-defined carbon structures with tailored properties, such as size, morphology, and surface chemistry. In addition, this method offers high scalability and reproducibility, making it suitable for large-scale production. Furthermore, as pyrolysis does not use solvents, the environmental impact is minimized, as less solvent waste is generated and the associated disposal issues are avoided, which is in line with green chemistry principles and promotes sustainability. However, conventional pyrolysis typically requires high temperatures above 300 °C, consuming a significant amount of energy to heat the sample and maintain the necessary high temperatures for the process. However, even at these high temperatures, the complete conversion of the feedstock into valuable products may not be achieved, resulting in lower yields and higher costs. Additionally, there is a substantial evaporation of volatile products, which can be harmful to the environment [36]. Autogenic atmosphere pyrolysis (AAP) is a new pyrolysis technique that addresses some of these issues by creating an autogenic atmosphere within the reactor. This is achieved by heating the feedstock in a closed system, allowing the gases released during pyrolysis to accumulate and create a pressure that drives the reaction. Researchers have utilized this approach to synthesize carbon dots [36,37,38,39], such as the use of o-phenylenediamine as a carbon source in the presence of KCl to produce highly emissive photoluminescent carbon dots. The KCl acts as a catalyst for deamination and dehydrogenation processes during the carbonization process [36]. Similarly, da Cruz and colleagues utilized the AAP method to synthesize N-doped carbon nanoparticles with sizes ranging from 5 to 50 nm. They used depolymerized carbon-rich lignin as the carbon source and phenylenediamine as the nitrogen dopant [39]. Overall, the AAP method has proven to be a promising approach for the synthesis of carbon dots due to its efficiency, versatility, and environmental friendliness.
In the present study, we employ an eco-friendly autogenic atmosphere pyrolysis for CD synthesis from soybeans as a nitrogen rich carbon source, which were either undoped or doped with either KCl or zeolite in order to manipulate its optical properties by tuning the size, excitation–emission property, and band gap. These properties are critical for numerous applications, including pollutants sensing and degradation and energy-related applications such as light emission diodes. Our results revealed that doping reduced the size of the carbon dots, with the undoped carbon dots measuring (on average) 8.86 ± 0.097 nm, while those doped with zeolite had average sizes of 3.09 ± 0.05 nm and those doped with KCl had average sizes of 2.07 ± 0.05 nm. Furthermore, the results showed a dual fluorescence band at shorter and longer wavelengths as well as excitation-dependent emission and band gaps of 3.31 eV, 3.45 eV, and 3.56 eV for CD@zeolite, CD, and CD@KCl, respectively. With the given results, our materials show promise to find application in various areas not limited to biosensing, environmental, and energy related applications.
2. Materials and Methods
2.1. Materials
All the chemicals and materials used in this study were acquired from commercial sources and used as received, unless otherwise stated. Soybeans were used as the source carbon precursor and these were obtained from local markets in Kazakhstan.
2.2. Synthesis of Carbon Dots and Their Composites
The raw material for the carbon source (i.e., soybeans) was obtained from the local market in Kazakhstan. After their procurement, the soybeans were treated as follows: (i) they were initially washed with distilled water, (ii) they were subsequently dried in an oven at 70 °C, and (iii) they were then crushed in a blender. Once this treatment had occurred, they were then stored awaiting their use as a carbon source for CD synthesis.
The synthesis of carbon dots and their composites (denoted as CD@Zeolite and CD@KCl) followed a methodology described in previous studies [40,41], with some modifications. We will use the synthesis of CD@Zeolite as a prototypical example of the synthetic methodology employed in this study. First, 0.5 g of dried soybeans and 0.5 g of zeolite 13X (Merck) were mixed and ground using a mortar and pestle. The resulting solid mixture was then transferred to a 50 mL Teflon-lined stainless steel autoclave reactor, which was then placed in an oven. The reaction was carried out at 180 °C for 8 h. After completion of the reaction, the autoclave reactor was cooled and the product was transferred to a tube, followed by the addition of 30 mL of deionized water. This mixture was sonicated for 30 min and centrifuged for a further 30 min to separate the larger particles from the smaller ones. The supernatant and the residue were collected separately. The supernatant was further filtered using a 0.22 μm syringe filter to remove larger and agglomerated particles. The resulting filtrate was then dried at 70 °C under vacuum conditions to obtain CD@Zeolite. The residue was dried at 70 °C and stored for later use.
In the case of the KCl-doped CDs (i.e., CD@KCl) and the undoped CDs, an identical procedure to that described above was employed, but with KCl replacing zeolite in the case of the KCl-doped material, and no dopant being added in the case of the synthesis of undoped CDs.
2.3. Characterization
Different methods of analysis were used in this study. Size and morphological analysis were performed using a Zeiss Crossbeam 540 scanning electron microscope (SEM) and a transmission electron microscope (TEM) (JEOL JEM-1400 Plus). The material elemental composition and chemical bonding were determined using NEXSA Thermoscientific X-ray photoelectron spectroscopy (XPS). X-ray diffraction (XRD) patterns to determine crystallinity were obtained using the Rigaku SmartLab system. Absorption spectra were recorded using the UV-2600i (Shimadzu Corporation, Kyoto, Japan), while fluorescence experiments were performed using a Cary Eclipse fluorescence spectrophotometer (Agilent Technologies, Santa Clara, CA, USA).
3. Results and Discussion
3.1. Structural Analysis
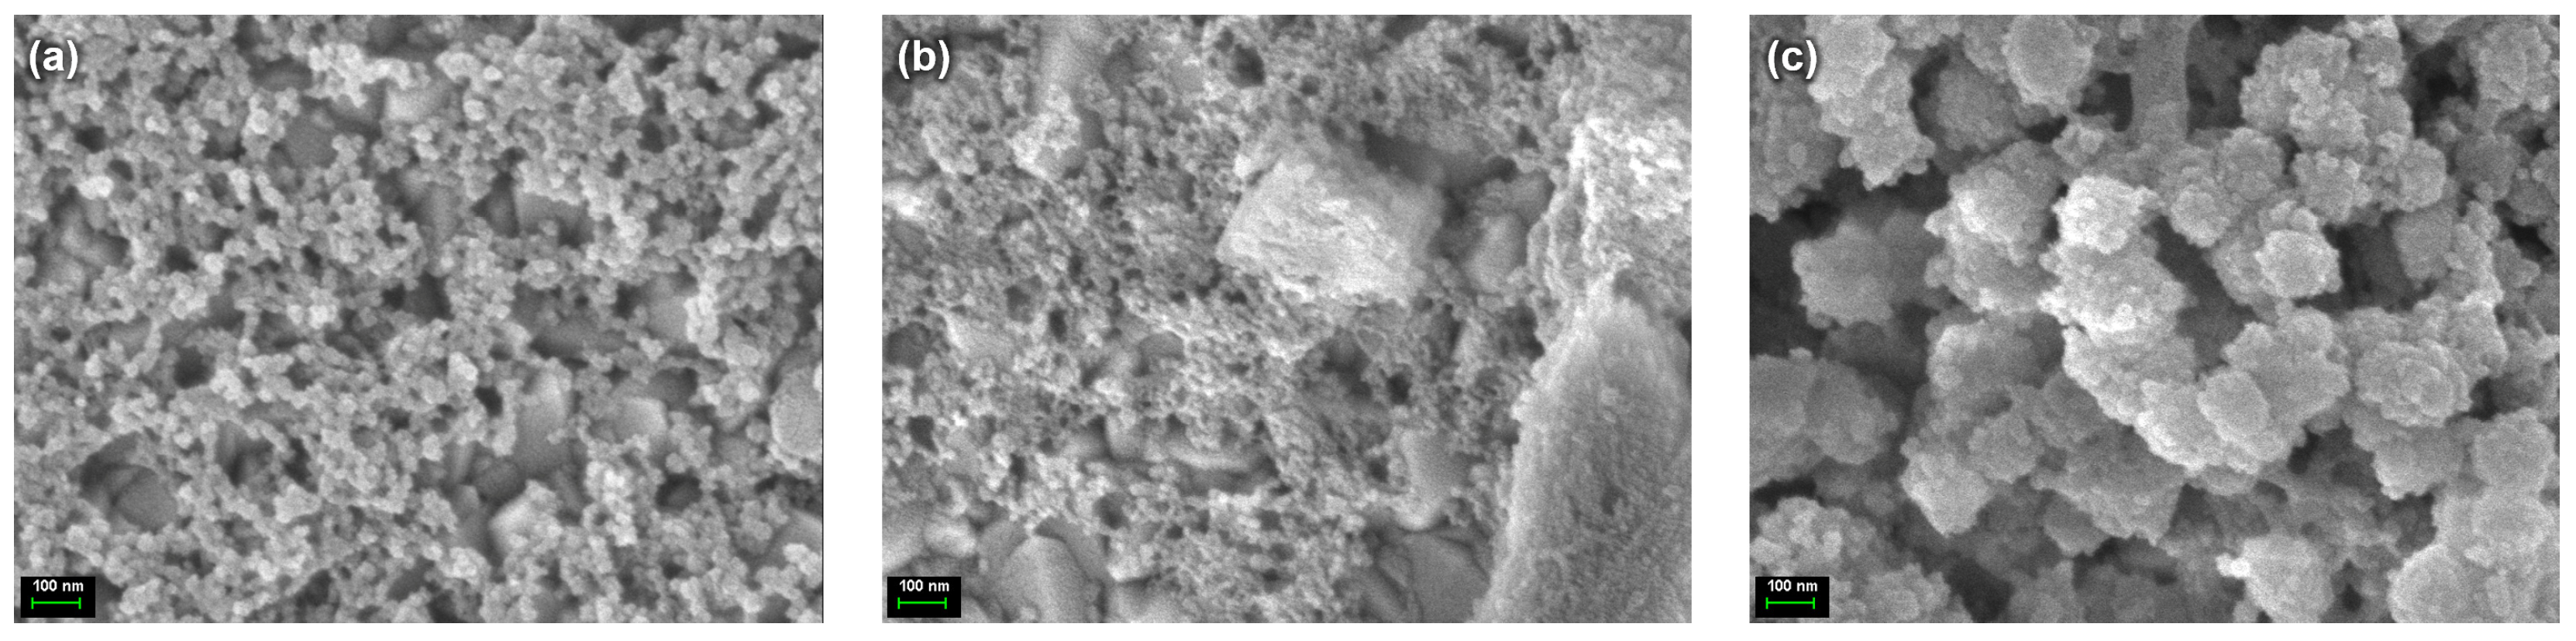
Figure 1 provides visual insights into the morphological properties of three different compositions, as follows: undoped carbon dots, CD@KCl (carbon dots encapsulating potassium chloride), and CD@Zeolite (carbon dots immobilized in a zeolite matrix), all deposited on fluorine-doped tin oxide (FTO) substrates. Remarkably, these images show the formation of small spherical structures in all samples, suggesting a uniform packing arrangement. Furthermore, an important observation is made when examining the CD@Zeolite sample. Here, the spherical structures of the carbon dots appear to sit on a cubic framework. This phenomenon indicates the integration of the carbon dot molecules into the zeolite matrix, resulting in a unique hierarchical architecture. The cube-shaped structures most likely represent the crystalline lattice of the zeolite and serve as a scaffold for the carbon dot molecules. This hierarchical arrangement not only improves structural integrity, but also provides opportunities for synergies between the inherent functionalities and properties of both the carbon dot and zeolite moieties.

Figure 1.
SEM images of (a) CD, (b) CD@KCl, and (c) CD@Zeolite.
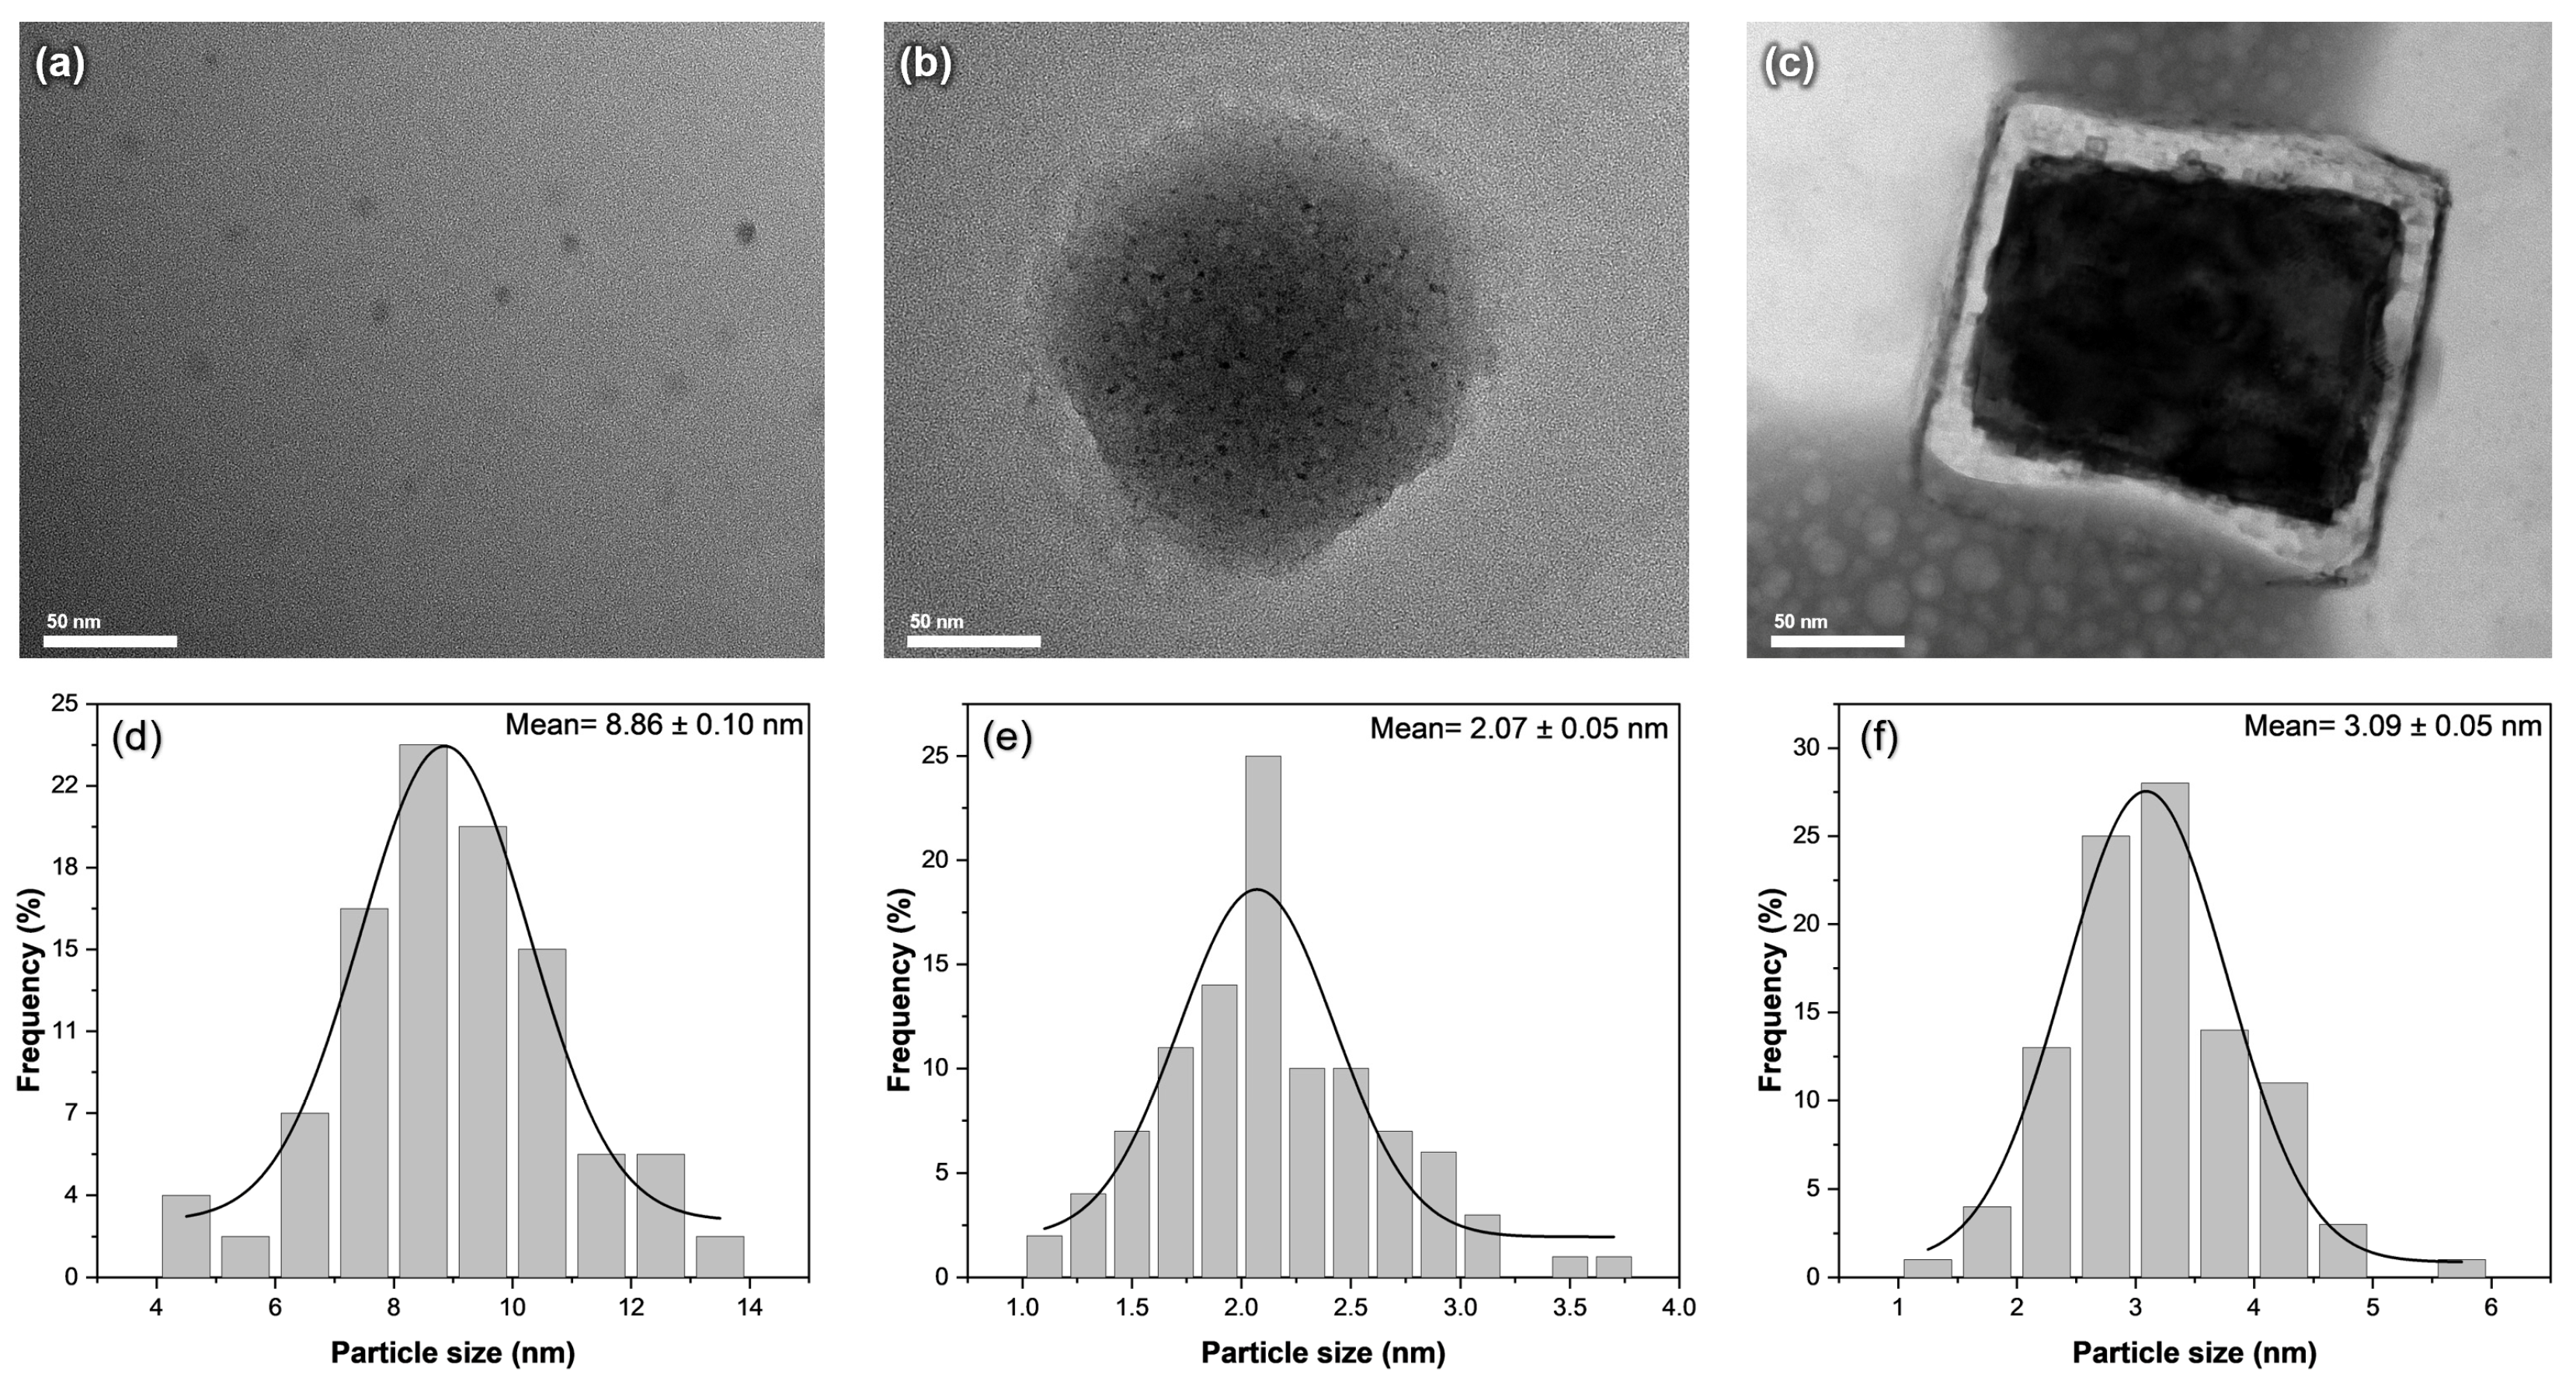
To accurately determine the size of the nanoparticles formed, we carried out an examination of the carbon dots and their composites using transmission electron microscopy, as shown in Figure 2. As shown in Figure 2a, the undoped carbon dots have a spherical shape, with an average size of 8.86 ± 0.10 nm. After the introduction of KCl, the carbon dots were observed within the larger spheres of the KCl crystals, providing some control over the size of the carbon dots formed (Figure 2b). The average particle size of CD@KCl was determined to be 2.07 ± 0.05 nm, which corresponds to a 77% reduction in particle size compared to the undoped carbon dots. The presence of KCl could potentially accelerate nucleation and promote the growth of smaller carbon dots, due to improved reduction kinetics or specific interactions with the carbon precursor, which is consistent with the results of previous studies [12]. In the case of CD@Zeolite, the carbon dots are located on the surface of the zeolite matrix (Figure 2c). Zeolites, which are characterized by their high porosity with well-defined channels and cages in the nanometer range, trap the carbon dots in these channels during the synthesis process. This template effect and confinement within the zeolite structure likely contribute to the reduction in the size of the carbon dots. Indeed, Figure 2c shows that the average size of the zeolite-doped carbon dots is 3.09 ± 0.05 nm.

Figure 2.
TEM images and size distribution of (a,d) CD; (b,e) CD@KCl; and (c,f) CD@Zeolite.
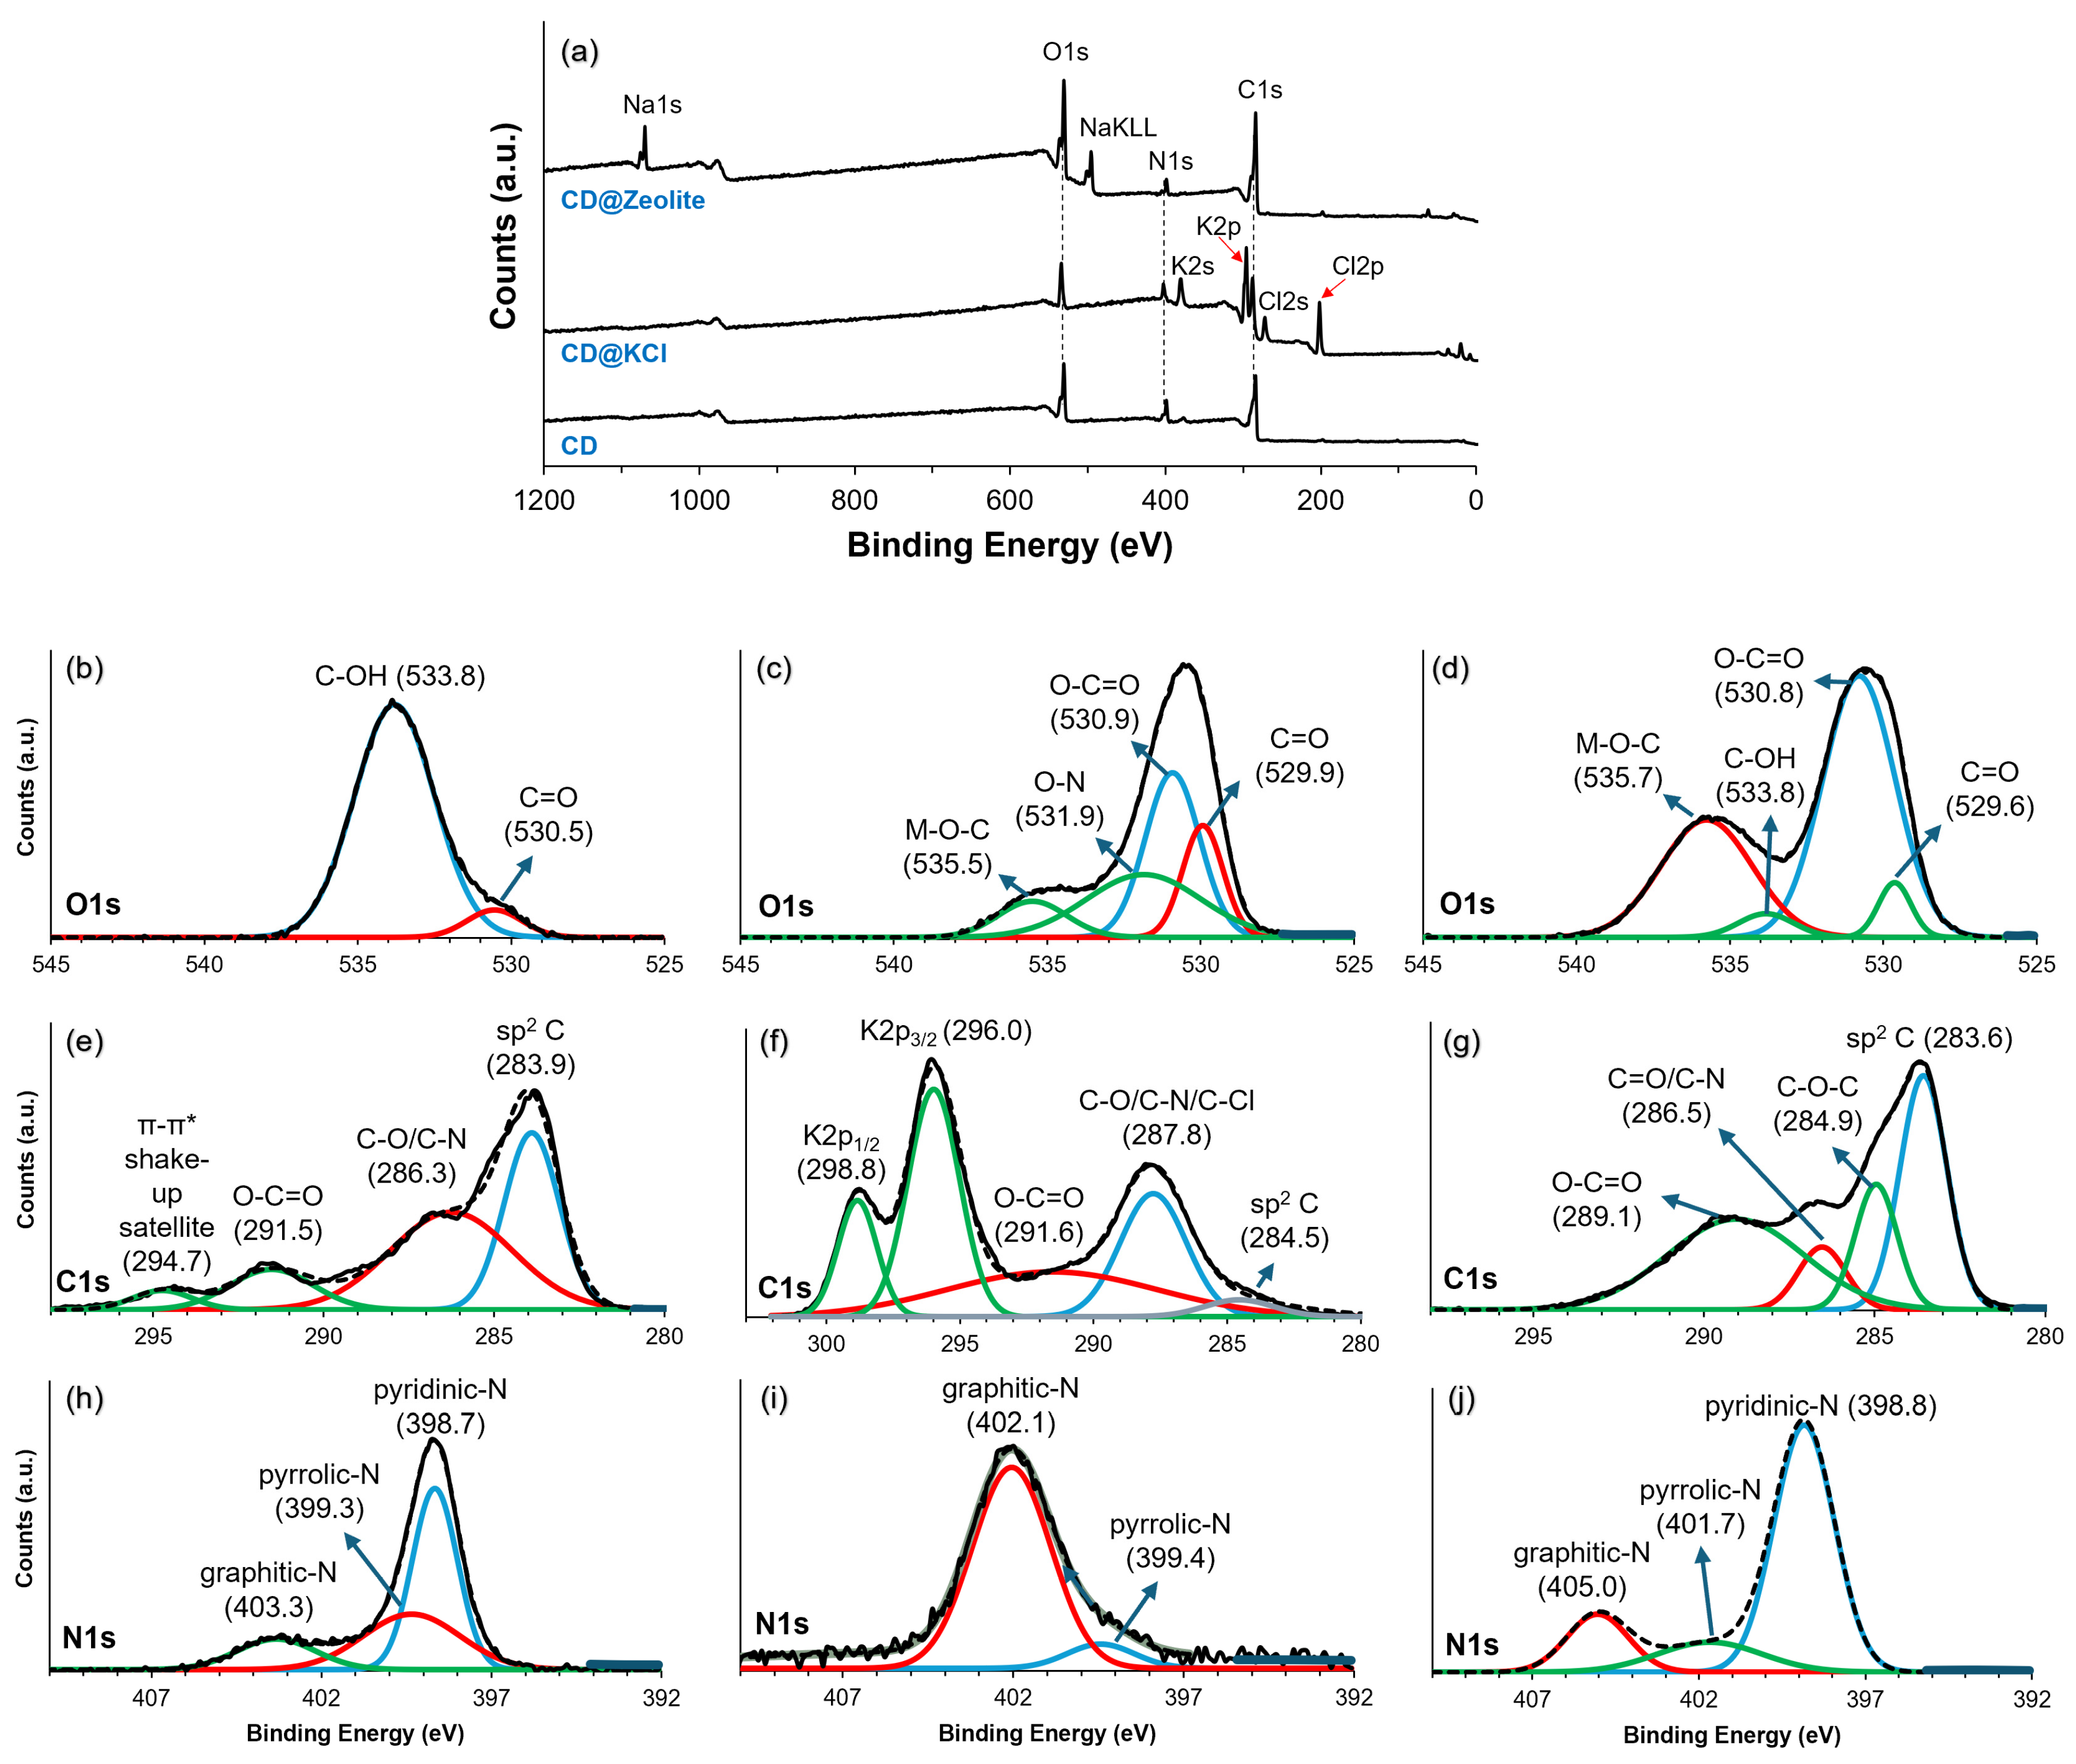
X-ray photoelectron spectroscopy (XPS) was used to analyze the elemental composition and chemical bonding of the synthesized samples. Figure 3a illustrates the investigation spectrum of the carbon dots (CDs) and their composites. Characteristic peaks of C1s, N1s, and O1s can be seen in the pure carbon dot. After doping with KCl, the peaks of K2s, K2p, Cl2s, and Cl2p appear. In CD@Zeolite, the prominent peak comes from Na1s and NaKLL, which is due to the zeolite, aside from the C1s and N1s, which originate from the CD. The O1s peak can be attributed to oxygen atoms on both the zeolite as well as the CD. The high-resolution spectra of C1s, N1s, and O1s for CD, CD@KCl, and CD@Zeolite were further analyzed to clarify the effects of doping on the CD structure (Figure 3b–j). Figure 3b–d show characteristic C1s spectra. In Figure 3b, a peak at 530.5 eV corresponds to that arising from the presence of C=O groups, while a significant peak at 533.8 eV is assigned to C-OH. However, when KCl is added, the C-OH peak disappears and is replaced by peaks at 530.9 and 531.9 eV, indicating the presence of a carboxyl group as well as an O-N bond. This confirms that KCl promotes the oxidation of hydroxyl groups to carboxyl groups [12]. A peak at 535.5 eV is also observed, which is assigned to a metal–oxygen bond. Similarly, the inclusion of zeolite (as in CD@zeolite) also results in some degree of oxidation of the hydroxyl groups, although the C-OH peak remains detectable, indicating that only partial oxidation seems to occur in this particular system. Doping, especially with KCl, leads to clear differences in the C1s spectra (Figure 3e–g). Figure 3e shows numerous graphite-like carbons in pure carbon dots at 283.9 eV, which are reduced by the addition of KCl (Figure 3f), probably due to the increased formation of carboxyl groups. It is also worth noting that the C1s spectra for the CD@KCl also shows the K2p3/2 and K2p1/2 at 296.0 and 298.8 eV, which confirms that the carbon dots are incorporated into the KCl matrix, as shown in the TEM analysis. For the zeolite-doped carbon dots (Figure 3g), the peak area ratio of graphitic carbon to carboxyl groups is 1.1, compared to 0.3 for pure CD, indicating a significant conversion to carboxyl groups.

Figure 3.
(a) XPS survey scan and high resolution XPS spectra of O1s, C1s, and N1s of (b,e,h) CD; (c,f,i) CD@KCl; and (d,g,j) CD@Zeolite.
Analysis of the peak areas of the N1s spectra in three scenarios with carbon dots shows remarkable differences (Figure 3h–j). The origin of nitrogen can come from the storage proteins, which are characterized by the two following main components: glycinin and β-conglycinin, which account for over 65% of the total soy protein content [42]. In addition, lectins, a type of carbohydrate-binding protein, contribute about 10% of the total soy protein and serve as an additional source of nitrogen [43]. During the formation of carbon dots, nitrogen from these proteins undergoes degradation, resulting in the creation of nitrogen-containing functional groups through deamination and condensation reactions [44]. In pristine carbon dots, pyridinic-N dominates (51%), followed by pyrrolic-N (34%) and graphite-N (15%) (Figure 3h). After the incorporation of zeolite, the pyridinic-N fraction increases significantly (69%), while the pyrrolic-N fraction decreases significantly (16%) and the graphitic-N fraction decreases slightly (14%) (Figure 3i). Conversely, the introduction of KCl leads to a widespread change in nitrogen functionalities, with pyrrolic-N decreasing to 7% and graphitic-N dominating (93%) (Figure 3j). These differences can be explained by considering the interactions between the carbon dots and the additives. The incorporation of zeolite probably facilitates the interaction with nitrogen, especially with pyridine-N, due to its porous structure and large surface area, which promotes nitrogen enrichment. Conversely, the addition of KCl may lead to surface restructuring and expose graphite-N sites due to electrostatic interactions between potassium ions and carbon dot surfaces. This analysis emphasizes the importance of external factors in modulating the surface chemistry of carbon dots, thus influencing their potential applications in various fields.
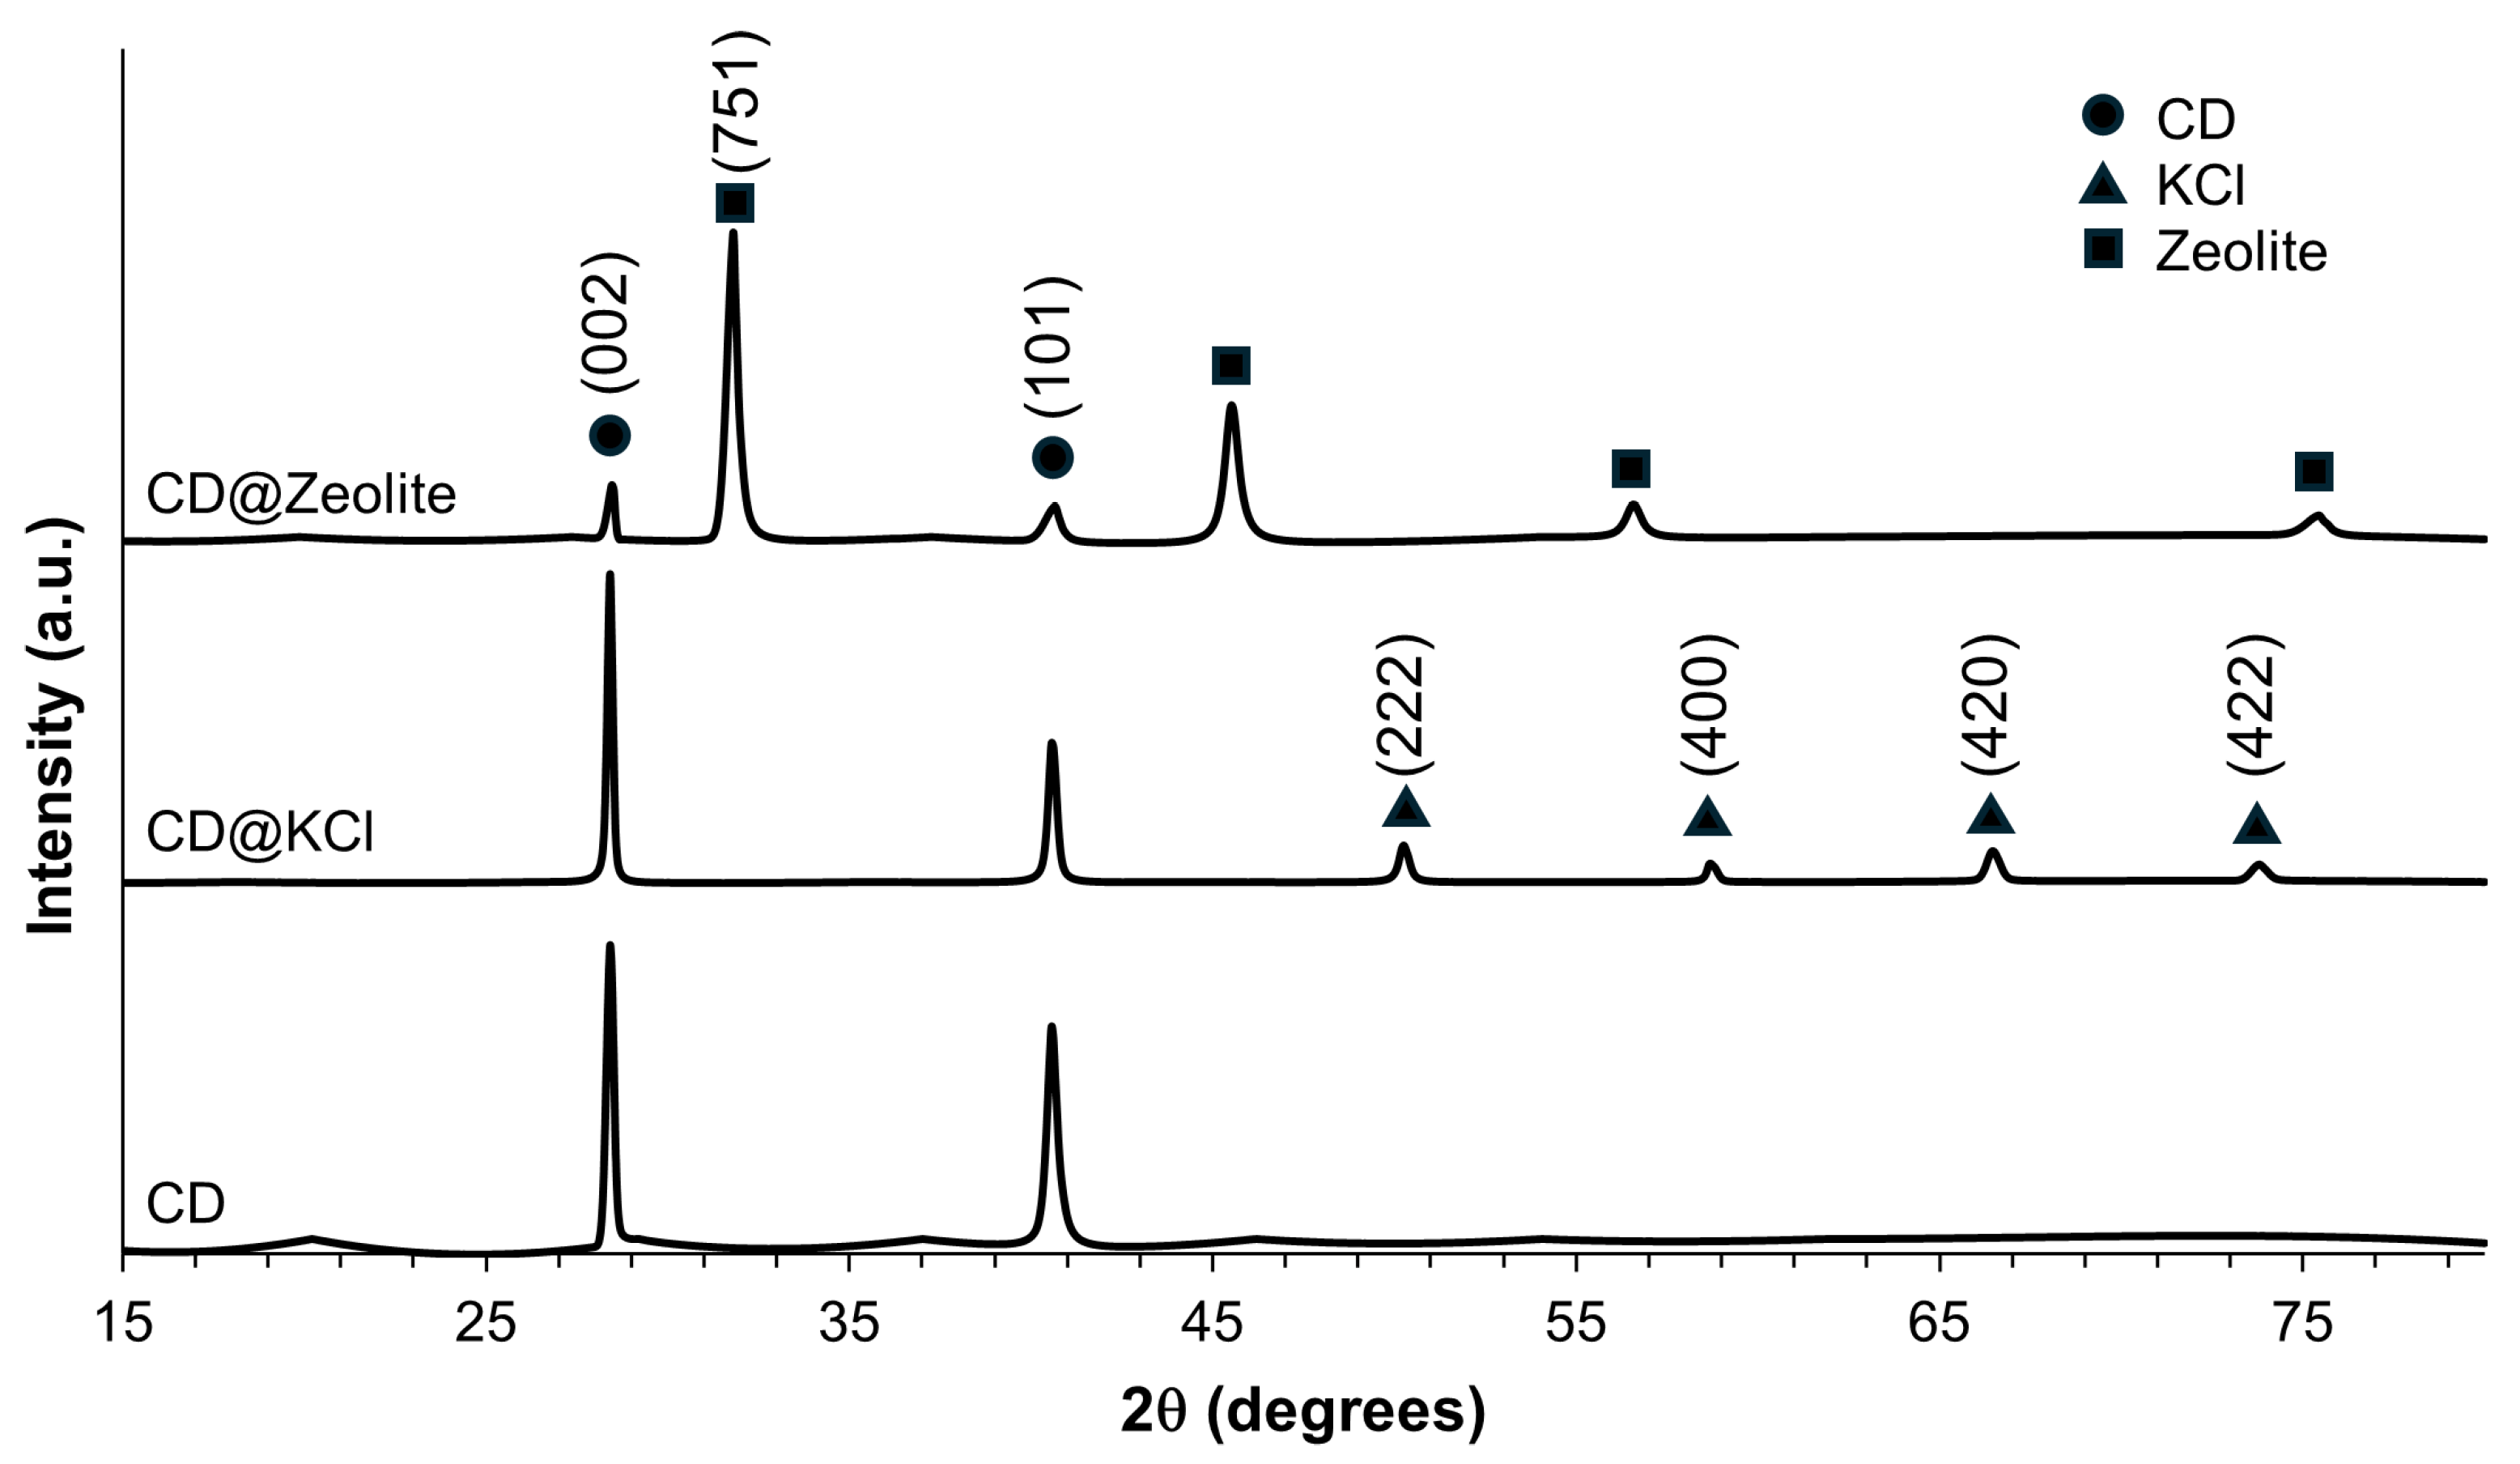
Powder X-ray diffraction analysis was performed to investigate the phase structure of the carbon dots investigated in this study. As shown in Figure 4, the XRD pattern of the CD shows a prominent diffraction peak at about 2θ = 28.4°, which corresponds to the (002) reflectance of graphite. This indicates a partially graphitized structure of the CD [45]. Another recognizable peak at 2θ = 40.6° can be attributed to (100) diffraction, which indicates the in-plane diffraction of the hexagonal lattice of carbon atoms [46]. The full width at half maximum (FWHM) of these peaks is 0.24° and 0.37° for the (002) and (100) planes, respectively, suggesting their crystalline nature. The XRD diffraction patterns of the synthesized CD@KCl show peaks at 2θ values of 28.4°, 40.6°, 50.3°, 58.7°, 66.5°, and 73.8°, which are assigned to the crystalline planes (200), (220), (222), (400), (420), and (422) of the KCl structure, as shown in Figure 4. All these diffraction peaks correspond to a cubic structure and are consistent with the standard peaks (JCPDS no. 41-1476) [47]. In particular, the peaks at 28.4° and 40.6° overlap with those of CD, which correspond to indices (002) and (101). In CD@Zeolite, the diffraction peaks at 28.4° and 40.6° are attributed to the (002) and (101) Miller indices of the CD, while the peaks at 31.8°, 45.5°, 56.6°, and 75.6° are attributed to the zeolite. According to the literature, we can assign the peak at 31.8° with certainty to the (751) crystal plane, as the fingerprint range of zeolite 13X is below 40° [48]. An integration method was used to evaluate the percent crystallinity. To evaluate the percent crystallinity, we used the integration method to analyze XRD spectra. In this method, a straight background line is created and then the area under the entire curve is compared with the area under the crystalline peaks. Our results showed that CD@KCl had the lowest crystallinity at 32%, followed by CDs alone at 34%, and the highest crystallinity was observed for CD@zeolite at 36%. The presence of KCl was found to decrease the sp2 lattice within the carbon core matrices, as shown by the XPS results, likely contributing to a lower percentage of crystallinity. In the case of CD@zeolite, despite a reduction in graphitic carbon compared to pure CDs, the incorporation of zeolite may serve as a beneficial template to improve the crystallinity of the carbon dots. Moreover, the porous structure of zeolite could favor the better dispersion and alignment of carbon dots and promote the formation of crystalline domains, as evidenced by our TEM results. However, it is worth noting that all carbon dots are primarily amorphous in nature.
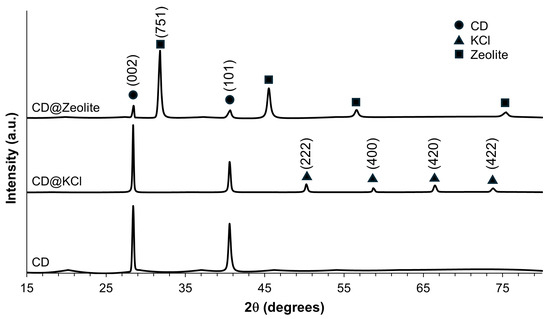
Figure 4.
Powder X-ray diffraction of the CD samples.
3.2. Optical Properties Characterization
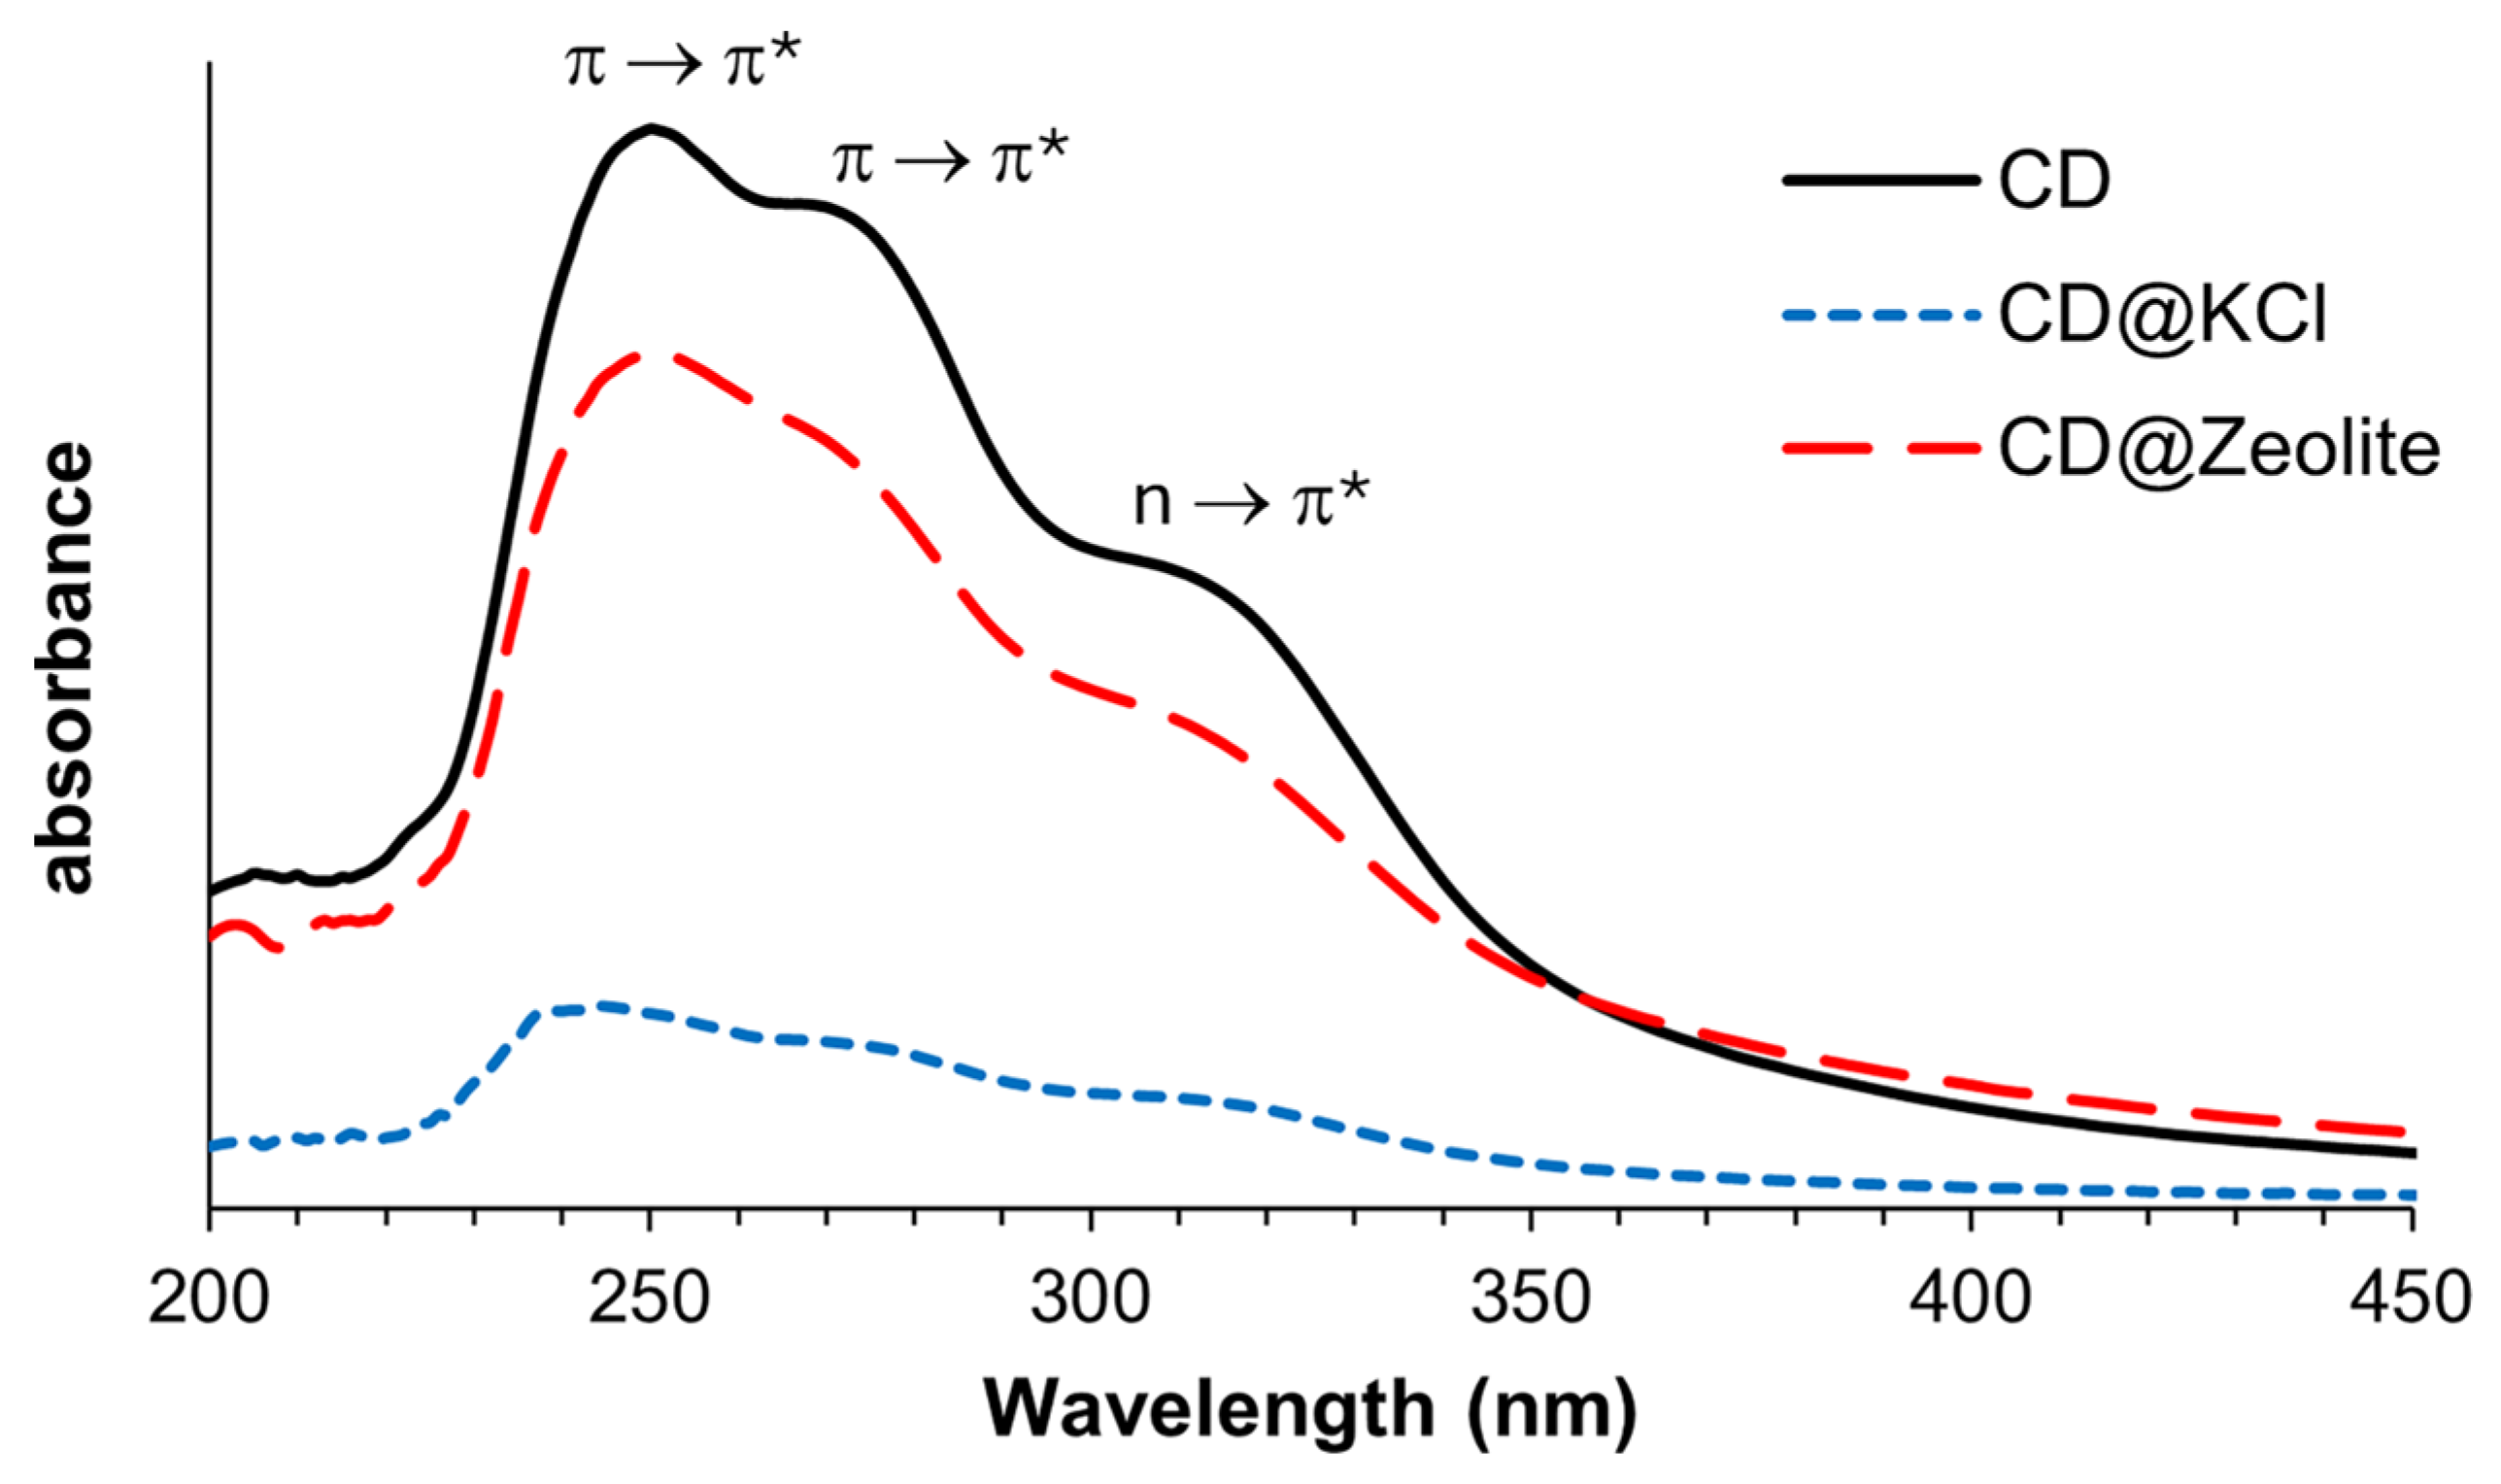
The UV–Vis absorption spectrum of carbon dots and their composites, as shown in Figure 5, was determined at a concentration of 0.20 mg/mL in water. Due to the unclear peaks, especially in the shoulder regions, we used a nonlinear curve fitting method based on the Lorentz model to analyze them. The U–-Vis absorption spectrum of pure CDs shows a prominent maximum absorption band at 245 nm and two shoulder bands at 267 nm and 318 nm. The absorption at 245 nm and 267 nm is attributed to the π-π* transition of the sp2-hybridized carbon structure [19], while the second shoulder peak at 318 nm can be explained by the n-π* transition of the nonbonding orbitals from pyridine N and pyrrolic N. Nitrogen-containing fluorophores on top of the sp2-hybridized carbon may contribute to the absorption properties, band gap, and luminescence of the carbon dots [49]. After doping the carbon dots with KCl and zeolite, these three bands remain, but exhibit a slight blue shift. For CD@KCl, the absorption bands appear at 242 nm, 265 nm, and 317 nm, while for CD@Zeolite they can be observed at 244 nm, 262 nm, and 312 nm. This blue shift is consistent with the smaller particle size of the doped CDs, as shown in the TEM analysis. However, the extinction coefficient of the doped CDs is significantly lower. Since the excitation comes primarily from the π-π* and n-π* transitions originating from the surface states and conjugated π domains of the CDs, the addition of KCl or zeolite changes the local environment of the CDs, as shown using XPS analysis. This change in the environment can lead to a change in the electronic properties of the CDs. A plausible explanation for the decrease in the extinction coefficient of the carbon dot when doping with KCl is that KCl shields the surface charge of the CDs and, thus, reduces the magnitude of the electric field, which leads to a lower absorption intensity. On the other hand, since zeolite has numerous pores and, as a consequence, a large surface area, as evidenced by the TEM analysis showing the incorporation of the CDs into these pores, it could effectively concentrate the CDs in the solution and, thus, reduce the extinction coefficient.

Figure 5.
Absorption spectra of CDs and their composites in water. All samples have a concentration of 0.20 mg/mL.
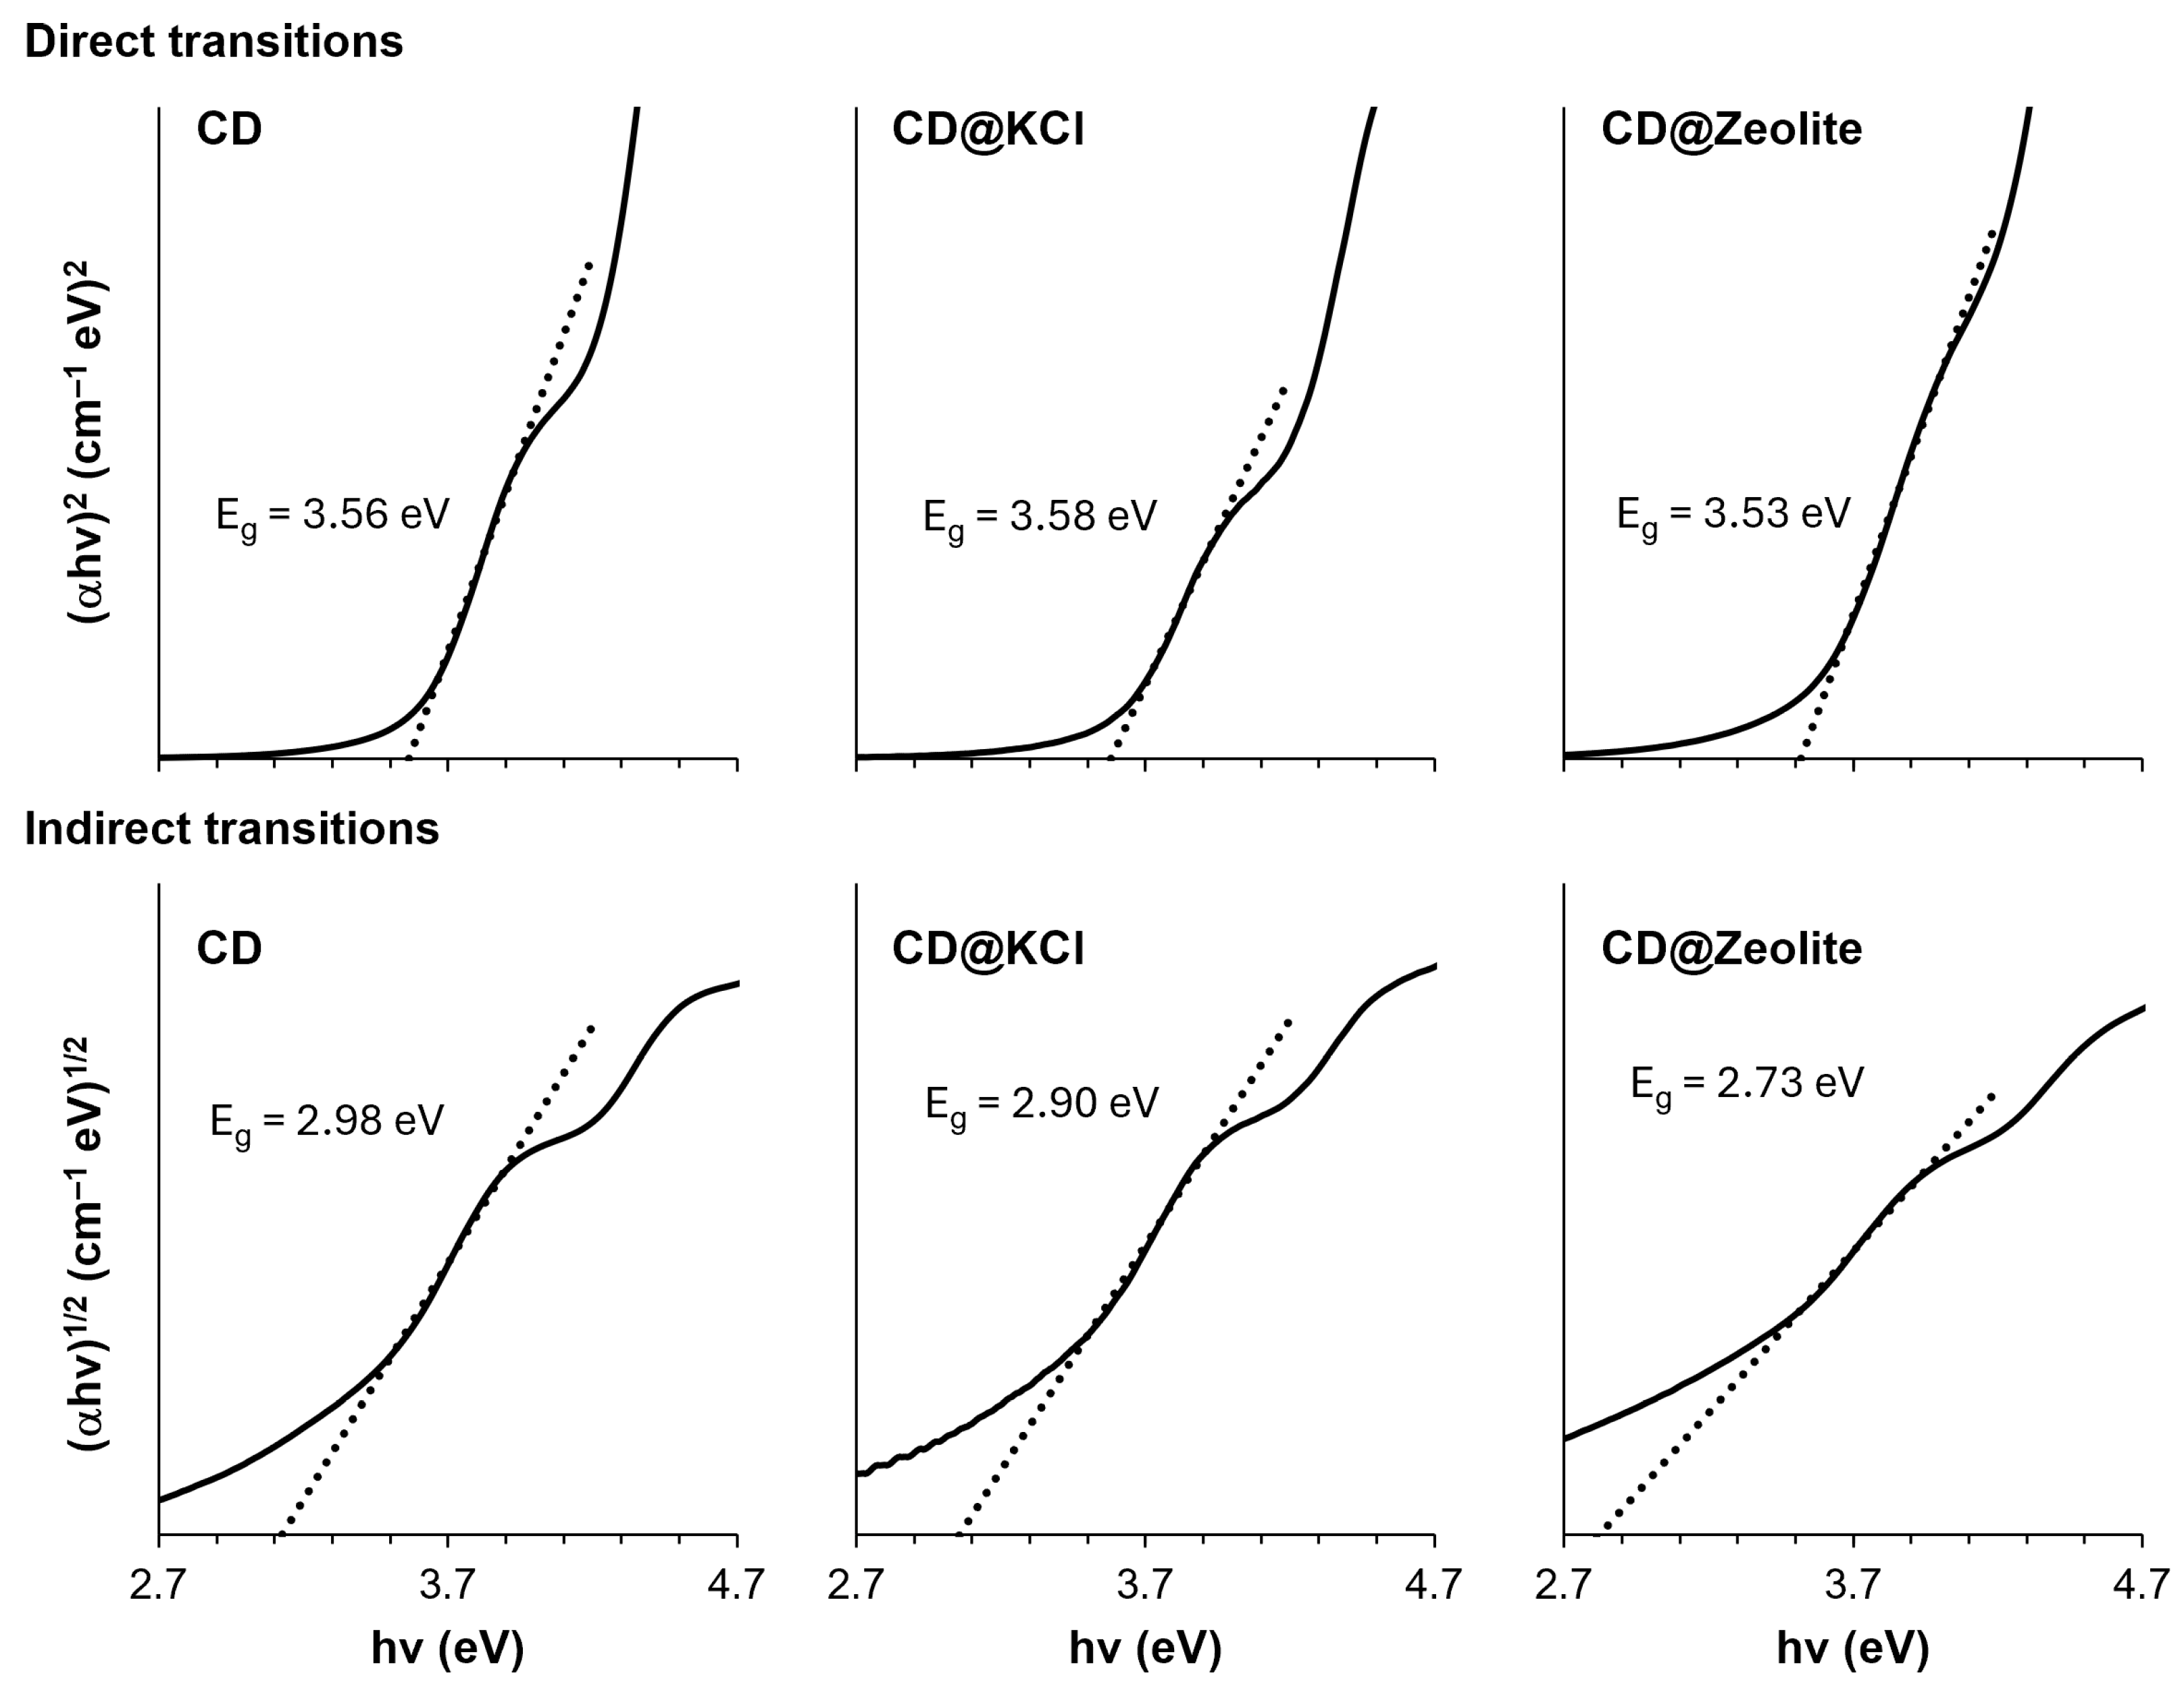
To better understand the differences between the CDs and their composites, we performed an analysis of their respective band gaps using absorption spectral data (Figure 6). To do this, we used a Tauc diagram, a method that provides valuable insights into the optical properties of materials, particularly in determining their direct bandgap energy. This energy value indicates the minimum amount of energy required to lift an electron from the valence band into the conduction band of the material. Understanding the direct band gap is of great importance as it directly affects the photophysical and photochemical behavior of the material, including its absorption and emission properties. The formula for the Tauc diagram is shown in Equation (1):
where α stands for the absorption coefficient from the Beer–Lambert equation (Equation (1)); h stands for Planck’s constant (6.34 × 10⁻³⁴ J s/photon); ν denotes the frequency of the incident photon; B is a constant, which is assumed to be 1; and Eg denotes the band gap energy. If m = 2, this means it undergo direct transitions, while m = ½ indicates indirect transitions. The bandgap is determined using the Kubelka–Munk method, in which a straight line is drawn in the diagram (αhv)m versus (hv) [50]. As can be seen in Figure 6, both the direct and indirect transitions allowed bandgap energies to be calculated for all our CDs. The bandgap energies of the direct transitions are higher than the bandgap energies of the indirect transitions for all three CDs. This is to be expected as direct transitions require less energy than indirect transitions, as there is no momentum transfer between the electron and the lattice. The small differences in the band gap energies of the direct transitions can be attributed to the differences in the chemical environment of the carbon dots. In particular, the band gap of CD@KCl (3.58 eV) is slightly higher than that of CDs (3.56 eV), while the band gap of CD@zeolite (3.53 eV) is slightly lower. These differences can be explained by the different electrostatic environments created by the KCl and zeolite matrices, which can affect the energy levels of the valence and conduction bands of the carbon dots. The band gap energies of the indirect transitions also show a similar trend, with CD@KCl (2.90 eV) having a slightly higher band gap than CDs (2.98 eV), and CD@zeolite (2.73 eV) having a lower band gap.
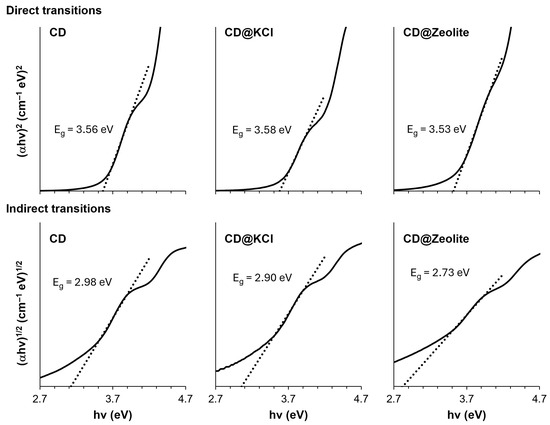
Figure 6.
Tauc plots of the carbon dot and its composites for the direct and indirect transitions’ allowed bandgap energies.
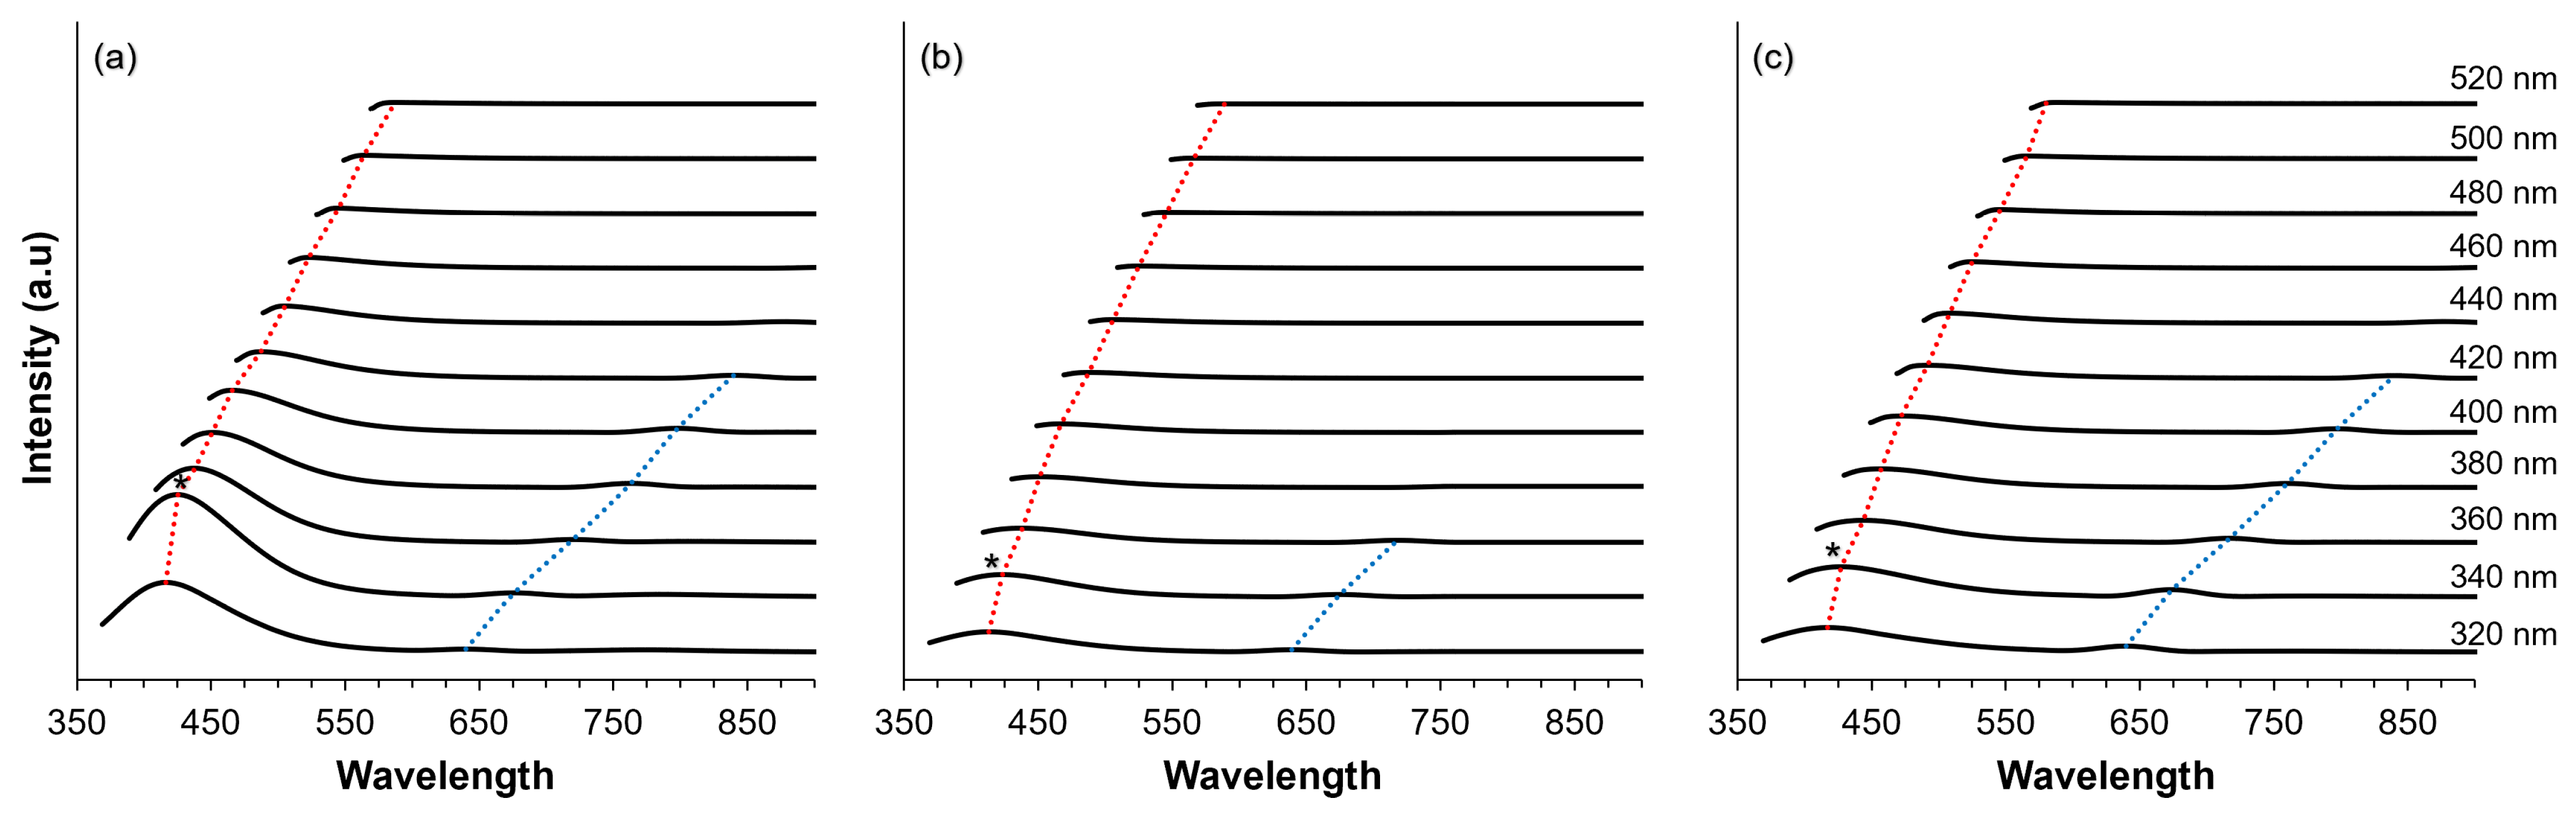
The shift in the wavelength of the fluorescence spectrum has a significant impact on the understanding of the molecular structure and dynamics of the investigated samples. As shown in Figure 7, the fluorescence spectra exhibit two distinct peaks, characterized by shorter wavelengths (red dotted lines) and longer wavelengths (blue dotted lines). Concerning the behavior of the excitation-dependent emission, we note that this is characterized by a shift to longer wavelengths and a decrease in fluorescence intensity as the excitation wavelength progresses from shorter to longer wavelengths. Understanding the excitation-dependent wavelength shift provides valuable insights into the photophysical properties and behavior of the samples and facilitates the elucidation of their structural features and dynamic processes. It is noteworthy that the maximum fluorescence intensity was consistently observed for all samples, when excited at 340 nm, as marked with an asterisk (*) in Figure 7. In terms of intensity, CDs exhibit the highest intensity (934 counts) at 425 nm, followed by CD@Zeolite (275 counts at 427 nm) and CD@KCl with a fluorescence intensity of 208 counts at 423 nm. This observation is consistent with the absorbance data. As for the shift in excitation wavelength, it is noteworthy that CD@KCl exhibits the most pronounced red shift, going from 363 nm when excited at 320 nm to 589 nm when excited at 520 nm. Conversely, CD@Zeolite undergoes a shift of 163 nm (i.e., from 417 nm to 580 nm), while CDs undergo a shift of 171 nm (i.e., from 416 nm to 587 nm) when excited at 320 nm and 520 nm, respectively. While excitation-dependent emission is often attributed to quantum size effects due to the selective excitation of different sizes corresponding to different dominant band gaps, our analysis shows that size alone cannot fully explain this phenomenon. As our analysis shows, changes in the surface state can also influence the energy transfer or charge transfer mechanisms, which is consistent with previous findings [51]. The presence of excitation-dependent emission from our carbon dots could find similar applications involving similar types of emissions, such as metal ion detection [52], biosensing and photodynamic therapy [53], and fluorescent sensing and solar cells [54]. In addition, our carbon dots also exhibited dual emission behavior, a unique optical property that can be used in various applications such as cell imaging [55,56], sensing and environmental monitoring [57,58], and light emitting diodes [59].
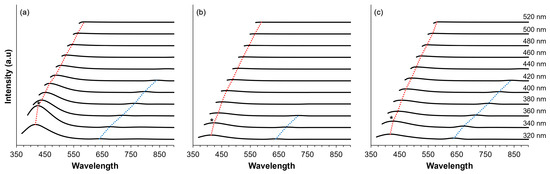
Figure 7.
Fluorescence spectra recorded at various excitation energies for (a) CD; (b) CD@KCl; and (c) CD@Zeolite. Notable peaks at shorter wavelengths are highlighted with red dotted lines, while those at longer wavelengths are denoted by blue dotted lines. Asterisks indicate the peak fluorescence intensities observed across all excitation energies. All measurements were conducted at a concentration of 0.20 mg/mL in water.
4. Conclusions
Structural analysis of three different compositions of carbon dots (CDs), namely CDs, CD@KCl (carbon dots encapsulating potassium chloride), and CD@Zeolite (carbon dots immobilized in a zeolite matrix), revealed important insights into their morphological properties. SEM and TEM images showed the formation of small spherical structures in all samples, suggesting a uniform packing arrangement. In the context of the size of the CDs considered in this study, the undoped species adopt average sizes of 8.86 ± 0.10 nm, whereas those doped with either zeolite or KCl had average sizes of 3.09 ± 0.05 and 2.07 ± 0.05 nm, respectively. Particularly noteworthy was the hierarchical architecture observed in CD@Zeolite, where the carbon dot molecules were integrated into the zeolite matrix and formed cube-shaped structures on the cubic framework. This integration not only improved the structural integrity but also opened possibilities for synergies between the functionalities of both the constituent carbon dot and zeolite components of the material. Analysis of the chemical bonding and elemental composition using X-ray photoelectron spectroscopy revealed distinct differences caused by the presence of the additives. Doping with KCl promoted the oxidation of the hydroxyl groups to carboxyl groups, while doping with zeolite caused partial oxidation. Powder X-ray diffraction analysis confirmed the phase structures of the synthesized samples and provided information about their crystalline nature and structural composition. In addition, characterization of the optical properties revealed variations in band gap energies and excitation-dependent fluorescence spectra, indicating changes in fluorescence intensity and wavelength shifts influenced by surface state and charge transfer mechanisms. These results not only deepen our understanding of carbon dots and their composites, but also suggest potential applications in various fields such as biosensing, environmental monitoring, optoelectronic devices, and advanced materials for energy storage and conversion. This study, thus, highlights the importance of additives and structural modifications in tailoring the properties of carbon dots for various technological applications.
Author Contributions
Conceptualization, R.A.E.L. and M.P.B.; methodology, investigation, writing—original draft preparation, R.A.E.L. and B.A.; software, M.P.B.; validation, R.J.O. and M.P.B.; resources, writing—review and editing, supervision, funding acquisition R.J.O. and M.P.B.; project administration M.P.B. All authors have read and agreed to the published version of the manuscript.
Funding
This research was funded by the Science Committee of the Ministry of Science and Higher Education of the Republic of Kazakhstan (Grant No. AP14870560, project PI—M.P.B.) and Nazarbayev University under the Faculty Development Competitive Research Grants Program (Grant No. 20122022FD4122, M.P.B.).
Data Availability Statement
The raw data supporting the conclusions of this article will be made available by the authors on request.
Acknowledgments
The authors would like to thank the research technologists of the Core Facilities of Nazarbayev University for their valuable support and provision of analytical tools during this study.
Conflicts of Interest
The authors declare no conflicts of interest.
References
- Sun, H.; Wu, L.; Wei, W.; Qu, X. Recent advances in graphene quantum dots for sensing. Mater. Today 2013, 16, 433–442. [Google Scholar] [CrossRef]
- Xu, Y.; Liu, J.; Gao, C.; Wang, E. Applications of carbon quantum dots in electrochemiluminescence: A mini review. Electrochem. Commun. 2014, 48, 151–154. [Google Scholar] [CrossRef]
- Li, L.; Wu, G.; Yang, G.; Peng, J.; Zhao, J.; Zhu, J.-J. Focusing on luminescent graphene quantum dots: Current status and future perspectives. Nanoscale 2013, 5, 4015–4039. [Google Scholar] [CrossRef] [PubMed]
- Hou, A.; Chen, P.; Alloatti, J.; Li, D.; Mozzoni, L.; Zhang, B.; Shi, A. Genetic Variability of Seed Sugar Content in Worldwide Soybean Germplasm Collections. Crop Sci. 2009, 49, 903–912. [Google Scholar] [CrossRef]
- Sharma, S.; Kaur, M.; Goyal, R.; Gill, B.S. Physical characteristics and nutritional composition of some new soybean (Glycine max (L.) Merrill) genotypes. J. Food Sci. Technol. 2014, 51, 551–557. [Google Scholar] [CrossRef]
- Munusamy, S.; Mandlimath, T.R.; Swetha, P.; Al-Sehemi, A.G.; Pannipara, M.; Koppala, S.; Shanmugam, P.; Boonyuen, S.; Pothu, R.; Boddula, R. Nitrogen-doped carbon dots: Recent developments in its fluorescent sensor applications. Environ. Res. 2023, 231 Pt 1, 116046. [Google Scholar] [CrossRef]
- Miao, S.; Liang, K.; Zhu, J.; Yang, B.; Zhao, D.; Kong, B. Hetero-atom-doped carbon dots: Doping strategies, properties and applications. Nano Today 2020, 33, 100879. [Google Scholar] [CrossRef]
- Kaur, M.; Kaur, M.; Sharma, V.K. Nitrogen-doped graphene and graphene quantum dots: A review onsynthesis and applications in energy, sensors and environment. Adv. Colloid Interface Sci. 2018, 259, 44–64. [Google Scholar] [CrossRef]
- Mishra, L.; Behera, R.K.; Mondal, S.; Kumar, S.; Panigrahi, A.; Sarangi, M.K. Interface and doping in carbon dots influence charge transfer and transport. Carbon 2021, 178, 594–605. [Google Scholar] [CrossRef]
- Chen, J.; Liu, J.; Li, J.; Xu, L.; Qiao, Y. One-pot synthesis of nitrogen and sulfur co-doped carbon dots and its application for sensor and multicolor cellular imaging. J. Colloid Interface Sci. 2017, 485, 167–174. [Google Scholar] [CrossRef]
- Liang, C.; Xie, X.; Zhang, D.; Feng, J.; Lu, S.; Shi, Q. Biomass carbon dots derived from Wedelia trilobata for the direct detection of glutathione and their imaging application in living cells. J. Mater. Chem. B 2021, 9, 5670–5681. [Google Scholar] [CrossRef] [PubMed]
- Xu, X.; Sun, Q.; Ma, Y.; Jiang, X.; Niu, N.; Chen, L. Synthesis of KCl-doped lignin carbon dots nanoenzymes for colorimetric sensing glutathione in human serum. Sens Actuators B Chem. 2022, 364, 131881. [Google Scholar] [CrossRef]
- Yang, R.; Guo, X.; Jia, L.; Zhang, Y.; Zhao, Z.; Lonshakov, F. Green preparation of carbon dots with mangosteen pulp for the selective detection of Fe3+ ions and cell imaging. Appl. Surf. Sci. 2017, 423, 426–432. [Google Scholar] [CrossRef]
- Xie, Y.; Cheng, D.; Liu, X.; Han, A. Green Hydrothermal Synthesis of N-doped Carbon Dots from Biomass Highland Barley for the Detection of Hg2+. Sensors 2019, 19, 3169. [Google Scholar] [CrossRef] [PubMed]
- Sanni, S.O.; Moundzounga, T.H.G.; Oseghe, E.O.; Haneklaus, N.H.; Viljoen, E.L.; Brink, H.G. One-Step Green Synthesis of Water-Soluble Fluorescent Carbon Dots and Its Application in the Detection of Cu2+. Nanomaterials 2022, 12, 958. [Google Scholar] [CrossRef]
- Sharma, S.; Umar, A.; Mehta, S.K.; Kansal, S.K. Fluorescent spongy carbon nanoglobules derived from pineapple juice: A potential sensing probe for specific and selective detection of chromium (VI) ions. Ceram. Int. 2017, 43, 7011–7019. [Google Scholar] [CrossRef]
- Landa, S.D.T.; Kaur, I.; Agarwal, V. Pithecellobium dulce Leaf-Derived Carbon Dots for 4-Nitrophenol and Cr(VI) Detection. Chemosensors 2022, 10, 532. [Google Scholar] [CrossRef]
- Arul, V.; Radhakrishnan, K.; Sampathkumar, N.; Kumar, J.V.; Abirami, N.; Inbaraj, B.S. Detoxification of Toxic Organic Dye by Heteroatom-Doped Fluorescent Carbon Dots Prepared by Green Hydrothermal Method Using Garcinia mangostana Extract. Agronomy 2023, 13, 205. [Google Scholar] [CrossRef]
- Atchudan, R.; Edison, T.N.J.I.; Aseer, K.R.; Perumal, S.; Lee, Y.R. Hydrothermal conversion of Magnolia liliiflora into nitrogen-doped carbon dots as an effective turn-off fluorescence sensing, multi-colour cell imaging and fluorescent ink. Colloids Surf. B Biointerfaces 2018, 169, 321–328. [Google Scholar] [CrossRef]
- Cheng, K.; Shao, W.; Li, H.; Guo, W.; Bian, H.; Han, J.; Wu, G.; Xing, W. Biomass derived carbon dots mediated exciton dissociation in rose flower-like carbon nitride for boosting photocatalytic performance. Ind. Crops Prod. 2023, 192, 116086. [Google Scholar] [CrossRef]
- Xie, Y.; Filchakova, O.; Yang, Q.; Yesbolatov, Y.; Tursynkhan, D.; Kassymbek, A.; Bouhrara, M.; Wang, K.; Balanay, M.; Fan, H. Inhibition of Cancer Cell Proliferation by Carbon Dots Derived from Date Pits at Low-Dose. ChemistrySelect 2017, 2, 4079–4083. [Google Scholar] [CrossRef]
- Xie, Y.; Sun, Q.; Nurkesh, A.A.; Lu, J.; Kauanova, S.; Feng, J.; Tursynkhan, D.; Yang, Q.; Kassymbek, A.; Karibayev, M.; et al. Dysregulation of YAP by ARF Stimulated with Tea-derived Carbon Nanodots. Sci. Rep. 2017, 7, 16577. [Google Scholar] [CrossRef] [PubMed]
- Zhu, L.; Shen, D.; Wang, Q.; Luo, K.H. Green Synthesis of Tunable Fluorescent Carbon Quantum Dots from Lignin and Their Application in Anti-Counterfeit Printing. ACS Appl. Mater. Interfaces 2021, 13, 56465–56475. [Google Scholar] [CrossRef] [PubMed]
- Shi, H.; Li, C.; Ke, X.; Cai, Y.; Qian, S.; Wu, L.; Deng, Y.; Sai, L.; Xu, X. Color integration in biomass-derived carbon dots to realize one-step white light. Green Chem. Lett. Rev. 2023, 16, 2214178. [Google Scholar] [CrossRef]
- Abdulla, N.S.; Fernandez, M.J.F.; Balanay, M.P. Upcycling biomass waste into luminescent solid-state carbon dots. Next Mater. 2024, 3, 100155. [Google Scholar] [CrossRef]
- Wang, H.; Sun, P.; Cong, S.; Wu, J.; Gao, L.; Wang, Y.; Dai, X.; Yi, Q.; Zou, G. Nitrogen-Doped Carbon Dots for “green” Quantum Dot Solar Cells. Nanoscale Res. Lett. 2016, 11, 27. [Google Scholar] [CrossRef] [PubMed]
- Li, T.-X.; Zhao, D.-F.; Li, L.; Meng, Y.; Xie, Y.-H.; Feng, D.; Wu, F.; Xie, D.; Liu, Y.; Mei, Y. Unraveling fluorescent mechanism of biomass-sourced carbon dots based on three major components: Cellulose, lignin, and protein. Bioresour. Technol. 2024, 394, 130268. [Google Scholar] [CrossRef]
- Lin, L.; Luo, Y.; Tsai, P.; Wang, J.; Chen, X. Metal ions doped carbon quantum dots: Synthesis, physicochemical properties, and their applications. TrAC Trends Anal. Chem. 2018, 103, 87–101. [Google Scholar] [CrossRef]
- Qian, F.; Li, X.; Tang, L.; Lai, S.K.; Lu, C.; Lau, S.P. Potassium doping: Tuning the optical properties of graphene quantum dots. AIP Adv. 2016, 6, 075116. [Google Scholar] [CrossRef]
- Reddi, A.S. Disorders of Potassium: Hypokalemia. In Fluid, Electrolyte and Acid-Base Disorders; Springer: Cham, Switzerland, 2023; pp. 211–237. [Google Scholar]
- Mahmodi, G.; Zarrintaj, P.; Taghizadeh, A.; Taghizadeh, M.; Manouchehri, S.; Dangwal, S.; Ronte, A.; Ganjali, M.R.; Ramsey, J.D.; Kim, S.-J.; et al. From microporous to mesoporous mineral frameworks: An alliance between zeolite and chitosan. Carbohydr. Res. 2020, 489, 107930. [Google Scholar] [CrossRef]
- Liu, J.; Wang, N.; Yu, Y.; Yan, Y.; Zhang, H.; Li, J.; Yu, J. Carbon dots in zeolites: A new class of thermally activated delayed fluorescence materials with ultralong lifetimes. Sci. Adv. 2017, 3, e1603171. [Google Scholar] [CrossRef] [PubMed]
- Zhang, H.; Liu, J.; Wang, B.; Liu, K.; Chen, G.; Yu, X.; Li, J.; Yu, J. Zeolite-confined carbon dots: Tuning thermally activated delayed fluorescence emission via energy transfer. Mater. Chem. Front. 2020, 4, 1404–1410. [Google Scholar] [CrossRef]
- Wang, B.; Mu, Y.; Yin, H.; Yang, Z.; Shi, Y.; Li, J. Formation and origin of multicenter photoluminescence in zeolite-based carbogenic nanodots. Nanoscale 2018, 10, 10650–10656. [Google Scholar] [CrossRef] [PubMed]
- Wang, B.; Mu, Y.; Zhang, H.; Shi, H.; Chen, G.; Yu, Y.; Yang, Z.; Li, J.; Yu, J. Red Room-Temperature Phosphorescence of CDs@Zeolite Composites Triggered by Heteroatoms in Zeolite Frameworks. ACS Cent. Sci. 2019, 5, 349–356. [Google Scholar] [CrossRef] [PubMed]
- Yilmaz, B.; Trukhan, N.; Müller, U. Industrial Outlook on Zeolites and Metal Organic Frameworks. Chin. J. Catal. 2012, 33, 3–10. [Google Scholar] [CrossRef]
- Ma, C.; Yin, C.; Fan, Y.; Yang, X.; Zhou, X. Highly efficient synthesis of N-doped carbon dots with excellent stability through pyrolysis method. J. Mater. Sci. 2019, 54, 9372–9384. [Google Scholar] [CrossRef]
- Ding, H.; Zhou, X.-X.; Zhang, Z.-H.; Zhao, Y.-P.; Wei, J.-S.; Xiong, H.-M. Large scale synthesis of full-color emissive carbon dots from a single carbon source by a solvent-free method. Nano Res. 2021, 15, 3548–3555. [Google Scholar] [CrossRef]
- Zhou, X.-L.; He, P.-J.; Peng, W.; Lü, F.; Shao, L.-M.; Zhang, H. From plastics to methane and carbon spheres: The evolution of pyrolysis products during pyrolysis under autogenic atmosphere. J. Anal. Appl. Pyrolysis 2022, 161, 105421. [Google Scholar] [CrossRef]
- Zhou, X.L.; Zhu, L.Y.; Yang, Y.; Xu, L.J.; Qian, X.J.; Zhou, J.; Dong, W.L.; Jiang, M. High-yield and nitrogen self-doped hierarchical porous carbon from polyurethane foam for high-performance supercapacitors. Chemosphere 2022, 300, 134552. [Google Scholar] [CrossRef]
- da Cruz, M.G.A.; Onwumere, J.N.; Chen, J.; Beele, B.; Yarema, M.; Budnyk, S.; Slabon, A.; Rodrigues, B.V.M. Solvent-free synthesis of photoluminescent carbon nanoparticles from lignin-derived monomers as feedstock. Green Chem. Lett. Rev. 2023, 16, 2196031. [Google Scholar] [CrossRef]
- Liu, K. Soybeans: Chemistry, Technology, and Utilization; Springer: New York, NY, USA, 1997. [Google Scholar]
- Wen, Y.; Liu, A.; Meng, C.; Li, Z.; He, P. Quantification of lectin in soybeans and soy products by liquid chromatography-tandem mass spectrometry. J. Chromatogr. B 2021, 1185, 122987. [Google Scholar] [CrossRef] [PubMed]
- Bai, J.; Gao, H.; Xu, J.; Li, L.; Zheng, P.; Li, P.; Song, J.; Chang, C.; Pang, S. Comprehensive study on the pyrolysis product characteristics of tobacco stems based on a novel nitrogen-enriched pyrolysis method. Energy 2022, 242, 122535. [Google Scholar] [CrossRef]
- Zhou, J.; Bao, L.; Wu, S.; Yang, W.; Wang, H. One-step synthesis of chitin-derived nitrogen-rich porous carbon fiber assisted with ammonium chloride chemical blowing for supercapacitors. J. Mater. Sci. Mater. Electron. 2018, 29, 12340–12350. [Google Scholar] [CrossRef]
- Pal, A.; Sk, M.P.; Chattopadhyay, A. Recent advances in crystalline carbon dots for superior application potential. Mater. Adv. 2020, 1, 525–553. [Google Scholar] [CrossRef]
- Dai, F.; Zai, J.; Yi, R.; Gordin, M.L.; Sohn, H.; Chen, S.; Wang, D. Bottom-up synthesis of high surface area mesoporous crystalline silicon and evaluation of its hydrogen evolution performance. Nat. Commun. 2014, 5, 3605. [Google Scholar] [CrossRef] [PubMed]
- Zheng, H.; Han, L.; Ma, H.; Zheng, Y.; Zhang, H.; Liu, D.; Liang, S. Adsorption characteristics of ammonium ion by zeolite 13X. J. Hazard. Mater. 2008, 158, 577–584. [Google Scholar] [CrossRef] [PubMed]
- Liu, Y.; Zhu, C.; Gao, Y.; Yang, L.; Xu, J.; Zhang, X.; Lu, C.; Wang, Y.; Zhu, Y. Biomass-derived nitrogen self-doped carbon dots via a simple one-pot method: Physicochemical, structural, and luminescence properties. Appl. Surf. Sci. 2020, 510, 145437. [Google Scholar] [CrossRef]
- Makuła, P.; Pacia, M.; Macyk, W. How To Correctly Determine the Band Gap Energy of Modified Semiconductor Photocatalysts Based on UV–Vis Spectra. J. Phys. Chem. Lett. 2018, 9, 6814–6817. [Google Scholar] [CrossRef] [PubMed]
- Siddique, A.B.; Hossain, S.M.; Pramanick, A.K.; Ray, M. Excitation dependence and independence of photoluminescence in carbon dots and graphene quantum dots: Insights into the mechanism of emission. Nanoscale 2021, 13, 16662–16671. [Google Scholar] [CrossRef]
- Wang, C.; Shi, H.; Yang, M.; Yan, Y.; Liu, E.; Ji, Z.; Fan, J. Facile synthesis of novel carbon quantum dots from biomass waste for highly sensitive detection of iron ions. Mater. Res. Bull. 2020, 124, 110730. [Google Scholar] [CrossRef]
- Azam, N.; Ali, M.N.; Khan, T.J. Carbon Quantum Dots for Biomedical Applications: Review and Analysis. Front. Mater. 2021, 8, 700403. [Google Scholar] [CrossRef]
- Rocco, D.; Moldoveanu, V.G.; Feroci, M.; Bortolami, M.; Vetica, F. Electrochemical Synthesis of Carbon Quantum Dots. ChemElectroChem 2023, 10, e202201104. [Google Scholar] [CrossRef] [PubMed]
- Liang, C.; Xie, X.; Shi, Q.; Feng, J.; Zhang, D.; Huang, X. Nitrogen/sulfur-doped dual-emission carbon dots with tunable fluorescence for ratiometric sensing of ferric ions and cell membrane imaging. Appl. Surf. Sci. 2022, 572, 151447. [Google Scholar] [CrossRef]
- Li, L.; Shi, L.; Jia, J.; Eltayeb, O.; Lu, W.; Tang, Y.; Dong, C.; Shuang, S. Dual Photoluminescence Emission Carbon Dots for Ratiometric Fluorescent GSH Sensing and Cancer Cell Recognition. ACS Appl. Mater. Interfaces 2020, 12, 18250–18257. [Google Scholar] [CrossRef] [PubMed]
- Huang, G.; Luo, X.; He, X.; Han, Y.; Zhao, H.; Tang, W.; Yue, T.; Li, Z. Dual-emission carbon dots based ratiometric fluorescent sensor with opposite response for detecting copper (II). Dye. Pigment. 2021, 196, 109803. [Google Scholar] [CrossRef]
- Zhu, P.; Tan, K. Dual-Emission Carbon Dots for Fluorescent Sensing of Permanganate. ACS Appl. Nano Mater. 2023, 6, 21194–21200. [Google Scholar] [CrossRef]
- Guan, Q.; Su, R.; Zhang, M.; Zhang, R.; Li, W.; Wang, D.; Xu, M.; Fei, L.; Xu, Q. Highly fluorescent dual-emission red carbon dots and their applications in optoelectronic devices and water detection. New J. Chem. 2019, 43, 3050–3058. [Google Scholar] [CrossRef]
Disclaimer/Publisher’s Note: The statements, opinions and data contained in all publications are solely those of the individual author(s) and contributor(s) and not of MDPI and/or the editor(s). MDPI and/or the editor(s) disclaim responsibility for any injury to people or property resulting from any ideas, methods, instructions or products referred to in the content. |
© 2024 by the authors. Licensee MDPI, Basel, Switzerland. This article is an open access article distributed under the terms and conditions of the Creative Commons Attribution (CC BY) license (https://creativecommons.org/licenses/by/4.0/).