Article

Fatigue Analysis of the Nickel-Based Superalloy Inconel 617 by Fatigue Experiments and EBSD Data-Based Finite Element Simulations in Correlation with E·m Theories

Institute of Materials Engineering (WKK), Rheinland-Pfälzische Technische Universität Kaiserslautern-Landau (RPTU), Gottlieb-Daimler-Straße 44, 67663 Kaiserslautern, Germany
*
Author to whom correspondence should be addressed.
Crystals 2024, 14(4), 356; https://doi.org/10.3390/cryst14040356
Submission received: 21 March 2024 / Revised: 28 March 2024 / Accepted: 8 April 2024 / Published: 10 April 2024
(This article belongs to the Special Issue Mechanical Behaviour of Anisotropic Coarse Grain Materials)

Abstract

:
Nickel-based superalloys exhibit pronounced elastic anisotropy and, hence, the local grain orientation strongly affects the stress and strain distribution in the material under mechanical loadings. Therefore, the crack initiation and failure behaviour of components made from nickel-based superalloys are complex and hardly predictable. A better fundamental understanding of the phenomena that occur in nickel-based superalloys under a quasistatic and cyclic load is therefore desired. Previously, a continuum mechanics-based model has been successfully developed, considering the grain structure, the elastic anisotropy, and the Schmid factor, based on data from electron backscatter diffraction (EBSD). The E·m model was confirmed by the finite element method (FEM) simulations and experimental observations regarding the resulting average stresses and strains in the individual grains as well as the formation of slip bands under a quasistatic load with few restrictions. The behaviour under cyclic loadings has been investigated in this work to correlate the mechanical behaviour, simulated by the previously developed FE models, with the local stiffness and Schmid factors considering fatigue failure. For this purpose, the fatigue behaviour of Inconel 617 samples was characterised up to the high-cycle fatigue (HCF) regime, accompanied by EBSD measurements for stress amplitudes that resulted in strains close to the elastic–plastic regime. The EBSD data were used to create digital twins of the samples to simulate the mechanical reaction to a displacement similar to the associated strain of the fatigue tests. An analysis of the fractured samples by scanning electron microscopy was performed to retrace the location of the crack initiation supported by the EBSD measurements before and after fatigue testing. Two samples were investigated in detail that showed different fracture types. Sample 1 showed transcrystalline failure in a grain that showed a high Young’s modulus, Schmid factor, and resolved shear stress that indicates a failure due to the properties of the grain itself. In contrast, an intercrystalline failure was observed for sample 2 that showed large differences in the orientation and, hence, largely different mechanical properties in the area of failure as well. The observed failure types, the resulting stresses and strains calculated by the FE model, and the consideration of the E·m model showed an agreement of all the methods. Therefore, the findings of this work complement previous investigations of the mechanical behaviour of coarse-grained anisotropic nickel-based superalloys with a focus on the orientations of the grains towards the loading direction.

Graphical Abstract

1. Introduction

Nickel-based superalloys provide adequate mechanical properties at temperatures permanently exceeding 500 °C and long-term stability [1]. Applications include aero engine or power plant turbine blades for cast alloys and turbine rotors for wrought alloys. Sheet material, such as the Inconel 617 alloy studied here, is used for high temperature ducts, combustion cans, or hot gas transition liners [2]. Cast components, e.g., turbine blades, are manufactured by three different routes resulting in single crystals, directionally solidified structures, or randomly oriented polycrystals that can be thermally treated to induce coherent Ni3(Al,Ti) γ′ precipitations for an increase in mechanical strength [3,4]. Regardless of the individual manufacturing, all nickel-based superalloys have anisotropic Young’s moduli that can vary from 130 GPa to 330 GPa depending on the orientation of the loading direction to the [011] lattice orientation [5]. The resulting anisotropy factor of more than 2.5 strongly affects the resulting shear stresses in the slip systems [6] and causes high scattering of the material data. To compensate for this scattering, high security factors are used during the design of components, which causes an oversizing of the components [7]. To allow for a more efficient design of components, the loadings and material reactions that affect the fatigue behaviour of the material must be fundamentally understood [8,9].
Numerous investigations of the deformation characteristics of nickel-based superalloys, exploring a range of parameters and observing phenomena across macro-, micro-, and nanoscales [6,8,9,10,11,12], revealed a correlation between the strain and the formation of slip bands or twins, consistently associated with local plastic deformation under static or cyclic loading. In other studies [6,8], the influence of the local grain orientation on the crack initiation behaviour of the coarse-grained nickel-based superalloy René80 was investigated with a focus on the maximum Schmid factors under consideration of the most favourable slip system that favoured fatigue failure. Additionally, FE models were developed to simulate material reactions on mechanical loadings based on artificial samples including elastic [9] and elastic–plastic [11] properties, both showing failure in areas with largely different properties.
These mostly theoretical findings have been observed and quantified through techniques such as digital image correlation combined with electron backscatter diffraction (EBSD) [13,14,15,16]. To further support the understanding of these phenomena, simulations were conducted using the finite element method (FEM). These simulations involved artificially created grain structures subjected to uniaxial loadings, taking into account local stiffness tensors and Schmid factors, and provided valuable insights, aligning with the E·m model [6,8,12,17,18]. Schmid’s law was employed to describe the resulting shear stress ( τ r e s ) under uniaxial tensile loadings ( σ ). This law considers the slip systems of crystalline material, factoring in the angles of the slip plane that are normal (λ) and the slip direction (κ) with respect to the tensile axis. These angles are combined to form the Schmid factor (m) [18].
τ r e s = σ · cos λ · c o s κ = σ · m
Providing context for the subject matter of this research, the overarching findings of the abovementioned previous investigations related to E (Young’s modulus) and m (Schmid factor) can be summarised as follows:
  • Grains with a low E exhibit increased elastic deformation [19,20] and significant elongation before plasticity sets in [20].
  • Conversely, grains with a high E·m are associated with elevated shear stress [17,18], plastic deformation, and the formation of slip bands [6,12].
  • Additionally, the presence of markedly different E·m values between adjacent grains results in stress concentrations [9,17], potentially acting as initiation sites for fatigue cracks [6,8].
In contrast to conventional deterministic approaches, which often involve high safety factors in component design, researchers previously constructed a model based on experimental data and FEM simulations using artificial samples to develop a probabilistic model for lifetime prediction [6,10,11]. These investigations took into account the local Young’s moduli and Schmid factors concerning the phenomena outlined above. The research presented in this article concentrates on the mechanical behaviour of the nickel-based superalloy Inconel 617 under a cyclic tensile load. The analysis was conducted experimentally through fatigue tests accompanied by electron backscatter diffraction (EBSD) measurements. EBSD data were utilised to create digital twins of the respective grain structures for the FEM simulations replicating the same loading scenario on the samples with their actual grain morphology. Additionally, the EBSD data were used to calculate the local stiffness, Schmid factors, and their product E·m. In previous work on the deformation behaviour under quasistatic loading, a continuum mechanics-based, elasto-plastic FE model has been developed for Inconel 617, considering the grain structure and the elastic anisotropy. This model was successfully validated up to the onset of plastic deformation and confirmed the abovementioned results of the E·m model for a quasistatic load [21]. In the work presented here, these methods were transferred to cyclic loadings, accompanied by much smaller total deformations.

2. Materials and Methods

The alloy Inconel 617 finds widespread application in turbine components [3]. It was selected for this investigation owing to its grain structure, which can be effectively approximated using Voronoi tessellation [22]. This facilitates a relatively straightforward identification of grains and the easy interpretation of results due to the presence of distinct and straight grain boundaries. The chemical composition, as provided by the distributor, is detailed in Table 1. Notably, the lower Al and Ti contents in comparison to cast alloys like René80 (approximately 3 wt% Al and 5 wt% Ti) [23] suggest limited Ni3(Al,Ti) γ′ precipitation hardening, simplifying plastic deformation.
Data processing and analysis are based on a two-dimensional approach, based on EBSD measurements, as described in [21]. To achieve an approximately two-dimensional grain structure of the samples, a coarsening thermal treatment of Inconel 617 sheets with a thickness of 3 mm and an average grain size of ~100 µm (see Figure 1a,b) was performed at 1200 °C for 170 h in air. Afterwards, the final sample geometry with a thickness of 0.5 mm and an average grain size of ~450 µm was manufactured by milling (see Figure 1c,d), approximately fulfilling the two-dimensional approach of the experiments. The thermal treatment created approximately 0.1 mm thick oxide layers on all sides of the samples and, hence, has to be performed before the final sample geometry is manufactured. After milling, the samples were finally polished and gradually etched by Adler-etchant until the grain structure was visible by light microscopy.
Fatigue testing was performed at room temperature (20 °C) using the electro dynamic fatigue testing machine “TA Instruments EletroForce LM2 TestBench” that was operated with force-controlled sinusoidal loadings at a frequency of 20 Hz and a load ratio of R = 0.1 . Figure 2 shows a sample that was clamped and loaded in the fatigue testing machine as an example. The gauge section, marked by blue lines, exhibits a roughened surface due to plastic deformation that slightly exceeds the measurement gauge into the sample shafts. This roughening occurs immediately after starting the experiment for all the load levels. During the further load cycles, the average displacement of the testing machine remained constant during the whole experiment, except for the last cycles before the final rupture. Hence, cyclic creep, commonly observed for different materials, e.g., refs. [24,25], can be excluded.
Electron backscatter diffraction (EBSD) mappings of the whole gauge section were achieved by a Tescan Gaya III Dual-Beam FIB with an integrated EDX-EBSD system with an EBSD camera-type Hikari Plus at 20 kV acceleration voltage. Approximately one million data sets per sample were acquired. All the samples were polished before the EBSD measurements and investigated in the initial state and after rupture without further surface treatment. Due to the surface deformation, surface-sensitive EBSD measurements could only be performed for stress amplitudes resulting in small plastic strains. Additionally, ruptured samples were investigated by scanning electron microscopy (SEM) using an FEI Quanta 600 device to observe the fractured surfaces. The EBSD data were only gained on one side of the sample. Hence, the FE model and the analysis of the stiffness and Schmid factors considering the E·m model are based on a two-dimensional approach. The EBSD data were transferred to an FE model in several steps using MTEX 5.8.1, gmsh 3.0.6, Python 3.6.0, and Dassault Simulia Abaqus 2022 using the workflow developed in previous work [21]. The EBSD data underwent initial processing within the MATLAB toolbox MTEX, as per the guidelines provided in [26]. This involved indexing the data based on the measured grain orientations, identifying and recalculating the grain geometries, filling the non-indicated areas within the grains, and smoothing the grain boundaries to ensure smooth transitions, which is crucial for the subsequent FEM simulation. The recalculated grain geometries were exported into a geometry file (*.geo) for meshing in the subsequent step using gmsh. A Python script facilitated assigning the measured orientations to the individual grains. The FEM simulations included continuum mechanics-based plastic deformation but no explicit crystal plasticity model. Therefore, the results are only valid up to the onset of plastic deformation. The basic setup of the FE model is illustrated in Figure 3: The whole gauge length of the sample is simulated including separate grains and their associated crystal orientations, previously determined by EBSD. An arbitrary grain is highlighted and magnified as an example, also showing the tetrahedral mesh (C3D6), that was applied in the model. The arrows at each side of the model indicate the direction of the static displacement of 45 µm, equivalent to 0.3% total strain, that was applied according to the maximum strain of the fatigue tests on the samples that have been characterised by EBSD. The material properties implemented into the model are listed in Table 2 [21].

3. Results and Discussion

3.1. Fatigue Experiments

Figure 4 shows the results of the fatigue experiments in the form of an S-N curve. The pronounced elastic anisotropy combined with the relatively large grain size causes considerable scatter. However, the general fatigue lifetime behaviour up to a cycle number of about 108 can be assessed from these results. The focus of this work is the investigation of the crack initiation site regarding local stresses, strains, stiffness, and Schmid factors in comparison to the deformation behaviour under quasistatic loading based on EBSD data [21]. Attempts to perform EBSD measurements on samples subjected to stress amplitudes of 110 MPa and above failed due to the surface roughness induced by the plastic deformation that caused an insufficient indication of the EBSD measurements. Hence, the samples loaded with stress amplitudes of approximately 100 MPa were chosen, which underwent only small cyclic plastic deformation. These samples exhibited sufficiently smooth surfaces after fatigue loading to reach indications of around 60% in the relevant area around the fracture site, which allowed for the comparison to the EBSD measurement in the initial state. Two specimens, indicated as sample 1 and sample 2 in Figure 4, have been characterised in detail to identify the correlations between the simulated stresses and strains, local stiffnesses, and Schmid factors as well as the crack initiation sites in comparison to the behaviour under quasistatic loadings. The respective grain structures in the gauge length before fatigue loading are illustrated in Figure 4b,c.

3.2. Fracture Analyses and EBSD Measurements

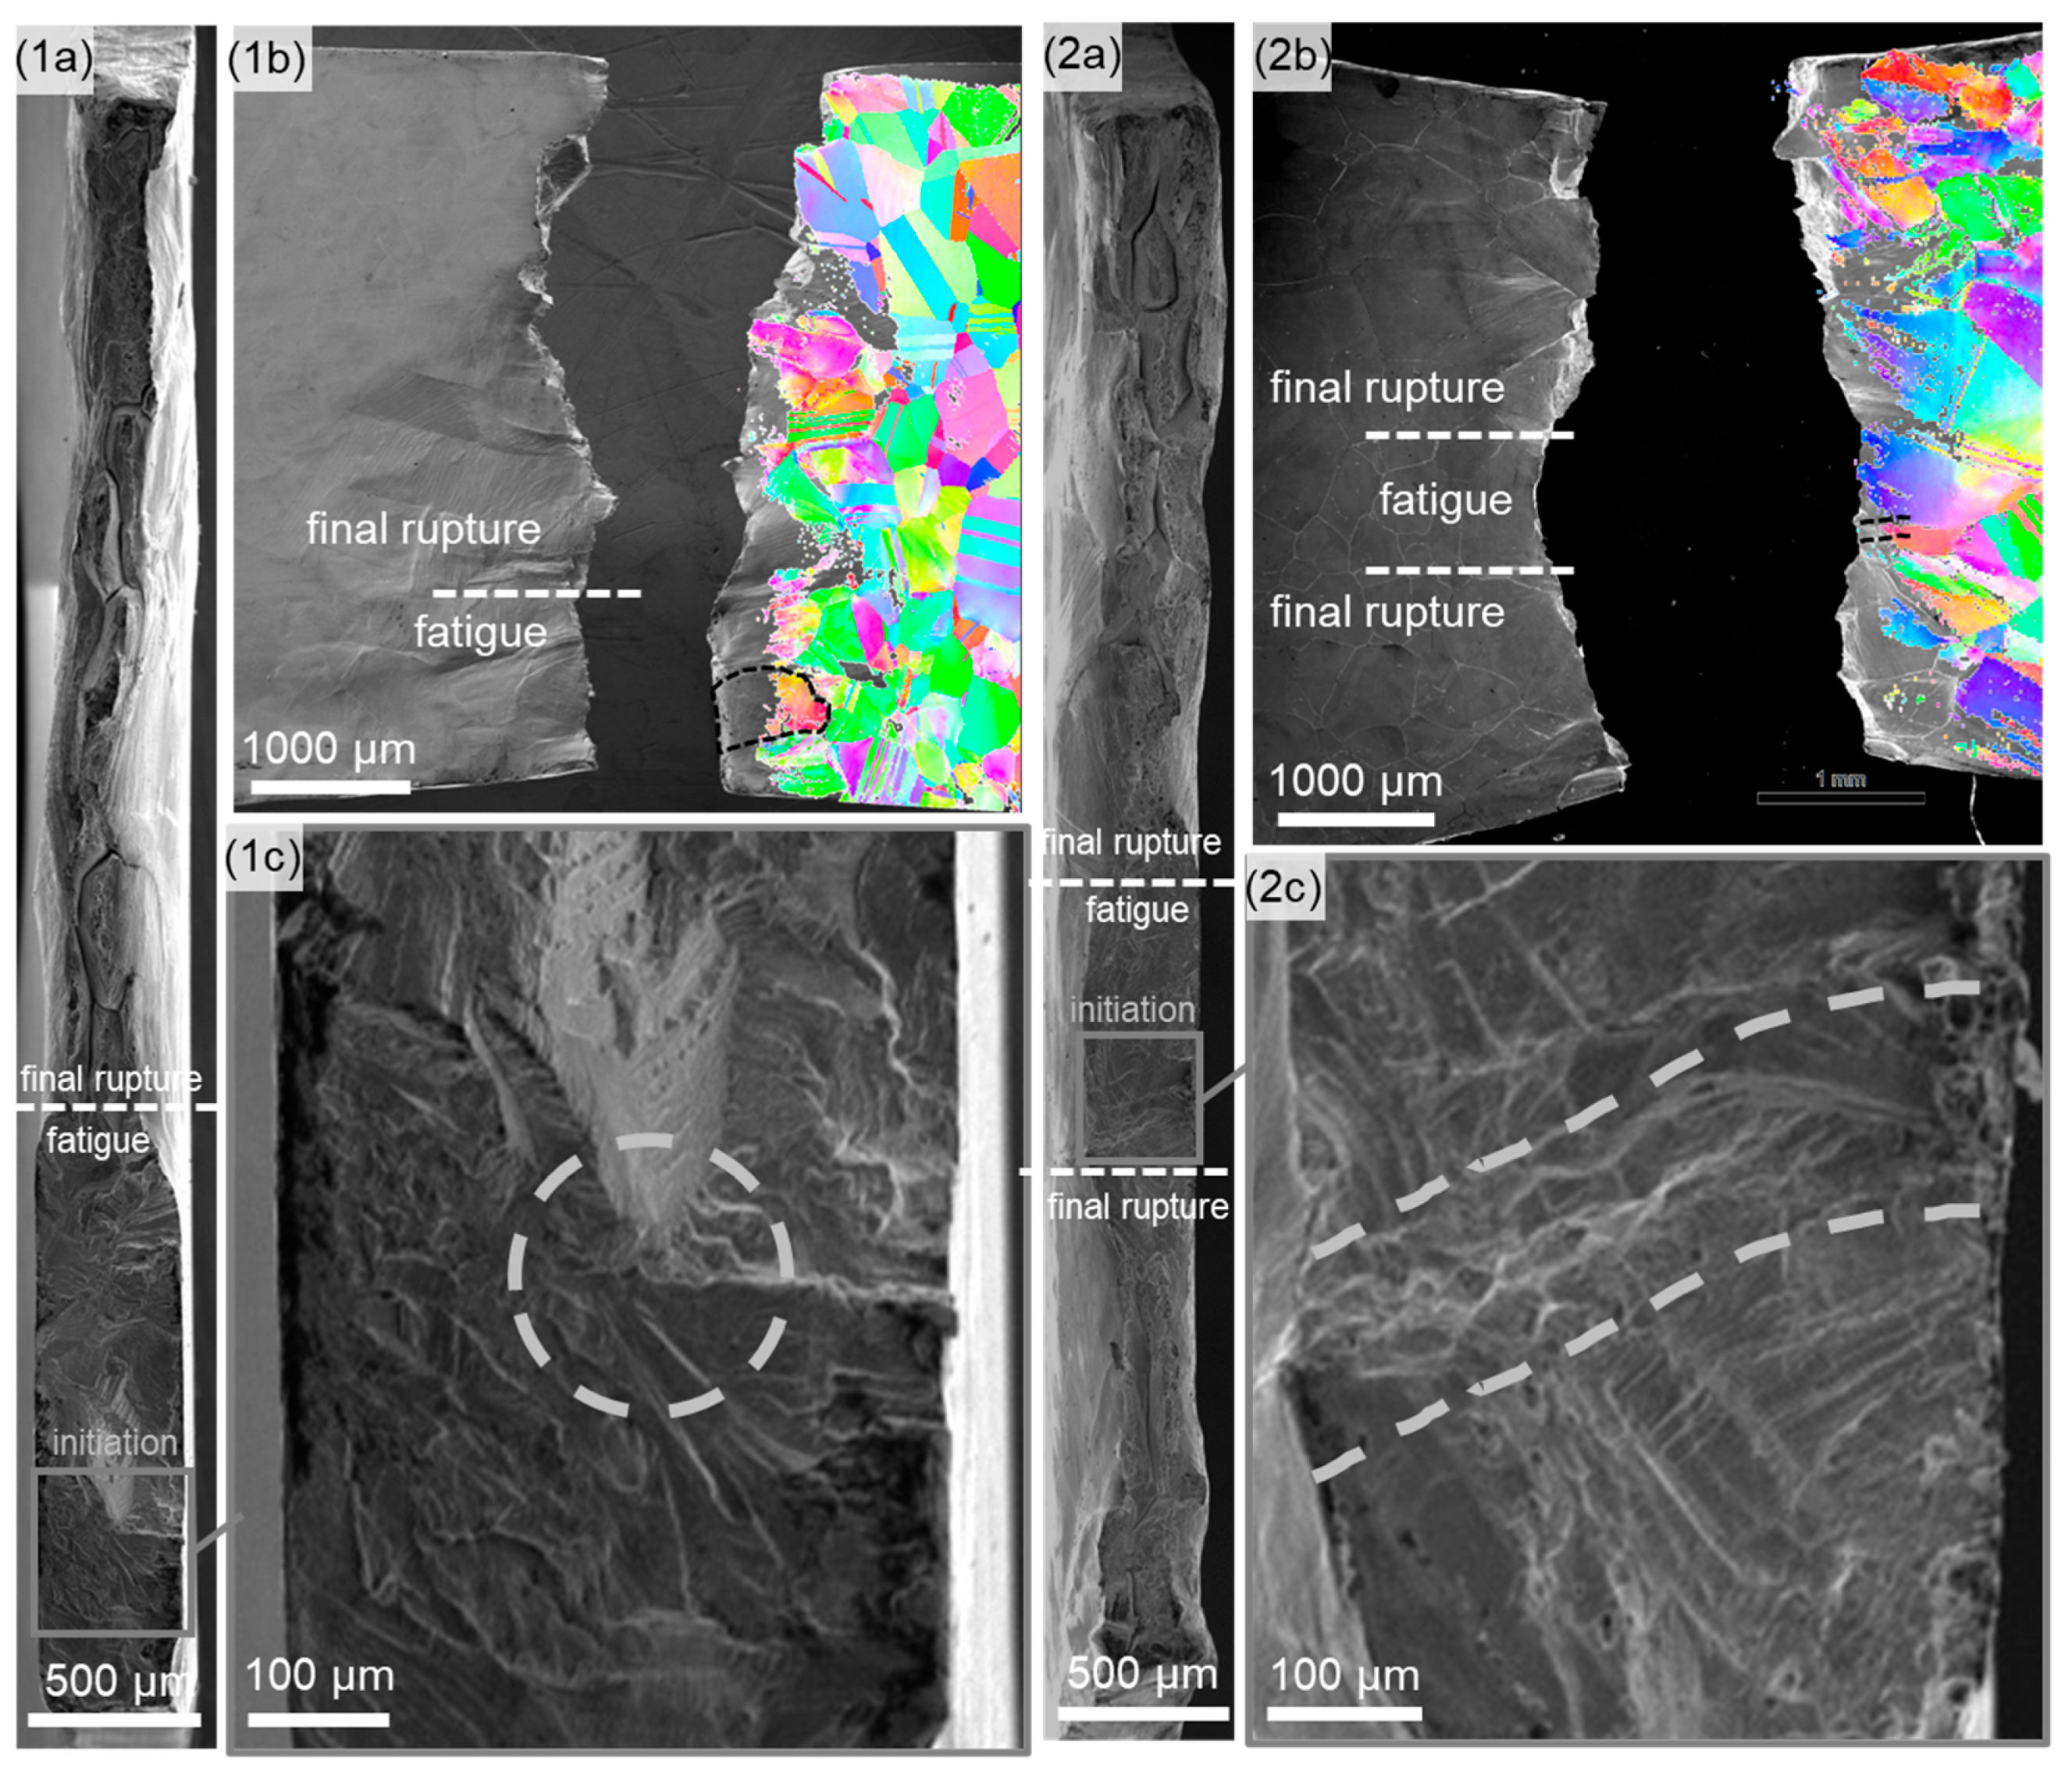
Using SEM images of the fracture surfaces (see Figure 5(1a,2a)), the region of fatigue crack propagation was separated from the final rupture where necking and/or extensive plastic deformation was seen. The area of fatigue failure shows the characteristic features of the fatigue crack initiation marked by the dashed lines in the sideview in Figure 5(1b,2b) and in Figure 5(1c,2c) on the fracture surface. The EBSD data of the samples in the initial state and after failure were additionally used to accurately identify the crack initiation region (see Figure 5(1b,2b)). Moreover, it was concluded from the EBSD images that sample 1 showed transcrystalline failure in the grain marked by the dashed black lines in Figure 5(1b), while sample 2 showed intercrystalline fatigue crack initiation. The two dashed lines in Figure 5(2b,2c) highlight the respective grain boundary in sample 2.

3.3. FEM Simulations and E·m Model

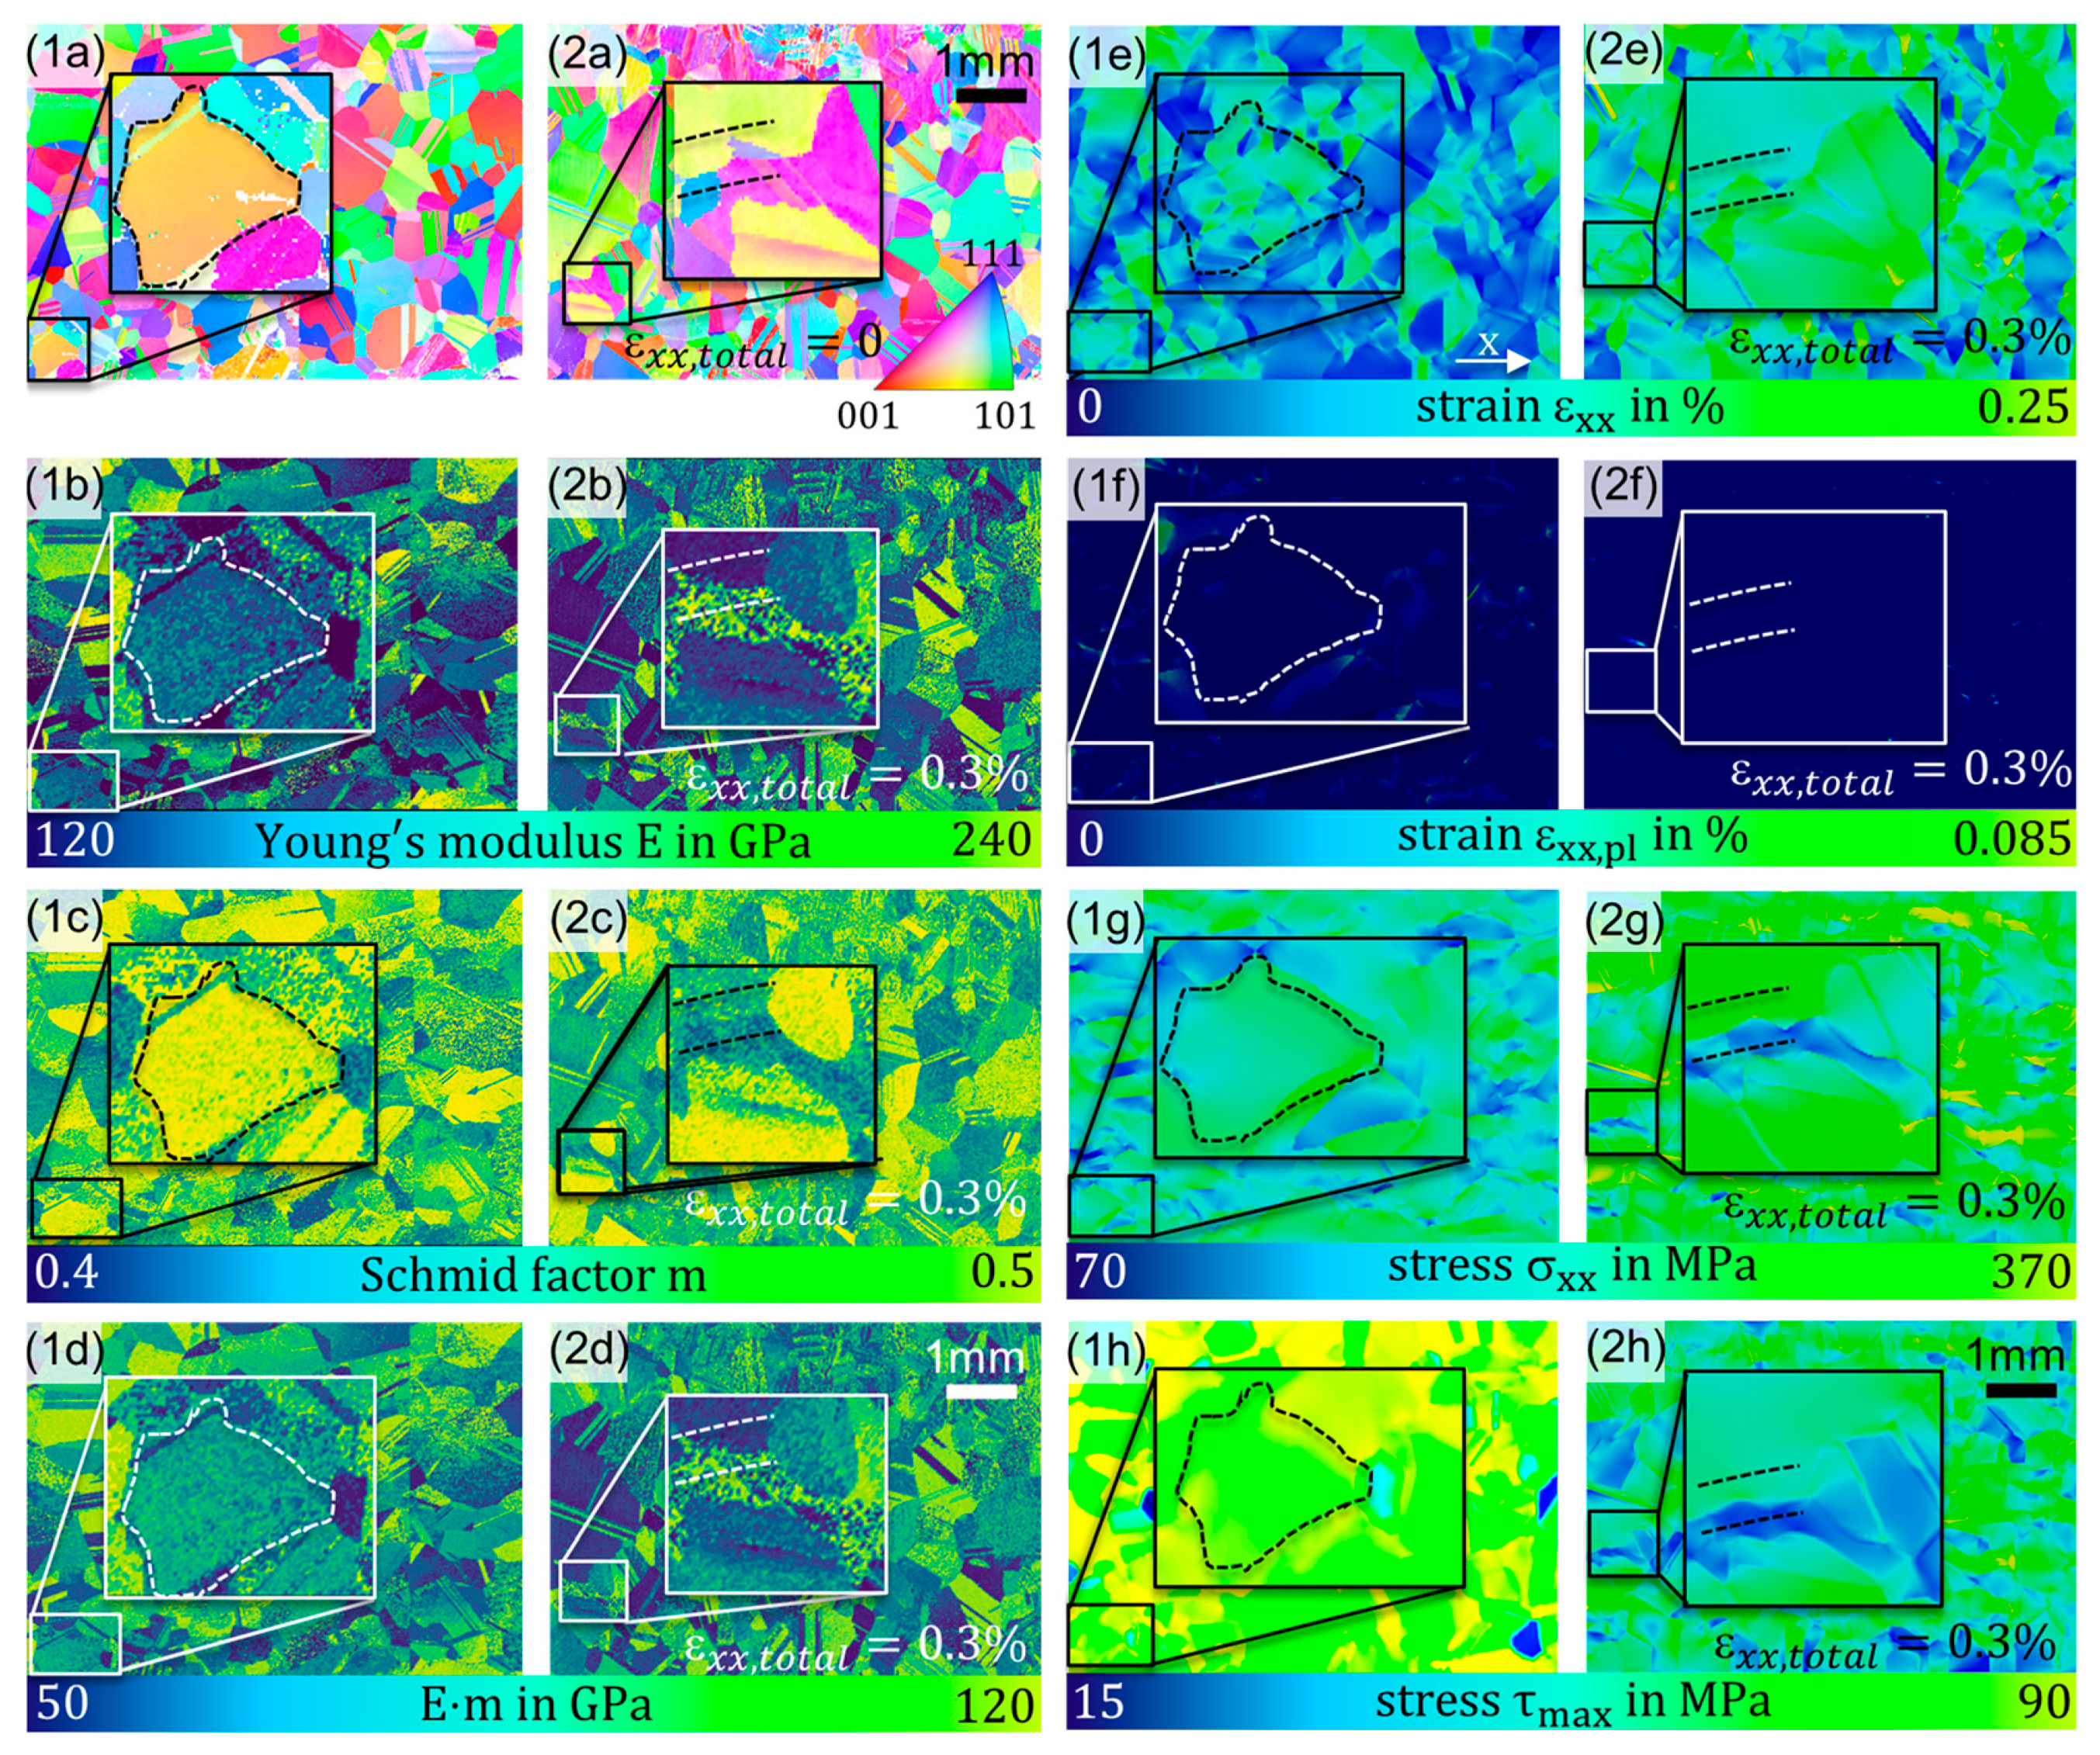
Both the FEM simulations and the E·m model are based on the EBSD data of the samples in their initial state. Figure 6 shows the results of the FE model in comparison to the stiffness and Schmid factors to explain the fatigue failure initiation in the samples observed. The before identified areas where fatigue failure occurred are highlighted by dashed lines for sample 1 in Figure 6(1a–1h) and for sample 2 in Figure 6(2a–2h). The different appearance in the images is caused by the processing of the original data sets depending on the investigations. The original EBSD data are shown in Figure 6a. The calculated Young’s moduli, Schmid factors, and their product E·m are depicted in Figure 6c,d. For better visibility, only a section of the measurement gauge is displayed. The simulated strains and stresses are mapped in Figure 6e–g and the resolved shear stress in the active slip system, calculated by the multiplication of the stress tensor and the modified Schmid factor of the most favourable slip system [17], is shown in Figure 6h. All the simulation results were achieved at an implemented strain in a loading direction of 0.3% (see Figure 3). The direction of the loading is indicated in Figure 6(1e).
Sample 1 showed a rather low Young’s modulus E, very high Schmid factor m, and, respectively, high E·m in the highlighted grain that showed transcrystalline failure. Consistent with the E·m model, described in the introduction, the low Young’s modulus resulted in a pronounced elastic strain and nearly no plastic strain [20]. However, the high E·m value resulted in an elevated resolved shear stress [17,18] that matches with the transcrystalline failure. In contrast, sample 2 showed intercrystalline failure in the highlighted area. The original EBSD data in Figure 6(2a) reveal distinctly different orientations between the adjacent grains in the highlighted region. Consequently, the stiffness E and Schmid factor m varied within short distances, indicated by a high Young’s modulus in the one lower and a very low Young’s modulus E in the upper region of the highlighted area. The Schmid factor differs less with values between 0.43 and 0.46, but, due to the large differences in stiffness, the E·m varied from 60 GPa in the lower and 100 GPa in the upper region. The simulation revealed, in accordance with the E·m model, locally high strains without plasticity in the regions of low local stiffness [19,20,28]. Moreover, the largely different properties of the adjacent grains cause high normal stress as well as high resolved shear stress that caused the intercrystalline failure of sample 2 [8,9,12,17,18].

4. Summary and Conclusions

The fatigue behaviour of the nickel-based superalloy Inconel 617 has been investigated by the cyclic tensile loading of thin samples with an average grain size of ~450 µm in an electro dynamic testing device with a frequency of 20 Hz up to the regime of high-cycle fatigue. EBSD measurements have been performed in the initial state and after fatigue failure. The plastic deformation affected the quality of the surface-sensitive EBSD measurements. Therefore, sufficiently accurate measurements were performed for stress amplitudes of ~100 MPa that result in maximum strains of 0.3% close to the elastic limit, resulting in a sufficiently accurate indication of the texture that allowed for retracing the locations of failure. Sample 1 showed transcrystalline failure and sample 2 showed intercrystalline failure, consistent with previous investigations on the fatigue behaviour of Inconel 617 [29]. Both samples have been investigated in detail considering the texture and associated mechanical properties or mechanical behaviour under load, respectively. Despite locally different mechanical properties and observed fracture types, both samples showed a failure behaviour consist with the E·m theory [6,8,12,17,18]. However, it is noticeable that sample 1 showed transcrystalline failure due to the properties of the actual grain in which the fatigue crack initiated, whereas sample 2 showed intercrystalline failure due to the complex relation of the adjacent grains with largely different orientations and mechanical properties, respectively. In previous work on the quasistatic deformation behaviour of the same material, the area of rupture was clearly separated from the other regions, showing higher local stresses and a localised onset of plastic strain in the simulations [21]. For lower deformation during fatigue testing close to the elastic–plastic regime, the relations were less explicit. The grains, which eventually failed in the load cycle regime of 108 cycles, showed conditions that have been observed at many other locations in the scope of these investigations. Additionally, the quasi-two-dimensional approach was only roughly fulfilled in these experiments, and it is possible that the microstructure below the material surface affected the fatigue behaviour, hidden from the EBSD measurements. Therefore, the parameters considered in this work may not be fully sufficient to explicitly explain the reason for the failure in these certain grains. However, the result of this work confirmed the widely spread theories on the correspondence between mechanical properties, the texture, and the reactions on loading and showed the processing of real EBSD data sets to an FE model to calculate the materials reactions, confirming the results of the numerous previous works on artificial samples.

Author Contributions

Conception and planning of the work that led to this manuscript or acquisition: M.L. and T.B.; execution of the experiments: M.L.; analysis and interpretation of the data: M.L. and T.B.; drafting of this manuscript: M.L.; critical revision of this manuscript: T.B.; and approval of the final submitted version of the manuscript: M.L. and T.B. All authors have read and agreed to the published version of the manuscript.

Funding

This research has been funded by the German Research Foundation (DFG) within the framework of the project 427779577: “Analyse des Anisotropieeinflusses auf quasistatische und zyklische Verformungsprozesse in Nickellegierungen durch Kombination von FEM Methoden mit variationeller Bildverarbeitung”.

Data Availability Statement

The data sets used and analysed during the current study are available from the corresponding author on reasonable request.

Acknowledgments

We thank our colleagues Anna Julia Raupach (RPTU Kaiserslautern-Landau) for her patience during the challenging preparation of the EBSD samples and Shirin Falakboland (RPTU Kaiserslautern-Landau) for supporting the fatigue experiments. Gratitude is also expressed to Philipp Lion (HYDAC Technology GmbH) and Oliver Jordan (RPTU Kaiserslautern-Landau).

Conflicts of Interest

The authors declare no conflict of interest.

References

  1. Reed, R.C. The Superalloys: Fundamentals and Applications, 1st ed.; Cambridge Univ. Press: Cambridge, UK, 2008. [Google Scholar]
  2. Smith, G.D.; Yates, D.H. Volume 5: Manufacturing Materials and Metallurgy; Ceramics; Structures and Dynamics; Controls, Diagnostics and Instrumentation; Education; IGTI Scholar Award; General; American Society of Mechanical Engineers: New York, NY, USA, 1991. [Google Scholar] [CrossRef]
  3. Ma, D. Novel casting processes for single-crystal turbine blades of superalloys. Front. Mech. Eng. 2018, 13, 3–16. [Google Scholar] [CrossRef]
  4. Perrut, M.; Caron, P.; Thomas, M.; Couret, A. High temperature materials for aerospace applications: Ni-based superalloys and γ-TiAl alloys. Comptes Rendus. Phys. 2018, 19, 657–671. [Google Scholar] [CrossRef]
  5. Zhang, X.; Oskay, C. Polycrystal plasticity modeling of nickel-based superalloy IN 617 subjected to cyclic loading at high temperature. Model. Simul. Mater. Sci. Eng. 2016, 24, 055009. [Google Scholar] [CrossRef]
  6. Engel, B.; Beck, T.; Moch, N.; Gottschalk, H.; Schmitz, S. Effect of local anisotropy on fatigue crack initiation in a coarse grained nickel-base superalloy. MATEC Web Conf. 2018, 105, 04004. [Google Scholar] [CrossRef]
  7. Schmitz, S.; Seibel, T.; Beck, T.; Rollmann, G.; Krause, R.; Gottschalk, H. A Probabilistic Model for LCF. arXiv 2013, arXiv:1308.5842. [Google Scholar] [CrossRef]
  8. Gottschalk, H.; Schmitz, S.; Seibel, T.; Rollmann, G.; Krause, R.; Beck, T. Probabilistic Schmid factors and scatter of low cycle fatigue (LCF) life. Mat.-Wiss. U. Werkstofftech. 2015, 46, 156–164. [Google Scholar] [CrossRef]
  9. Engel, B.; Mäde, L.; Lion, P.; Moch, N.; Gottschalk, H.; Beck, T. Probabilistic Modeling of Slip System-Based Shear Stresses and Fatigue Behavior of Coarse-Grained Ni-Base Superalloy Considering Local Grain Anisotropy and Grain Orientation. Metals 2019, 9, 813. [Google Scholar] [CrossRef]
  10. Mäde, L.; Schmitz, S.; Gottschalk, H.; Beck, T. Combined notch and size effect modeling in a local probabilistic approach for LCF. Comput. Mater. Sci. 2018, 142, 377–388. [Google Scholar] [CrossRef]
  11. Engel, B.; Huth, M.; Hyde, C. Numerical Investigation into the Influence of Grain Orientation Distribution on the Local and Global Elastic-Plastic Behaviour of Polycrystalline Nickel-Based Superalloy INC-738 LC. Crystals 2022, 12, 100. [Google Scholar] [CrossRef]
  12. Bettge, D.; Österle, W. “Cube slip” in near-[111] oriented specimens of a single-crystal nickel-base superalloy. Scr. Mater. 1999, 40, 389–395. [Google Scholar] [CrossRef]
  13. Stinville, J.C.; Echlin, M.P.; Texier, D.; Bridier, F.; Bocher, P.; Pollock, T.M. Sub-Grain Scale Digital Image Correlation by Electron Microscopy for Polycrystalline Materials during Elastic and Plastic Deformation. Exp. Mech. 2016, 56, 197–216. [Google Scholar] [CrossRef]
  14. Charpagne, M.A.; Hestroffer, J.M.; Polonsky, A.T.; Echlin, M.P.; Texier, D.; Valle, V.; Beyerlein, I.J.; Pollock, T.M.; Stinville, J.C. Slip localization in Inconel 718: A three-dimensional and statistical perspective. Acta Mater. 2021, 215, 117037. [Google Scholar] [CrossRef]
  15. Stinville, J.C.; Echlin, M.P.; Callahan, P.G.; Miller, V.M.; Texier, D.; Bridier, F.; Bocher, P.; Pollock, T.M. Measurement of Strain Localization Resulting from Monotonic and Cyclic Loading at 650 °C in Nickel Base Superalloys. Exp. Mech. 2017, 57, 1289–1309. [Google Scholar] [CrossRef]
  16. Gräf, M.; Neumayer, S.; Hielscher, R.; Steidl, G.; Liesegang, M.; Beck, T. An Image Registration Model in Electron Backscatter Diffraction. SIAM J. Imaging Sci. 2022, 15, 228–260. [Google Scholar] [CrossRef]
  17. Engel, B.; Ohneseit, S.; Mäde, L.; Beck, T. Influence of Grain Orientation Distribution on the High Temperature Fatigue Behaviour of Notched Specimen Made of Polycrystalline Nickel-Base Superalloy. Metals 2021, 11, 731. [Google Scholar] [CrossRef]
  18. Schmidt, E.; Boas, W.; Hughes, F.A. Plasticity of Crystals. J. R. Aeronaut. Soc. 1950, 54, 718–719. [Google Scholar] [CrossRef]
  19. Ahluwalia, R.; Lookman, T.; Saxena, A. Elastic deformation of polycrystals. Phys. Rev. Lett. 2003, 91, 055501. [Google Scholar] [CrossRef]
  20. Gonzalez, M.; Axisa, F.; Bulcke, M.V.; Brosteaux, D.; Vandevelde, B.; Vanfleteren, J. Design of metal interconnects for stretchable electronic circuits. Microelectron. Reliab. 2008, 48, 825–832. [Google Scholar] [CrossRef]
  21. Liesegang, M.; Lion, P.; Beck, T.; Gräf, M.; Steidl, G. Investigation of the tensile deformation behaviour in Ni-based superalloy inconel alloy 617 using EBSD-based finite element simulations and optical flow method. J. Mater. Sci. 2023, 58, 8990–9005. [Google Scholar] [CrossRef]
  22. Aurenhammer, F. Voronoi diagrams—A survey of a fundamental geometric data structure. ACM Comput. Surv. 1991, 23, 345–405. [Google Scholar] [CrossRef]
  23. Special Metals (2023) INCONEL® Alloy 617 Data Sheet. Available online: https://www.specialmetals.com/documents/technical-bulletins/inconel/inconel-alloy-617.pdf (accessed on 7 April 2024).
  24. Skelton, R.P.; Gandy, D. Creep—Fatigue damage accumulation and interaction diagram based on metallographic interpretation of mechanisms. Mater. High Temp. 2008, 23, 345–405. [Google Scholar] [CrossRef]
  25. Manonukul, A. Multiaxial creep and cyclic plasticity in nickel-base superalloy C263. Int. J. Plast. 2005, 21, 1–20. [Google Scholar] [CrossRef]
  26. Bachmann, F.; Hielscher, R.; Schaeben, H. Grain detection from 2d and 3d EBSD data--specification of the MTEX algorithm. Ultramicroscopy 2011, 111, 1720–1733. [Google Scholar] [CrossRef]
  27. Bayerlein, U.; Sockel, H.G. Determination of single crystal elastic constants from de- and dr-Ni-based superalloys by a new regression method between 20 °C and 1200 °C. Superalloys 1992, 10, 695–704. [Google Scholar]
  28. Chou, P.C.; Pagano, N.J. Elasticity: Tensor, Dyadic and Ingenieering Approaches; Dover Publications Inc.: New York, NY, USA, 1992. [Google Scholar]
  29. Liang, Z.; Liu, A.; Wang, X.S.; Zhang, N.Q. Experimental and modeling study on small fatigue crack initiation and propagation behavior of Inconel 617. Int. J. Fatigue 2022, 164, 107158. [Google Scholar] [CrossRef]
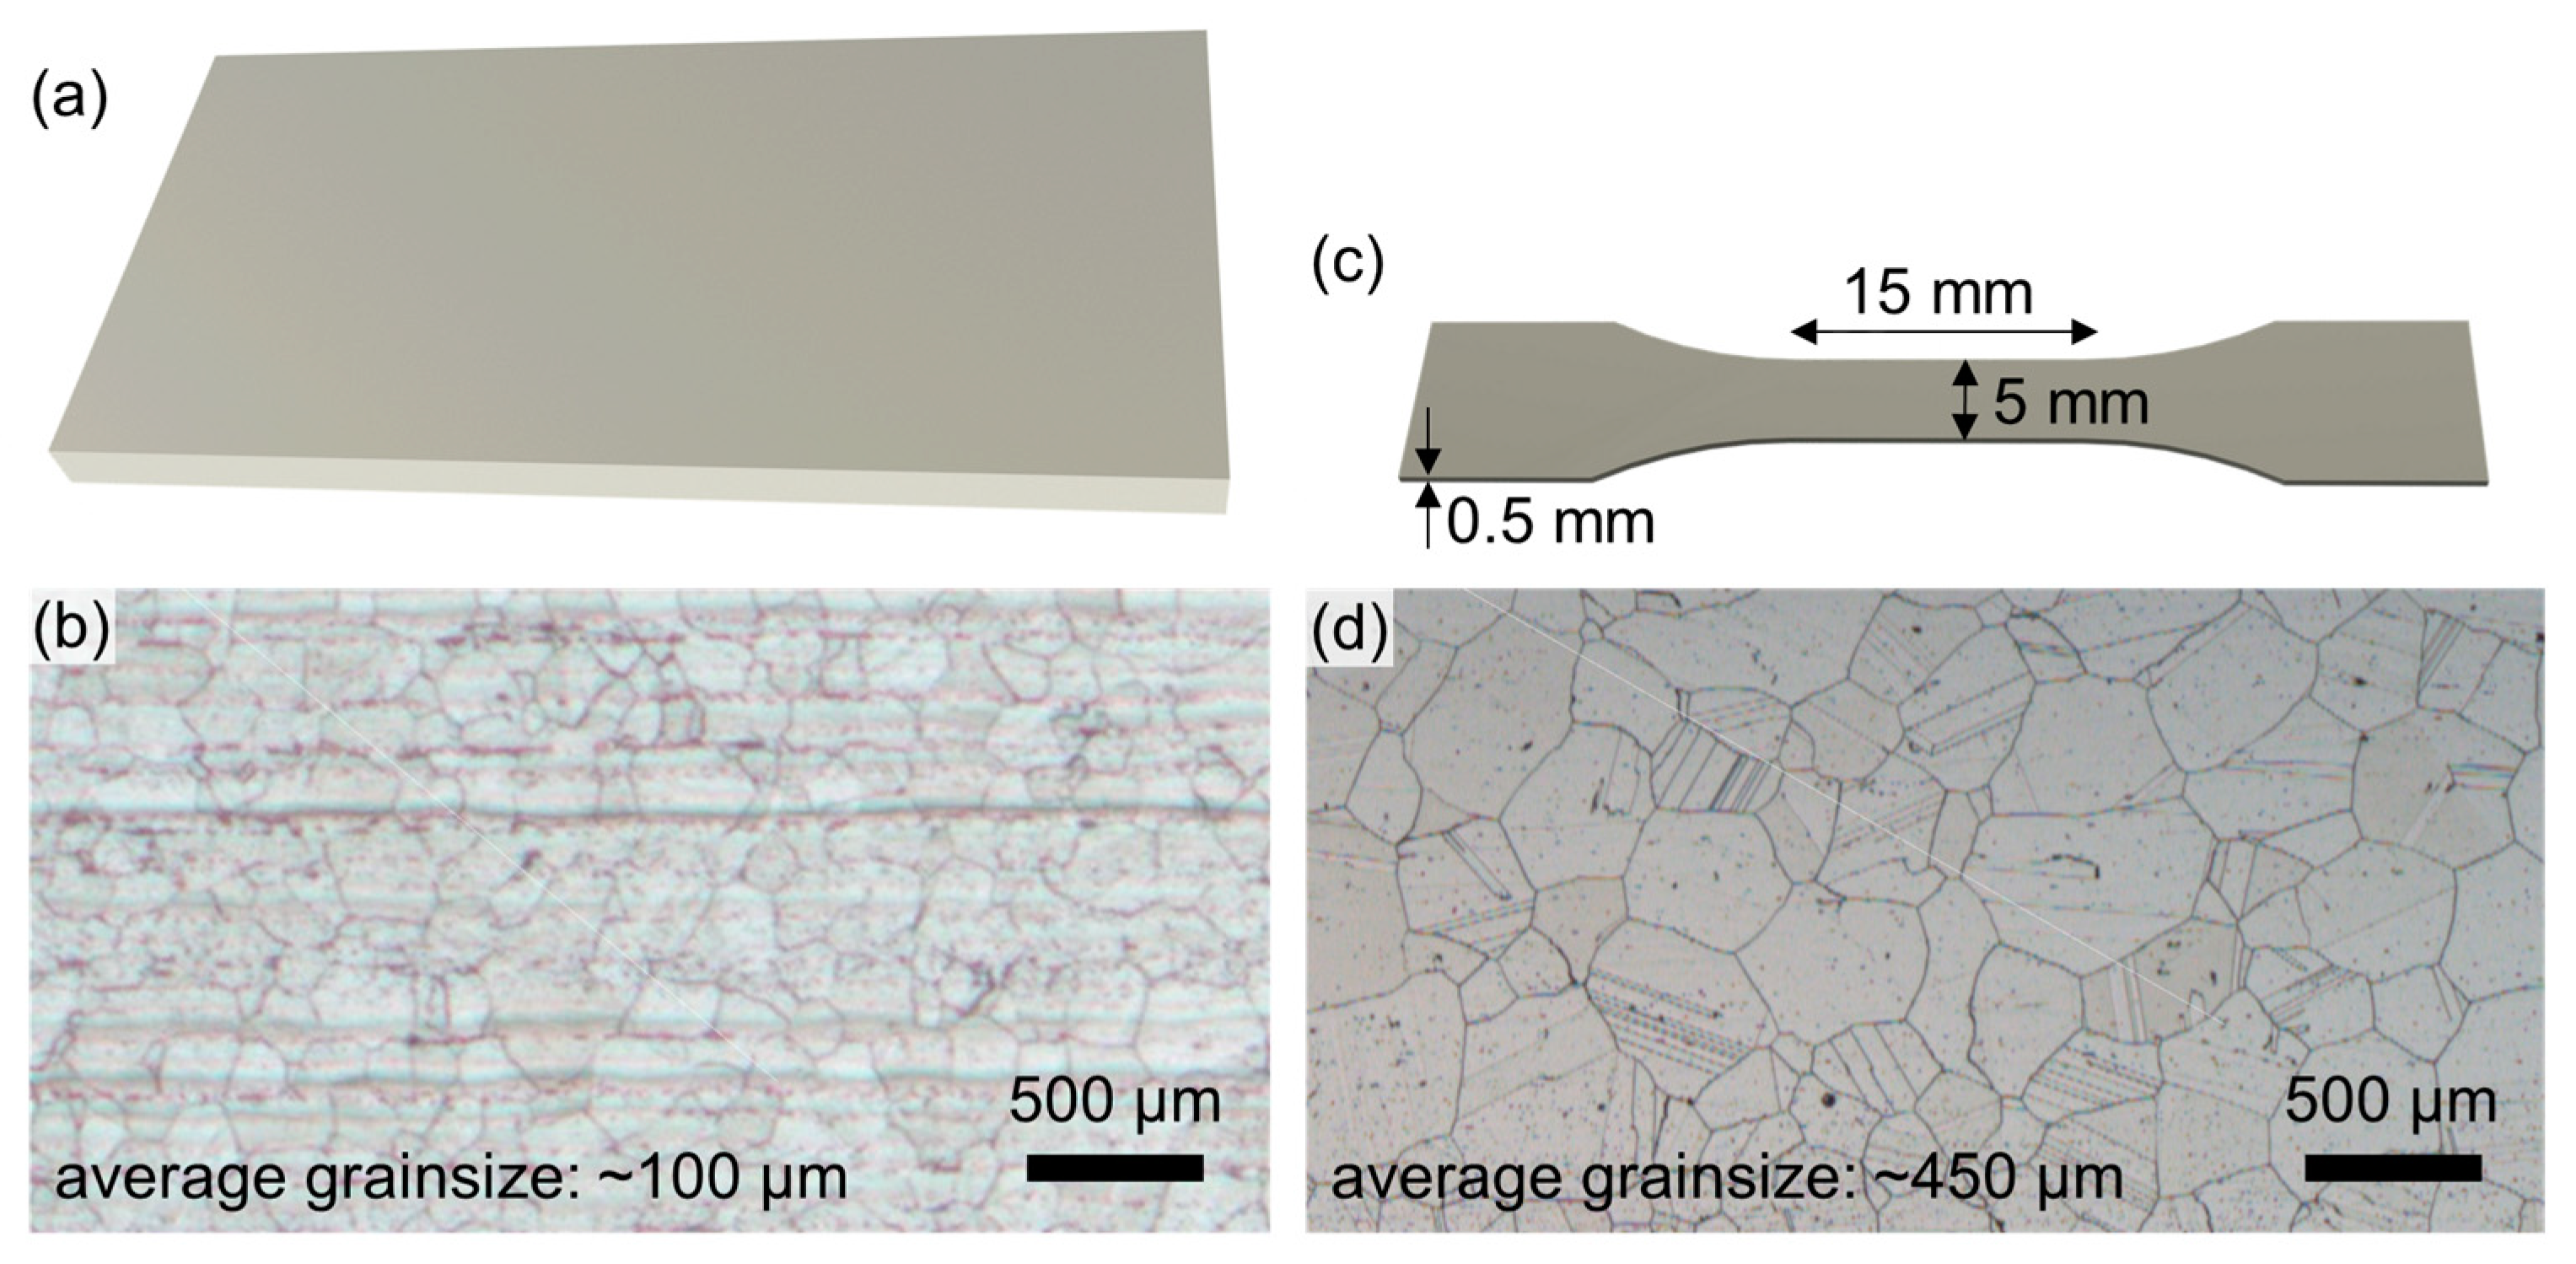
Figure 1. Characteristics of the samples showing (a) the initial sheet, (b) the initial microstructure, (c) the finally milled sample geometry, and (d) the final microstructure after thermal treatment and milling.
Crystals 14 00356 g001
Figure 2. Clamped sample during fatigue testing.
Crystals 14 00356 g002
Figure 3. The FE model of the sample gauge with an indicated direction of static displacement of 45 µm, equivalent to 0.3% strain, by arrows at the sides of the sample and a magnified grain showing the mesh.
Crystals 14 00356 g003
Figure 4. S-N behaviour of the Inconel 617 samples, including the number of cycles to failure N f on the x-axis and the stress amplitude σ a on the y-axis (a), and EBSD data from sample 1 (b) and sample 2 (c) before fatigue testing.
Crystals 14 00356 g004
Figure 5. Analysis of the fatigue failure of sample 1 (1a1c) and sample 2 (2a2c): view on the fracture surface (a,c) and on the sample surface (b) supported by EBSD measurements (b); the dashed lines in (a,b) mark the transition between the areas of fatigue failure and final rupture while the dashed lines in (c) highlight the area of crack initiation.
Crystals 14 00356 g005
Figure 6. Sections of the measurement gauge of sample 1 (1) and sample (2): original EBSD data (a), Young’s modulus E (b), Schmid factor m (c) and E·m (d), local simulated strain (e), plastic strain (f), normal stress (g), and resolved shear stress (h).
Crystals 14 00356 g006
Table 1. Chemical composition of Inconel 617 in wt% [23].
NiCrCoMoFeAlTiCMnSSiCu
min.44.5020.0010.008.00 0.80 0.05
max. 24.0015.0010.003.001.500.600.151.000.0151.000.50
Table 2. Material properties used in the FE model.
Density [23]8.5 t/m³
Stiffness matrix in GPa [27] 280 191 191 191 280 191 191 191 280 127 127 127
Relation between stress and plastic strain [21]Yield stress in MPaPlastic strain in %
2000
4000.53
4702.0
5003.3
Disclaimer/Publisher’s Note: The statements, opinions and data contained in all publications are solely those of the individual author(s) and contributor(s) and not of MDPI and/or the editor(s). MDPI and/or the editor(s) disclaim responsibility for any injury to people or property resulting from any ideas, methods, instructions or products referred to in the content.