Article

Effect of Annealing on the Microstructure, Texture, and Properties of Cold-Rolled Ti50Ni47Fe3 Shape Memory Alloy Sheets

1
State Key Laboratory of Nonferrous Metals and Processes, China GRINM Group Co., Ltd., Beijing 100088, China
2
GRIMAT Engineering Institute Co., Ltd., Beijing 101407, China
3
General Research Institute for Nonferrous Metals, Beijing 100088, China
4
GRINM (Guangdong) Institute for Advanced Materials and Technology, Foshan 528051, China
*
Authors to whom correspondence should be addressed.
Crystals 2024, 14(4), 360; https://doi.org/10.3390/cryst14040360
Submission received: 11 March 2024 / Revised: 4 April 2024 / Accepted: 9 April 2024 / Published: 11 April 2024
(This article belongs to the Section Crystalline Metals and Alloys)

Abstract

:
A systematic study was conducted on the impact of annealing treatments on the microstructure and properties of cold-rolled Ti50Ni47Fe3 alloys using optical microscopy, scanning electron microscopy, electron backscattered diffraction, and an electronic universal testing machine. It was found that, during low-temperature annealing (400 °C and 500 °C), the annealing time had no significant effect on the microstructure or properties of the Ti50Ni47Fe3 alloy. Only elongation (δ) increased with the increase in the annealing time, and the grain orientation of the Ti50Ni47Fe3 alloy was <111>//RD (rolling direction). When annealing at medium–high temperature (600 °C), as the annealing time increased, recrystallization and grain growth processes occurred, resulting in a continuous decrease in strength and an increase in δ. Meanwhile, it was found that the grain orientation of the cold-rolled Ti50Ni47Fe3 alloy changed from <111>//RD during the recovery and recrystallization processes to <101>//RD after the grain growth process. The orientation distribution function cross-section φ2 = 45° results indicate that the texture was mainly distributed along the γ orientation line (φ1 = 0~90°, Φ = 54.7°, φ2 = 45°). When annealed at 400 °C and 500 °C, the texture of the Ti50Ni47Fe3 alloys was (111)[uvw]. When the annealing treatment was 600 °C for 120 min, a (110)[uvw] texture occurred. Additionally, ductile fracture occurred in all specimens, and the crack origin was located on one side of the fracture surface, with obvious “Y”-shaped propagation. This article studied annealing treatments of cold-rolled Ti50Ni47Fe3 alloys, providing corresponding theoretical guidance for subsequent production applications.

1. Introduction

Shape memory alloys (SMAs) are types of alloys with shape memory effects (SMEs) and superelasticity (SE), achieved through martensitic transformation and its reverse transformation [1,2,3]. TiNi-based shape memory alloys have excellent SMEs and SE, as well as good mechanical and physical properties, making them the most widely used SMAs [4,5,6,7], utilized in the aerospace industry, electronics, mechanical control mechanisms, and biomedical materials [4,8,9].
The assembly and application of some SMA functional devices used in the aviation field, such as aircraft hydraulic pipeline fittings and low-temperature temperature control valves, need to be carried out at low temperatures, so TiNi SMAs with a low phase transformation temperature are required [10]. Adding elements such as Fe [11], Nb [12,13], Cu [14], Hf [15], and Zr [16] to TiNi alloys can change their phase transformation temperature, microstructure, and properties [17]. Among them, the Fe element can replace Ni in TiNi alloys, resulting in lattice distortion and atomic relaxation. While maintaining the excellent SMEs and mechanical properties of TiNi SMAs, the Fe element significantly decreases the martensitic transformation temperature [18], increases transformation hysteresis, improves transformation stability, and avoids the phenomenon of softening caused by stress-induced martensitic transformation at low temperatures [19,20]. Therefore, TiNiFe alloys have broad application prospects as low-temperature connectors in aerospace and other fields.
Deformation processing is a commonly used method to improve the properties of TiNiFe alloys. At present, research on the processing behavior and microstructure properties of TiNiFe alloys mainly focuses on hot-worked bars. Studies have shown that the Fe element content and the hot-working process can refine the grain size of a TiNiFe alloy, improve its room-temperature strength, and have a significant impact on its low-temperature performance [21,22,23,24]. However, the dynamic crystallization behavior during hot working can lead to insufficient deformation stored energy in a TiNiFe alloy [23], resulting in a decrease in its low-temperature performance. Cold working is also a commonly used material processing technology. After cold working, the alloy grains are more severely broken [25], and a large number of defects such as dislocations are introduced, which greatly improves the room-temperature strength and low-temperature recovery performance of the alloy [26]. However, a TiNiFe alloy is an insoluble strengthening alloy, which is prone to work hardening after cold deformation, resulting in a significant risk of failure during subsequent use and affecting its engineering applications [27,28]. Therefore, improving its microstructure and properties through heat treatment is of great significance [29,30]. At present, there are few reports on the effect of the annealing process on cold-worked TiNiFe alloys.
As an important part of the processing and application of TiNi-based SMAs, different heat treatments have a significant impact on their microstructure and properties. Research has shown that, as the aging temperature increases, the tensile strength of TiNi alloys decreases, while their plasticity increases [31,32,33]. For Ni-rich TiNi alloys, as the aging temperature increases, the transformation process gradually changes from complete austenite to a coexisting state of austenite, martensite, and R phase at room temperature [34]. Moreover, research has shown that annealing temperature also has an important impact on the phase transformation and recovery properties of TiNi-based SMAs. As the annealing temperature increases, the starting and ending temperatures of martensitic transformation in TiNi alloys increase, while the starting and ending temperatures of austenite transformation decrease [35,36]. With an increase in annealing time, the phase transformation temperature of R-B19’ in TiNi alloys increases, and B2–B19’ phase transformation is separated from B2-R transformation [37,38]. Additionally, with an increase in annealing temperature, the recovery property of TiNi alloys decreases [39,40]. Heat treatment affects the second phase in TiNi-based alloys. Under specific annealing treatment, the Ti3Ni4 phase nucleates [41], and the Ti2Ni phase partially dissolves [31]. However, annealing treatment cannot completely remove the second phase in TiNi-based alloys.
In our previous work, the effects of annealing temperature on the microstructure and properties of Ti50Ni47Fe3 alloy were studied [30]. However, after further research, it was found that the annealing time has a more significant impact on the engineering applications of Ti50Ni47Fe3 alloy when annealed at 400 °C, 500 °C, and 600 °C. Therefore, in this study, we focused on the mixed effects of annealing temperature and time on the microstructure, texture, and properties of Ti50Ni47Fe3 alloy.
This study takes cold-rolled Ti50Ni47Fe3 alloy sheets as the research materials, systematically studies the influence of different annealing treatments on the alloy microstructure, texture, and properties. And provides a theoretical basis for the formulation of Ti50Ni47Fe3 alloy heat treatment processes and the promotion of engineering applications.

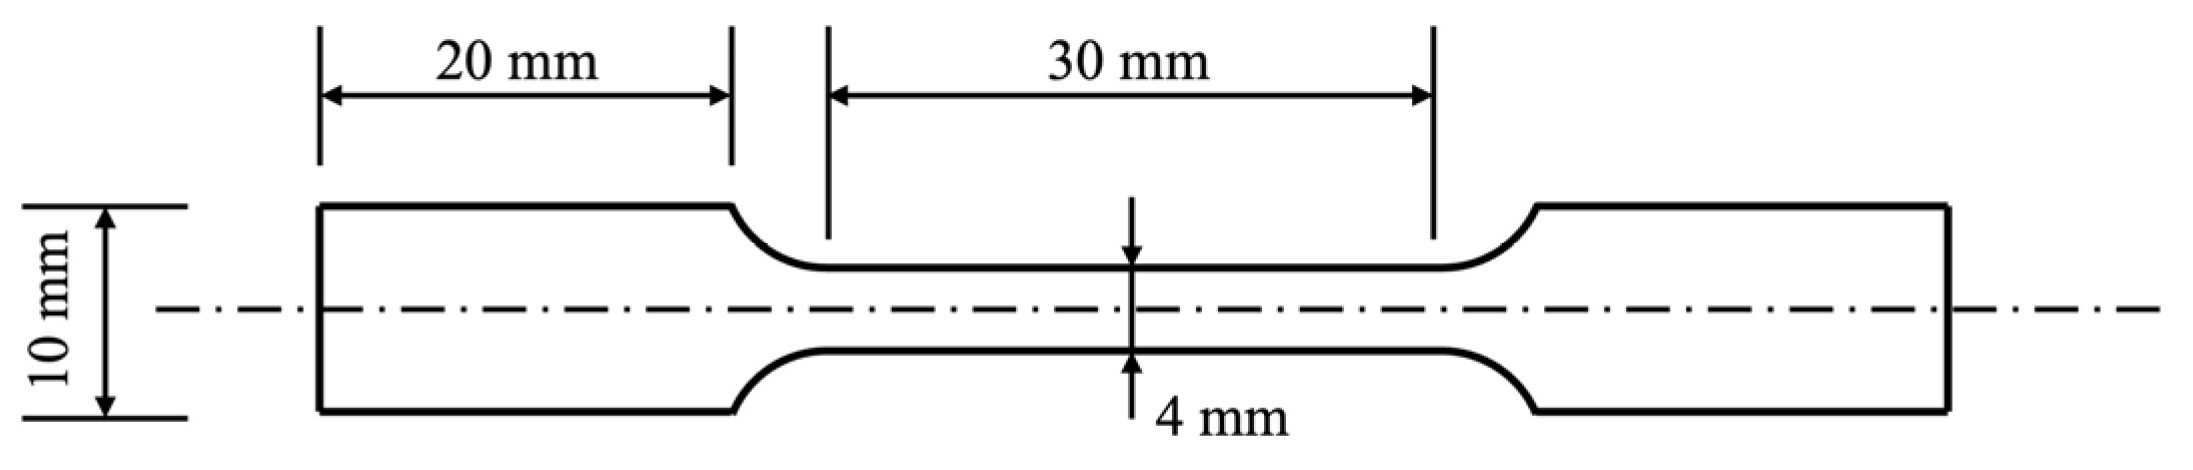
2. Materials and Methods

Vacuum induction melting was used to prepare a Ti50Ni47Fe3 alloy ingot with a diameter of 115 mm. During the vacuum induction melting process, a graphite crucible was used, and the vacuum degree of the induction furnace was maintained at 1 × 10⁻³ Pa. Argon gas was used as the melting protective gas. The weight of the Ti50Ni47Fe3 alloy ingot was 30 kg. After forging and cold rolling, a Ti50Ni47Fe3 alloy sheet with a thickness of 1.1 mm and a cold-rolling deformation of 27% was obtained. The chemical composition of the Ti50Ni47Fe3 alloy is shown in Table 1.
The cold-rolled microstructure of the Ti50Ni47Fe3 alloy sheet is shown in Figure 1, with the microstructure elongated along the rolling direction and obvious grain fragmentation. Different annealing treatments were carried out on the cold-rolled sheets, with annealing temperatures of 400 °C, 500 °C, and 600 °C and holding for 15 min, 30 min, 60 min, 90 min, 120 min, and 300 min, followed by air cooling (AC).
Microstructure, texture, and fracture analyses were carried out using a JEOL JSM-7900F field-emission scanning electron microscope (SEM) (JEOL Ltd., Akishima-shi, Japan) equipped with an electron backscattered diffraction (EBSD) detector and a Zeiss Axiovert 200 MAT optical microscope (OM) (Carl Zeiss, Oberkochen, Germany). The OM and EBSD samples were wire cut, sandpapered, and polished using Struers OP-S (Struers, Copenhagen, Denmark). After that, the OM and SEM samples were etched in a solution of HF:HNO3:H2O = 1:2:10 (volume fraction), and the EBSD samples were electropolished with a solution of HClO4:CH3COOH = 5:95 (vol.%). For the EBSD analysis, the working voltage was 20 kV, and the scanning step was 0.2 μm. Inverse pole figure maps (IPF maps), inverse pole figures (IPFs), pole figures (PFs), orientation distribution functions (ODFs), grain orientation spread maps (GOS maps), and kernel average misorientation maps (KAM maps) were acquired and calculated using a TSL-OIM analysis (EDAX Inc., Mahwah, NJ, USA) after EBSD. IPF maps, IPFs, PFs, and ODFs were used for an orientation analysis. GOS maps were used for recovery, recrystallization, and grain growth analyses, and recrystallization was considered to occur when the GOS was less than 2, recovery was 2 to 7, and the number of deformed grains was 7 or higher. KAM maps and KAM numerical statistical histograms were used for deformation and stress state analyses.
The tensile properties of the Ti50Ni47Fe3 alloy sheets with different annealing treatments were tested using an MTS E45.105 electronic tensile testing machine (MTS, Eden Prairie, MN, USA). Tensile samples were cut along the cold-rolling direction (RD) of the sheet, and the size of the sample is shown in Figure 2. The length of the parallel segment was 30 mm, and the length of the gauge section was 25 mm. The initial tensile rate was 5 × 10⁻⁴ s−1.

3. Results and Discussion

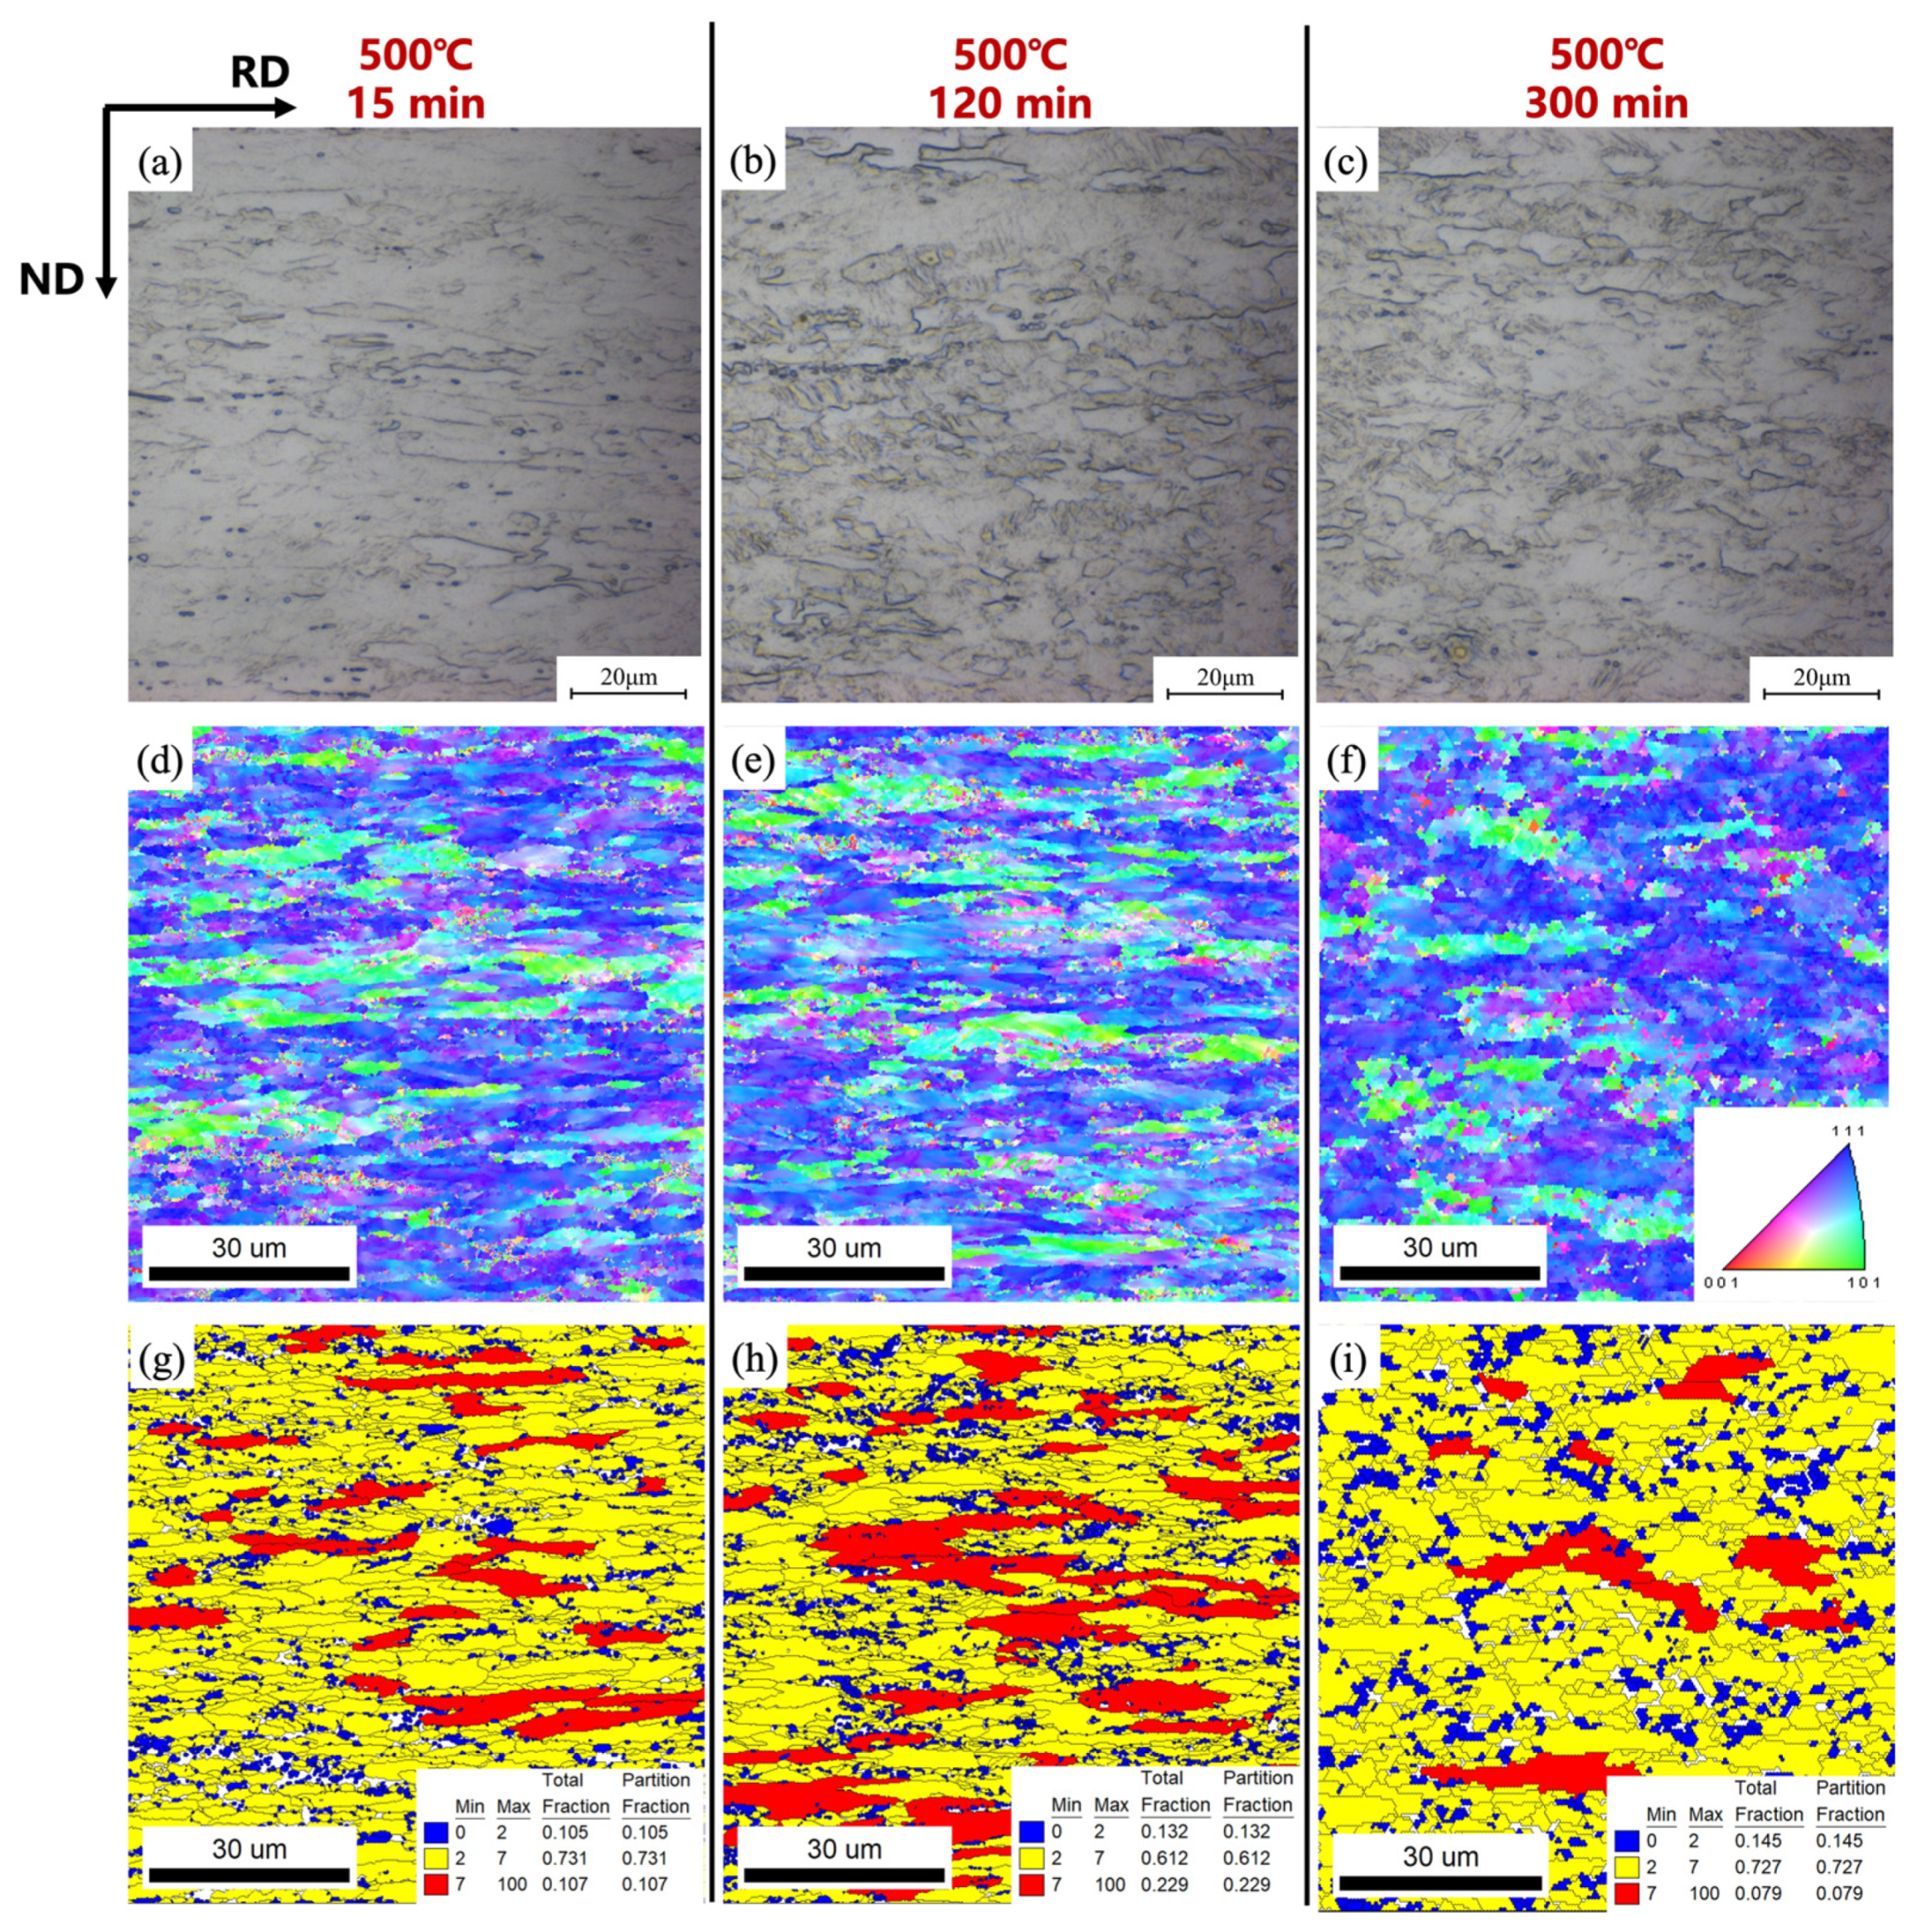
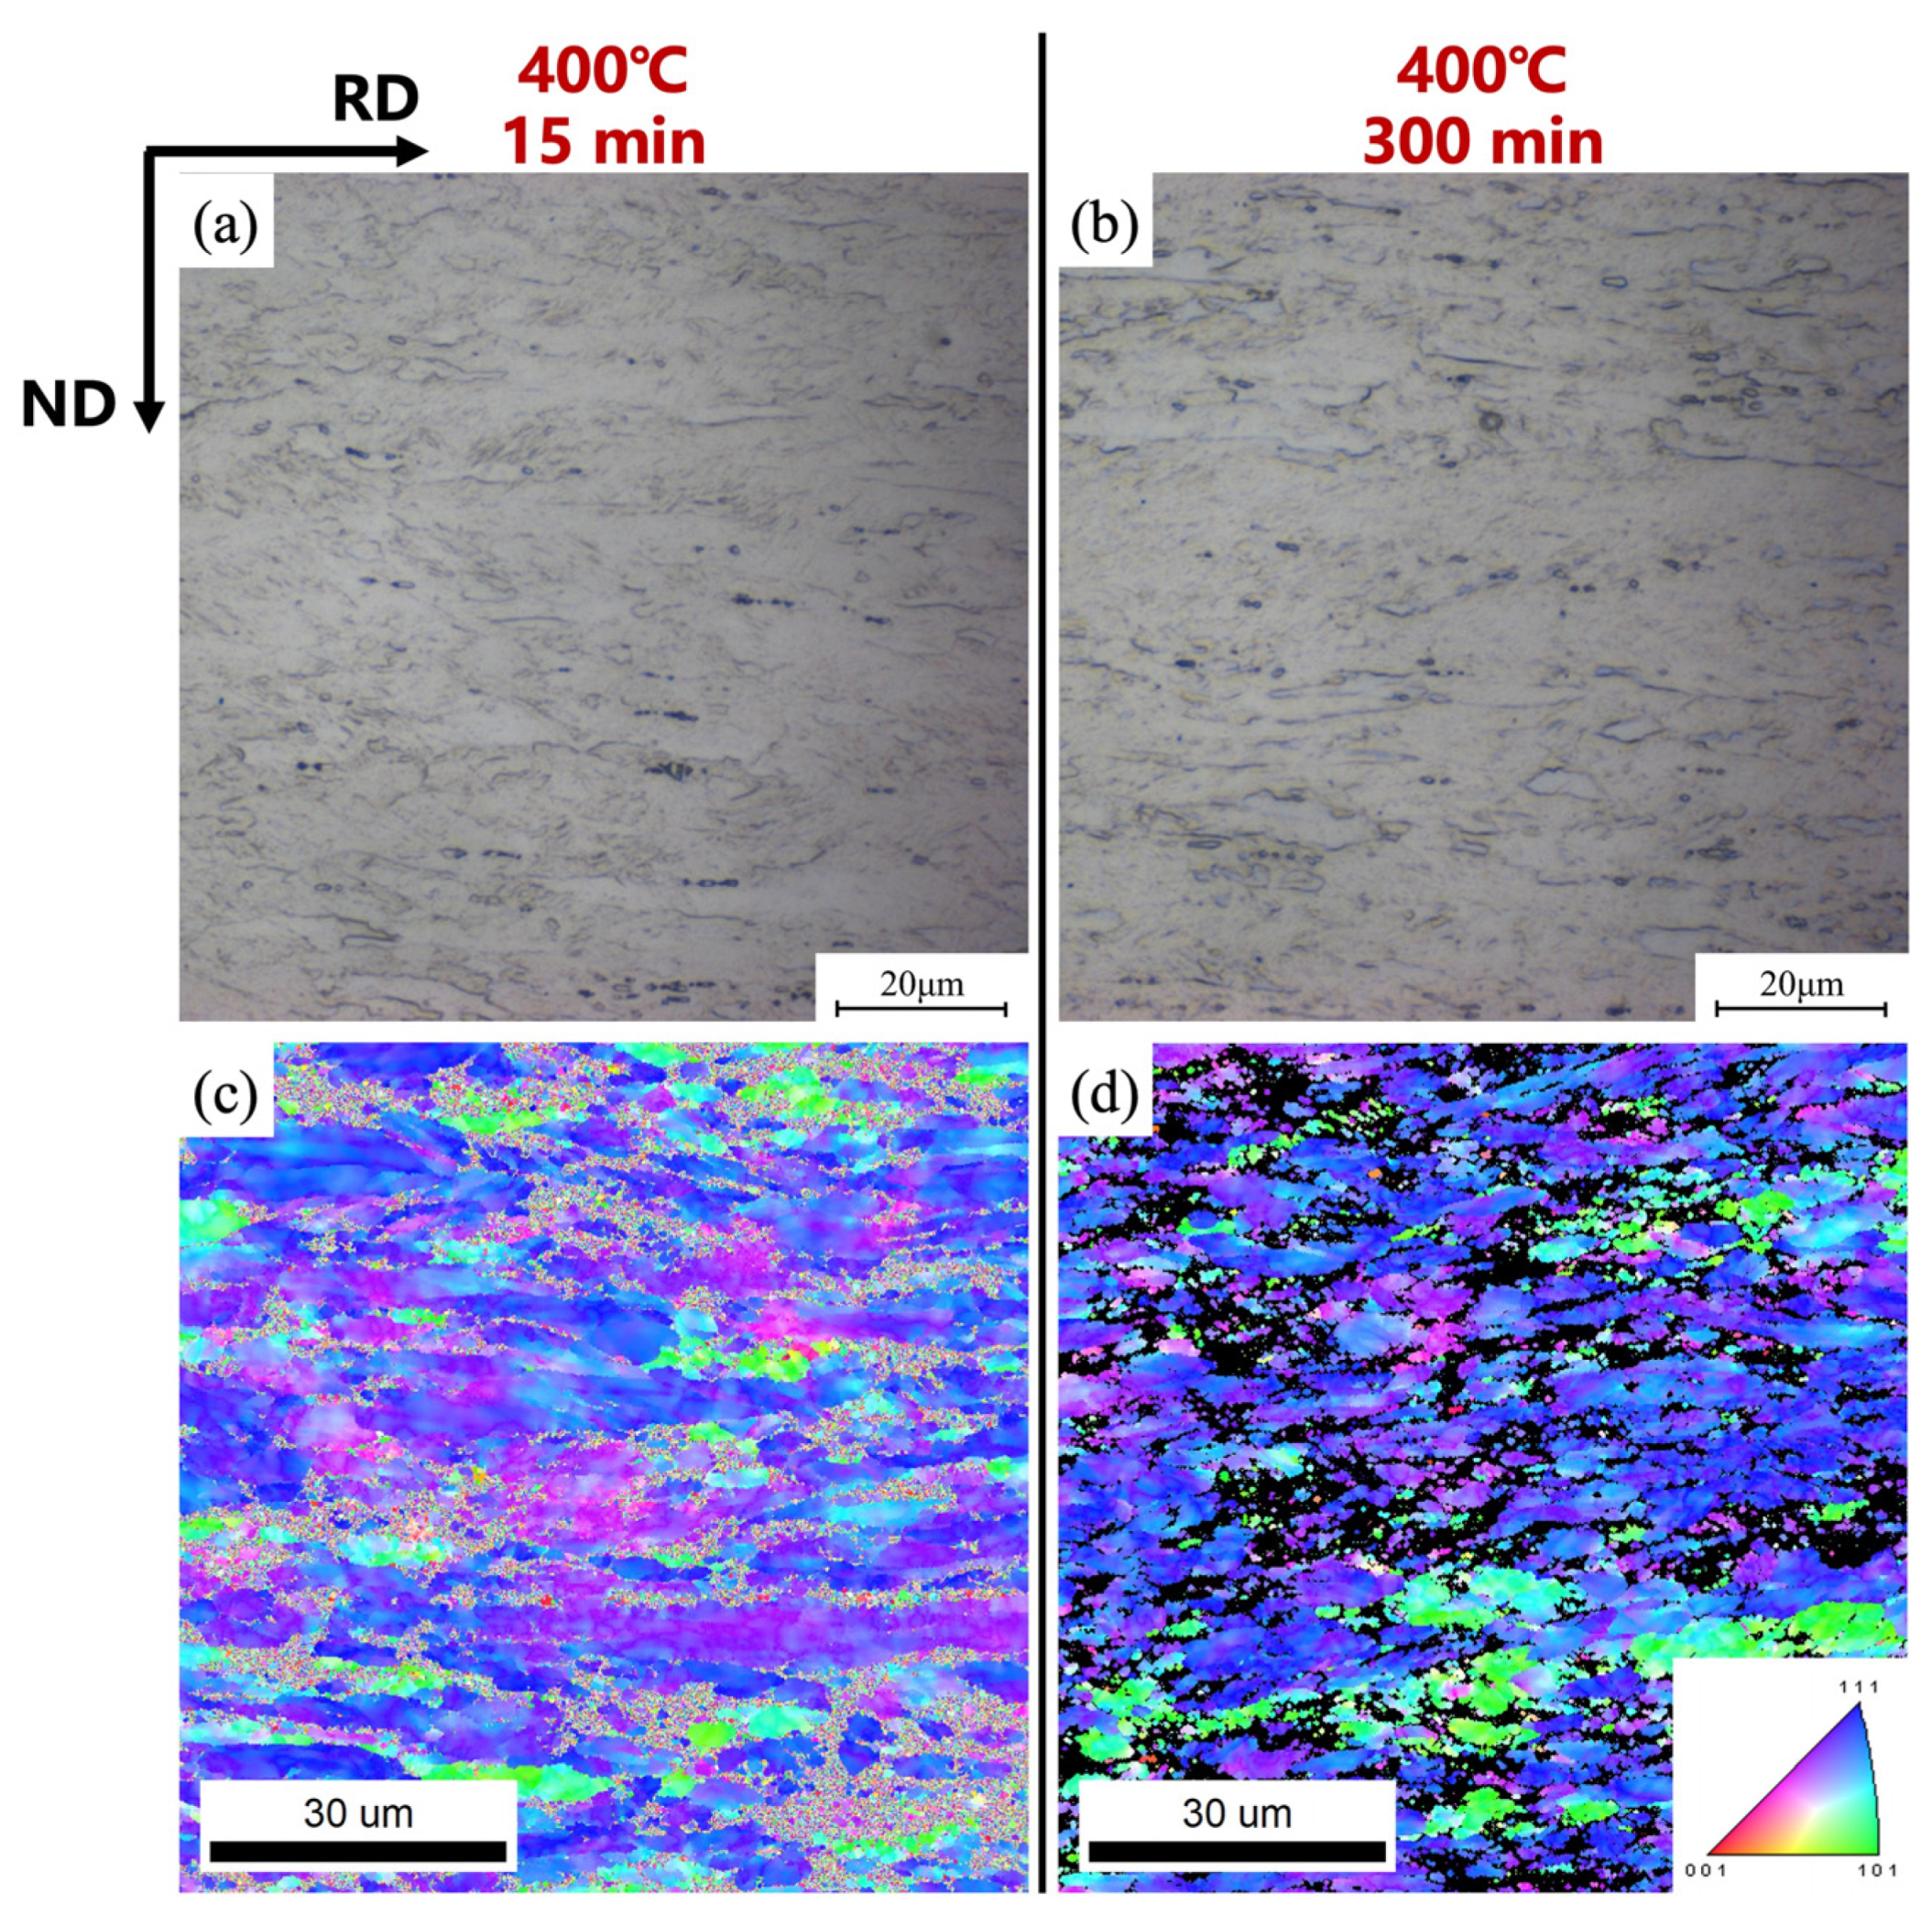
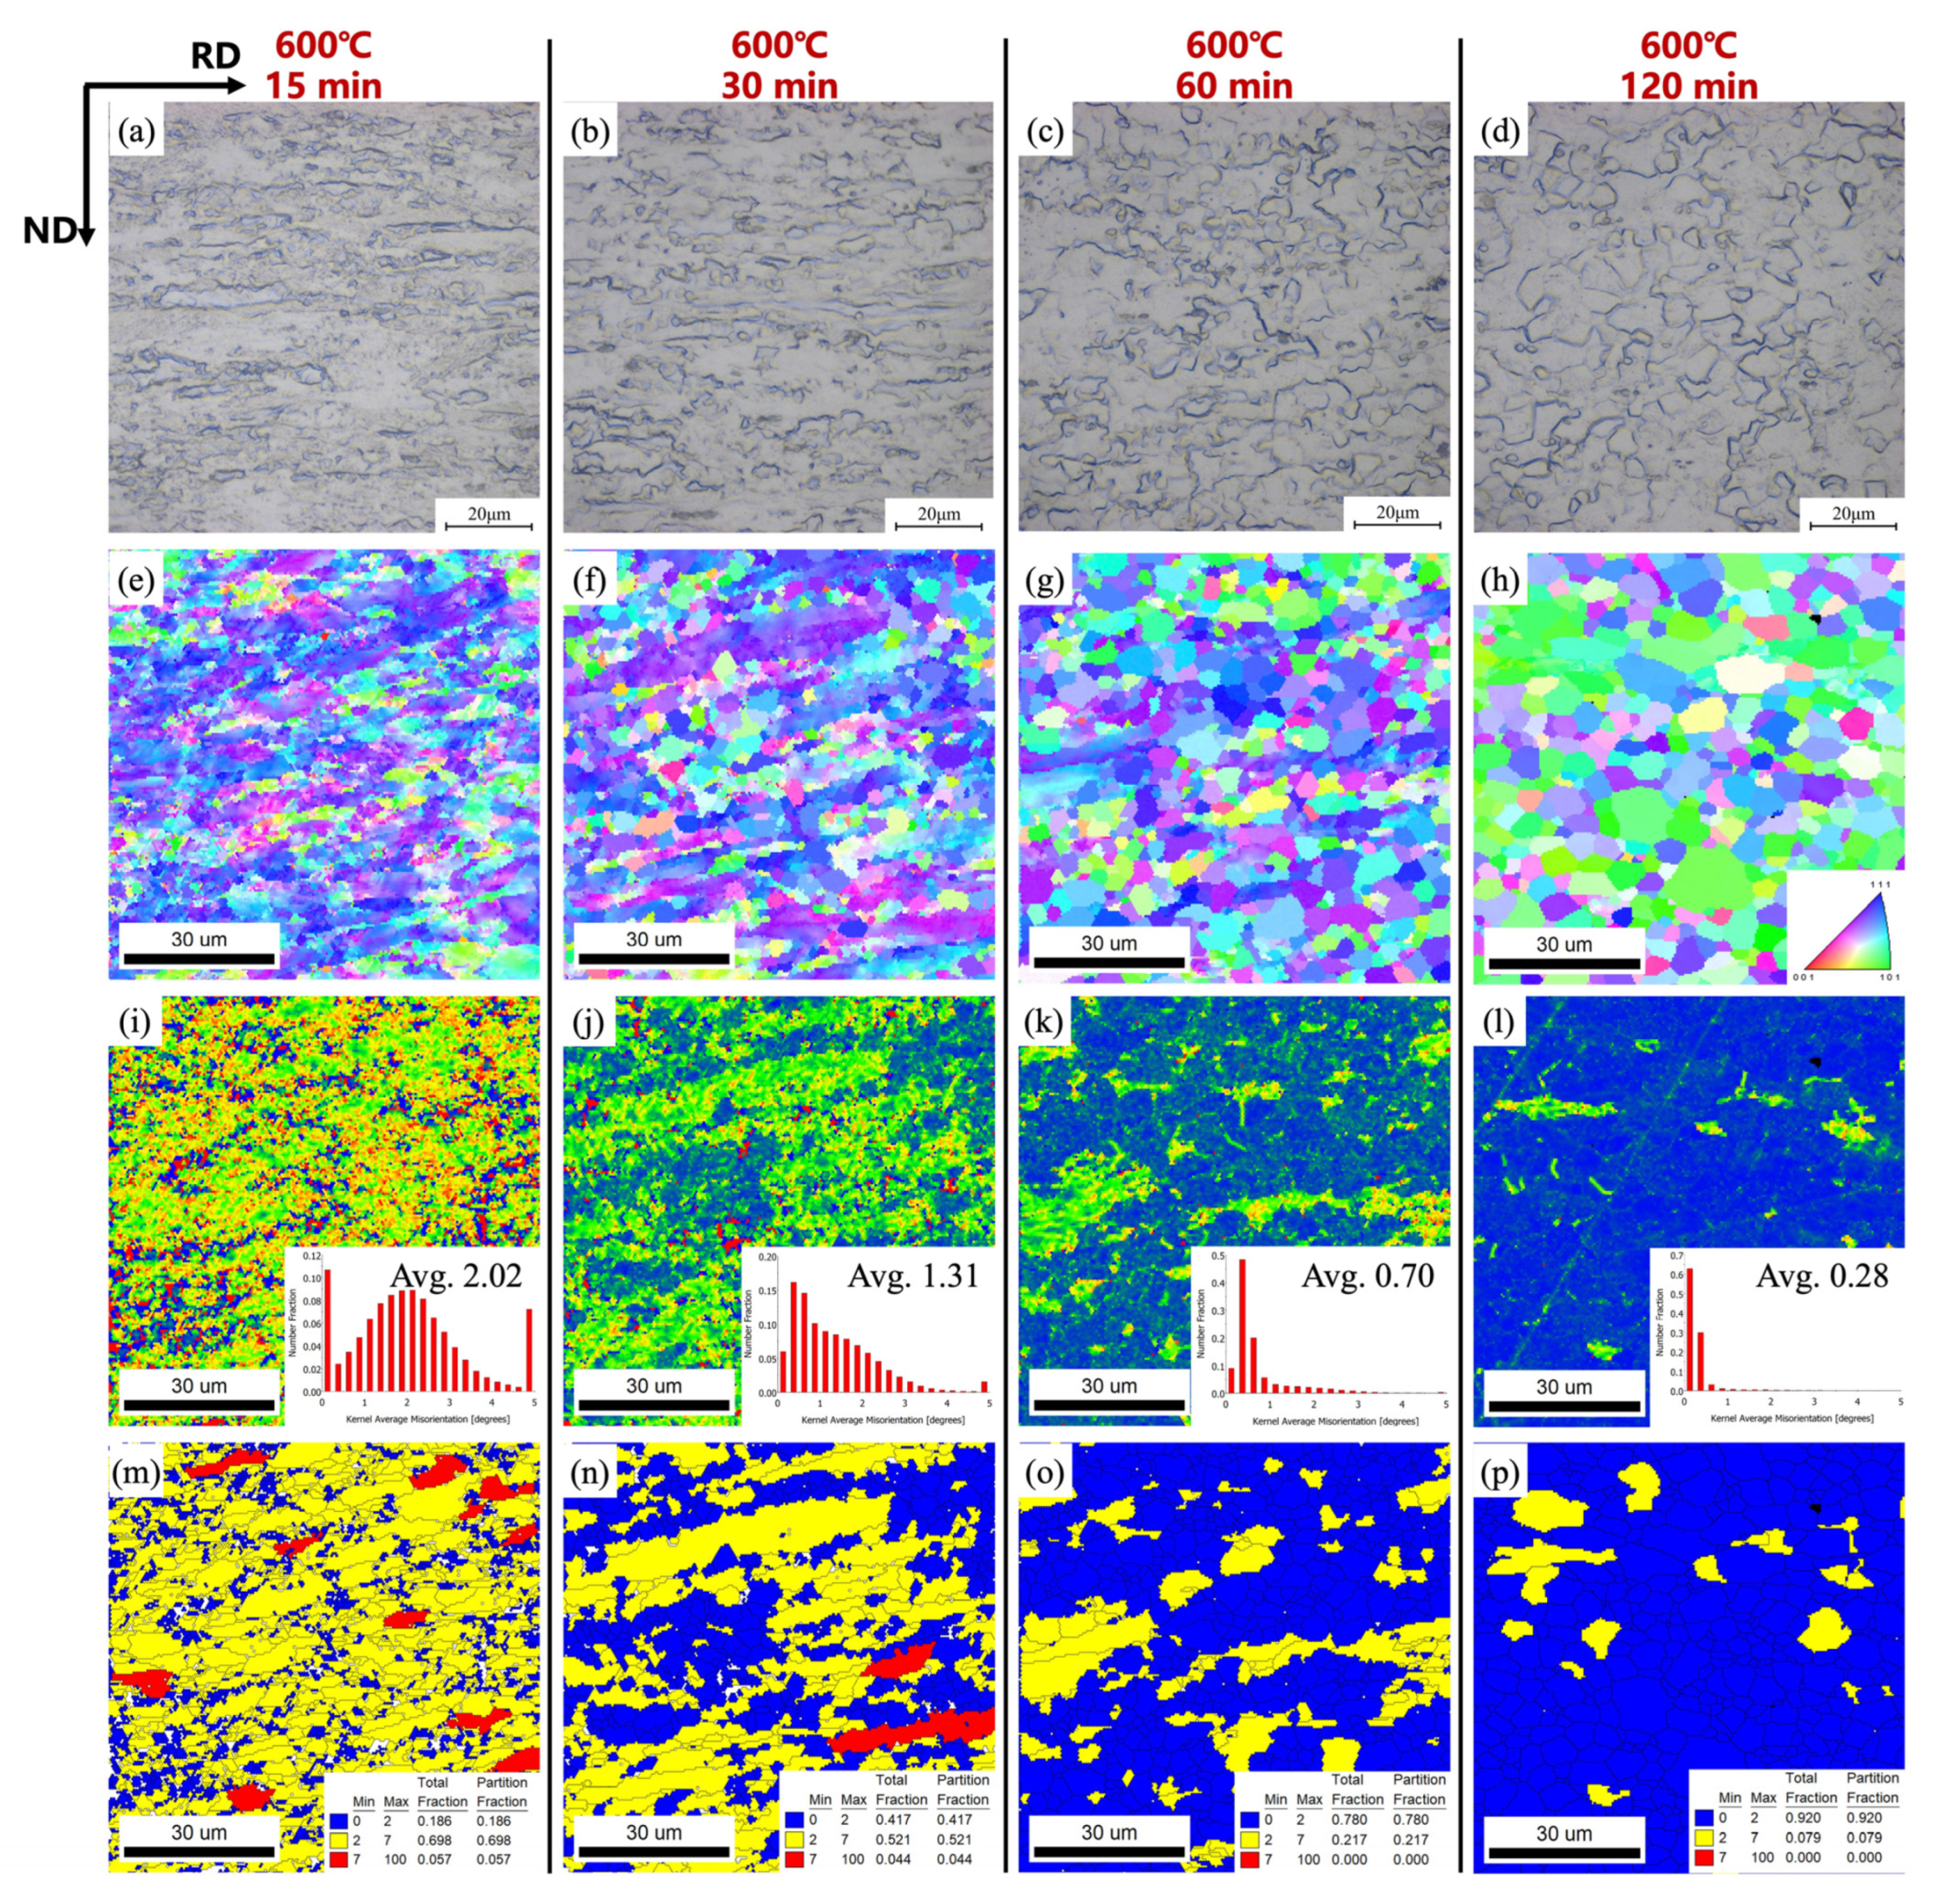
3.1. The Effect of Annealing Treatment on the Microstructure of Ti50Ni47Fe3 Alloy

Figure 3 shows the microstructure analysis of the cold-worked Ti50Ni47Fe3 alloy after annealing at 400 °C for different times. It can be observed that, after annealing at 400 °C, the Ti50Ni47Fe3 alloy still exhibits an elongated microstructure along the RD, and, with the increase in the annealing time, there is no significant change in the microstructure. This is mainly due to the lower annealing temperature, and the alloy is in the early stage of the recovery process without undergoing recrystallization. Therefore, with the increase in the annealing time, the microstructures do not undergo significant changes.
Figure 4 shows the microstructure and grain orientation analyses of the Ti50Ni47Fe3 alloy sheet after annealing at 500 °C for different times. It can be observed that, as the annealing temperature increases to 500 °C, the microstructure significantly changes with the increase in the annealing time. When the annealing time is 15 min, as shown in Figure 4a,d,g, the microstructure of the Ti50Ni47Fe3 alloy elongates along the RD. When the annealing time reaches 120 min, as shown in Figure 4b,e,h, more small equiaxed recrystallized grains can be seen at the grain boundaries. This is because, with the increase in the annealing time, grains with higher deformation stored energy at the grain boundaries preferentially undergo recrystallization, as shown in Figure 4h. When the annealing time reaches 300 min, as shown in Figure 4c,f,i, the stored energy during the rolling of the Ti50Ni47Fe3 alloy sheets further promotes grain recrystallization during the annealing treatment, and the number of recrystallized grains increases. However, due to the low annealing temperature, the recrystallization fraction of the Ti50Ni47Fe3 alloy is low after annealing at 500 °C for different times.
Figure 5 shows the microstructure and EBSD analyses after annealing at 600 °C for different annealing times. Through the microstructure analysis, it can be observed that, during annealing at 600 °C, the Ti50Ni47Fe3 alloy rapidly undergoes three stages, namely, recovery, recrystallization, and grain growth, with the increase in the annealing time, as shown in the OM and GOS maps in Figure 5. When the annealing time is only 15 min, as shown in Figure 5a,e,i,m, the microstructure is mainly characterized by elongated grains along the RD, and the internal stress of the grains is high, with an average KAM value of 2.02. When the annealing time is extended to 30 min, as shown in Figure 5b,n, a small amount of fine equiaxed recrystallized grains appear at the grain boundaries. At this time, the alloy is in the late stage of recovery and the early stage of recrystallization. Due to the increase in heat input, the grains first undergo recrystallization in areas with high deformation stored energy (deformed grain boundaries), while internal stress decreases, with an average KAM value of about 1.31, as shown in Figure 5j. When the annealing time increases to 60 min, the number of recrystallized grains in the Ti50Ni47Fe3 alloy increases sharply, and almost all recrystallization is completed, as shown in Figure 5o. At this time, a large amount of energy stored during rolling is released, and the internal stress is significantly reduced, with the KAM value decreasing to 0.70. As the annealing time further increases to 120 min, the recrystallization process of the Ti50Ni47Fe3 alloy is completely carried out, as shown in the GOS map in Figure 5p, resulting in the devouring of grains and leading to grain growth. At this time, the stored energy is almost completely released, the internal stress decreases to its lowest, and the KAM value is only 0.28, as shown in Figure 5l.

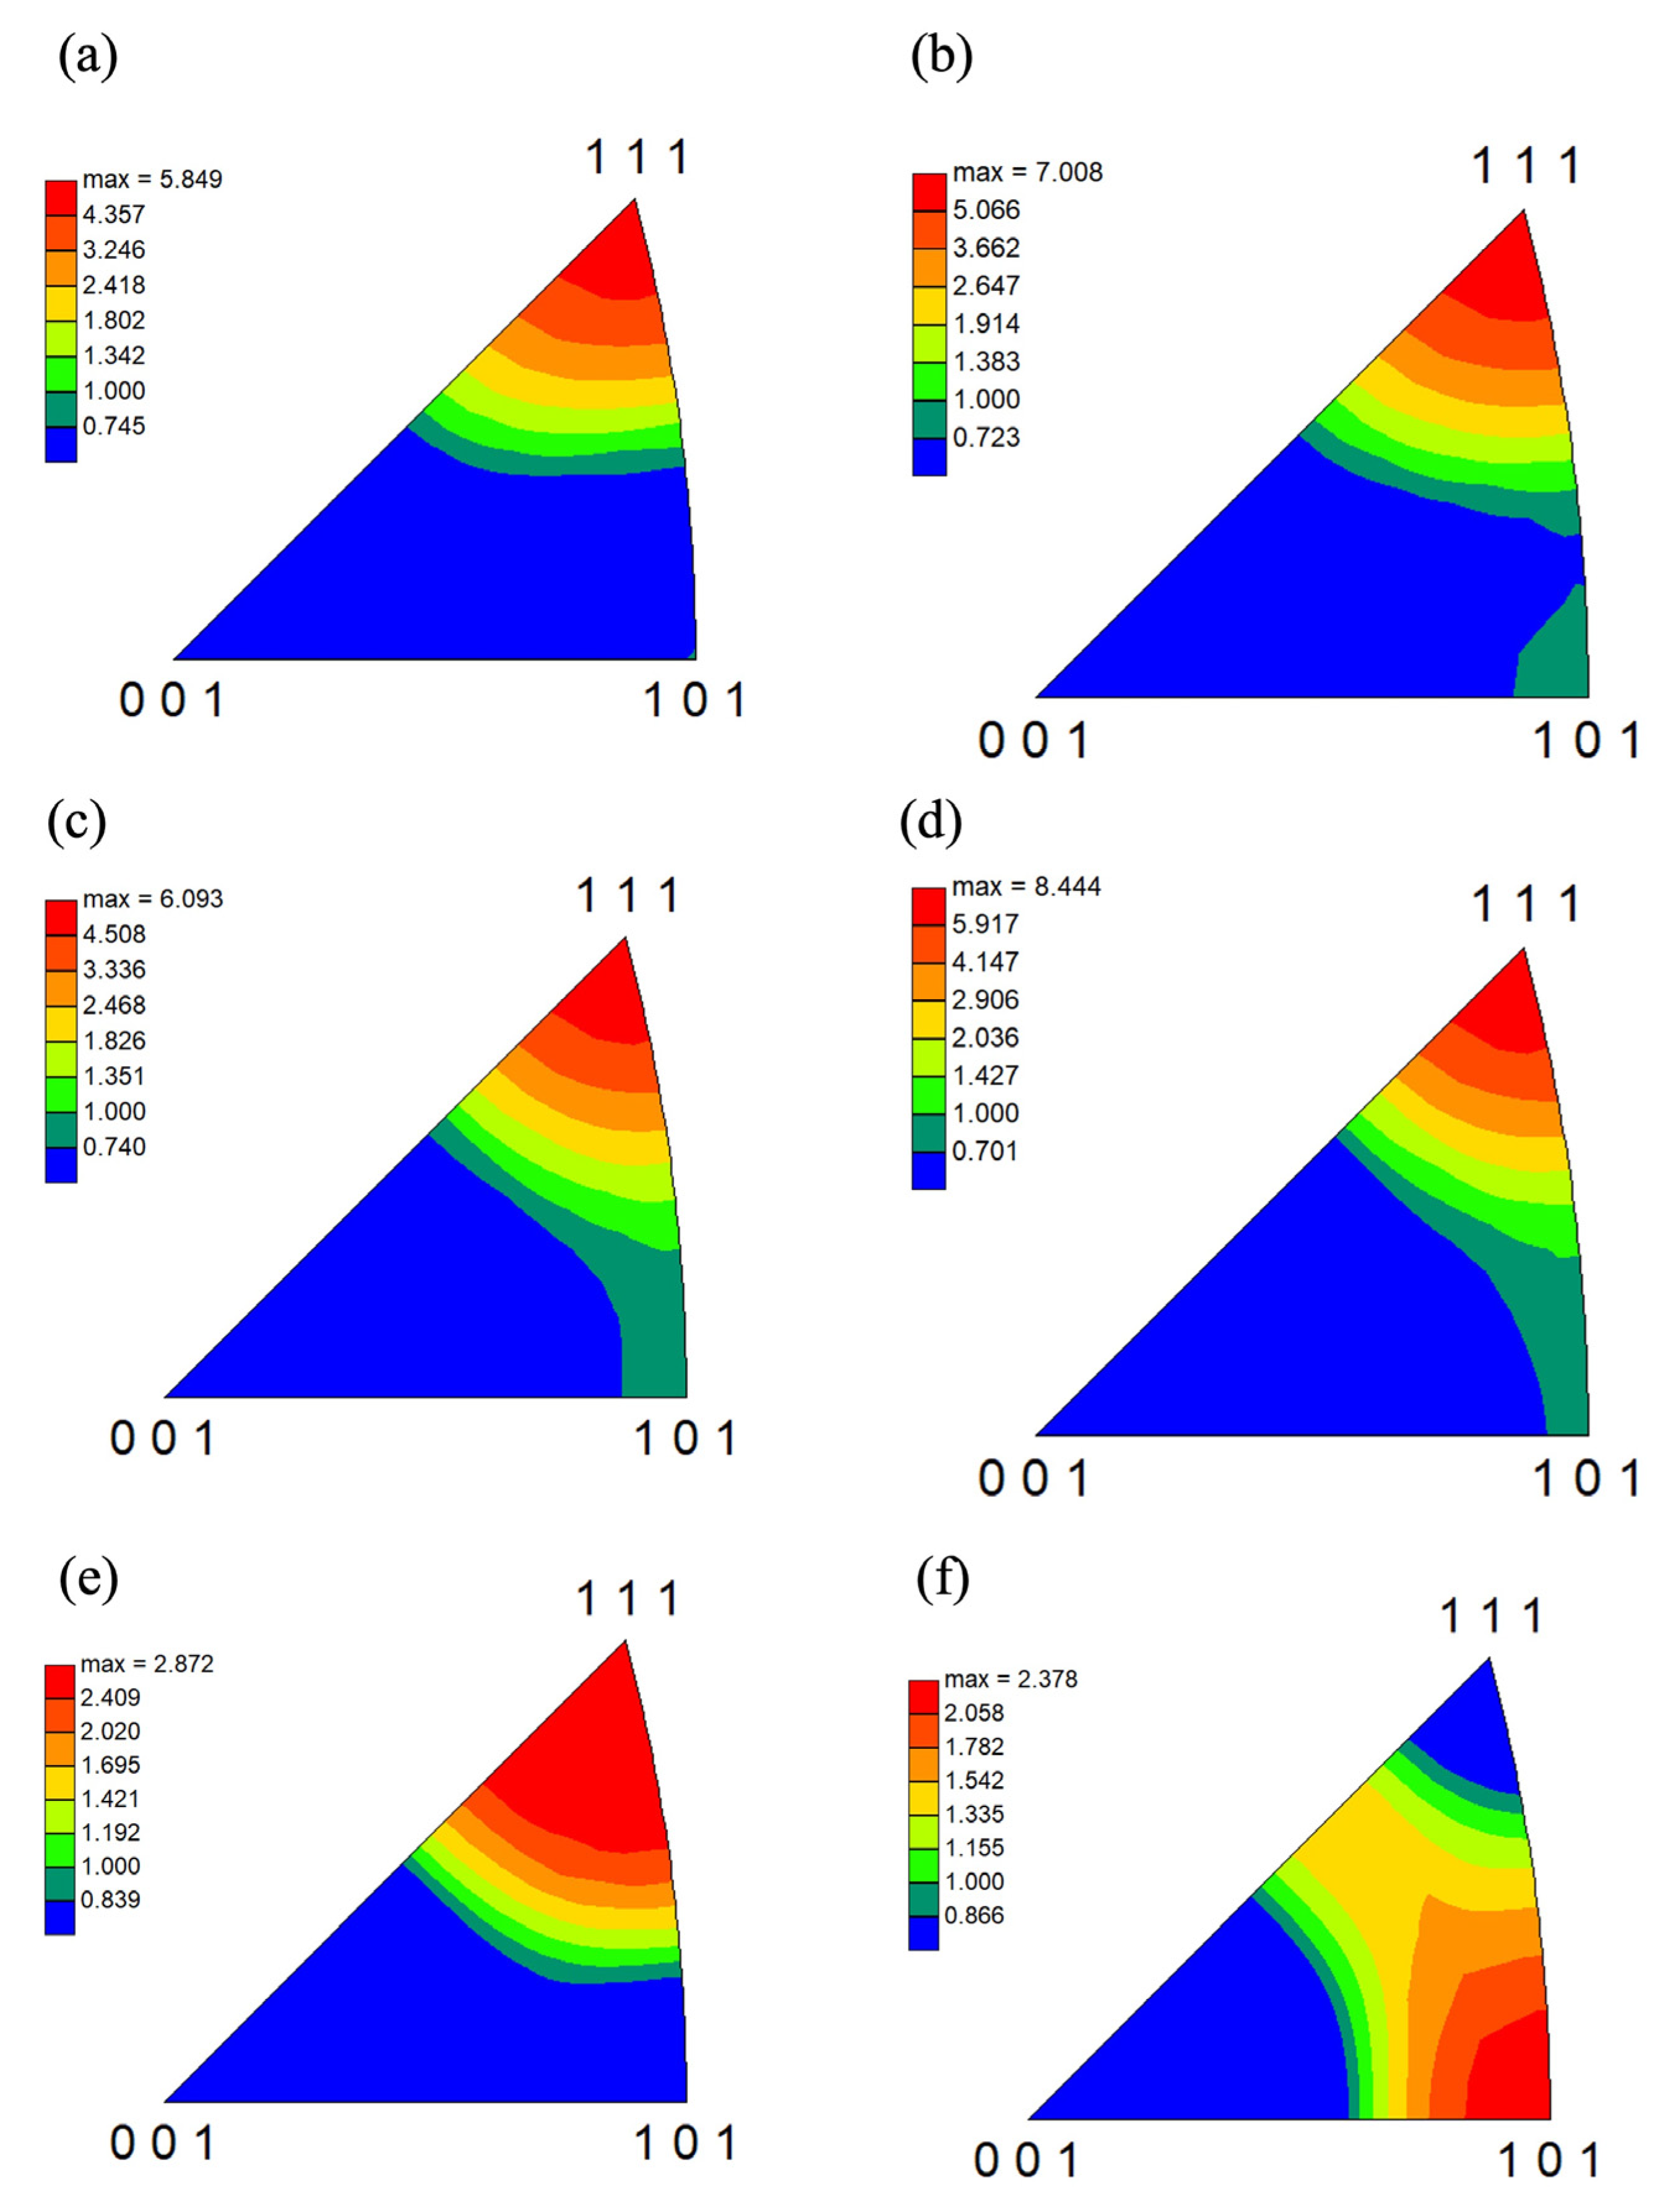
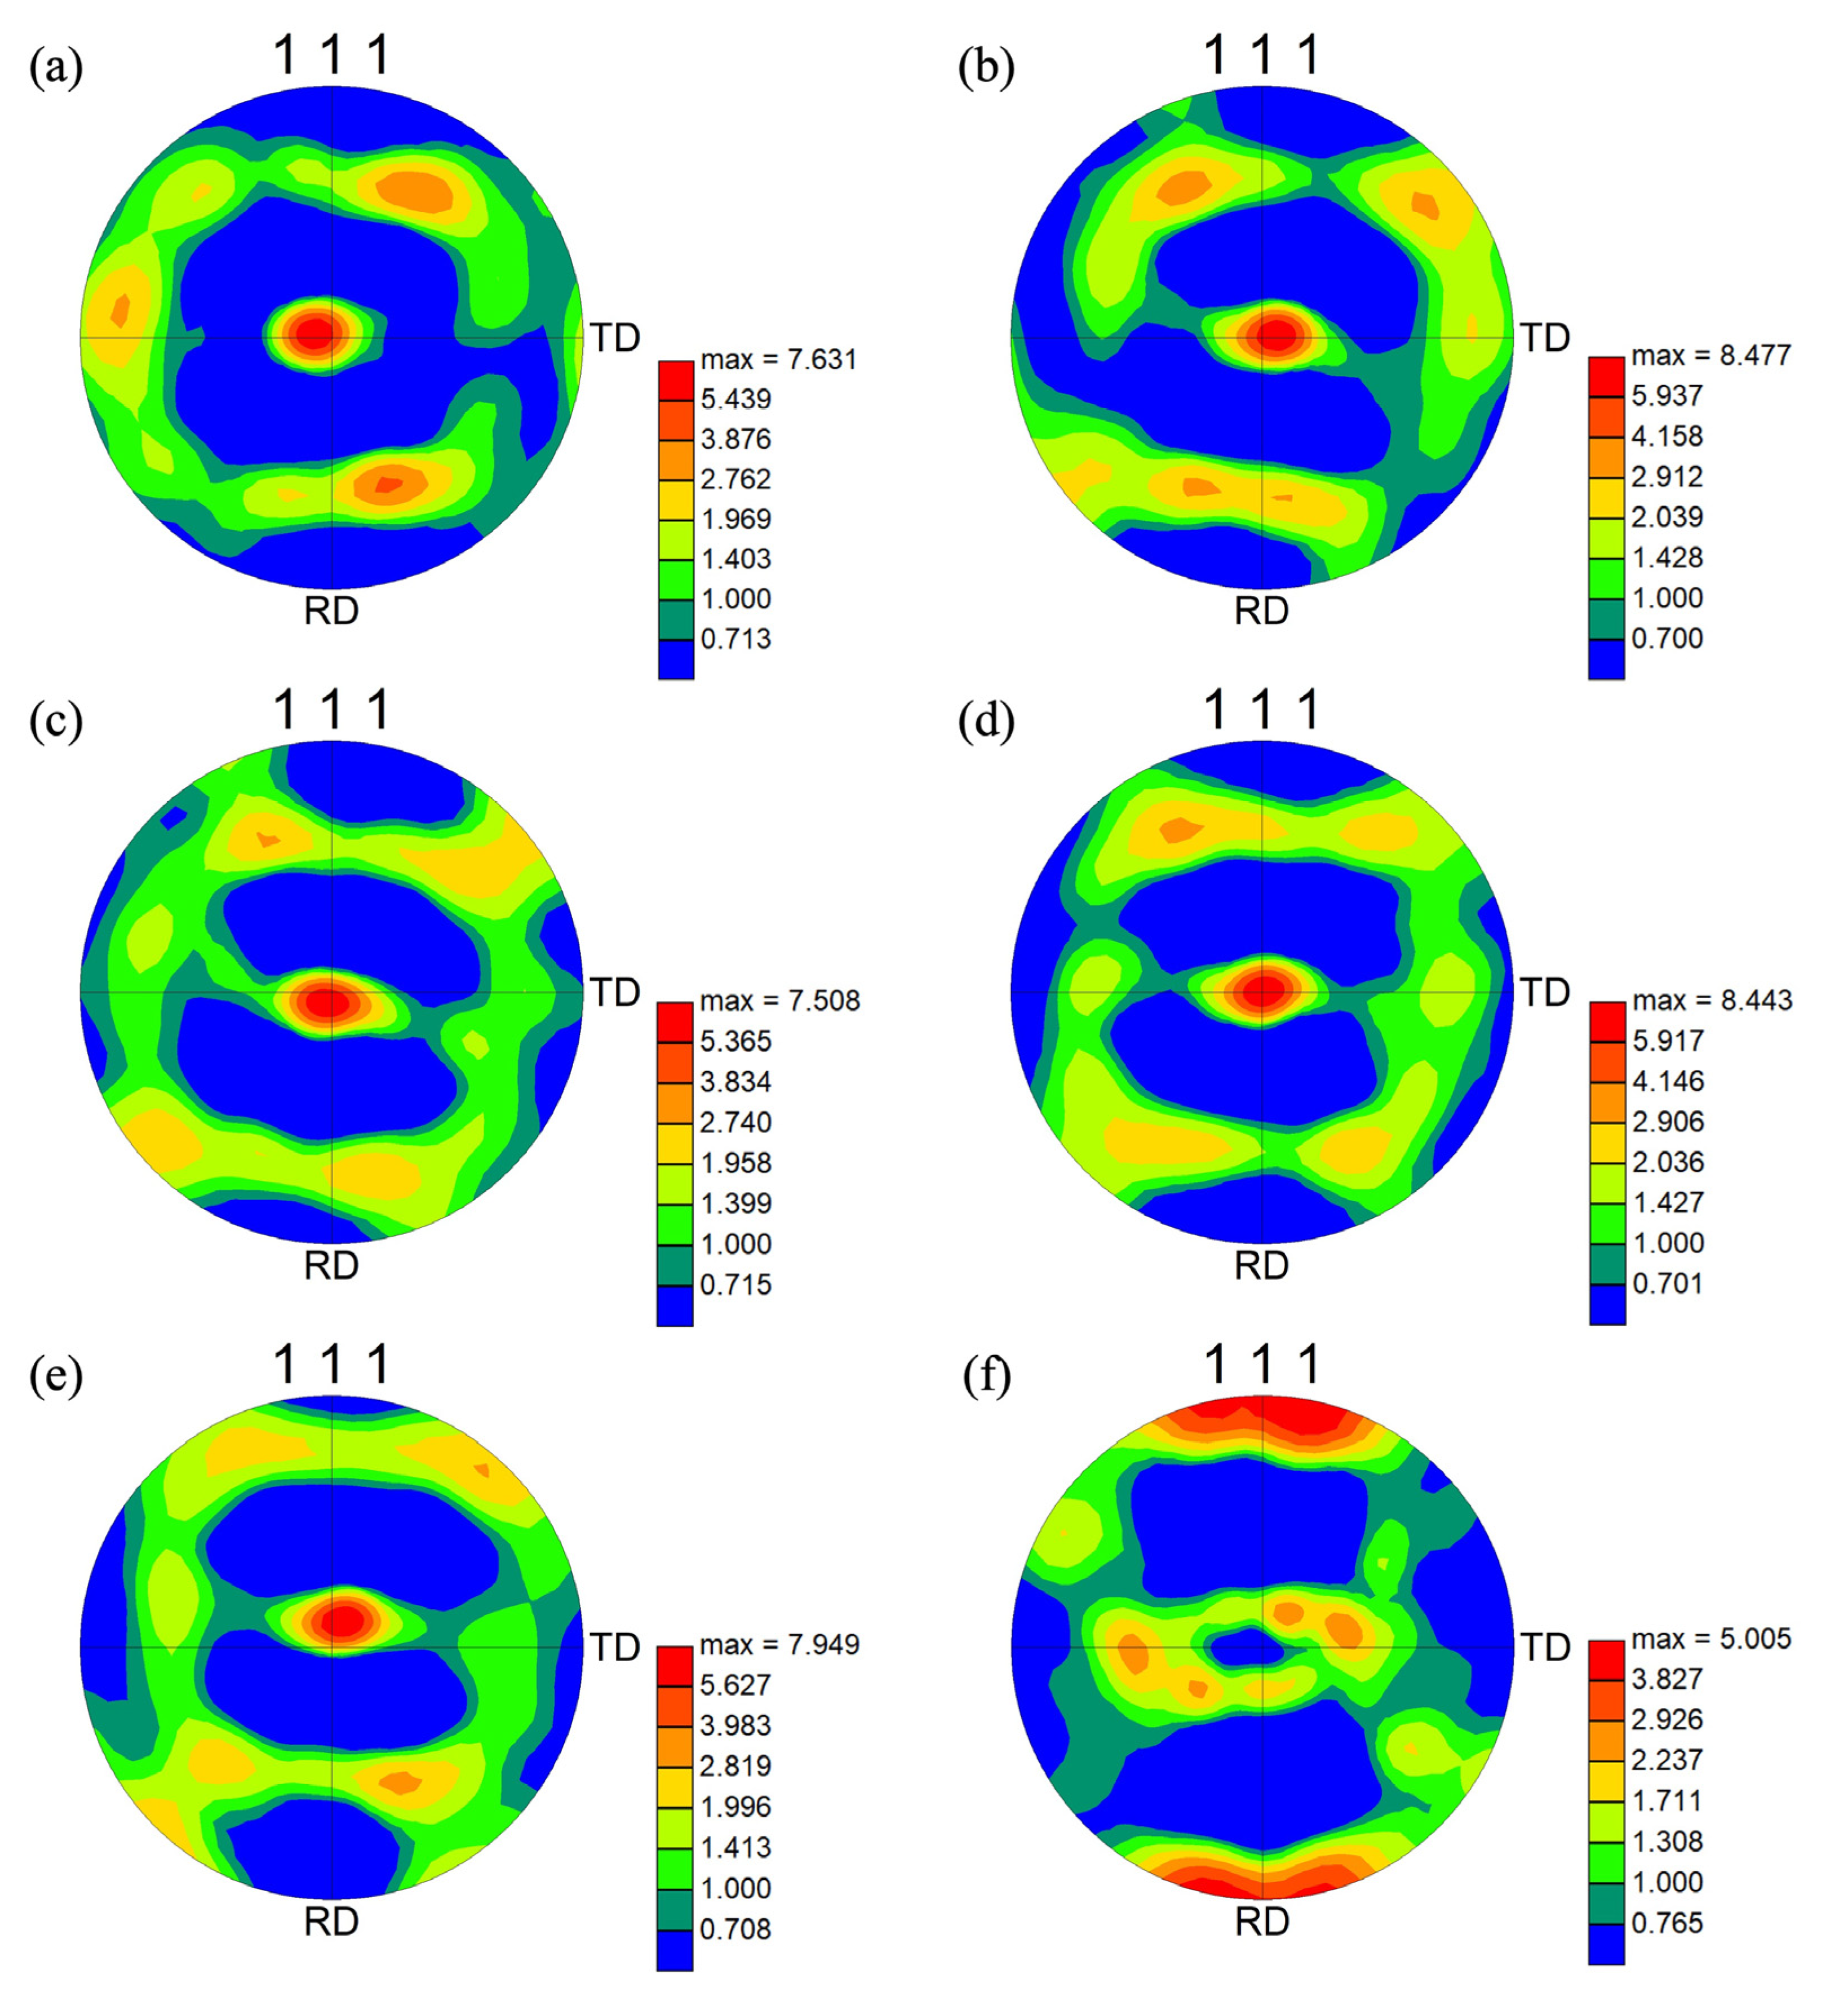
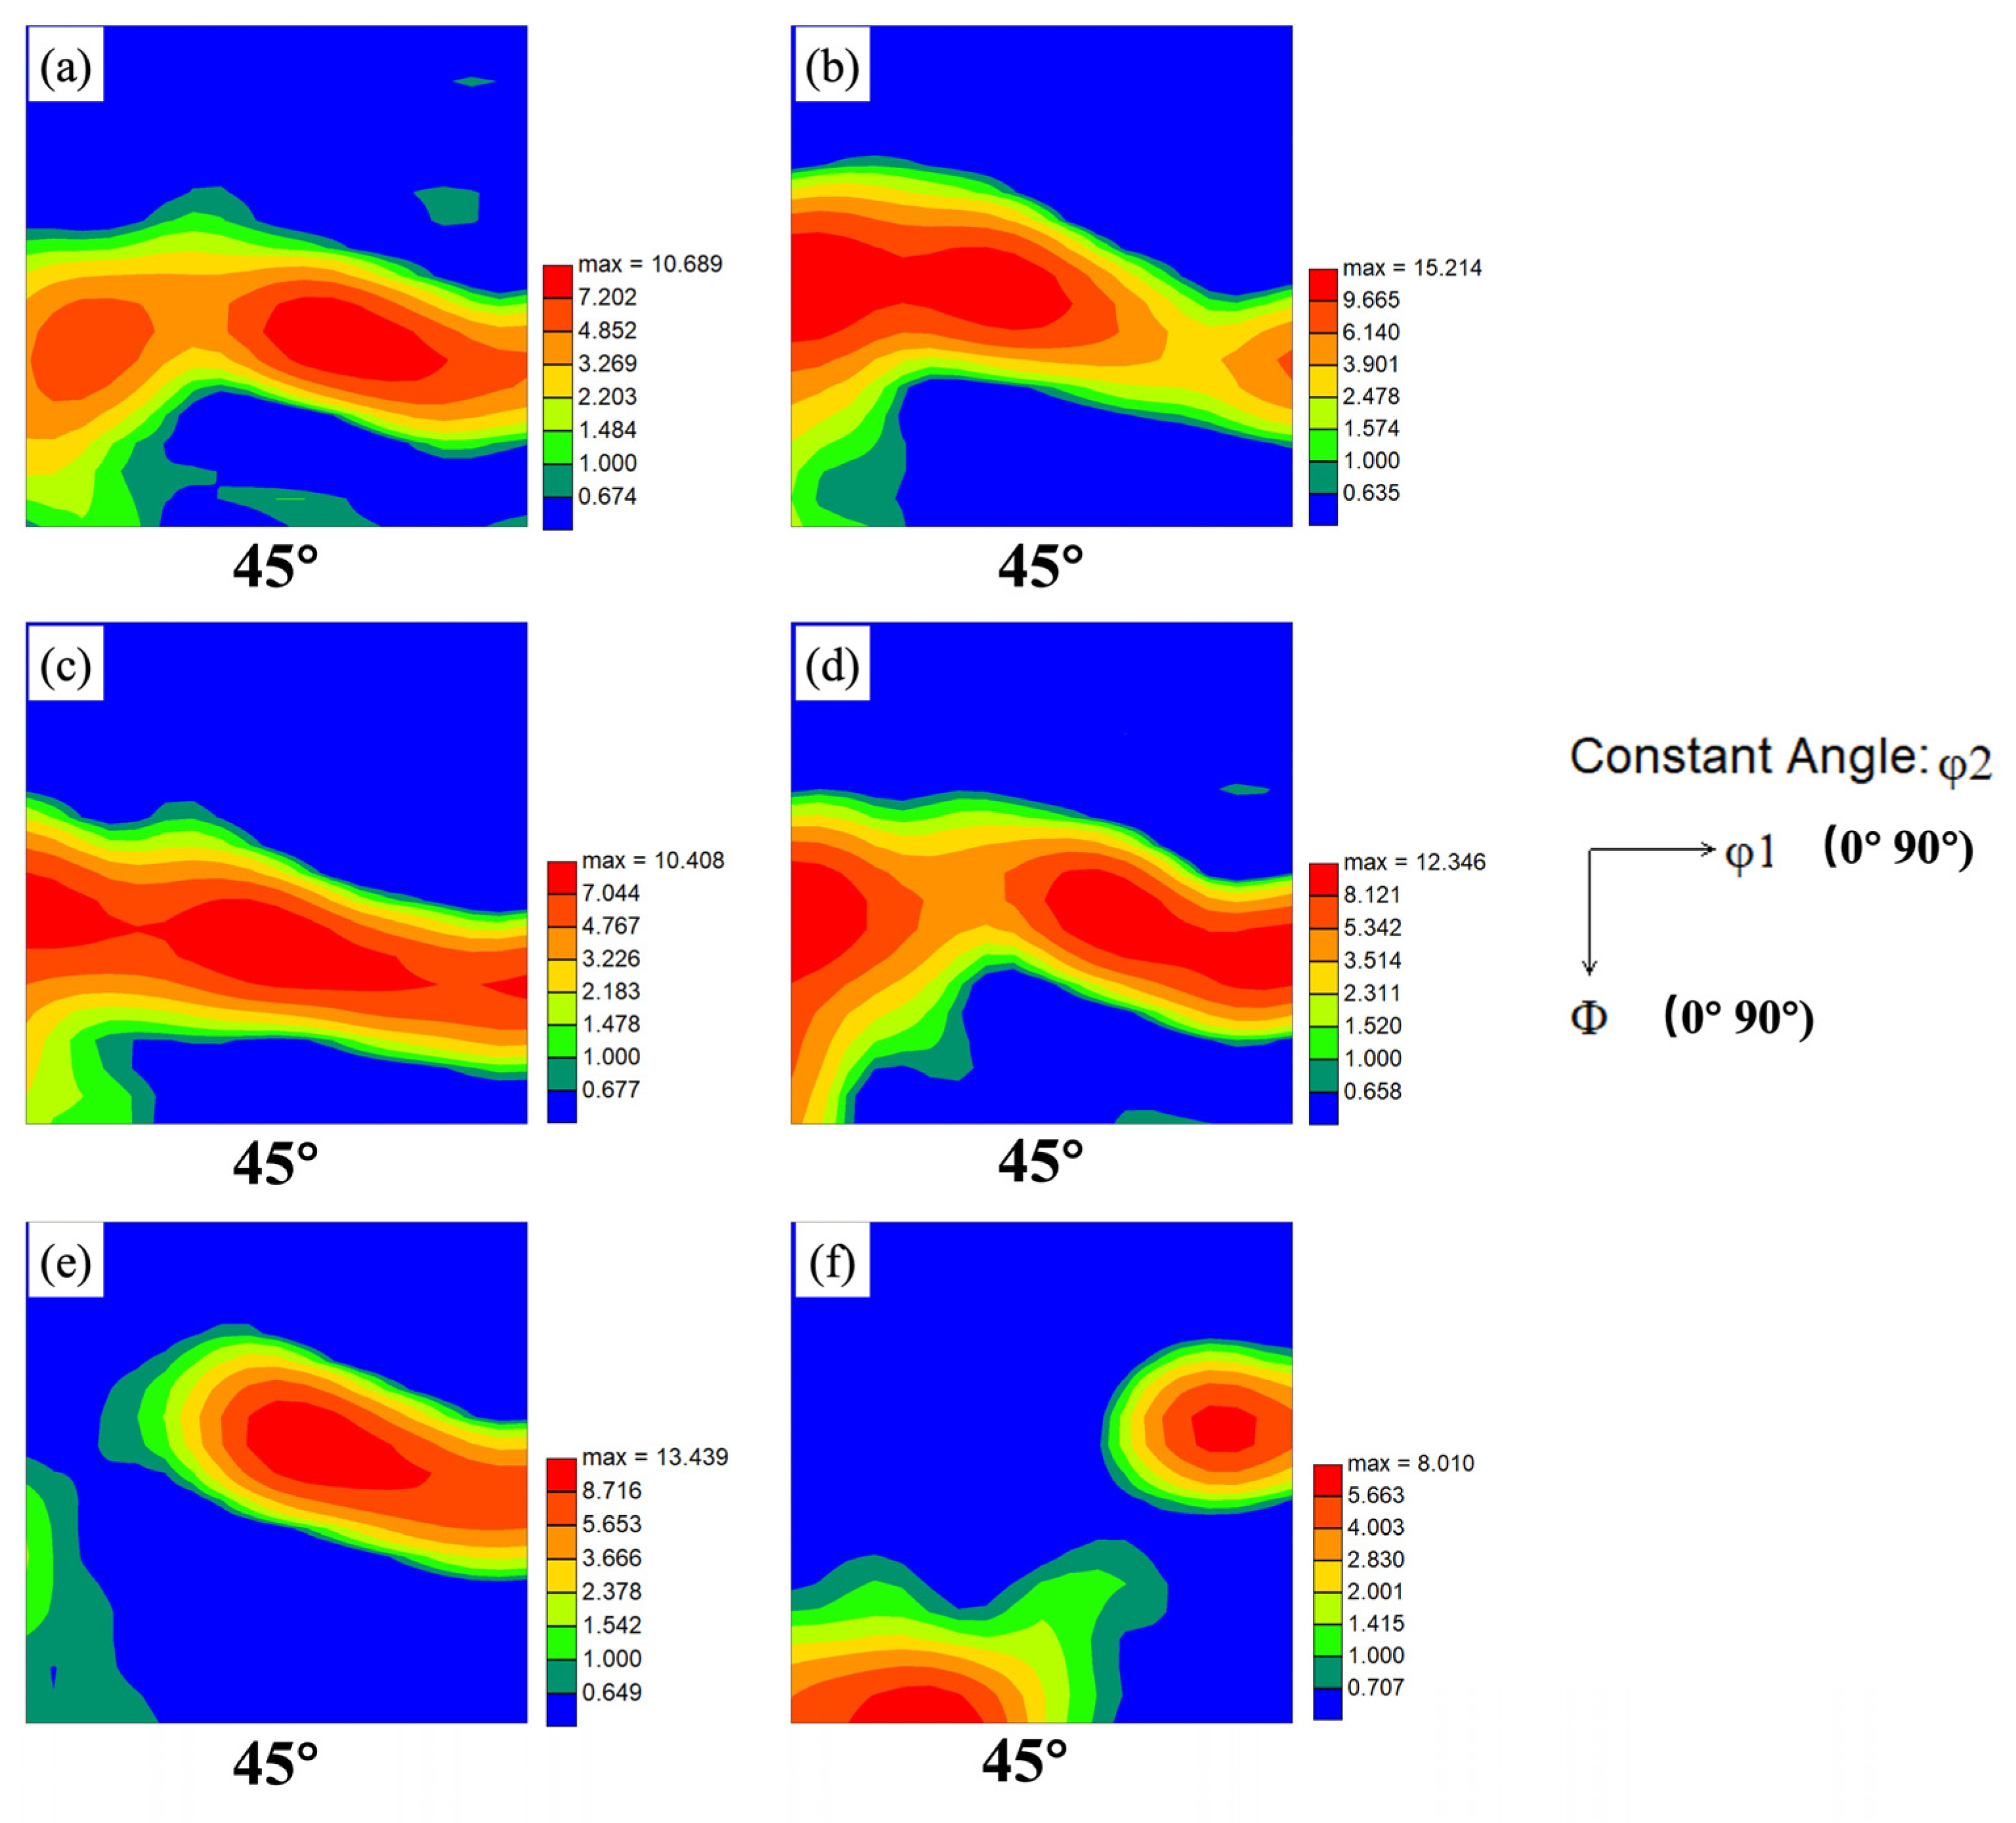
3.2. The Effect of Annealing Treatment on the Texture of Ti50Ni47Fe3 Alloy

Figure 6 and Figure 7 show the inverse pole figures (IPFs) in the RD and the (111) pole figures (PFs) of the Ti50Ni47Fe3 alloy sheets with different annealing treatments. Through the texture analysis, it can be found that the grain orientation of the alloy remains basically consistent. When annealing at 400 °C and 500 °C, the orientation remains mainly <111>//RD, and there is no significant change in texture with the increase in the annealing time.
Compared with the inverse pole figures at 400 °C and 500 °C, it can be observed that the texture of the alloy undergoes significant changes after annealing at 600 °C. As shown in Figure 6e, when the annealing time is short, the Ti50Ni47Fe3 alloy is in the recovery stage, and it still maintains the <111>//RD texture, but the intensity of the texture significantly decreases, to only about 2.8. When the annealing time is further extended to 120 min, the recrystallized grains undergo significant growth, the rolling orientation is basically eliminated, and texture transformation occurs mainly in the <101>//RD. Therefore, during the high-temperature annealing of Ti50Ni47Fe3 alloy, the texture changes as the annealing process progresses.
Figure 8 shows the ODF cross-section φ2 = 45° of the Ti50Ni47Fe3 alloys. For body-centered cubic (BCC) alloys, texture characteristics are most easily visible on the cross-section φ2 = 45°. The ODF cross-section φ2 = 45° results indicate that the texture is mainly distributed along the γ orientation line (φ1 = 0~90°, Φ = 54.7°, φ2 = 45°). The texture of the Ti50Ni47Fe3 alloys is (111)[uvw]. However, when the annealing treatment is 600 °C for 120 min, a (110)[uvw] texture occurs, which corresponds to Figure 6f and Figure 7f and is related to the recrystallization and grain growth processes.

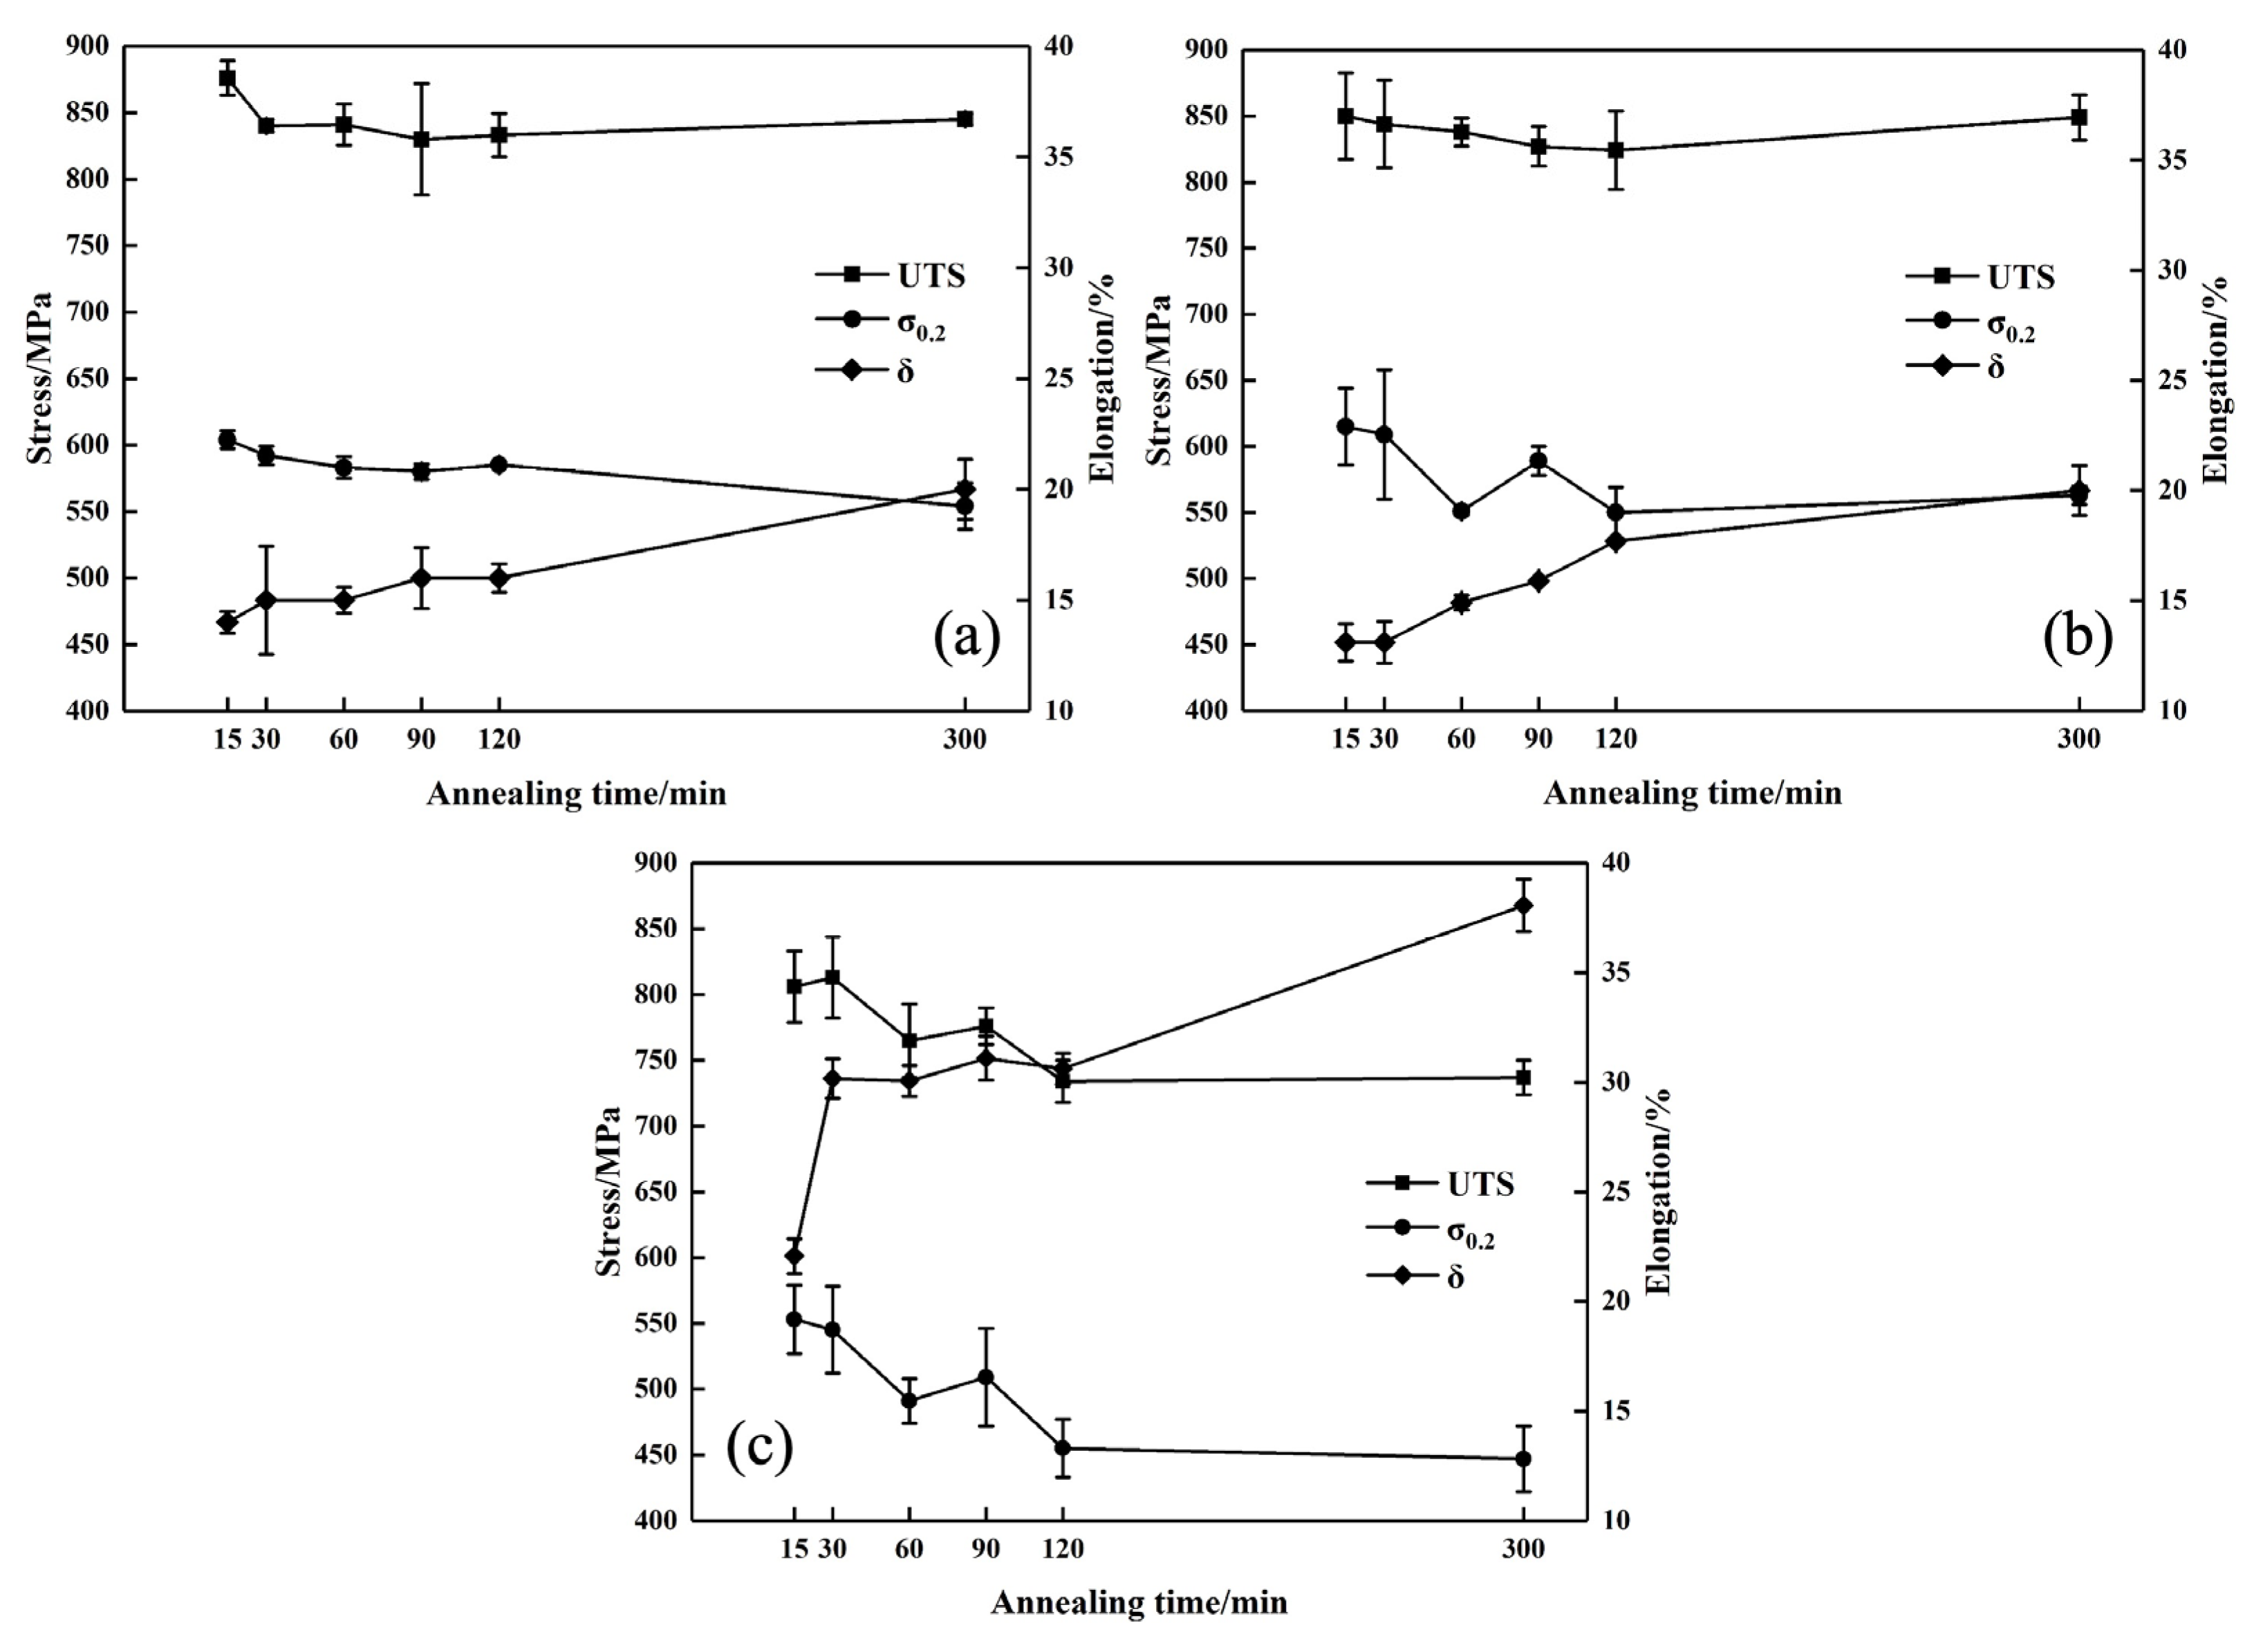
3.3. The Effect of Annealing Treatment on Mechanical Properties of Ti50Ni47Fe3 Alloy

Figure 9 shows the mechanical properties of the Ti50Ni47Fe3 alloy with different annealing treatments, including ultimate tensile strength (UTS), yield strength (σ0.2), and elongation (δ). In Figure 9a,b, it can be seen that the changes in the strength and elongation of the Ti50Ni47Fe3 alloy are basically consistent when annealing at 400 °C and 500 °C. That is, with the increase in the annealing time, the UTS and σ0.2 of the Ti50Ni47Fe3 alloy first decrease and then remain stable, while δ slowly increases. When the annealing time reaches 120 min, the strength and elongation of the alloy are basically equivalent after annealing at 400 °C and 500 °C, with the UTS and δ being about 830 MPa and 17%, respectively. However, when the annealing temperature increases to 600 °C, as shown in Figure 9c, extending the annealing time has a more significant effect on the strength and elongation of the Ti50Ni47Fe3 alloy. After annealing at 600 °C for 15 min, the Ti50Ni47Fe3 alloy can achieve an excellent combination of toughness and strength. At this time, the UTS and σ0.2 are 800 MPa and 550 MPa, respectively, and δ can reach 20%. With the further increase in the annealing time, A significantly increases, while the UTS and σ0.2 gradually decrease and ultimately remain at 730 MPa and 450 MPa.
During the heat treatment process, the cold-rolled Ti50Ni47Fe3 alloy sheet undergoes three stages of grain recovery recrystallization grain growth as both the heat treatment temperature and annealing time increase. When annealing at 400 °C, the microstructure of the Ti50Ni47Fe3 alloy is dominated by the recovery process, and the grain morphology is generally fibrous after cold deformation, as shown in Figure 3. With the increase in the annealing time, the recovery process gradually proceeds, and vacancies in the alloy migrate and disappear. The reduction in dislocation density results in a slight decrease in the UTS and σ0.2 and an increase in δ, as shown in Figure 9a. When annealing at 500 °C, as the annealing time increases, the dislocation density further decreases, and the recovery process of the Ti50Ni47Fe3 alloy gradually completes. Under the combined effect of sufficient external heat input and higher deformation stored energy at grain boundaries, recrystallization occurs at the grain boundaries [42], forming fine recrystallized grains. However, due to the small number of recrystallized grains, the characteristics of the rolling deformation texture are still retained, as shown in Figure 4, Figure 6, Figure 7 and Figure 8, and this has a small impact on the properties of the Ti50Ni47Fe3 alloy. Therefore, the changes in the UTS, σ0.2, and δ are not significantly different from those during annealing at 400 °C. When the annealing temperature increases to 600 °C, the external heat input continuously increases, and the Ti50Ni47Fe3 alloy rapidly undergoes recrystallization, causing a decrease in the UTS and σ0.2, while δ increases sharply, as shown in Figure 9. Moreover, with the increase in the annealing time, the recrystallized grains of the Ti50Ni47Fe3 alloy grow, leading to a change in grain orientation, gradually changing from a <111>//RD texture to a <101>//RD texture, but the texture strength is low.

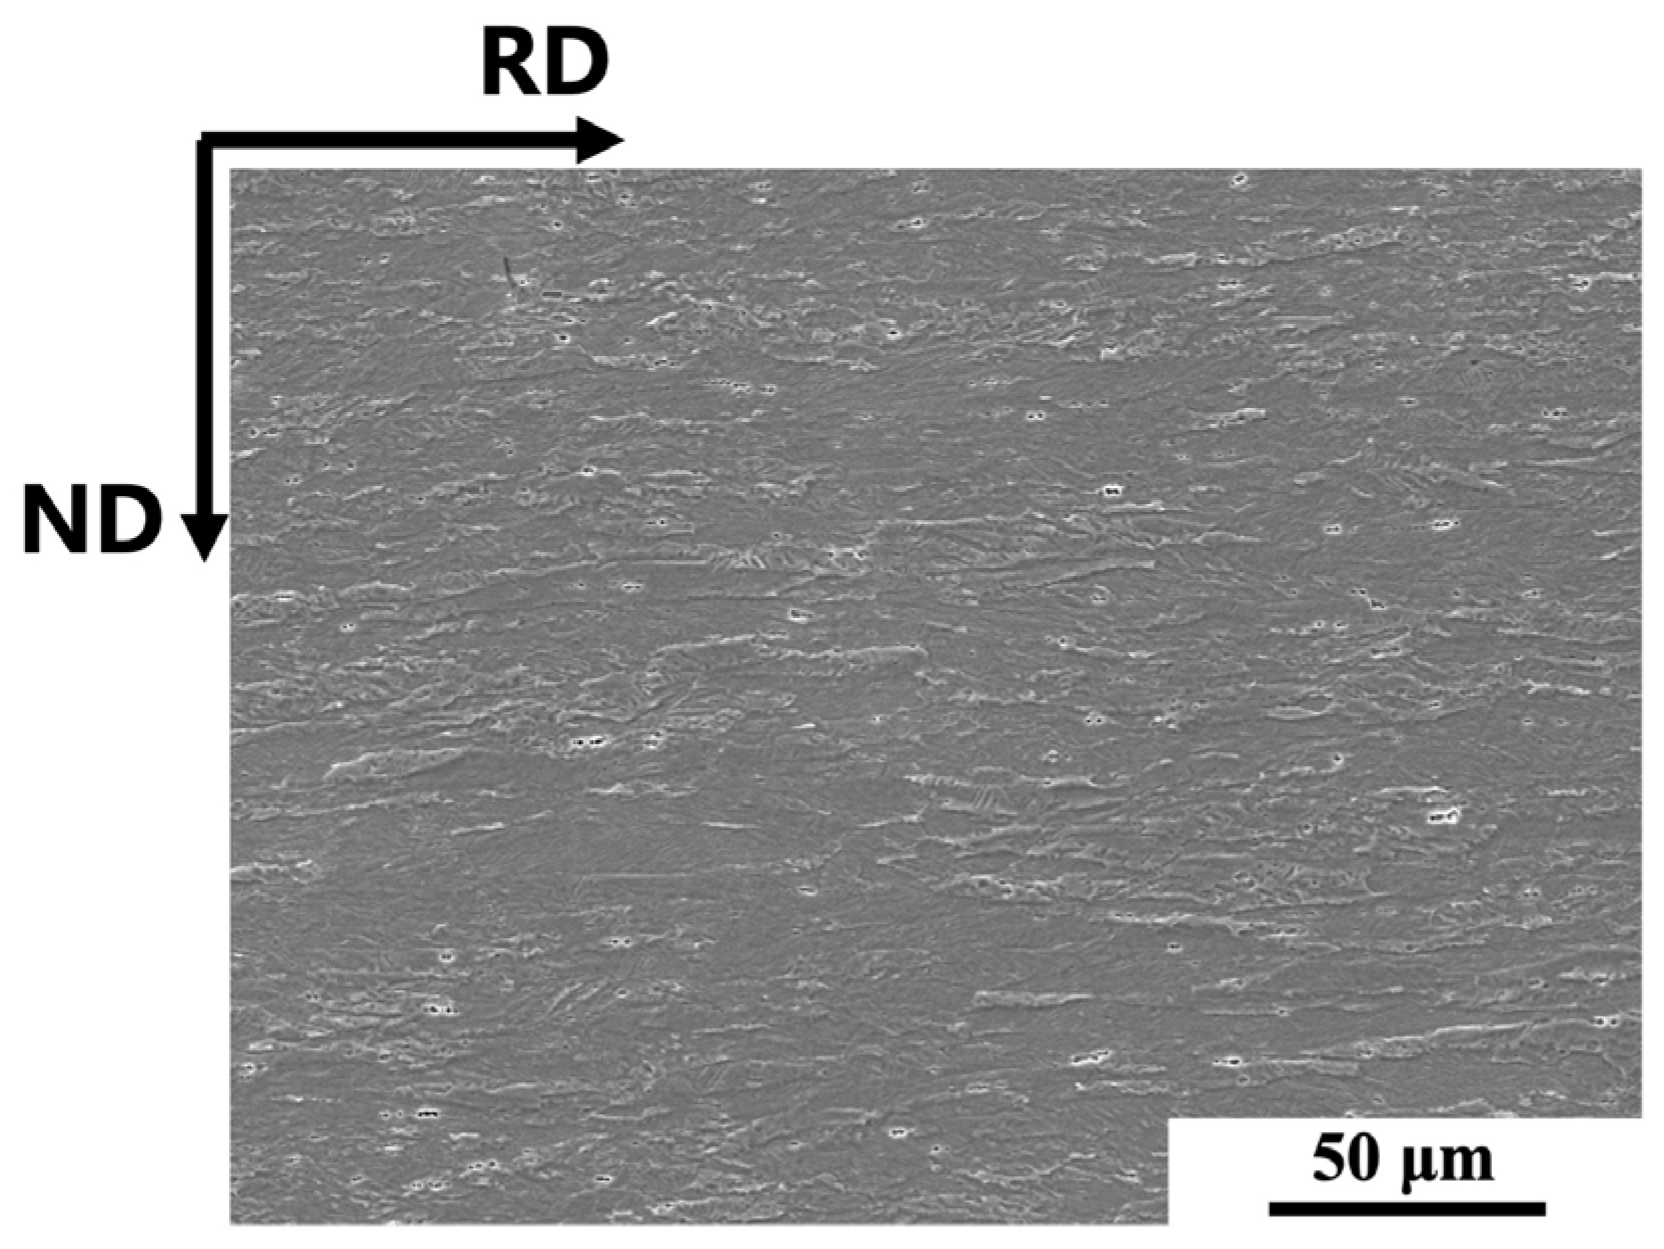
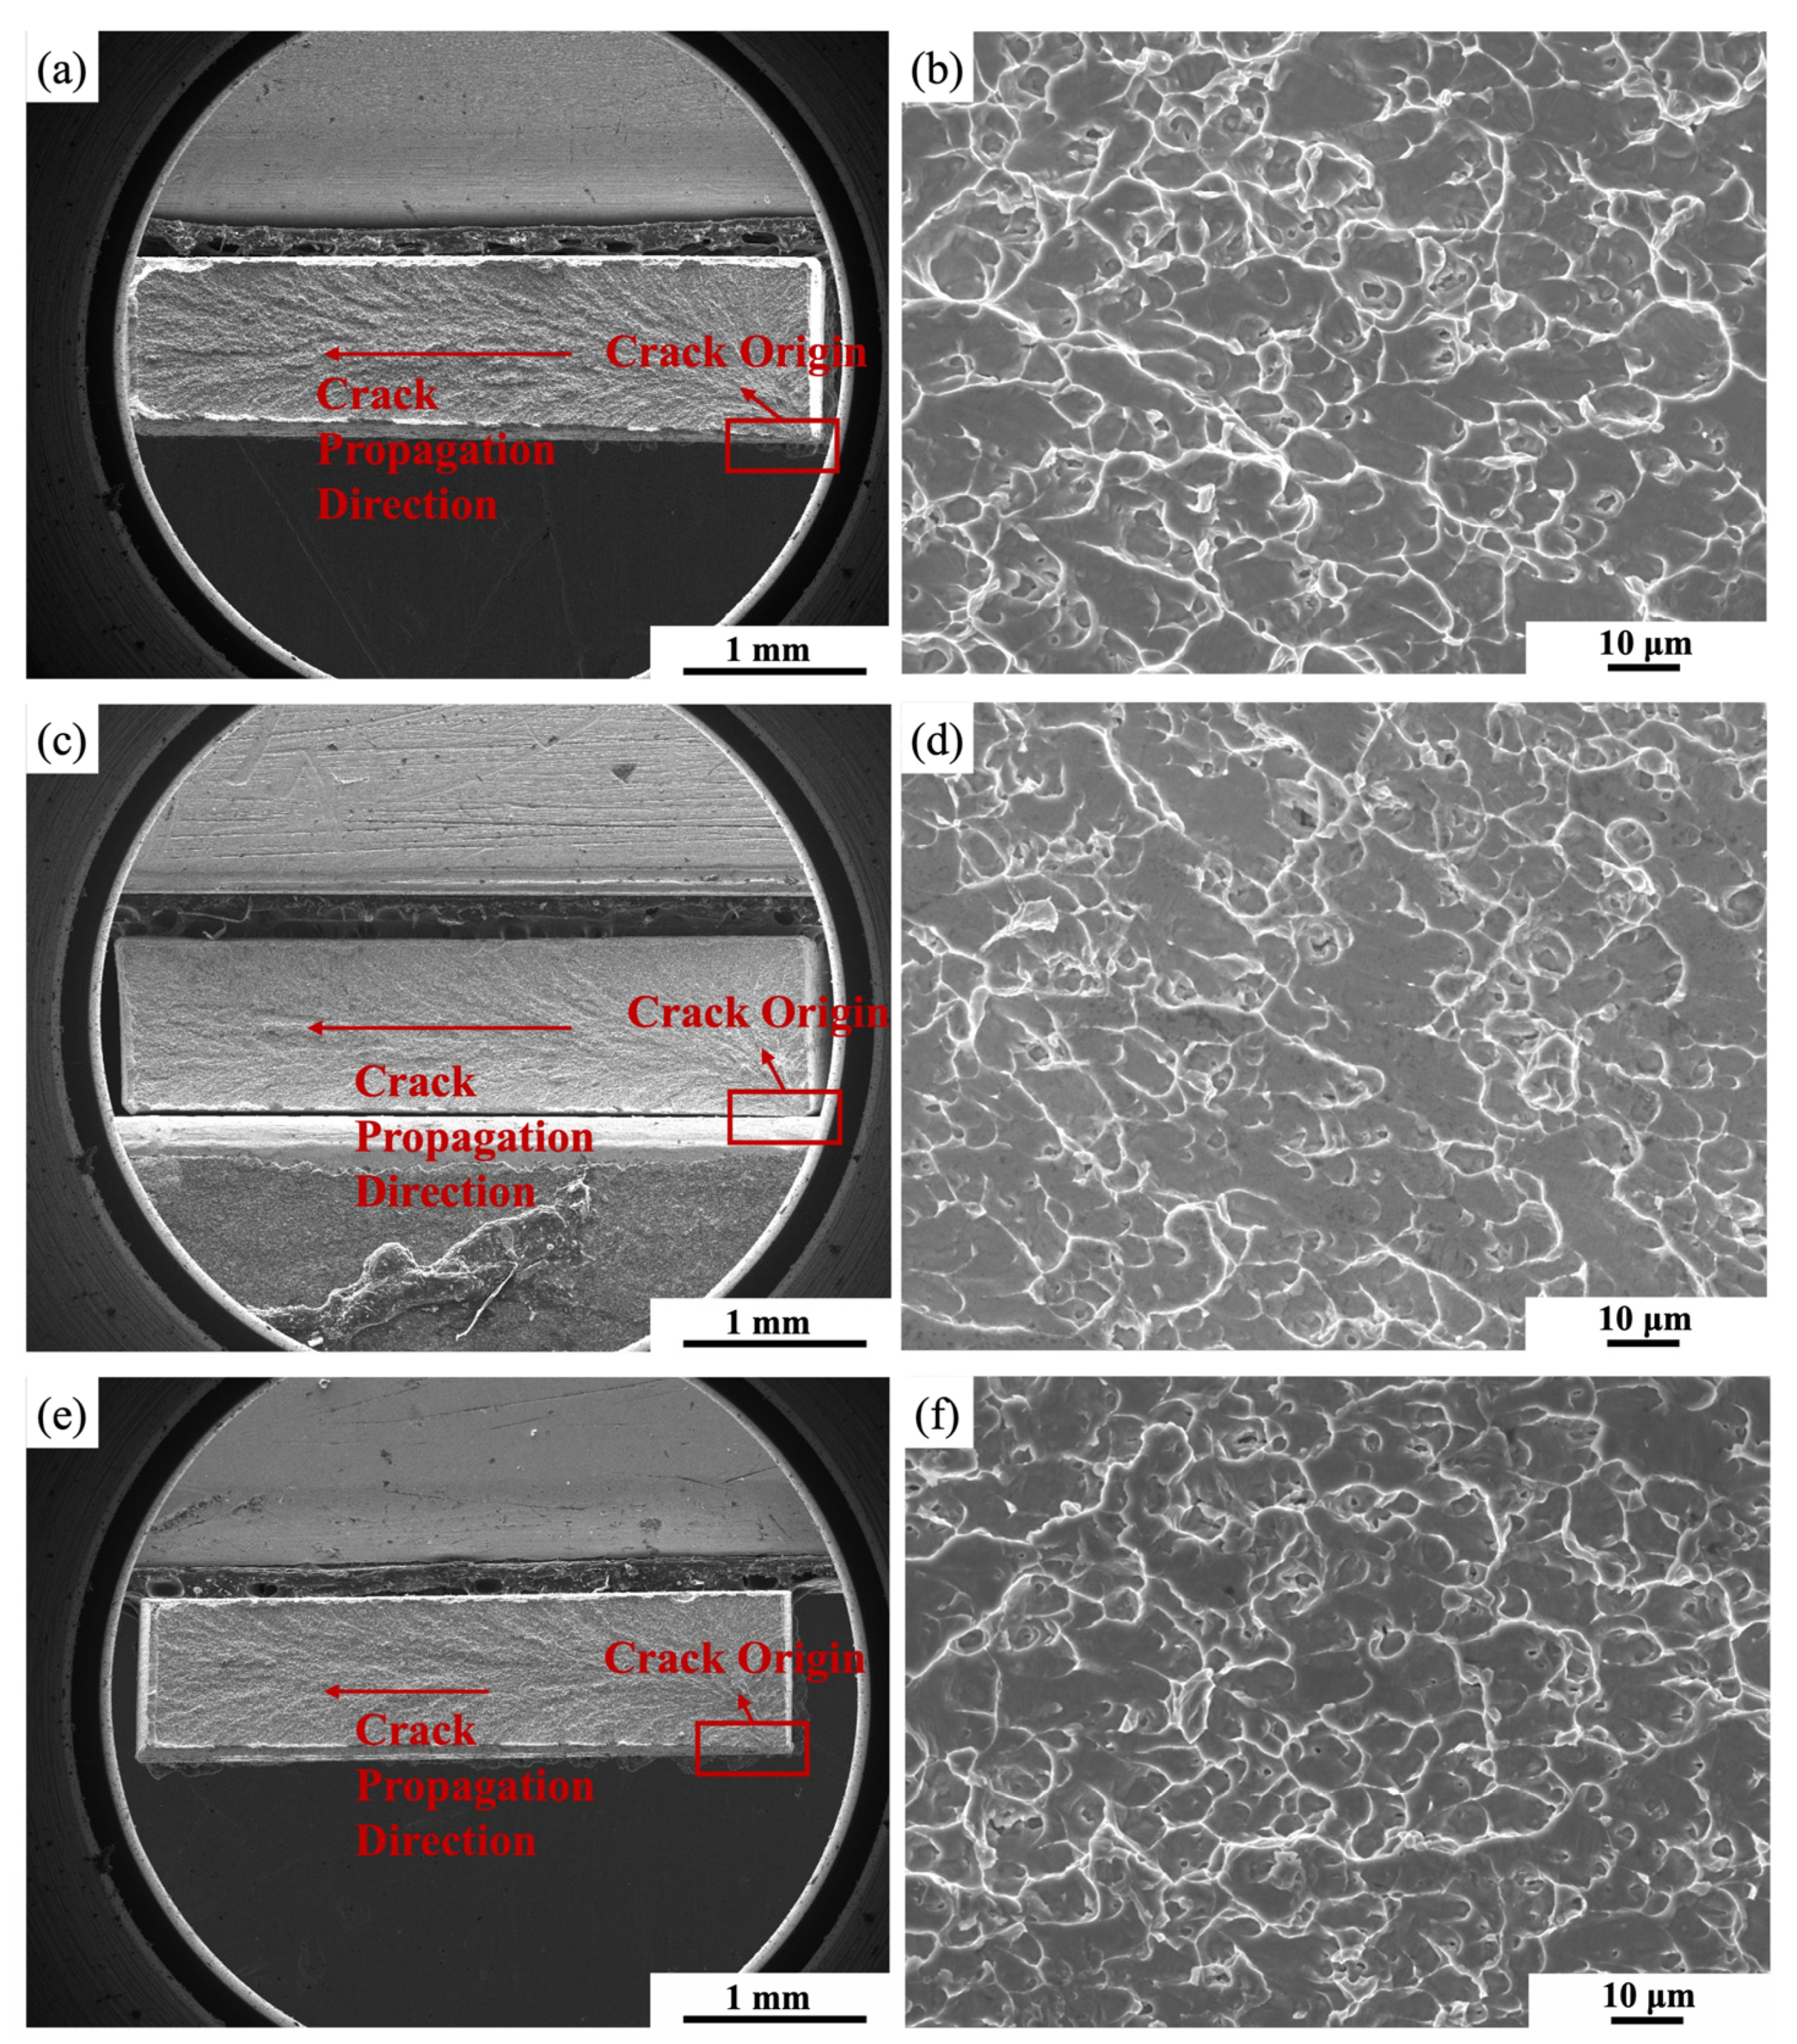
3.4. The Effect of Annealing Treatment on the Fracture Characteristics of Ti50Ni47Fe3 Alloy

Figure 10 shows SEM images of the tensile fracture surfaces of the Ti50Ni47Fe3 alloys after different annealing treatments for 300 min. By comparing the tensile fracture surfaces, we found that ductile fracture occurs in all specimens, and the crack origin is located on one side of the fracture surface, with obvious “Y”-shaped propagation. At the same time, it can be found that there are a large number of dimples of varying sizes and depths. However, with the increase in the annealing temperature, the “Y”-shaped pattern is shallower, and the elongation of the alloy is improved.

4. Conclusions

(1) When annealing at low temperatures (400~500 °C), as the annealing time prolongs, the Ti50Ni47Fe3 alloy mainly undergoes a recovery process, with only a few grains undergoing recrystallization under a prolonged annealing time at 500 °C. Additionally, with the extension of the annealing time, the UTS and σ0.2 decrease, while δ increases.
(2) When the cold-rolled Ti50Ni47Fe3 alloy sheet is annealed at a medium–high temperature (600 °C), the alloy undergoes recovery, recrystallization, and grain growth processes. Additionally, the texture gradually changes from <111>//RD to <101>//RD, with a significant decrease in texture strength.
(3) During the heat treatment process, the texture of the Ti50Ni47Fe3 alloy is mainly distributed along the γ orientation line (φ1 = 0~90°, Φ = 54.7°, φ2 = 45°). The texture of the Ti50Ni47Fe3 alloy is composed of (111)[uvw]. Additionally, (110)[uvw] occurs when annealing at 600 °C for 120 min.
(4) After annealing at 600 °C for 15 min, the cold-rolled Ti50Ni47Fe3 alloy sheets can achieve an excellent combination of toughness and strength. Increasing the annealing time appropriately can greatly improve elongation, but this is not conducive to strength. To achieve higher strength, it is advisable to anneal at 400 °C and 500 °C and to increase the annealing time to improve elongation.

Author Contributions

Conceptualization, Y.Y. and S.H.; methodology, S.L.; formal analysis, X.S. and Y.L.; resources, Y.Y., W.Y. and S.H.; writing—original draft preparation, S.L.; writing—review and editing, S.L. and Y.L. All authors have read and agreed to the published version of the manuscript.

Funding

This research received no external funding.

Data Availability Statement

The original contributions presented in the study are included in the article; further inquiries can be directed to the corresponding authors.

Conflicts of Interest

Y.Y. and S.H. are employed by the company GRINM (Guangdong) Institute for Advanced Materials and Technology. The remaining authors declare that the research was conducted in the absence of any commercial or financial relationships that could be construed as a potential conflict of interest.

References

  1. Mohd Jani, J.; Leary, M.; Subic, A.; Gibson, M.A. A review of shape memory alloy research, applications and opportunities. Mater. Des. 2014, 56, 1078–1113. [Google Scholar] [CrossRef]
  2. Velmurugan, C.; Senthilkumar, V.; Dinesh, S.; Arulkirubakaran, D. Review on phase transformation behavior of NiTi shape memory alloys. Mater. Today Proc. 2018, 5, 14597–14606. [Google Scholar] [CrossRef]
  3. Otsuka, K.; Ren, X. Physical metallurgy of Ti–Ni–based shape memory alloys. Prog. Mater Sci. 2005, 50, 511–678. [Google Scholar] [CrossRef]
  4. Cai, W.; Meng, X.L.; Zhao, L.C. Recent development of TiNi–based shape memory alloys. Curr. Opin. Solid State Mater. Sci. 2005, 9, 296–302. [Google Scholar] [CrossRef]
  5. Xue, P.F.; Zhang, F.; Li, Y.; Zhang, D.Y. Progress in Ti-based shape memory alloys. Chin. J. Rare Metals 2015, 39, 84–90. [Google Scholar]
  6. Bigelow, G.S.; Garg, A.; Padula II, S.A.; Gaydosh, D.J.; Noebe, R.D. Load-biased shape-memory and superelastic properties of a precipitation strengthened high-temperature Ni50.3Ti29.7Hf20 alloy. Scr. Mater. 2011, 64, 725–728. [Google Scholar] [CrossRef]
  7. Amireche, R.; Morin, M.; Belkahla, S. Study of the “All-Round-Effect” generated by aging in traction in a Ni rich TiNi shape memory alloy. J. Alloys Compd. 2012, 516, 5–8. [Google Scholar] [CrossRef]
  8. Ostapenko, M.G.; Semin, V.O.; D’Yachenko, F.A.; Neiman, A.A.; Meisner, L.L. Structure and residual stress distribution in TiNi substrate after fabrication of surface alloy using electron-beam treatments. Acta Mater. 2022, 231, 117893. [Google Scholar] [CrossRef]
  9. Otsuka, K.; Ren, X. Recent developments in the research of shape momery alloys. Intermetallics 1999, 7, 511–528. [Google Scholar] [CrossRef]
  10. Ouyang, X.P.; Fang, X.; Zhu, Y.; Wang, K.; Yang, H.Y. Overview of aviation hydraulic fittings. China Mech. Eng. 2015, 26, 136–145. [Google Scholar]
  11. Yin, X.Q.; Wang, S.J.; Li, Y.F.; Xie, H.F.; Mi, X.J. Hot deformation behavior of TiNiFe shape memory alloys. Chin. J. Rare Metals 2012, 36, 851–857. [Google Scholar]
  12. Piao, M.; Miyazakin, S.; Otsuka, K.; Nishida, N. Effects of Nb addition on the microstructure of Ti-Ni alloys. Mater. Trans. 1992, 33, 337–345. [Google Scholar] [CrossRef]
  13. Bao, Z.Z.; Guo, S.; Xiao, F.; Zhao, X.Q. Development of NiTiNb in-situ composite with high damping capacity and high yield strength. Prog. Nat. Sci. 2011, 21, 293–300. [Google Scholar] [CrossRef]
  14. Cai, W.; Meng, X.L.; Zhao, X.Q.; Cui, L.S.; Xu, H.B. Martensitic transformation and shape memory effect of Ti-Ni based high temperature shape memory alloys. Mater. China 2012, 31, 40–47. [Google Scholar]
  15. Patriarca, L.; Sehitoglu, H. High-temperature superelasticity of Ni50.6Ti24.4Hf25.0 shape memory alloy. Scr. Mater. 2015, 101, 12–15. [Google Scholar] [CrossRef]
  16. Pérez-Sierra, A.M.; Pons, J.; Santamarta, R.; Karaman, I.; Noebe, R.D. Stability of a Ni-rich Ni-Ti-Zr high temperature shape memory alloy upon low temperature aging and thermal cycling. Scr. Mater. 2016, 124, 47–50. [Google Scholar] [CrossRef]
  17. Nayan, N.; Singh, G.; Murty, S.V.S.N.; Narayan, P.R.; Mohan, M.; Venkitakrishnan, P.V.; Ramamurty, U. Effect of ternary additions of Cu and Fe on the hot deformation behavior of NiTi shape memory alloy-A study using processing maps. Intermetallics 2021, 131, 107084. [Google Scholar] [CrossRef]
  18. Ingale, B.D.; Wei, W.C.; Chang, P.C.; Kuo, Y.K.; Wu, S.K. Anomalous transport and thermal properties of NiTi and with Cu and Fe-doped shape memory alloys near the martensitic transition. J. Appl. Phys. 2011, 110, 113721. [Google Scholar] [CrossRef]
  19. Xu, Z.Y.; Jiang, B.H.; Yang, D.Z.; Zhao, L.C.; Guo, J.F.; Pan, D.C.; Xie, C.Y.; Cai, W.; Zhang, X.Q.; Huang, Y. Shape Memory Materials; Shanghai Jiao Tong University Press: Shanghai, China, 2000. [Google Scholar]
  20. Ji, Y.C.; Wang, D.; Ding, X.D.; Otsuka, K.; Ren, X.B. Origin of an isothermal R-martensite formation in Ni-rich Ti-Ni solid solution: Crystallization of strain glass. Phys. Rev. Lett. 2015, 114, 055701. [Google Scholar] [CrossRef]
  21. Zhang, Y.Q.; Jiang, S.Y.; Zhu, X.M.; Zhao, Y.N.; Liang, Y.L.; Sun, D. Influence of Fe addition on phase transformation behavior of NiTi shape memory alloy. Trans. Nonferrous Met. Soc. China 2017, 27, 1580–1587. [Google Scholar] [CrossRef]
  22. Naresh, H.; Bharath, H.S.; Prashantha, S. The influence of alloying constituent Fe on mechanical properties of NiTi based shape memory alloys. Mater. Today Proc. 2017, 4, 11251–11259. [Google Scholar] [CrossRef]
  23. Yin, X.Q.; Park, C.H.; Li, Y.F.; Ye, W.J.; Zuo, Y.T.; Lee, S.W.; Yeom, J.T.; Mi, X.J. Mechanism of continuous dynamic recrystallization in a 50Ti-47Ni-3Fe shape memory alloy during hot compressive deformation. J. Alloys Compd. 2017, 693, 426–431. [Google Scholar] [CrossRef]
  24. Wang, J.G.; Liu, F.S.; Cao, J.M. The microstructure and thermomechanical behavior of Ti50Ni47Fe2.5Nd0.5 shape memory alloys. Mat. Sci. Eng. A 2010, 527, 6200–6204. [Google Scholar] [CrossRef]
  25. Liang, Y.L.; Jiang, S.Y.; Zhang, Y.Q.; Hu, L.; Zhao, C.Z. Microstructure evolution and deformation mechanism of NiTiFe shape memory alloy based on plane strain compression and subsequent annealing. Mater. Chem. Phys. 2018, 215, 112–120. [Google Scholar] [CrossRef]
  26. Ma, W.; Chen, B.; Liu, F.S.; Xu, Q. Phase transformation behaviors and mechanical properties of Ti50Ni49Fe1 alloy with severe plastic deformation. Rare Metals 2013, 32, 448–452. [Google Scholar] [CrossRef]
  27. Okamoto, Y.; Hamanaka, H.; Miura, F.; Tamura, H.; Horikawa, H. Reversible changes in yield stress and transformation temperature of a NiTi alloy by alternate heat treatments. Scr. Met. Mater. 1988, 22, 517–520. [Google Scholar] [CrossRef]
  28. Abujudom, D.N.; Thoma, P.E.; Fariabi, S. The effect of cold work and heat treatment on the phase transformations of near equiatomic NiTi shape memory alloy. Mater. Sci Forum. 1991, 56–58, 565–570. [Google Scholar] [CrossRef]
  29. Feng, H.; He, Z.R.; Du, Q.Y.; Ye, J.J.; Zhang, K.G.; Zhang, T. Effect of annealing and deformation processes on properties of Ti-51.1Ni shape memory alloy. Trans. Mater. HeatTreatment 2019, 40, 50–55. [Google Scholar]
  30. Liu, S.W.; Li, Y.F.; Song, X.Y.; Yu, Y.; Ye, W.J.; Hui, S.X. Microstructures and mechanical properties of annealed Ti50Ni47Fe3 shape memory alloy. Crystals 2023, 13, 706. [Google Scholar] [CrossRef]
  31. Tadayyon, G.; Mazinani, M.; Guo, Y.; Zebarjad, S.M.; Tofail, S.A.M.; Biggs, M.J.P. Study of the microstructure evolution of heat treated Ti-rich NiTi shape memory alloy. Mater. Charact. 2016, 112, 11–19. [Google Scholar] [CrossRef]
  32. Tadayyon, G.; Mazinani, M.; Guo, Y.; Zebarjad, S.M.; Tofail, S.A.M.; Biggs, M.J.P. The effect of annealing on the mechanical properties and microstructural evolution of Ti-rich NiTi shape memory alloy. Mater. Sci. Eng. A 2016, 662, 564–577. [Google Scholar] [CrossRef]
  33. Tadayyon, G.; Guo, Y.; Mazinani, M.; Zebarjad, S.M.; Tiernan, P.; Tofail, S.A.M.; Biggs, M.J.P. Effect of different stages of deformation on the microstructure evolution of Ti-rich NiTi shape memory alloy. Mater. Charact. 2017, 125, 51–56. [Google Scholar] [CrossRef]
  34. Pandolfi, G.S.; Martins, S.C.; Buono, V.T.L.; Santos, L.A. Precipitation kinetics of Ti3Ni4 and multistage martensitic transformation in an aged Ni-rich Ni-Ti shape memory alloy. J. Mater. Res. Technol. 2020, 9, 9162–9173. [Google Scholar] [CrossRef]
  35. Yuan, X.B.; Chen, B.; Liu, F.S.; Xu, Q.; Ma, W. Transformation behaviors and superelasticity of Ti50Ni48Fe2 shape memory alloy subjected to cold-rolling and subsequent annealing. Rare Metals 2014, 33, 652–656. [Google Scholar] [CrossRef]
  36. Liu, Y.; Liu, F.S. Transformation behaviors of Ti48.5Ni48Fe2Nb1.5 dependence of annealing and thermomechanical cycling. Rare Metals 2012, 31, 231–236. [Google Scholar] [CrossRef]
  37. Su, P. The four-step multiple stage transformation in deformed and annealed Ti49Ni51 shape memory alloy. Acta Mater. 2012, 31, 231–236. [Google Scholar] [CrossRef]
  38. Chang, S.; Wu, S.; Chang, G. Grain size effect on multiple-stage transformations of a cold-rolled and annealed equiatomic TiNi alloy. Scr. Mater. 2005, 52, 1341–1346. [Google Scholar] [CrossRef]
  39. Yoo, K.I.; Kim, Y.J.; Shin, D.K.; Lee, J.J. Development of martensite transformation kinetics of NiTi shape memory alloys under compression. Int. J. Solids Struct. 2015, 64–65, 51–61. [Google Scholar] [CrossRef]
  40. Yan, X.J.; Van Humbeeck, J. Influence of pre-strain on recovery stress of annealed NiTi thin wire during isothermal holding. J. Alloys Compd. 2011, 509, 1001–1006. [Google Scholar] [CrossRef]
  41. Poletika, T.K.; Girsova, S.L.; Lotkov, A.I. Ti3Ni4 precipitation features in heat-treated grain/subgrain nanostructure in Ni-rich TiNi alloy. Intermetallics 2020, 127, 106966. [Google Scholar] [CrossRef]
  42. Liu, S.W.; Hui, S.X.; Li, Y.F.; Song, X.Y.; Yu, Y.; Ye, W.J. equivalent heat treatments and mechanical properties in cold-rolled TiNiFe shape-memory alloys. Materials 2023, 16, 7395. [Google Scholar] [CrossRef] [PubMed]
Figure 1. Microstructure of cold-rolled Ti50Ni47Fe3 alloy (RD for rolling direction, ND for normal direction).
Crystals 14 00360 g001
Figure 2. Schematic diagram of tensile test specimen.
Crystals 14 00360 g002
Figure 3. Microstructure and orientation analyses of TiNiFe alloy annealed at 400 °C for different times. (a,c) Annealed for 15 min; (b,d) annealed for 300 min. Among them, panels (a,b) are OM, and panels (c,d) are EBSD-IPF maps (the black area is an uncalibrated area that is difficult to calibrate due to the large amount of cold-working deformation, which is consistent with the uncalibrated areas in the other IPF maps).
Crystals 14 00360 g003
Figure 4. Microstructure and orientation analyses of Ti50Ni47Fe3 alloy annealed at 500 °C for different times. (a,d,g) Annealed for 15 min; (b,e,h) annealed for 120 min; (c,f,i) annealed for 300 min. Among them, panels (ac) are OM images, panels (df) are EBSD-IPF maps, and panels (gi) are EBSD-GOS maps.
Crystals 14 00360 g004
Figure 5. Microstructure and EBSD of Ti50Ni47Fe3 alloy annealed at 600 °C for different times. (a,e,i,m) Annealed for 15 min; (b,f,j,n) annealed for 30 min; (c,g,k,o) annealed for 60 min; (d,h,l,p) annealed for 120 min. Among them, panels (ad) are OM images, panels (eh) are EBSD-IPF maps, panels (il) are EBSD-KAM maps and EBSD-KAM numerical statistical histograms, and panels (mp) are EBSD-GOS maps.
Crystals 14 00360 g005
Figure 6. Inverse pole figures (IPFs) in the RD of Ti50Ni47Fe3 alloy with different annealing treatments. (a) Annealed at 400 °C for 15 min; (b) annealed at 400 °C for 300 min; (c) annealed at 500 °C for 15 min; (d) annealed at 500 °C for 300 min; (e) annealed at 600 °C for 15 min; (f) annealed at 600 °C for 120 min.
Crystals 14 00360 g006
Figure 7. Pole figures (PFs) of Ti50Ni47Fe3 alloy with different annealing treatments. (a) Annealed at 400 °C for 15 min; (b) annealed at 400 °C for 300 min; (c) annealed at 500 °C for 15 min; (d) annealed at 500 °C for 300 min; (e) annealed at 600 °C for 15 min; (f) annealed at 600 °C for 120 min.
Crystals 14 00360 g007
Figure 8. Orientation distribution function (ODF) sections in Euler space with constant φ2 = 45° of Ti50Ni47Fe3 alloy with different annealing treatments. (a) Annealed at 400 °C for 15 min; (b) annealed at 400 °C for 300 min; (c) annealed at 500 °C for 15 min; (d) annealed at 500 °C for 300 min; (e) annealed at 600 °C for 15 min; (f) annealed at 600 °C for 120 min.
Crystals 14 00360 g008
Figure 9. Tensile properties of Ti50Ni47Fe3 alloys with different annealing processes. (a) Annealed at 400 °C; (b) annealed at 500 °C; (c) annealed at 600 °C.
Crystals 14 00360 g009
Figure 10. Fracture characteristics of Ti50Ni47Fe3 alloys. (a,b) Annealed at 400 °C for 300 min; (c,d) annealed at 500 °C for 300 min; (e,f) annealed at 600 °C for 300 min.
Crystals 14 00360 g010
Table 1. Chemical composition of Ti50Ni47Fe3 alloy.
ElementFeNiCOTi
Content (wt.%)3.2752.160.0280.031Bal.
Disclaimer/Publisher’s Note: The statements, opinions and data contained in all publications are solely those of the individual author(s) and contributor(s) and not of MDPI and/or the editor(s). MDPI and/or the editor(s) disclaim responsibility for any injury to people or property resulting from any ideas, methods, instructions or products referred to in the content.

