
The Dynamical Properties of Three Different Variants of the Orange Carotenoid Protein: A Quasielastic Neutron Scattering Study
 , , ,
, , ,
Abstract
:1. Introduction
2. Material and Methods
2.1. Sample Preparation
2.2. QENS Experiments
2.3. QENS Data Analysis
2.4. Buffer Subtraction
3. Results
4. Discussion
4.1. Difference between Dynamics of OCP Wild Type and Mutants
4.2. Difference between the Dynamics of OCP Mutants
Author Contributions
Funding
Data Availability Statement
Acknowledgments
Conflicts of Interest
References
- Lokstein, H.; Renger, G.; Gotze, J.P. Photosynthetic Light-Harvesting (Antenna) Complexes-Structures and Functions. Molecules 2021, 26, 3378. [Google Scholar] [CrossRef] [PubMed]
- Wilson, A.; Andreeva, E.A.; Nizinski, S.; Talbot, L.; Hartmann, E.; Schlichting, I.; Burdzinski, G.; Sliwa, M.; Kirilovsky, D.; Colletier, J.P. Structure-function-dynamics relationships in the peculiar PCC7805 OCP1: Impact of his-tagging and carotenoid type. Biochim. Biophys. Acta (BBA)—Bioenerg. 2022, 1863, 148584. [Google Scholar] [CrossRef] [PubMed]
- Khorobrykh, S.; Havurinne, V.; Mattila, H.; Tyystjarvi, E. Oxygen and ROS in Photosynthesis. Plants 2020, 9, 91. [Google Scholar] [CrossRef]
- Slonimskiy, Y.B.; Zupnik, A.O.; Varfolomeeva, L.A.; Boyko, K.M.; Maksimov, E.G.; Sluchanko, N.N. A primordial Orange Carotenoid Protein: Structure, photoswitching activity and evolutionary aspects. Int. J. Biol. Macromol. 2022, 222, 167–180. [Google Scholar] [CrossRef] [PubMed]
- Vialet-Chabrand, S.; Matthews, J.S.; Simkin, A.J.; Raines, C.A.; Lawson, T. Importance of Fluctuations in Light on Plant Photosynthetic Acclimation. Plant Physiol. 2017, 173, 2163–2179. [Google Scholar] [CrossRef] [PubMed]
- Kirilovsky, D.; Kerfeld, C.A. The orange carotenoid protein in photoprotection of photosystem II in cyanobacteria. Biochim. Biophys. Acta 2012, 1817, 158–166. [Google Scholar] [CrossRef] [PubMed]
- Adir, N.; Bar-Zvi, S.; Harris, D. The amazing phycobilisome. Biochim. Biophys. Acta (BBA)—Bioenerg. 2020, 1861, 148047. [Google Scholar] [CrossRef] [PubMed]
- Niyogi, K.K.; Truong, T.B. Evolution of flexible non-photochemical quenching mechanisms that regulate light harvesting in oxygenic photosynthesis. Curr. Opin. Plant Biol. 2013, 16, 307–314. [Google Scholar] [CrossRef] [PubMed]
- Leccese, S.; Onfroy, T.; Wilson, A.; Kirilovsky, D.; Casale, S.; Guira, S.; Selmane, M.; Jolivalt, C.; Mezzetti, A. Immobilization of Orange Carotenoid Protein on mesoporous silica SBA-15 for the development of photoactivable nanodevices. Microporous Mesoporous Mater. 2022, 340, 112007. [Google Scholar] [CrossRef]
- Kirilovsky, D.; Kerfeld, C.A. The Orange Carotenoid Protein: A blue-green light photoactive protein. Photochem. Photobiol. Sci. 2013, 12, 1135–1143. [Google Scholar] [CrossRef]
- Wilson, A.; Muzzopappa, F.; Kirilovsky, D. Elucidation of the essential amino acids involved in the binding of the cyanobacterial Orange Carotenoid Protein to the phycobilisome. Biochim. Biophys. Acta (BBA)—Bioenerg. 2022, 1863, 148504. [Google Scholar] [CrossRef]
- Sluchanko, N.N.; Slonimskiy, Y.B.; Moldenhauer, M.; Friedrich, T.; Maksimov, E.G. Deletion of the short N-terminal extension in OCP reveals the main site for FRP binding. FEBS Lett. 2017, 591, 1667–1676. [Google Scholar] [CrossRef]
- Chukhutsina, V.U.; van Thor, J.J. Molecular activation mechanism and structural dynamics of orange carotenoid protein. Physchem 2022, 2, 235–252. [Google Scholar] [CrossRef]
- Golub, M.; Moldenhauer, M.; Schmitt, F.J.; Feoktystov, A.; Mandar, H.; Maksimov, E.; Friedrich, T.; Pieper, J. Solution Structure and Conformational Flexibility in the Active State of the Orange Carotenoid Protein: Part I. Small-Angle Scattering. J. Phys. Chem. B 2019, 123, 9525–9535. [Google Scholar] [CrossRef]
- Yaroshevich, I.A.; Maksimov, E.G.; Sluchanko, N.N.; Zlenko, D.V.; Stepanov, A.V.; Slutskaya, E.A.; Slonimskiy, Y.B.; Botnarevskii, V.S.; Remeeva, A.; Gushchin, I.; et al. Role of hydrogen bond alternation and charge transfer states in photoactivation of the Orange Carotenoid Protein. Commun. Biol. 2021, 4, 539. [Google Scholar] [CrossRef]
- Chukhutsina, V.U.; Baxter, J.M.; Fadini, A.; Morgan, R.M.; Pope, M.A.; Maghlaoui, K.; Orr, C.M.; Wagner, A.; van Thor, J.J. Light activation of Orange Carotenoid Protein reveals bicycle-pedal single-bond isomerization. Nat. Commun. 2022, 13, 6420. [Google Scholar] [CrossRef]
- Liguori, N.; Van Stokkum, I.H.M.; Muzzopappa, F.; Kennis, J.T.M.; Kirilovsky, D.; Croce, R. The molecular origin of the OCP-dependent non-photochemical quenching mechanism in cyanobacteria. ChemRxiv 2022, 1, 1–26. [Google Scholar] [CrossRef]
- Thurotte, A.; Lopez-Igual, R.; Wilson, A.; Comolet, L.; Bourcier de Carbon, C.; Xiao, F.; Kirilovsky, D. Regulation of Orange Carotenoid Protein Activity in Cyanobacterial Photoprotection. Plant Physiol. 2015, 169, 737–747. [Google Scholar] [CrossRef]
- Nizinski, S.; Wilson, A.; Uriarte, L.M.; Ruckebusch, C.; Andreeva, E.A.; Schlichting, I.; Colletier, J.P.; Kirilovsky, D.; Burdzinski, G.; Sliwa, M. Unifying Perspective of the Ultrafast Photodynamics of Orange Carotenoid Proteins from Synechocystis: Peril of High-Power Excitation, Existence of Different S* States, and Influence of Tagging. JACS Au 2022, 2, 1084–1095. [Google Scholar] [CrossRef]
- Gupta, S.; Guttman, M.; Leverenz, R.L.; Zhumadilova, K.; Pawlowski, E.G.; Petzold, C.J.; Lee, K.K.; Ralston, C.Y.; Kerfeld, C.A. Local and global structural drivers for the photoactivation of the orange carotenoid protein. Proc. Natl. Acad. Sci. USA 2015, 112, E5567–E5574. [Google Scholar] [CrossRef]
- Andreeva, E.A.; Nizinski, S.; Wilson, A.; Levantino, M.; De Zitter, E.; Munro, R.; Muzzopappa, F.; Thureau, A.; Zala, N.; Burdzinski, G.; et al. Oligomerization processes limit photoactivation and recovery of the orange carotenoid protein. Biophys. J. 2022, 121, 2849–2872. [Google Scholar] [CrossRef]
- Dominguez-Martin, M.A.; Sauer, P.V.; Kirst, H.; Sutter, M.; Bina, D.; Greber, B.J.; Nogales, E.; Polivka, T.; Kerfeld, C.A. Structures of a phycobilisome in light-harvesting and photoprotected states. Nature 2022, 609, 835–845. [Google Scholar] [CrossRef]
- Gabel, F.; Bicout, D.; Lehnert, U.; Tehei, M.; Weik, M.; Zaccai, G. Protein Dynamics Studied by Neutron Scattering. Q. Rev. Biophys. 2002, 35, 327–367. [Google Scholar] [CrossRef]
- Sacquin-Mora, S.; Sebban, P.; Derrien, V.; Frick, B.; Lavery, R.; Alba-Simionesco, C. Probing the flexibility of the bacterial reaction center: The wild-type protein is more rigid than two site-specific mutants. Biochemistry 2007, 46, 14960–14968. [Google Scholar] [CrossRef]
- Pieper, J.; Trapp, M.; Skomorokhov, A.; Natkaniec, I.; Peters, J.; Renger, G. Temperature-dependent vibrational and conformational dynamics of photosystem II membrane fragments from spinach investigated by elastic and inelastic neutron scattering. Biochim. Biophys. Acta (BBA)—Bioenerg. 2012, 1817, 1213–1219. [Google Scholar] [CrossRef]
- Nalepa, A.; Malferrari, M.; Lubitz, W.; Venturoli, G.; Mobius, K.; Savitsky, A. Local water sensing: Water exchange in bacterial photosynthetic reaction centers embedded in a trehalose glass studied using multiresonance EPR. Phys. Chem. Chem. Phys. 2017, 19, 28388–28400. [Google Scholar] [CrossRef]
- Kneller, G.R. Quasielastic Neutron Scattering and Relaxation Processes in Proteins: Analytical and Simulation-Based Models. Phys. Chem. Chem. Phys. 2005, 7, 2641–2655. [Google Scholar] [CrossRef]
- Haertlein, M.; Moulin, M.; Devos, J.M.; Laux, V.; Dunne, O.; Forsyth, V.T. Biomolecular Deuteration for Neutron Structural Biology and Dynamics. Methods Enzymol. 2016, 566, 113–157. [Google Scholar] [CrossRef]
- Vural, D.; Hu, X.; Lindner, B.; Jain, N.; Miao, Y.; Cheng, X.; Liu, Z.; Hong, L.; Smith, J.C. Quasielastic Neutron Scattering in Biology: Theory and Applications. Biochim. Biophys. Acta 2017, 1861, 3638–3650. [Google Scholar] [CrossRef]
- Lehnert, U.; Reat, V.; Weik, M.; Zaccai, G.; Pfister, C. Thermal motions in bacteriorhodopsin at different hydration levels studied by neutron scattering: Correlation with kinetics and light-induced conformational changes. Biophys. J. 1998, 75, 1945–1952. [Google Scholar] [CrossRef]
- Fitter, J. The Temperature Dependence of Internal Molecular Motions in Hydrated and Dry Alpha-Amylase: The Role of Hydration Water in the Dynamical Transition of Proteins. Biophys. J. 1999, 76, 1034–1042. [Google Scholar] [CrossRef]
- Pieper, J.; Hauss, T.; Buchsteiner, A.; Renger, G. The Effect of Hydration on Protein Flexibility in Photosystem II of Green Plants Studied by Quasielastic Neutron Scattering. Eur. Biophys. J. 2008, 37, 657–663. [Google Scholar] [CrossRef]
- Golub, M.; Rusevich, L.; Irrgang, K.D.; Pieper, J. Rigid versus Flexible Protein Matrix: Light-Harvesting Complex II Exhibits a Temperature-Dependent Phonon Spectral Density. J. Phys. Chem. B 2018, 122, 7111–7121. [Google Scholar] [CrossRef]
- Ptitsyn, O.B. Molten Globule and Protein Folding. Adv. Protein Chem. 1995, 47, 83–229. [Google Scholar] [CrossRef]
- Rodriguez-Velamazan, J.A.; Gonzalez, M.A.; Real, J.A.; Castro, M.; Munoz, M.C.; Gaspar, A.B.; Ohtani, R.; Ohba, M.; Yoneda, K.; Hijikata, Y.; et al. A switchable molecular rotator: Neutron spectroscopy study on a polymeric spin-crossover compound. J. Am. Chem. Soc. 2012, 134, 5083–5089. [Google Scholar] [CrossRef]
- Golub, M.; Moldenhauer, M.; Schmitt, F.J.; Lohstroh, W.; Friedrich, T.; Pieper, J. Light-Induced Conformational Flexibility of the Orange Carotenoid Protein Studied by Quasielastic Neutron Scattering with In Situ Illumination. J. Phys. Chem. Lett. 2023, 14, 295–301. [Google Scholar] [CrossRef]
- Golub, M.; Moldenhauer, M.; Schmitt, F.J.; Lohstroh, W.; Maksimov, E.G.; Friedrich, T.; Pieper, J. Solution Structure and Conformational Flexibility in the Active State of the Orange Carotenoid Protein. Part II: Quasielastic Neutron Scattering. J. Phys. Chem. B 2019, 123, 9536–9545. [Google Scholar] [CrossRef]
- Arnold, O.; Bilheux, J.-C.; Borreguero, J.M.; Buts, A.; Campbell, S.I.; Chapon, L.; Doucet, M.; Draper, N.; Leal, R.F.; Gigg, M.A. Mantid—Data analysis and visualization package for neutron scattering and μ SR experiments. In Nuclear Instruments and Methods in Physics Research Section A: Accelerators, Spectrometers, Detectors and Associated Equipment; Elsevier: Amsterdam, The Netherlands, 2014. [Google Scholar]
- Rok, M.; Bator, G.; Zarychta, B.; Dziuk, B.; Repec, J.; Medycki, W.; Zamponi, M.; Usevicius, G.; Simenas, M.; Banys, J. Isostructural phase transition, quasielastic neutron scattering and magnetic resonance studies of a bistable dielectric ion-pair crystal [(CH3)2NH2]2KCr(CN)6. Dalton Trans. 2019, 48, 4190–4202. [Google Scholar] [CrossRef]
- Stevenson, K.J. Review of OriginPro 8.5. J. Am. Chem. Soc. 2011, 133, 5621. [Google Scholar] [CrossRef]
- NaraseGowda, S.; Brown, C.M.; Tyagi, M.; Jenkins, T.; Dobbins, T.A. Quasi-Elastic Neutron Scattering Studies of Hydrogen Dynamics for Nanoconfined NaAlH4. J. Phys. Chem. C 2016, 120, 14863–14873. [Google Scholar] [CrossRef]
- Tripathi, A.K.; Sahasrabudhe, A.; Mitra, S.; Mukhopadhyay, R.; Gupta, N.M.; Kartha, V.B. QENS and FTIR studies on binding states of benzene molecules adsorbed in zeolite HZSM-5 at room temperature. Phys. Chem. Chem. Phys. 2001, 3, 4449–4455. [Google Scholar] [CrossRef]
- Golub, M.; Koppel, M.; Pikma, P.; Frick, B.; Pieper, J. Dynamics–Function Correlation in Photosystem II: Molecular Dynamics in Solution. Crystals 2023, 13, 1441. [Google Scholar] [CrossRef]
- Tarek, M.; Tobias, D. Role of protein-water hydrogen bond dynamics in the protein dynamical transition. Phys. Rev. Lett. 2002, 88, 138101. [Google Scholar] [CrossRef] [PubMed]
- Grdadolnik, J.; Merzel, F.; Avbelj, F. Origin of hydrophobicity and enhanced water hydrogen bond strength near purely hydrophobic solutes. Proc. Natl. Acad. Sci. USA 2017, 114, 322–327. [Google Scholar] [CrossRef]


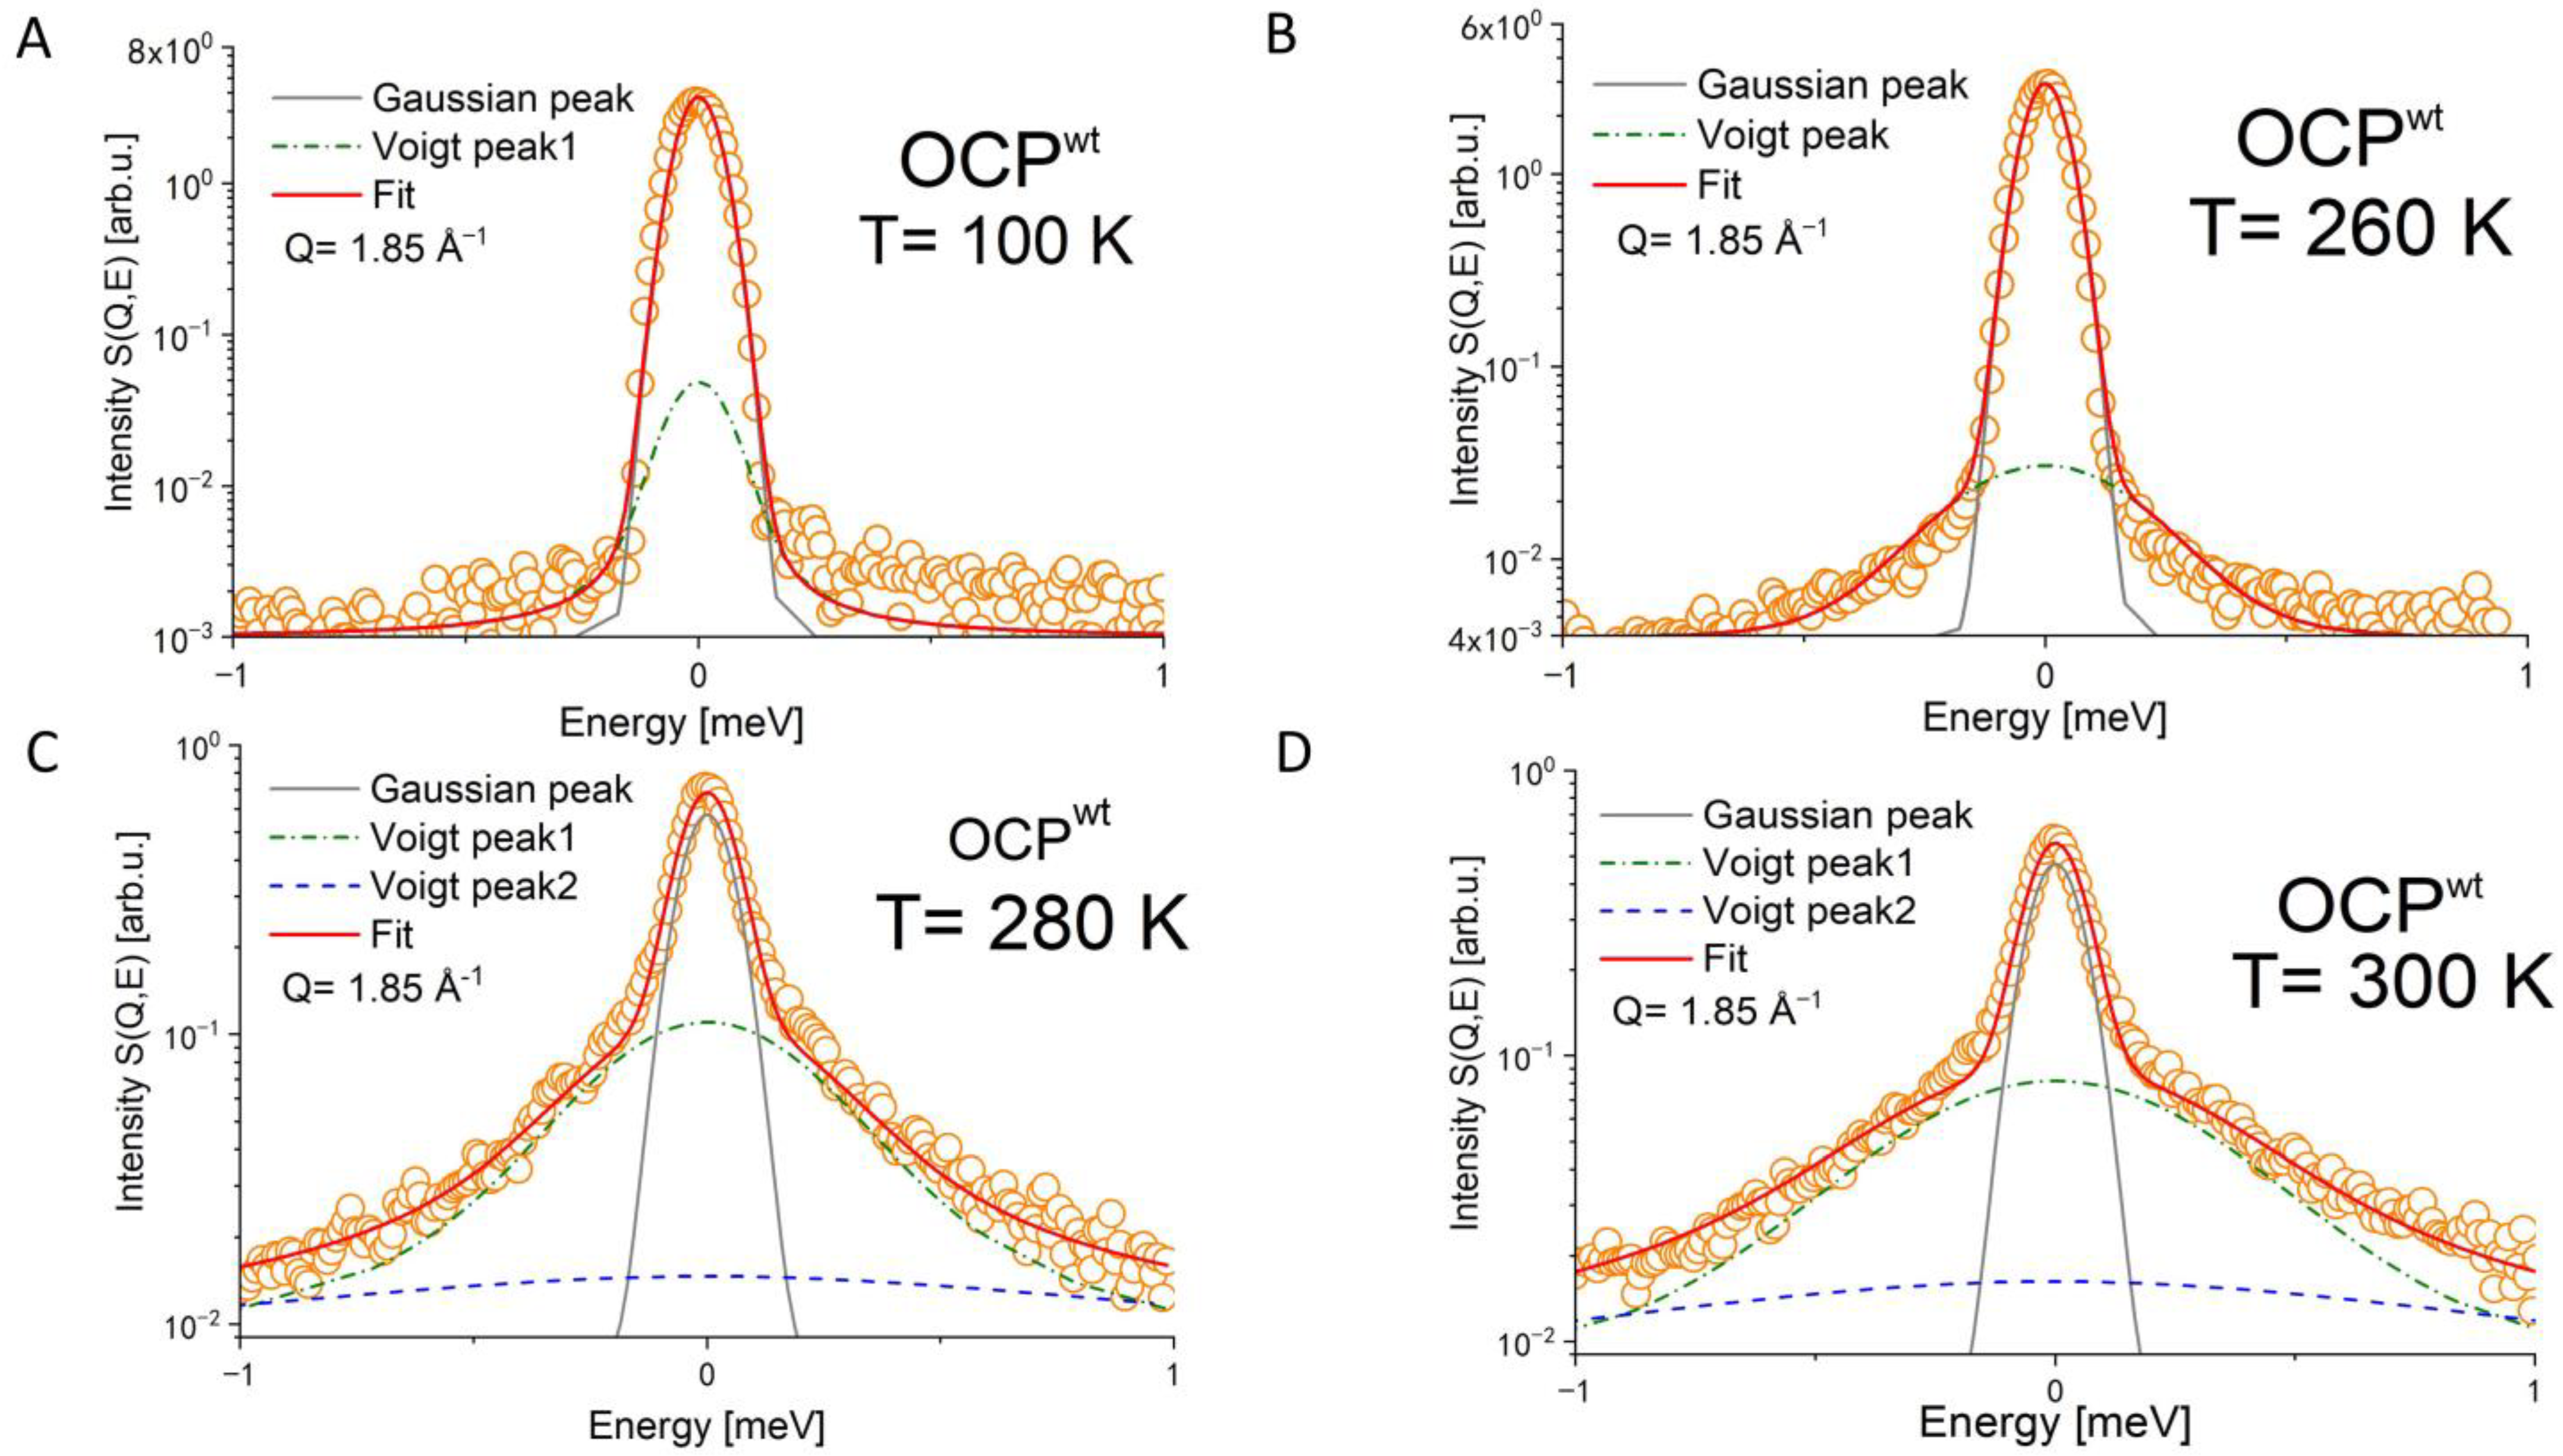
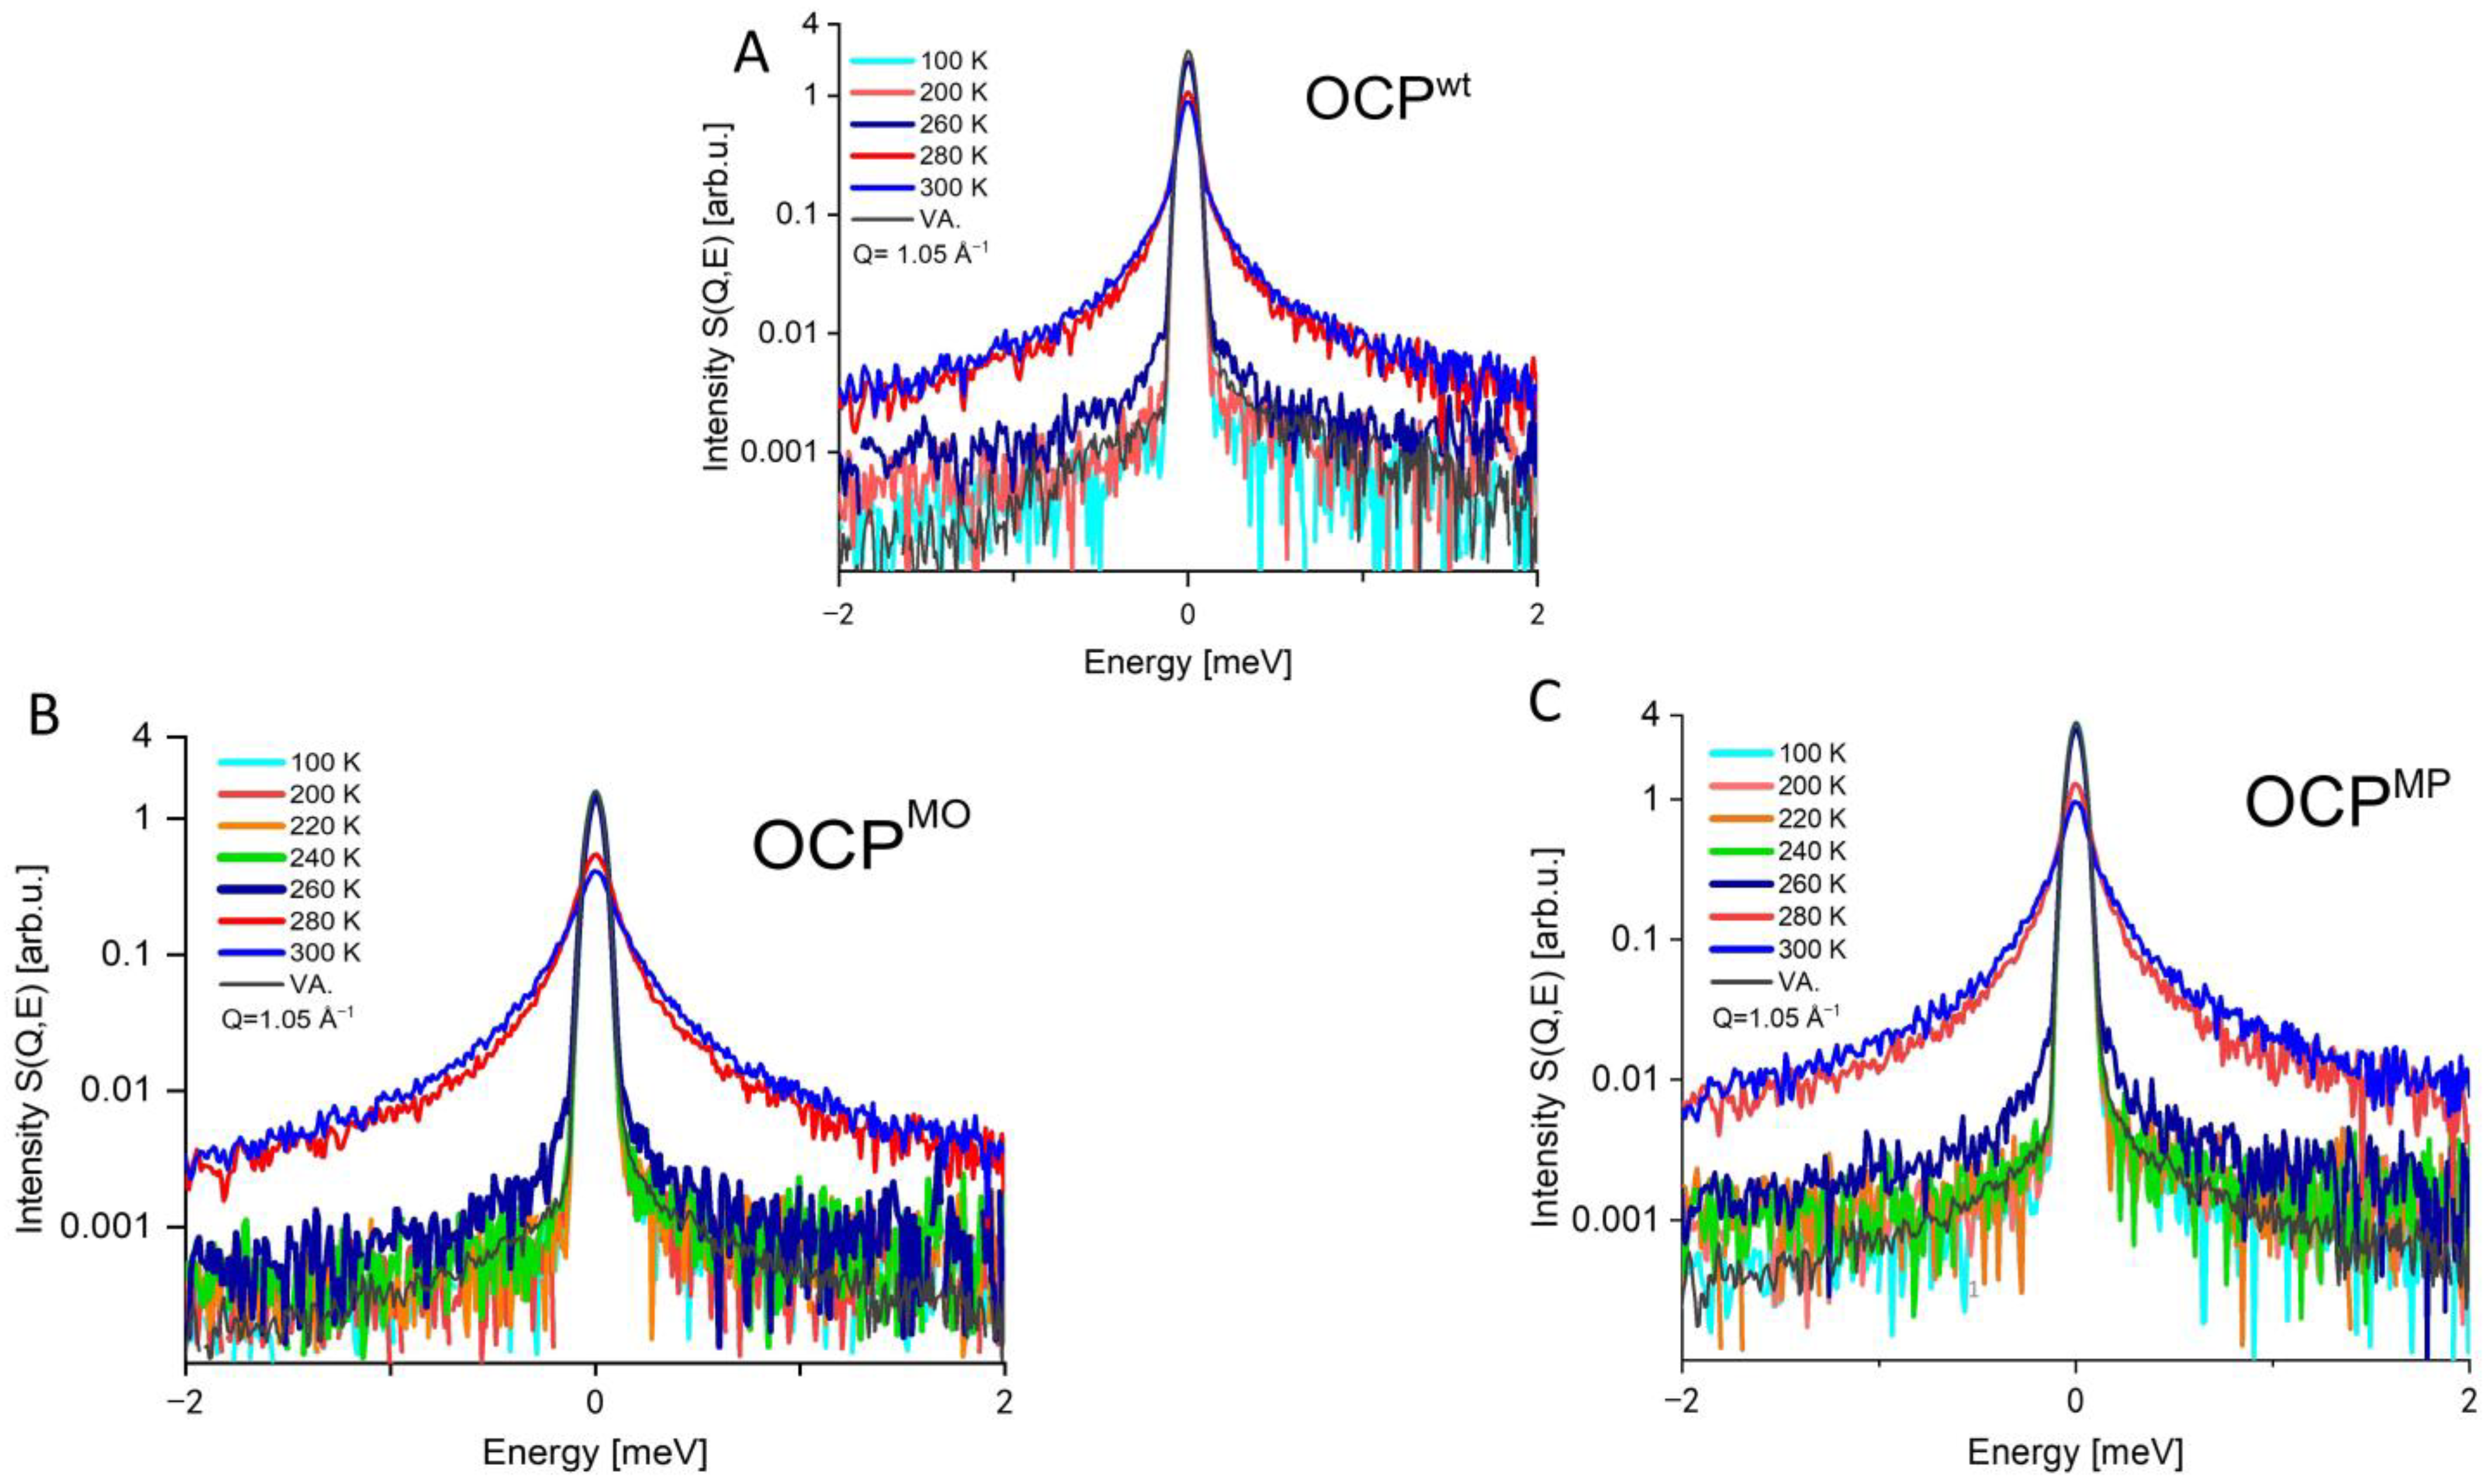
| Temperature | OCPwt FWHM [meV] | OCPMO FWHM [meV] | OCPMP FWHM [meV] |
|---|---|---|---|
| 100 K | 0.04 | 0.10 | 0.15 |
| 200 K | 0.04 | 0.13 | 0.17 |
| 220 K | 0.04 | 0.15 | 0.22 |
| 240 K | 0.04 | 0.18 | 0.25 |
| 260 K | 0.09 | 0.2 | 0.27 |
| OCPwt280° | OCPMO280° | OCPMP280° | OCPwt300° | OCPMO300° | OCPMP300° | |
|---|---|---|---|---|---|---|
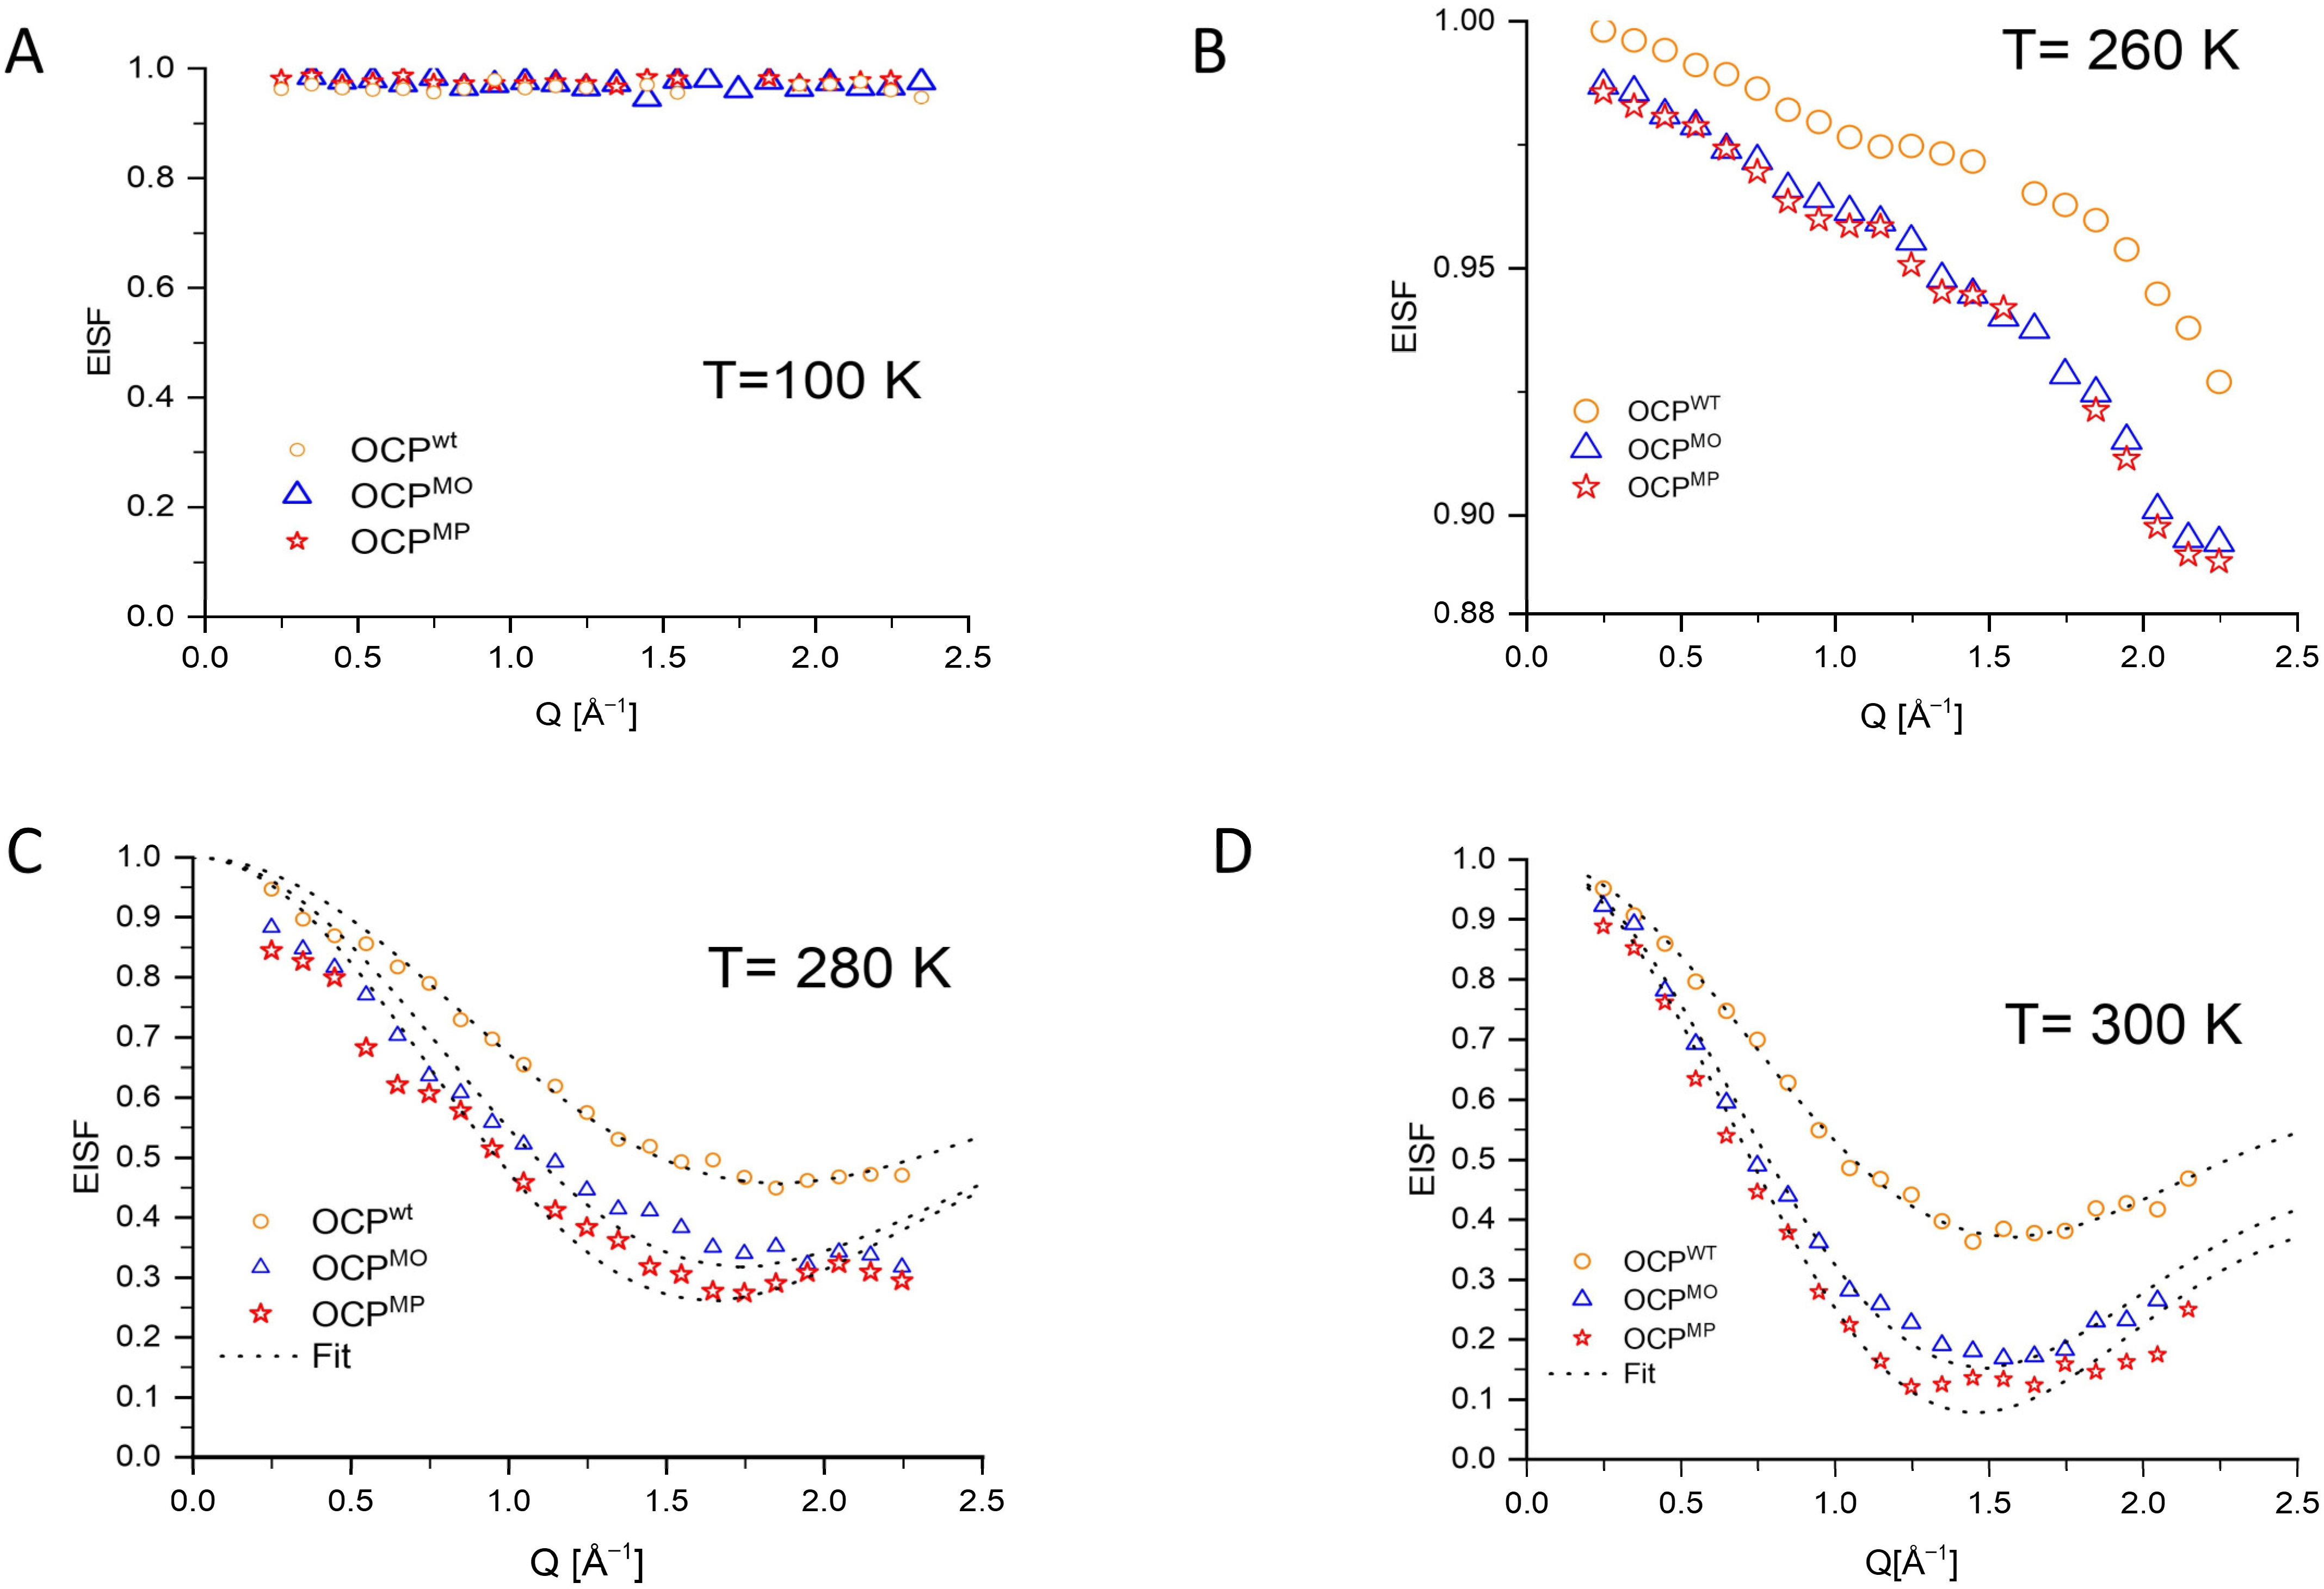
| F | 0.547 ± 0.006 | 0.687 ± 0.015 | 0.744 ± 0.016 | 0.633 ± 0.003 | 0.854 ± 0.007 | 0.930 ± 0.010 |
| r [Å] | 1.274 ± 0.021 | 1.363 ± 0.039 | 1.440 ± 0.041 | 1.501 ± 0.012 | 1.59 ± 0.016 | 1.620 ± 0.022 |
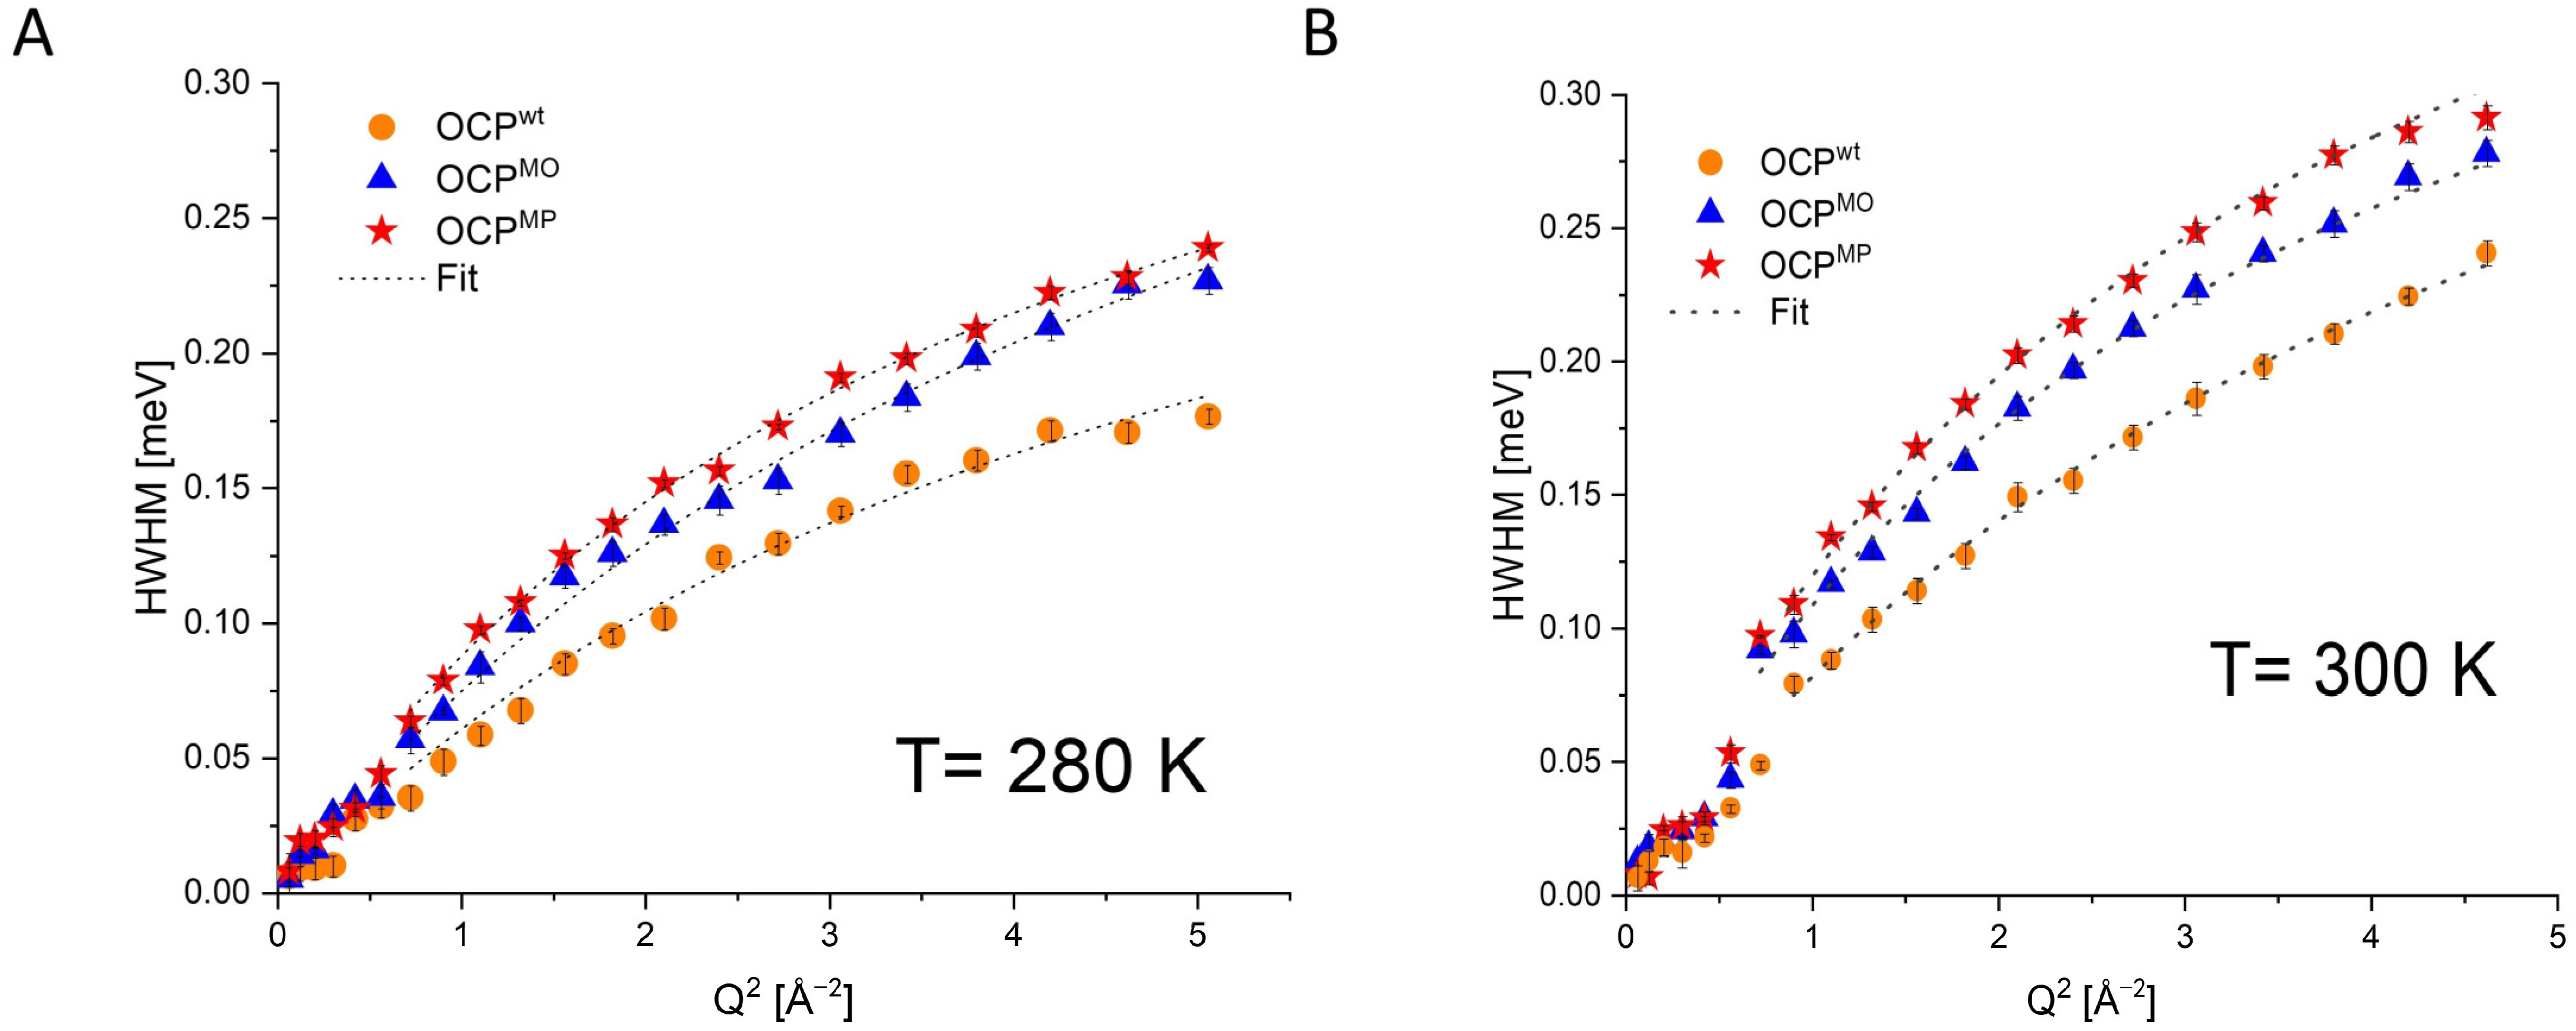
| D [meV2] | 0.069 ± 0.004 | 0.094 ± 0.001 | 0.105 ± 0.002 | 0.106 ± 0.001 | 0.142 ± 0.002 | 0.167 ± 0.002 |
| Γ [meV−1] | 2.437 ± 0.229 | 2.36 ± 0.094 | 2.22 ± 0.056 | 2.316 ± 0.067 | 2.182 ± 0.023 | 2.110 ± 0.03 |
| D [10−5 cm2/s] | 1.04 | 1.42 | 1.59 | 1.61 | 2.21 | 2.25 |
| τ [ps] | 1.6 | 1.55 | 1.46 | 1.52 | 1.43 | 1.38 |
Disclaimer/Publisher’s Note: The statements, opinions and data contained in all publications are solely those of the individual author(s) and contributor(s) and not of MDPI and/or the editor(s). MDPI and/or the editor(s) disclaim responsibility for any injury to people or property resulting from any ideas, methods, instructions or products referred to in the content. |
© 2024 by the authors. Licensee MDPI, Basel, Switzerland. This article is an open access article distributed under the terms and conditions of the Creative Commons Attribution (CC BY) license (https://creativecommons.org/licenses/by/4.0/).
Share and Cite
Hajizadeh, M.; Golub, M.; Moldenhauer, M.; Lohstroh, W.; Friedrich, T.; Pieper, J. The Dynamical Properties of Three Different Variants of the Orange Carotenoid Protein: A Quasielastic Neutron Scattering Study. Crystals 2024, 14, 361. https://doi.org/10.3390/cryst14040361
Hajizadeh M, Golub M, Moldenhauer M, Lohstroh W, Friedrich T, Pieper J. The Dynamical Properties of Three Different Variants of the Orange Carotenoid Protein: A Quasielastic Neutron Scattering Study. Crystals. 2024; 14(4):361. https://doi.org/10.3390/cryst14040361
Chicago/Turabian StyleHajizadeh, Mina, Maksym Golub, Marcus Moldenhauer, Wiebke Lohstroh, Thomas Friedrich, and Jörg Pieper. 2024. "The Dynamical Properties of Three Different Variants of the Orange Carotenoid Protein: A Quasielastic Neutron Scattering Study" Crystals 14, no. 4: 361. https://doi.org/10.3390/cryst14040361