
Nanocrystalline Iron Oxides with Various Average Crystallite Size Investigated Using Magnetic Resonance Method

 ,
,
Abstract
:1. Introduction
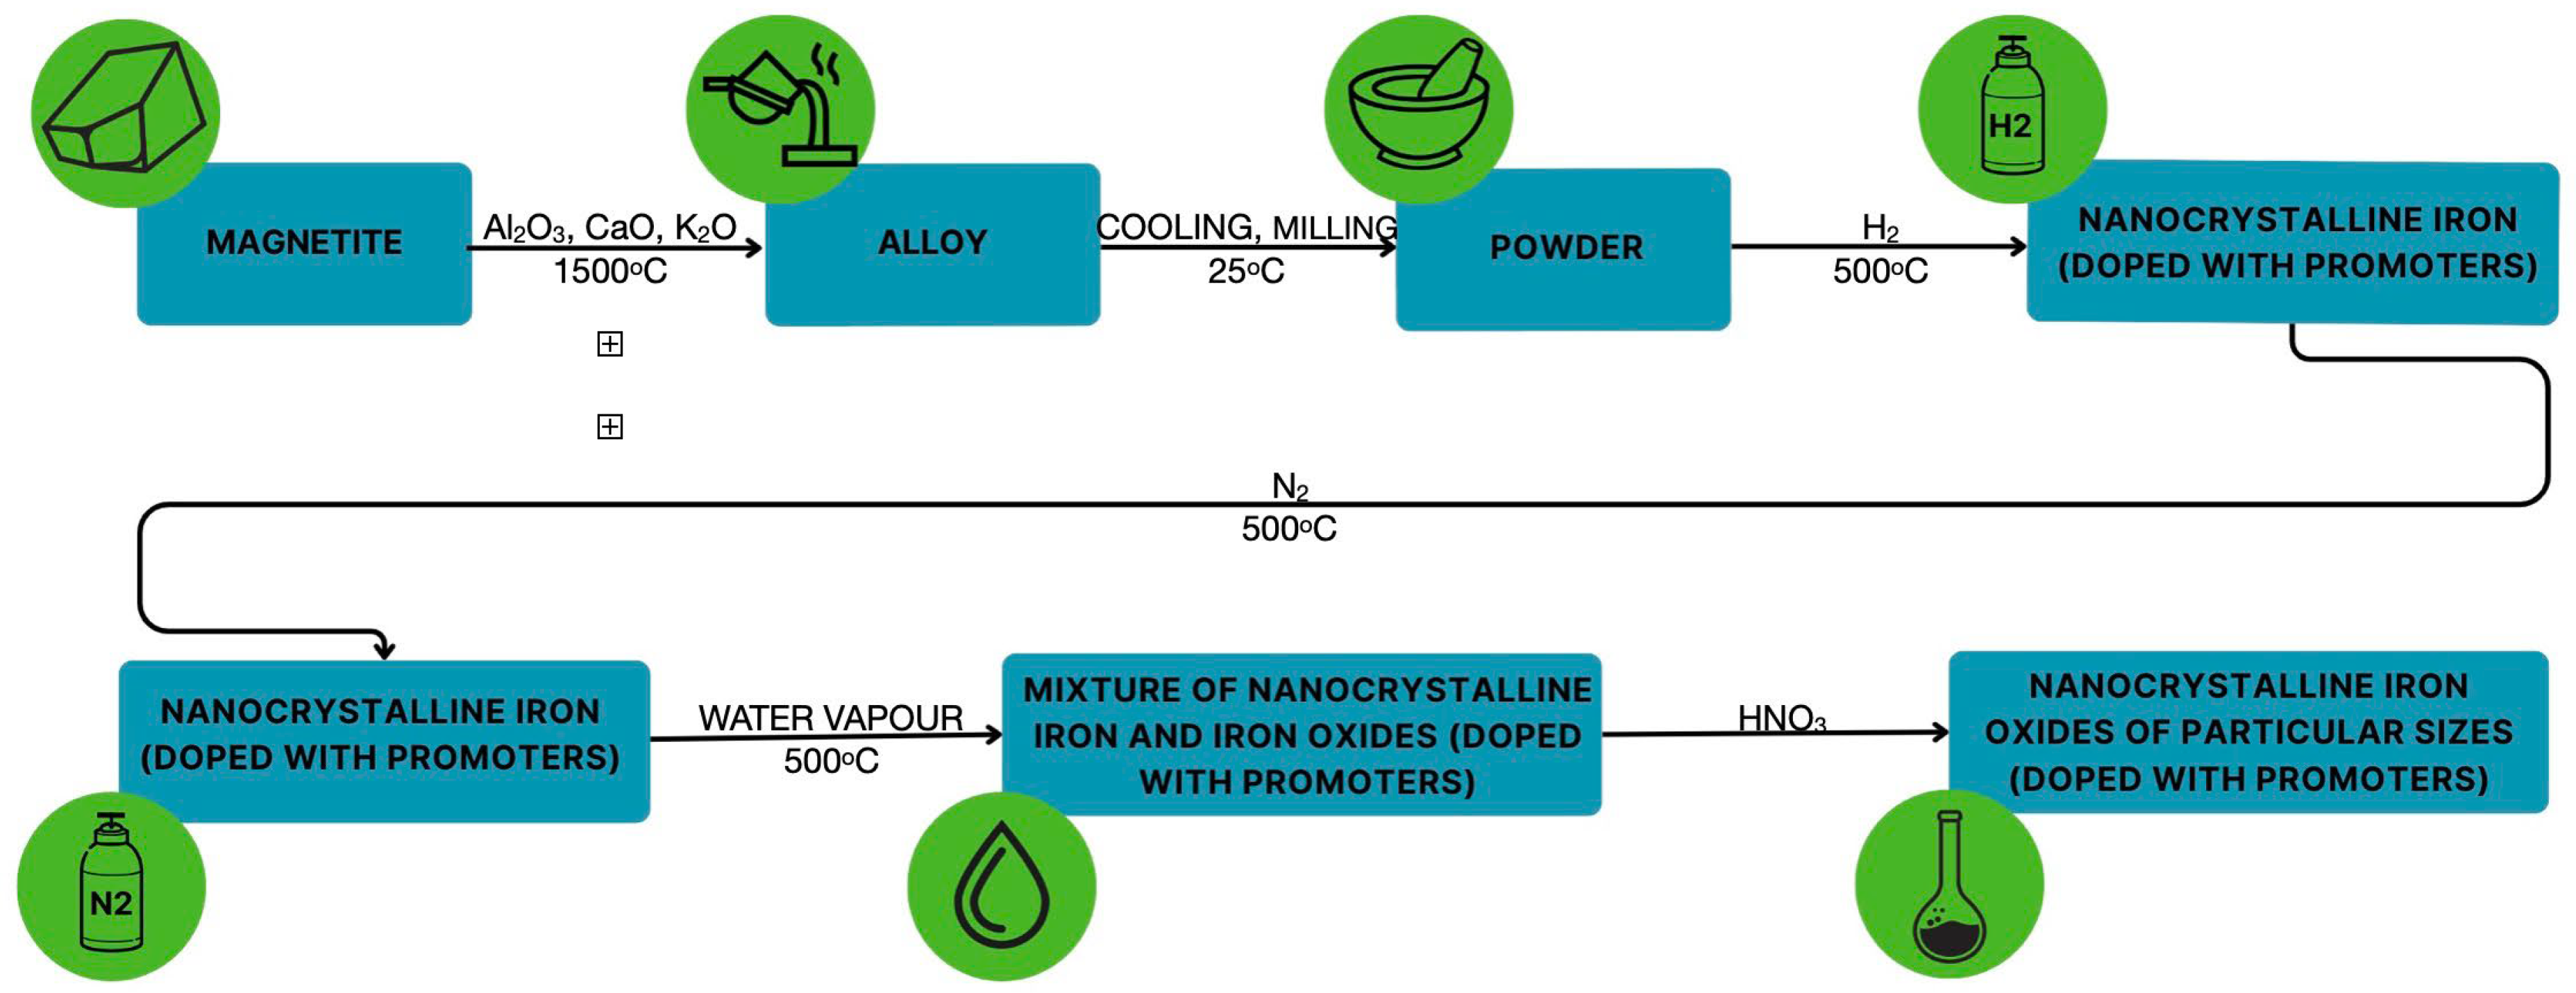
2. Experimental
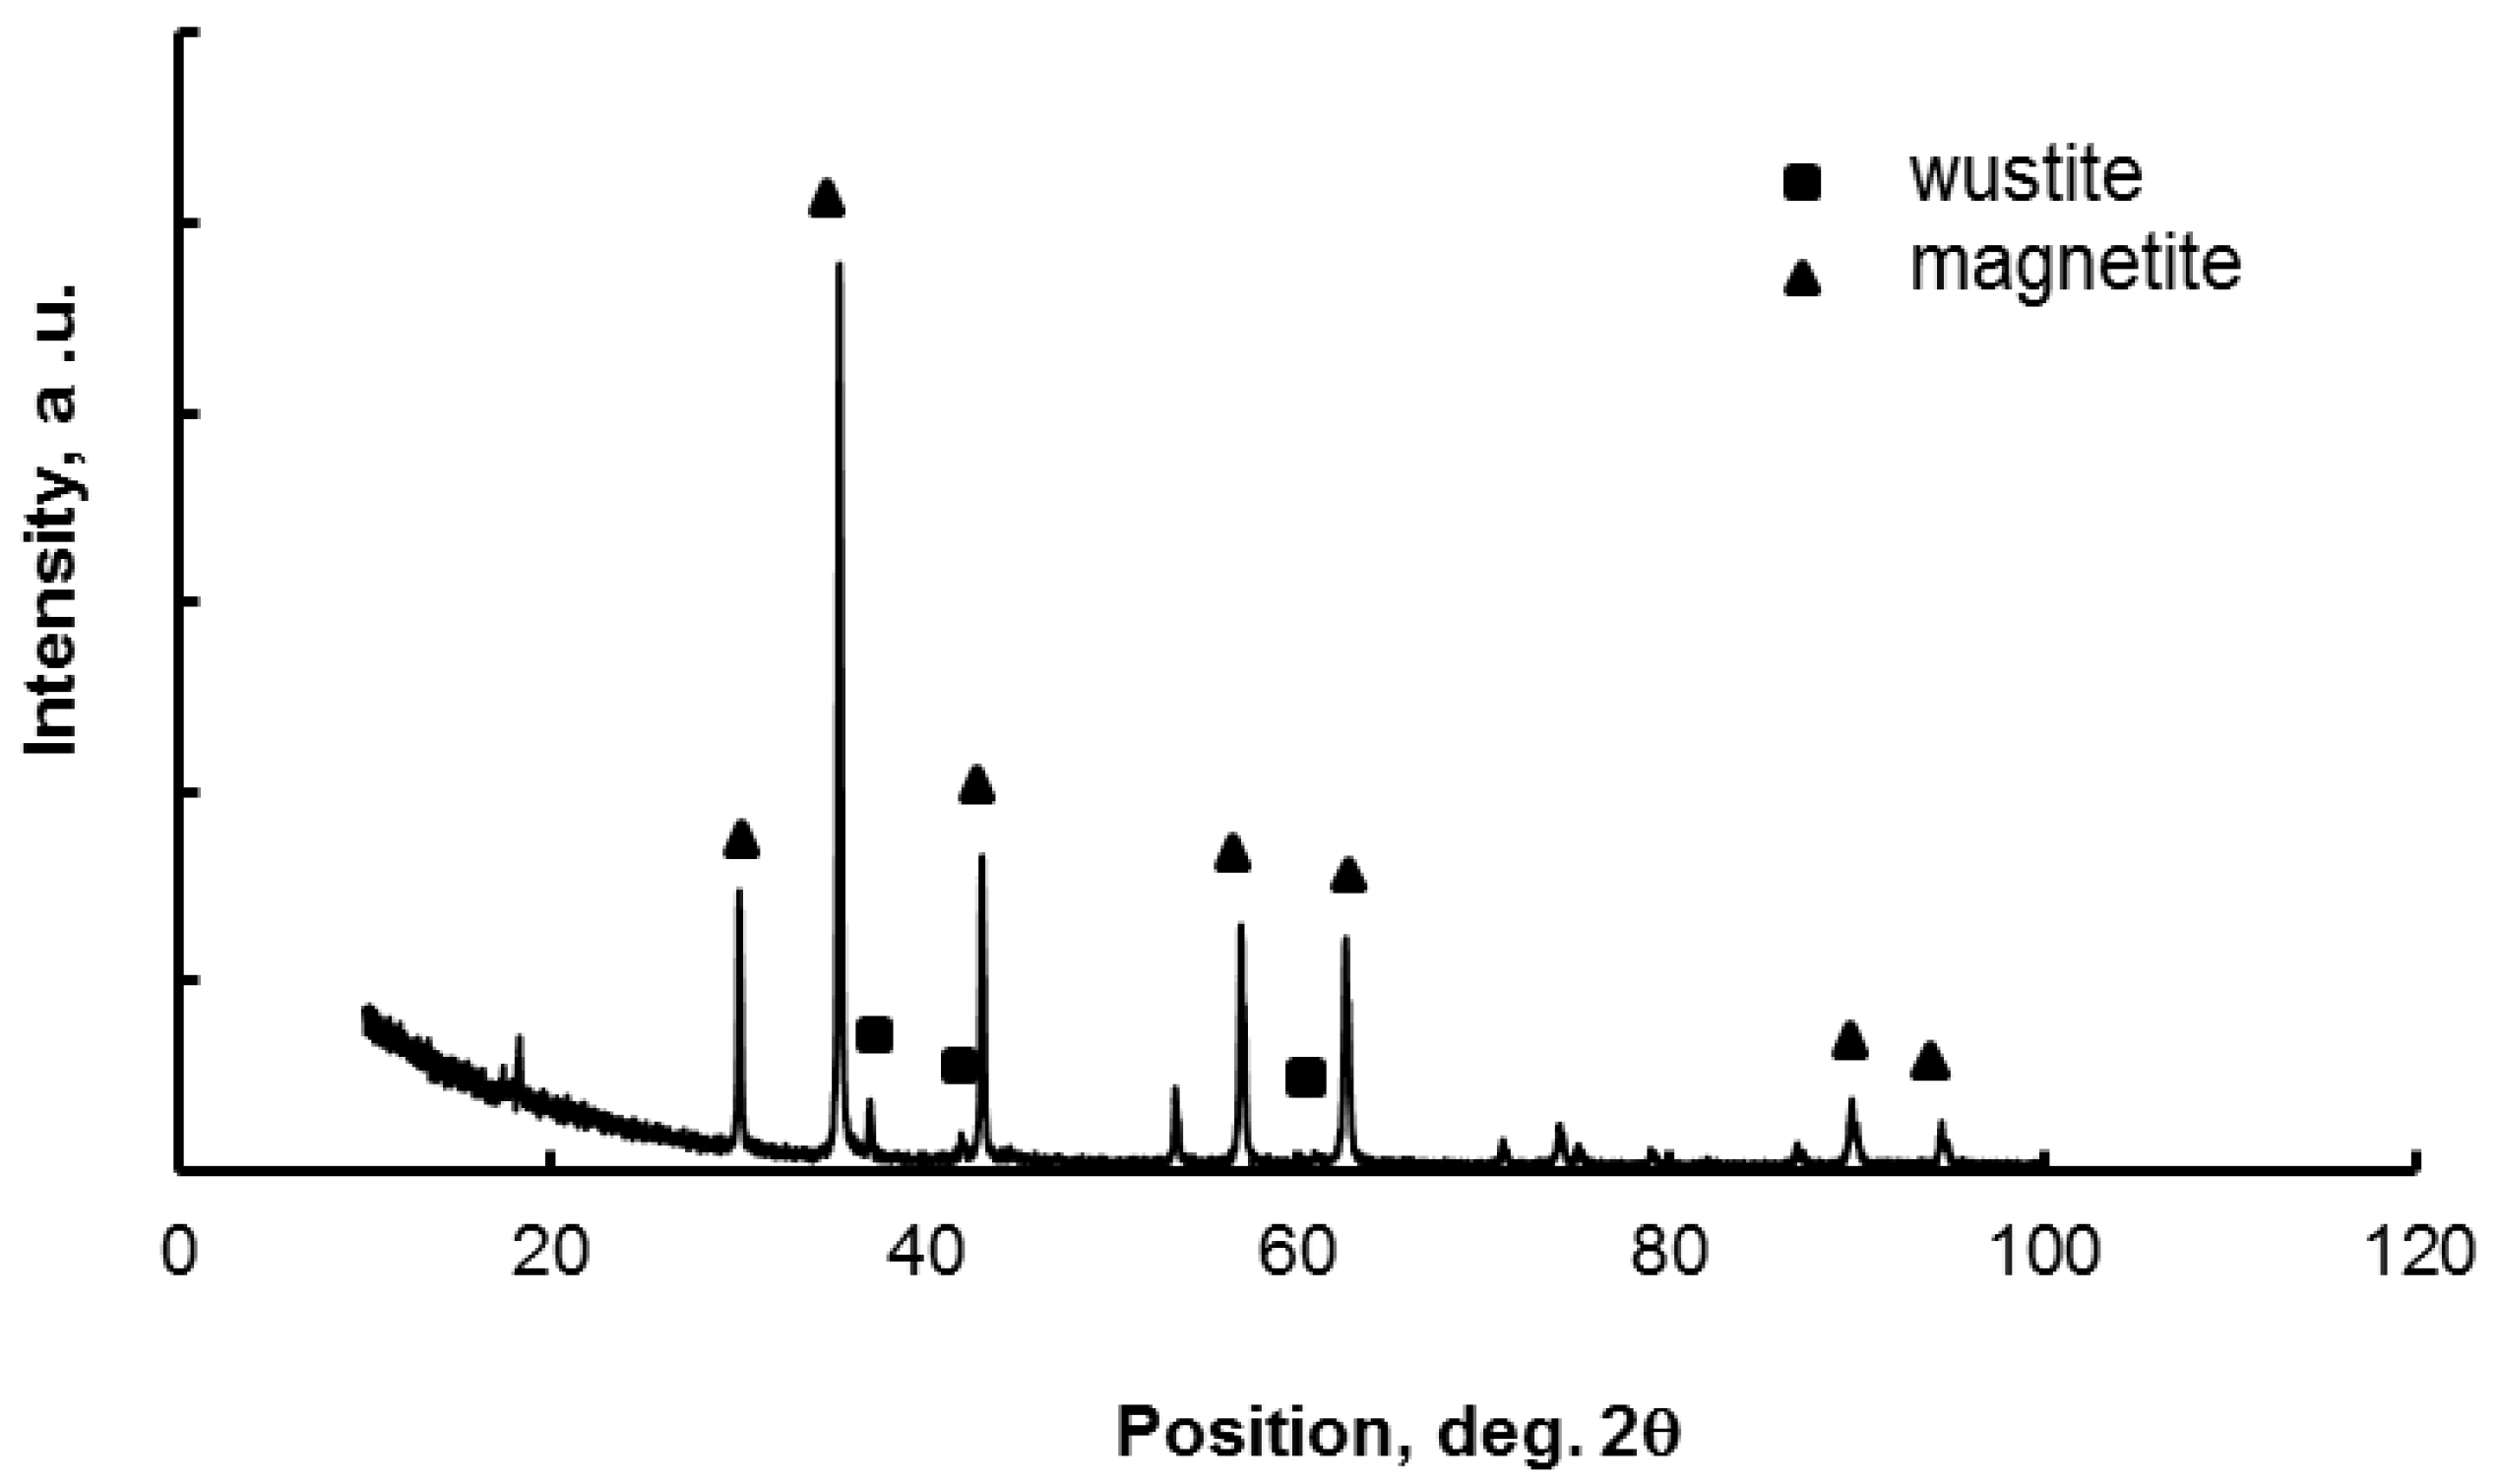
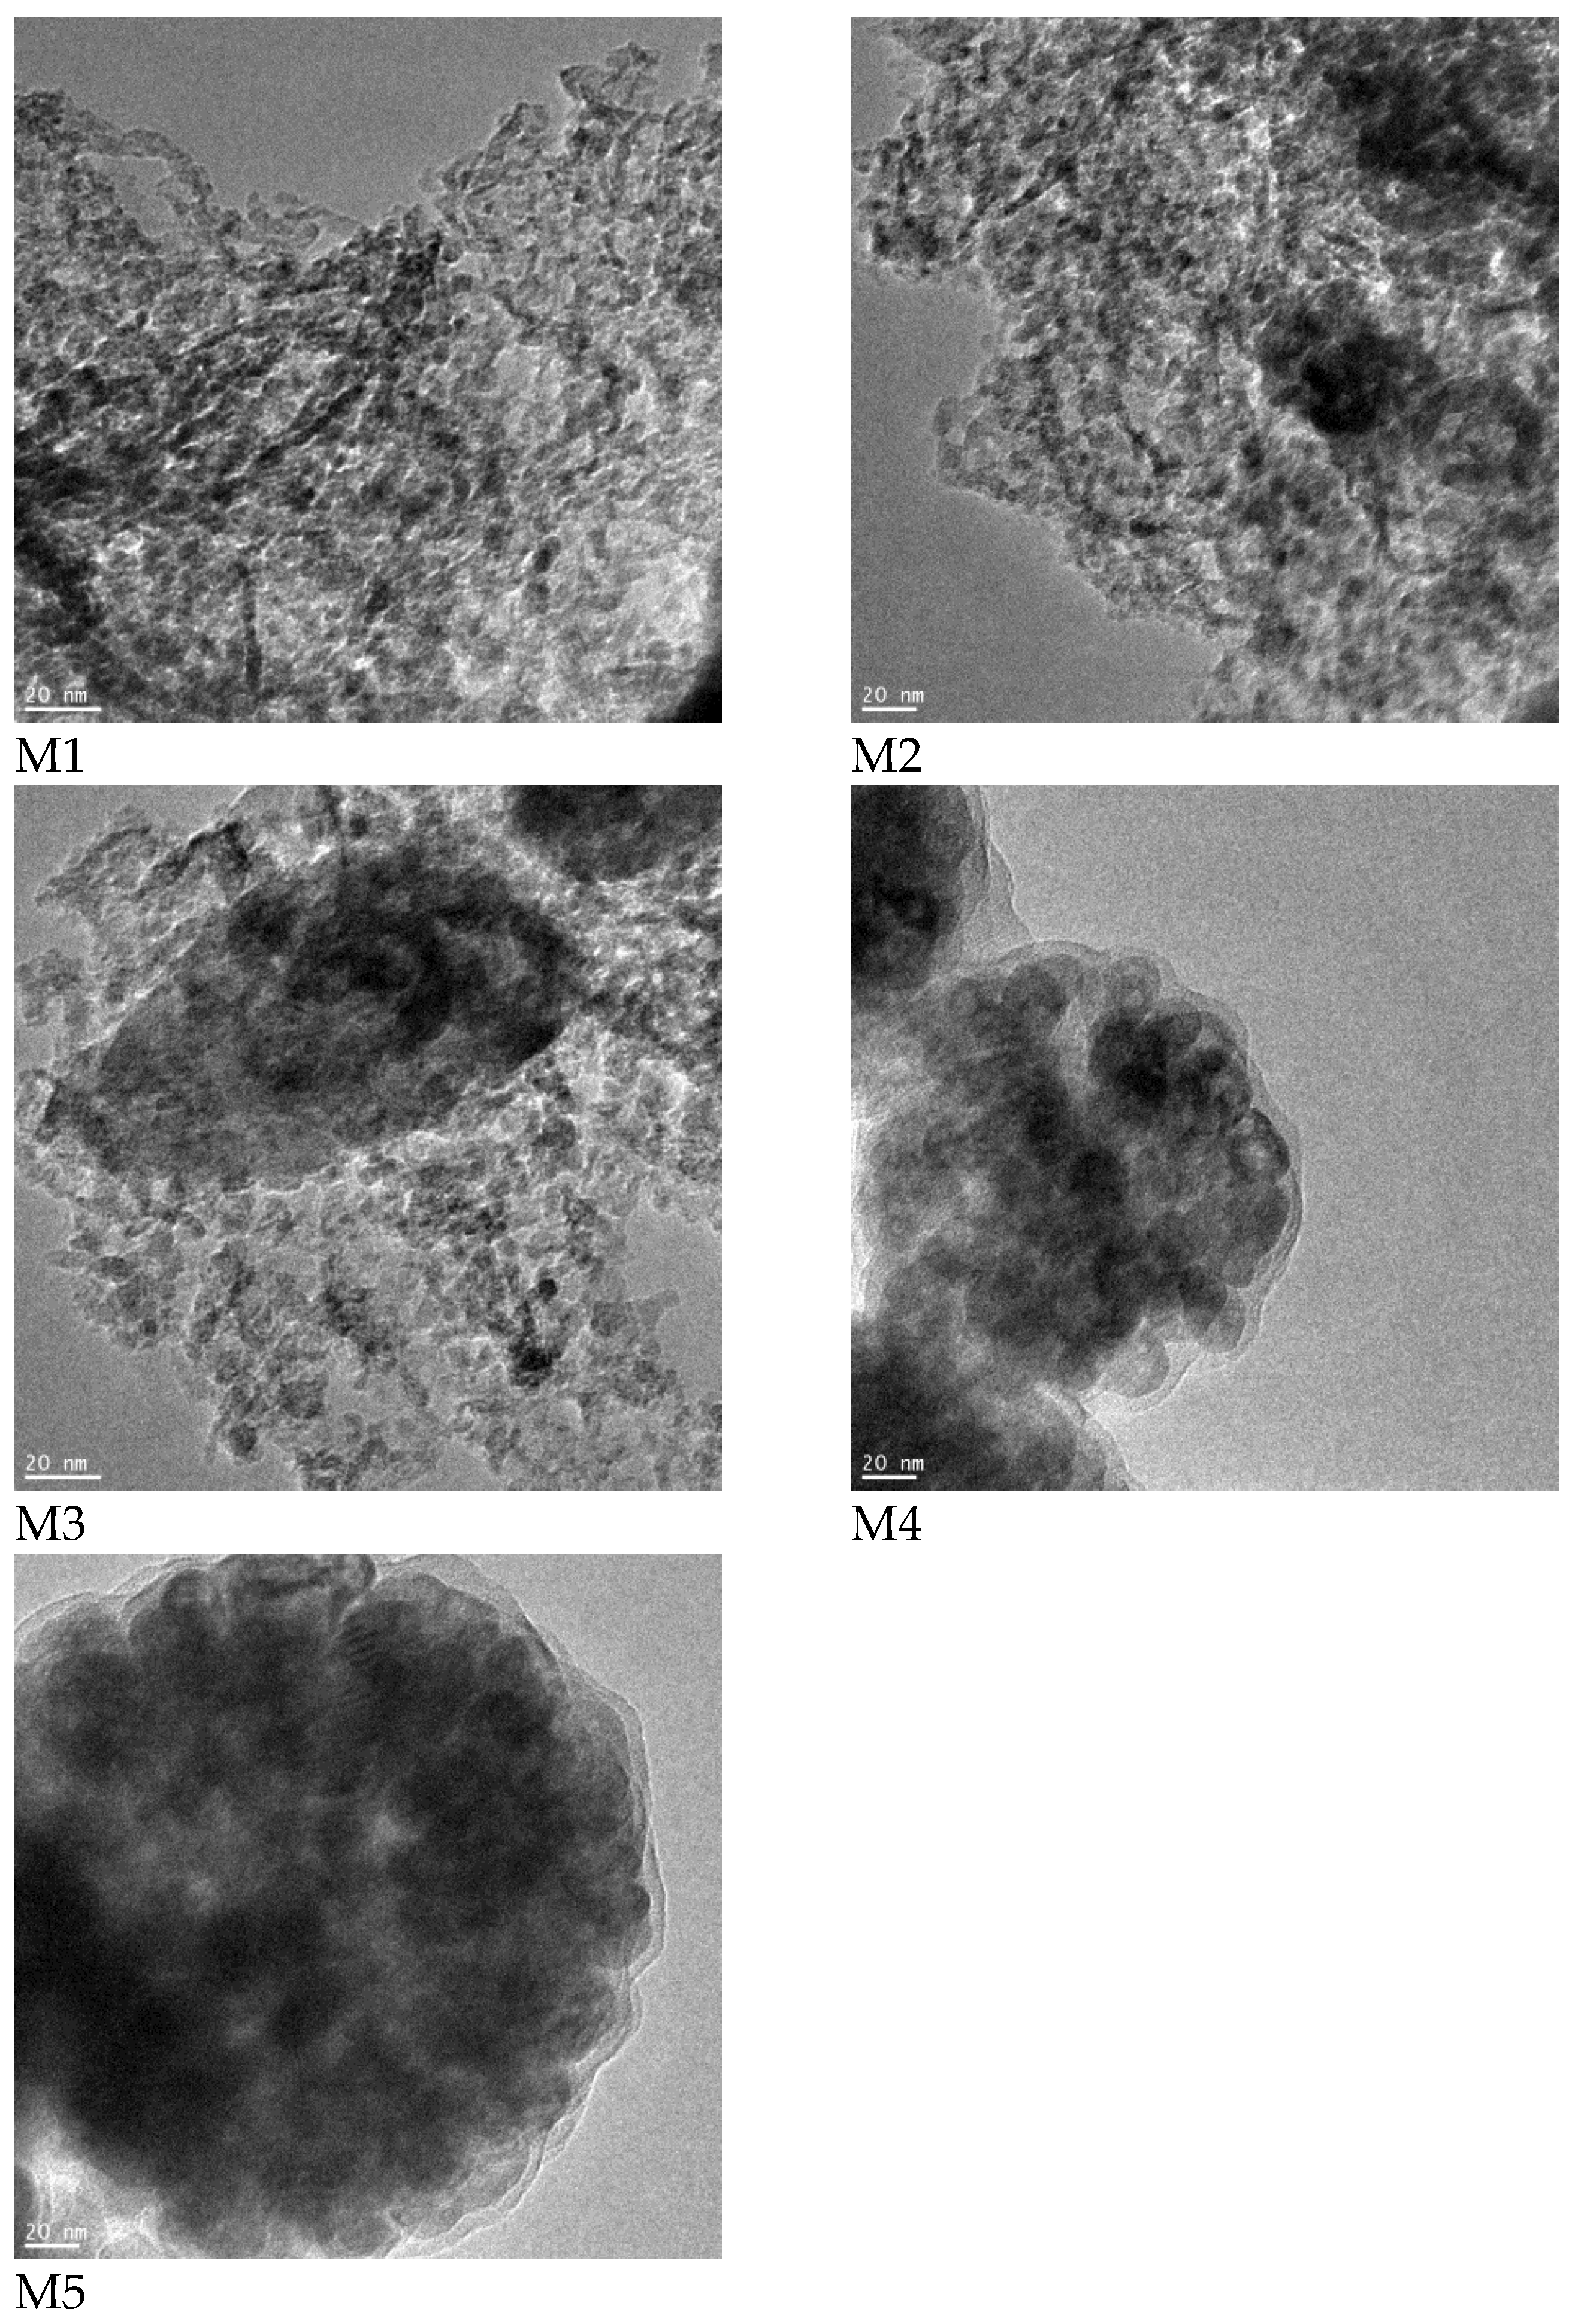
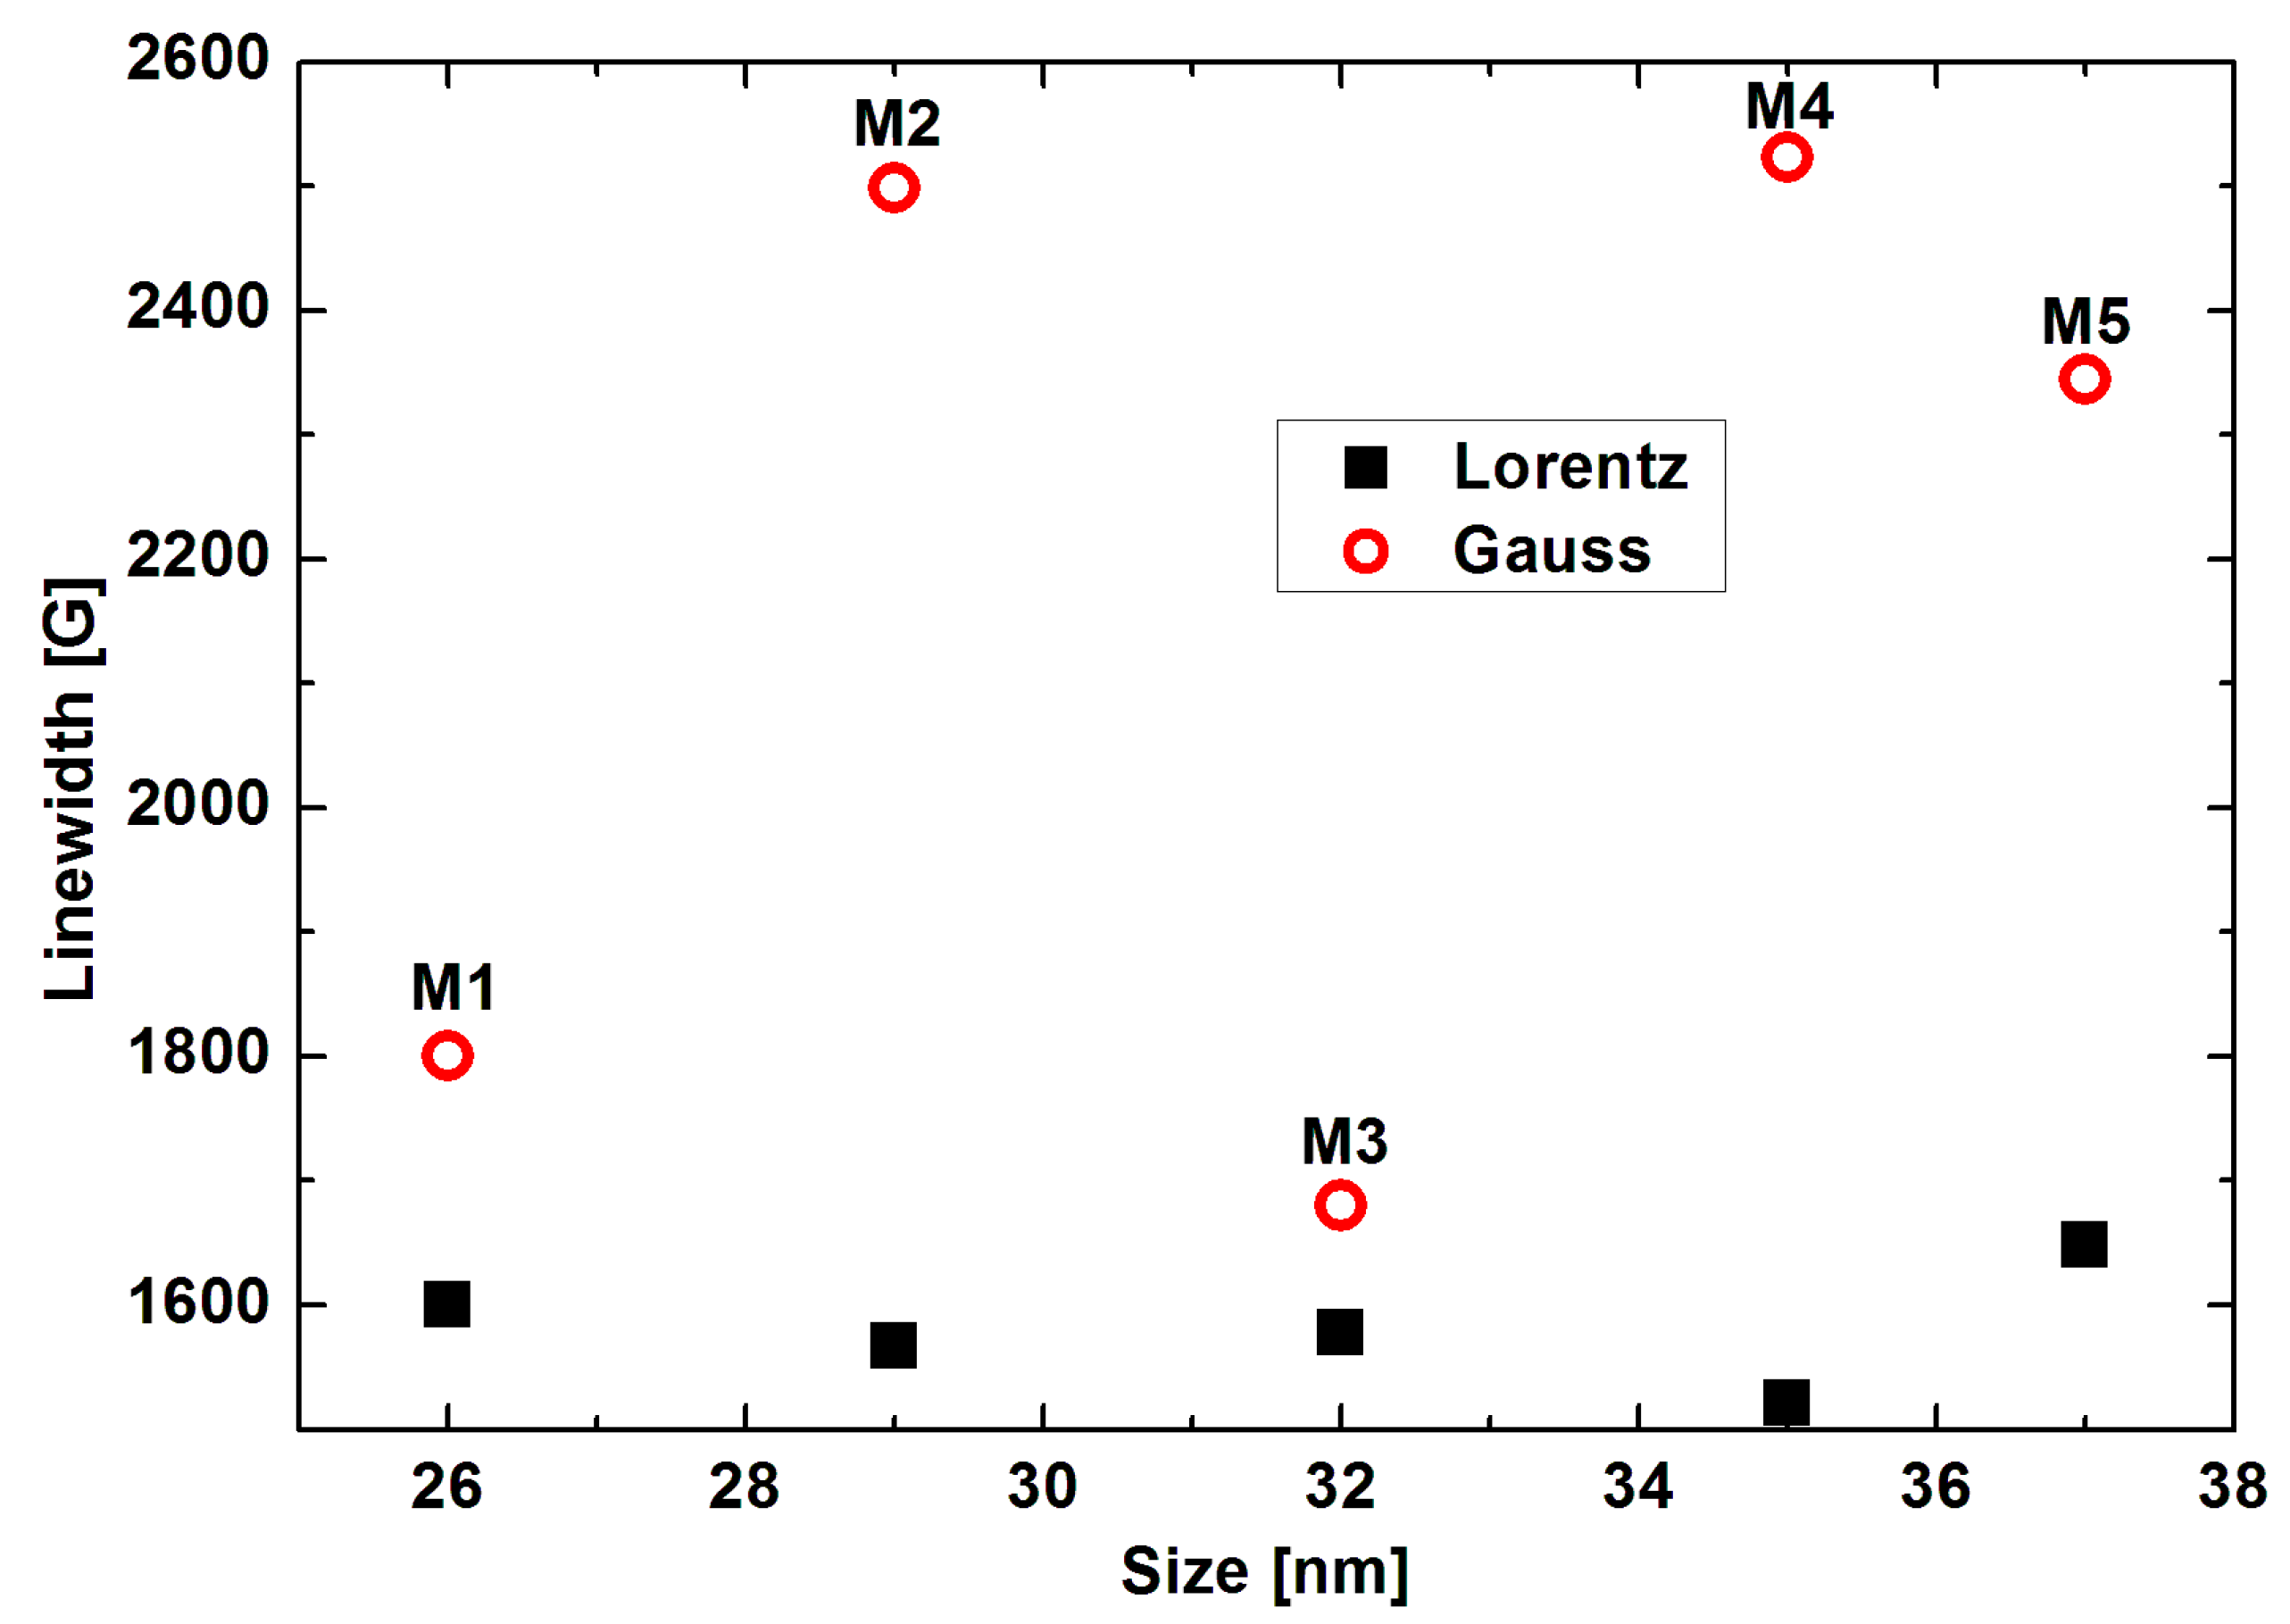
3. Results and Discussion
4. Conclusions
Author Contributions
Funding
Data Availability Statement
Conflicts of Interest
References
- Urbanova, V.; Magro, M.; Gedanken, A.; Baratella, D.; Vianello, F.; Zboril, R. Nanocrystalline Iron Oxides, Composites, and Related Materials as a Platform for Electrochemical, Magnetic, and Chemical Biosensors. Chem. Mater. 2014, 26, 6653–6673. [Google Scholar] [CrossRef]
- Armijo, L.M.; Brandt, Y.I.; Mathew, D.; Yadav, S.; Maestas, S.; Rivera, A.C.; Cook, N.C.; Withers, N.J.; Smolyakov, G.A.; Adolphi, N.L.; et al. Iron Oxide Nanocrystals for Magnetic Hyperthermia Applications. Nanomaterials 2012, 2, 134–146. [Google Scholar] [CrossRef] [PubMed]
- Clemons, T.D.; Viola, H.M.; House, M.J.; Hool, L.C.; Iyer, K.S. Nanomaterials: Science and Applications; Kane, D.M., Micolich, A., Roger, P., Eds.; Jenny Stanford Publishing: Boca Raton, FL, USA, 2016; pp. 23–30. [Google Scholar]
- Sabu, V.; Shirin, V.K.A.; Sankar, R.; Pramod, K. Nanomaterials and Nanotechnology in Medicine; Visakh, P.M., Ed.; Wiley: Hoboken, NJ, USA, 2022; p. 385. [Google Scholar]
- Mahmoudi, M.; Sant, S.; Wang, B.; Laurent, S.; Sen, T. Superparamagnetic iron oxide nanoparticles (SPIONs): Development, surface modification and applications in chemotherapy. Adv. Drug Deliv. Rev. 2011, 63, 24–46. [Google Scholar] [CrossRef] [PubMed]
- Pal, S.; Dutta, P.; Shah, N.; Huffman, G.; Seehra, M. Surface Spin Disorder in Fe3O4 Nanoparticles Probed by Electron Magnetic Resonance Spectroscopy and Magnetometry. IEEE Trans. Magn. 2007, 43, 3091–3093. [Google Scholar] [CrossRef]
- Buzukashvili, S.; Hu, W.; Sommerville, R.; Brooks, O.; Kökkılıç, O.; Rowson, N.A.; Ouzilleau, P.; Waters, K.E. Magnetic Zeolite: Synthesis and Copper Adsorption Followed by Magnetic Separation from Treated Water. Crystals 2023, 13, 1369. [Google Scholar] [CrossRef]
- Xu, P.; Zeng, G.; Huang, D.; Feng, C.; Hu, S.; Zhao, M.; Lai, C.; Wei, Z.; Huang, C.; Xie, G.; et al. Use of iron oxide nanomaterials in wastewater treatment: A review. Sci. Total Environ. 2012, 424, 1–10. [Google Scholar] [CrossRef] [PubMed]
- Rahman, A.; Daniel, L.S.; Uahengo, V. Iron Oxide Nanomaterials for Water Purification. In Novel Materials and Water Purification: Towards a Sustainable Future; Kyriakopoulos, G.L., Zamparas, M.G., Eds.; Royal Society of Chemistry: London, UK, 2024; pp. 234–255. [Google Scholar] [CrossRef]
- Abuzeid, H.M.; Julien, C.M.; Zhu, L.; Hashem, A.M. Green Synthesis of Nanoparticles and Their Energy Storage, Environmental, and Biomedical Applications. Crystals 2023, 13, 1576. [Google Scholar] [CrossRef]
- Meng, Y.Q.; Shi, Y.N.; Zhu, Y.P.; Liu, Y.Q.; Gu, L.W.; Liu, D.D.; Ma, A.; Xia, F.; Guo, Q.Y.; Xu, C.C.; et al. Recent trends in preparation and biomedical applications of iron oxide nanoparticles. J. Nanobiotechnol 2024, 22, 24. [Google Scholar] [CrossRef] [PubMed]
- Kalidass, J.; Anandan, S.; Sivasankar, T. Sonoelectrochemical Nanoarchitectonics of Crystalline Mesoporous Magnetite @ Manganese Oxide Nanocomposite as an Alternate Anode Material for Energy-Storage Applications. Crystals 2023, 13, 557. [Google Scholar] [CrossRef]
- Wirecka, R.; Marzec, M.M.; Marciszko-Wiąckowska, M.; Lis, M.; Gajewska, M.; Trynkiewicz, E.; Lachowicz, D.; Bernasik, A. The effect of shell modification in iron oxide nanoparticles on electrical conductivity in polythiophene-based nanocomposites. J. Mater. Chem. C 2021, 9, 10453–10461. [Google Scholar] [CrossRef]
- Imran, M.; Chaudhary, A.A.; Ahmed, S.; Alam, M.M.; Khan, A.; Zouli, N.; Hakami, J.; Rudayni, H.A.; Khan, S.-U.-D. Iron Oxide Nanoparticle-Based Ferro-Nanofluids for Advanced Technological Applications. Molecules 2022, 27, 7931. [Google Scholar] [CrossRef] [PubMed]
- Malasi, A.; Taz, H.; Farah, A.; Patel, M.; Lawrie, B.; Pooser, R.; Baddorf, A.; Duscher, G.; Kalyanaraman, R. Novel Iron-based ternary amorphous oxide semiconductor with very high transparency, electronic conductivity and mobility. Sci. Rep. 2015, 5, 18157. [Google Scholar] [CrossRef] [PubMed]
- Gleiter, H. Nanostructured materials: Basic concepts and microstructure. Acta Mater. 2000, 48, 1–29. [Google Scholar] [CrossRef]
- Kushwaha, A.K.; John, M.; Misra, M.; Menezes, P.L. Nanocrystalline Materials: Synthesis, Characterization, Properties, and Applications. Crystals 2021, 11, 1317. [Google Scholar] [CrossRef]
- Guskos, N.; Anagnostakis, E.A.; Likodimos, V.; Typek, J.; Maryniak, M.; Narkiewicz, U. Ferromagnetic resonance and ac conductivity of a polymer composite of Fe3O4 and Fe3C nanoparticles dispersed in a graphite matrix. J. Appl. Phys. 2005, 97, 024304. [Google Scholar] [CrossRef]
- Ghosh, R.; Pradhan, L.; Devi, Y.P.; Meena, S.S.; Tewari, R.; Kumar, A.; Sharma, S. Induction heating studies of Fe3O4 magnetic nanoparticles capped with oleic acid and polyethylene glycol for hyperthermia. J. Mater. Chem. 2011, 21, 13388–13398. [Google Scholar] [CrossRef]
- Teymourian, H.; Salimi, A.; Khezrian, S. Fe3O4 magnetic nanoparticles/reduced graphene oxide nanosheets as a novel electrochemical and bioeletrochemical sensing platform. Biosens. Bioelectron. 2013, 49, 1–8. [Google Scholar] [CrossRef]
- Venkateswarlu, S.; Rao, Y.S.; Balaji, T.; Prathima, B.; Jyothi, N.V.V. Biogenic synthesis of Fe3O4 magnetic nanoparticles using plantain peel extract. Mater. Lett. 2013, 100, 241–244. [Google Scholar] [CrossRef]
- Ding, Y.; Shen, S.Z.; Sun, H.; Sun, K.; Liu, F.; Qi, Y.; Yan, J. Design and construction of polymerized-chitosan coated Fe3O4 magnetic nanoparticles and its application for hydrophobic drug delivery. Mater. Sci. Eng. C Mater. Biol. Appl. 2015, 48, 487–498. [Google Scholar] [CrossRef] [PubMed]
- Prasad, C.; Yuvaraja, G.; Venkateswarlu, P. Biogenic synthesis of Fe3O4 magnetic nanoparticles using Pisum sativum peels extract and its effect on magnetic and Methyl orange dye degradation studies. J. Magn. Magn. Mater. 2017, 424, 376–381. [Google Scholar] [CrossRef]
- Ma, Y.; Xu, G.; Wei, F.; Cen, Y.; Xu, X.; Shi, M.; Cheng, X.; Chai, Y.; Sohail, M.; Hu, Q. One-Pot Synthesis of a Magnetic, Ratiometric Fluorescent Nanoprobe by Encapsulating Fe3O4 Magnetic Nanoparticles and Dual-Emissive Rhodamine B Modified Carbon Dots in Metal-Organic Framework for Enhanced HClO Sensing. ACS Appl. Mater. Interfaces 2018, 10, 20801–20805. [Google Scholar] [CrossRef] [PubMed]
- Sajjadi, A.; Mohammadi, R. Fe3O4 magnetic nanoparticles (Fe3O4 MNPs): A magnetically reusable catalyst for synthesis of Benzimidazole compounds. J. Med. Chem. Sci. 2019, 2, 55–58. [Google Scholar] [CrossRef]
- Guo, W.; Fu, Z.; Zhang, Z.; Wang, H.; Liu, S.; Feng, W.; Zhao, X.; Giesy, J.P. Synthesis of Fe3O4 magnetic nanoparticles coated with cationic surfactants and their applications in Sb(V) removal from water. Sci. Total Environ. 2020, 710, 136302. [Google Scholar] [CrossRef] [PubMed]
- Marć, M.; Najder-Kozdrowska, L.; Guskos, N.; Żołnierkiewicz, G.; Montero, A.M.; Dudek, M.R. The Use of Ultra-Small Fe3O4 Magnetic Nanoparticles for Hydrothermal Synthesis of Fe3+-Doped Titanate Nanotubes. Materials 2020, 13, 4612. [Google Scholar] [CrossRef] [PubMed]
- Patsula, V.; Moskvin, M.; Dutz, S.; Horak, D. Size-dependent magnetic properties of iron oxide nanoparticles. J. Phys. Chem. Solids 2016, 88, 24–30. [Google Scholar] [CrossRef]
- Chen, L.; Xie, J.; Wu, H.; Li, J.; Wang, Z.; Song, L.; Zang, F.; Ma, M.; Gu, N.; Zhang, Y.; et al. Precise Study on Size-Dependent Properties of Magnetic Iron Oxide Nanoparticles for In Vivo Magnetic Resonance Imaging. J. Nanomater. 2018, 2018, 3743164. [Google Scholar] [CrossRef]
- Nowosielecka, U.; Pelka, R.; Moszyńska, I.; Guskos, N.; Typek, J.; Żołnierkiewicz, G. Studies of magnetic properties of nanocrystalline iron of different sizes of nanocrystallites. J. Magn. Magn. Mater. 2017, 443, 324–333. [Google Scholar] [CrossRef]
- Arabczyk, W.; Ekiert, E.; Pelka, R. Size-dependent transformation of α-Fe into γ′-Fe4N in nanocrystalline the Fe-NH3-H2 system. J. Phys. Chem. C 2016, 120, 17989–17995. [Google Scholar] [CrossRef]
- Wróbel, R.; Arabczyk, W. Solid−Gas Reaction with Adsorption as the Rate Limiting Step. J. Phys. Chem. A 2006, 110, 9219. [Google Scholar] [CrossRef] [PubMed]
- Arabczyk, W.; Lendzion-Bieluń, Z.; Wróbel, R. Sposób Otrzymywania Nanomateriałów na Bazie Żelaza i Kobaltu o Określonych Rozmiarach Krystalitów. Polish Patent No. P206909, 21 May 2010. [Google Scholar]
- Lubkowski, K.; Arabczyk, W.; Grzmil, B.; Michalkiewicz, B.; Pattek-Janczyk, A. Passivation and oxidation of an ammonia iron catalyst. Appl. Catal. A-Gen. 2007, 329, 137–147. [Google Scholar] [CrossRef]
- Arabczyk, W.; Ziebro, J.; Kałucki, K.; Świerkowski, R.; Jakrzewska, M. Instalacja laboratoryjna do ciągłego wytopu katalizatorów żelazowych. Chemik 1996, 1, 22. [Google Scholar]
- Pielaszek, R. FW15/45M method for determination of the grain size distribution from powder diffraction line profile. J. Alloys Compd. 2004, 382, 128–132. [Google Scholar] [CrossRef]
- Pielaszek, R. Analytical expression for diffraction line profile for polydispersive powders. In Applied Crystallography, Proceedings of the XIX Conference, Kraków, Poland, 1–4 September 2003; World Scientific Publishing: Singapore, 2004; pp. 43–50. [Google Scholar] [CrossRef]
- Wilk, B.; Arabczyk, W. Investigation of nitriding and reduction processes in the nanocrystalline iron-ammonia-hydrogen system at 350°C. Phys. Chem. Chem. Phys. 2015, 17, 20185–20193. [Google Scholar] [CrossRef]
- Moszyński, D.; Kiełbasa, K.; Arabczyk, W. Influence of crystallites’ size on iron nitriding and reduction of iron nitrides in nanocrystalline Fe–N system. Mater. Chem. Phys. 2013, 141, 674–679. [Google Scholar] [CrossRef]
- Moszyński, D. Nitriding of Nanocrystalline Iron in the Atmospheres with Variable Nitriding Potential. J. Phys. Chem. C 2014, 118, 15440–15447. [Google Scholar] [CrossRef]
- Wilk, B.; Błachowski, A.; Lendzion-Bieluń, Z.; Arabczyk, W. Thermodynamics of Chemical Processes in the System of Nanocrystalline Iron–Ammonia–Hydrogen at 350 °C. Catalysts 2020, 10, 1242. [Google Scholar] [CrossRef]
- Wilk, B.; Pelka, R.; Arabczyk, W. Study of the Iron Catalyst for Ammonia Synthesis by Chemical Potential Programmed Reaction Method. Phys. Chem. C 2017, 121, 8548–8556. [Google Scholar] [CrossRef]
- Maryniak, M.; Guskos, N.; Typek, J.; Kucharewicz, I.; Narkiewicz, U.; Roslaniec, Z.; Kwiatkowska, M.; Arabczyk, W.; Aidinis, K. FMR study of polymer composites with nanocrystalline iron-carbon fillers. Rev. Adv. Mater. Sci. 2006, 12, 200–205. [Google Scholar]
- Helminiak, A.; Arabczyk, W.; Zolnierkiewicz, G.; Guskos, N.; Typek, J. FMR study of the influence of carburization levels by methane decomposition on nanocrystalline iron. Rev. Adv. Mat. Sci. 2011, 29, 166–174. [Google Scholar]


| Sample Name | Fe3O4 | Fe | FeO | ||||
|---|---|---|---|---|---|---|---|
| Average Size | Standard Deviation of NSD | Phase Content | Average Size | Phase Content | Average Size | Phase Content | |
| nm | nm | % | Nm | % | nm | % | |
| M1 | 26 | 15.0 | 93.7 | 15 | 6.0 | na | 0.3 |
| M2 | 29 | 2.5 | 94.0 | 24 | 6.0 | - | - |
| M3 | 32 | 5.0 | 95.0 | 19 | 5.0 | - | - |
| M4 | 35 | 7.0 | 99.3 | Na | 0.4 | na | 0.3 |
| M5 | 37 | 10.0 | 98.8 | Na | 1.2 | - | - |
| Sample Name | Specific Surface Area [m2/g] |
|---|---|
| M1 | 8.77 |
| M2 | 13.75 |
| M3 | 22.30 |
| M4 | 16.60 |
| M5 | 17.10 |
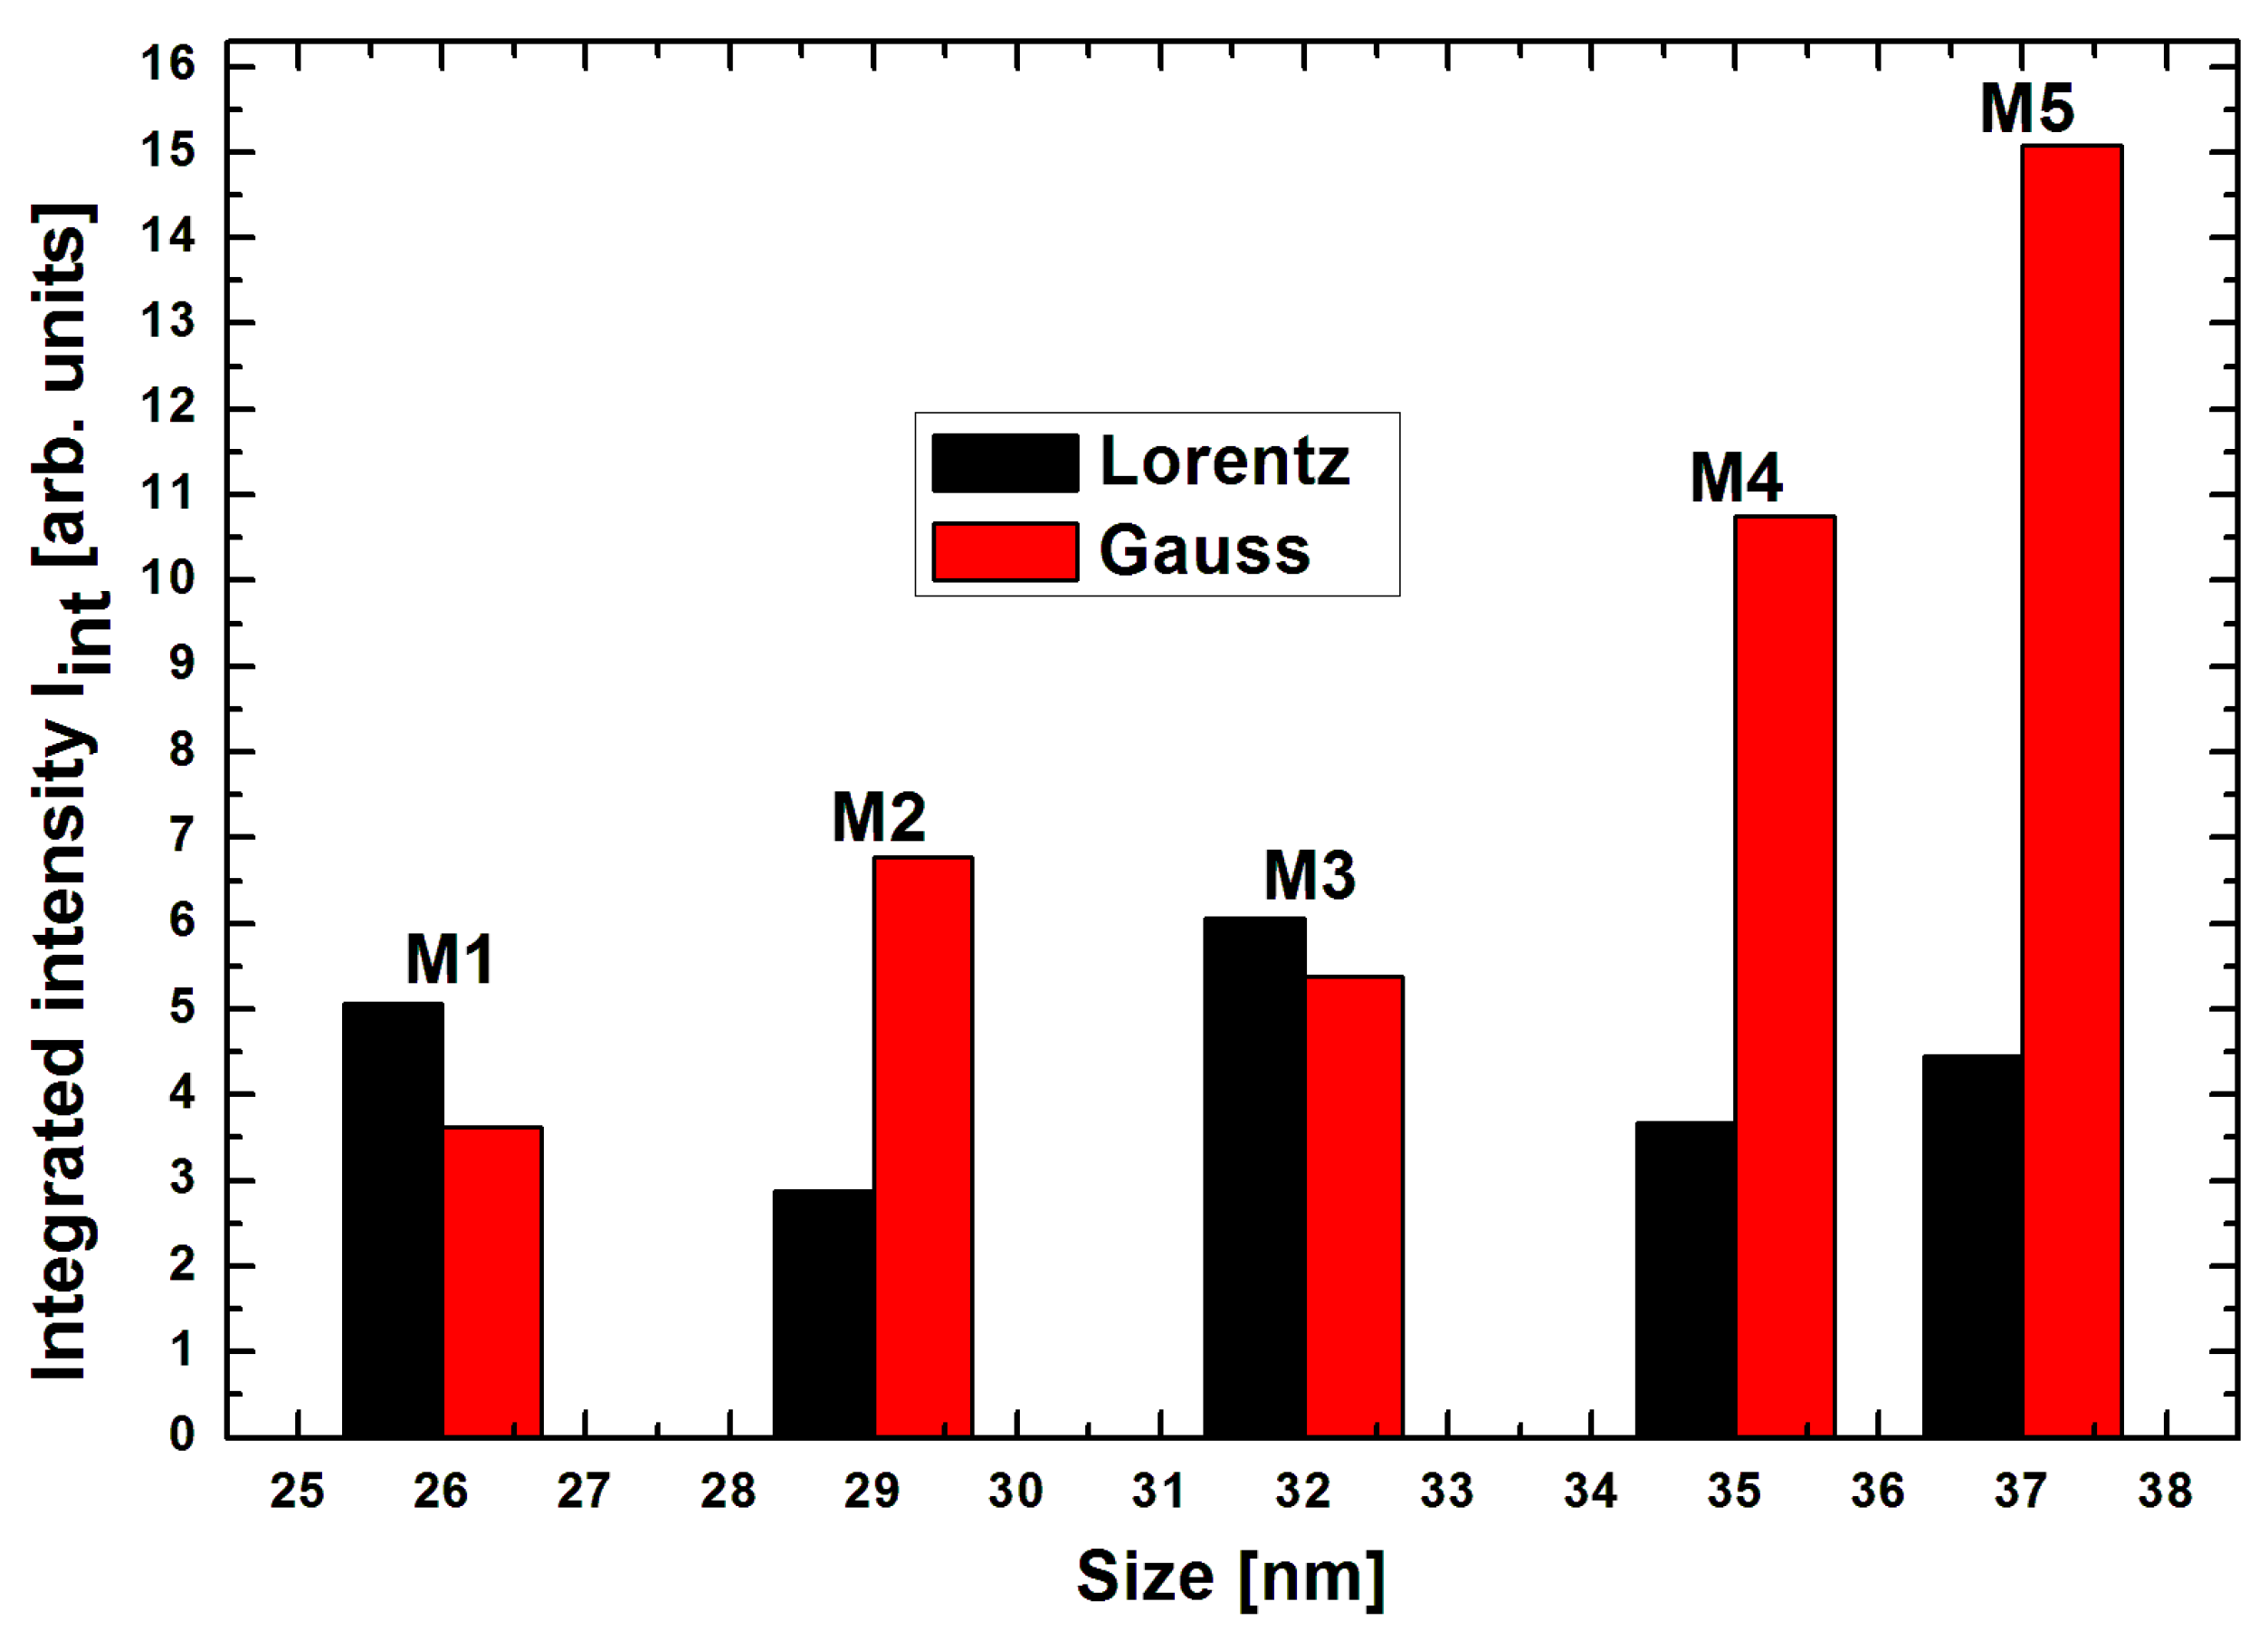
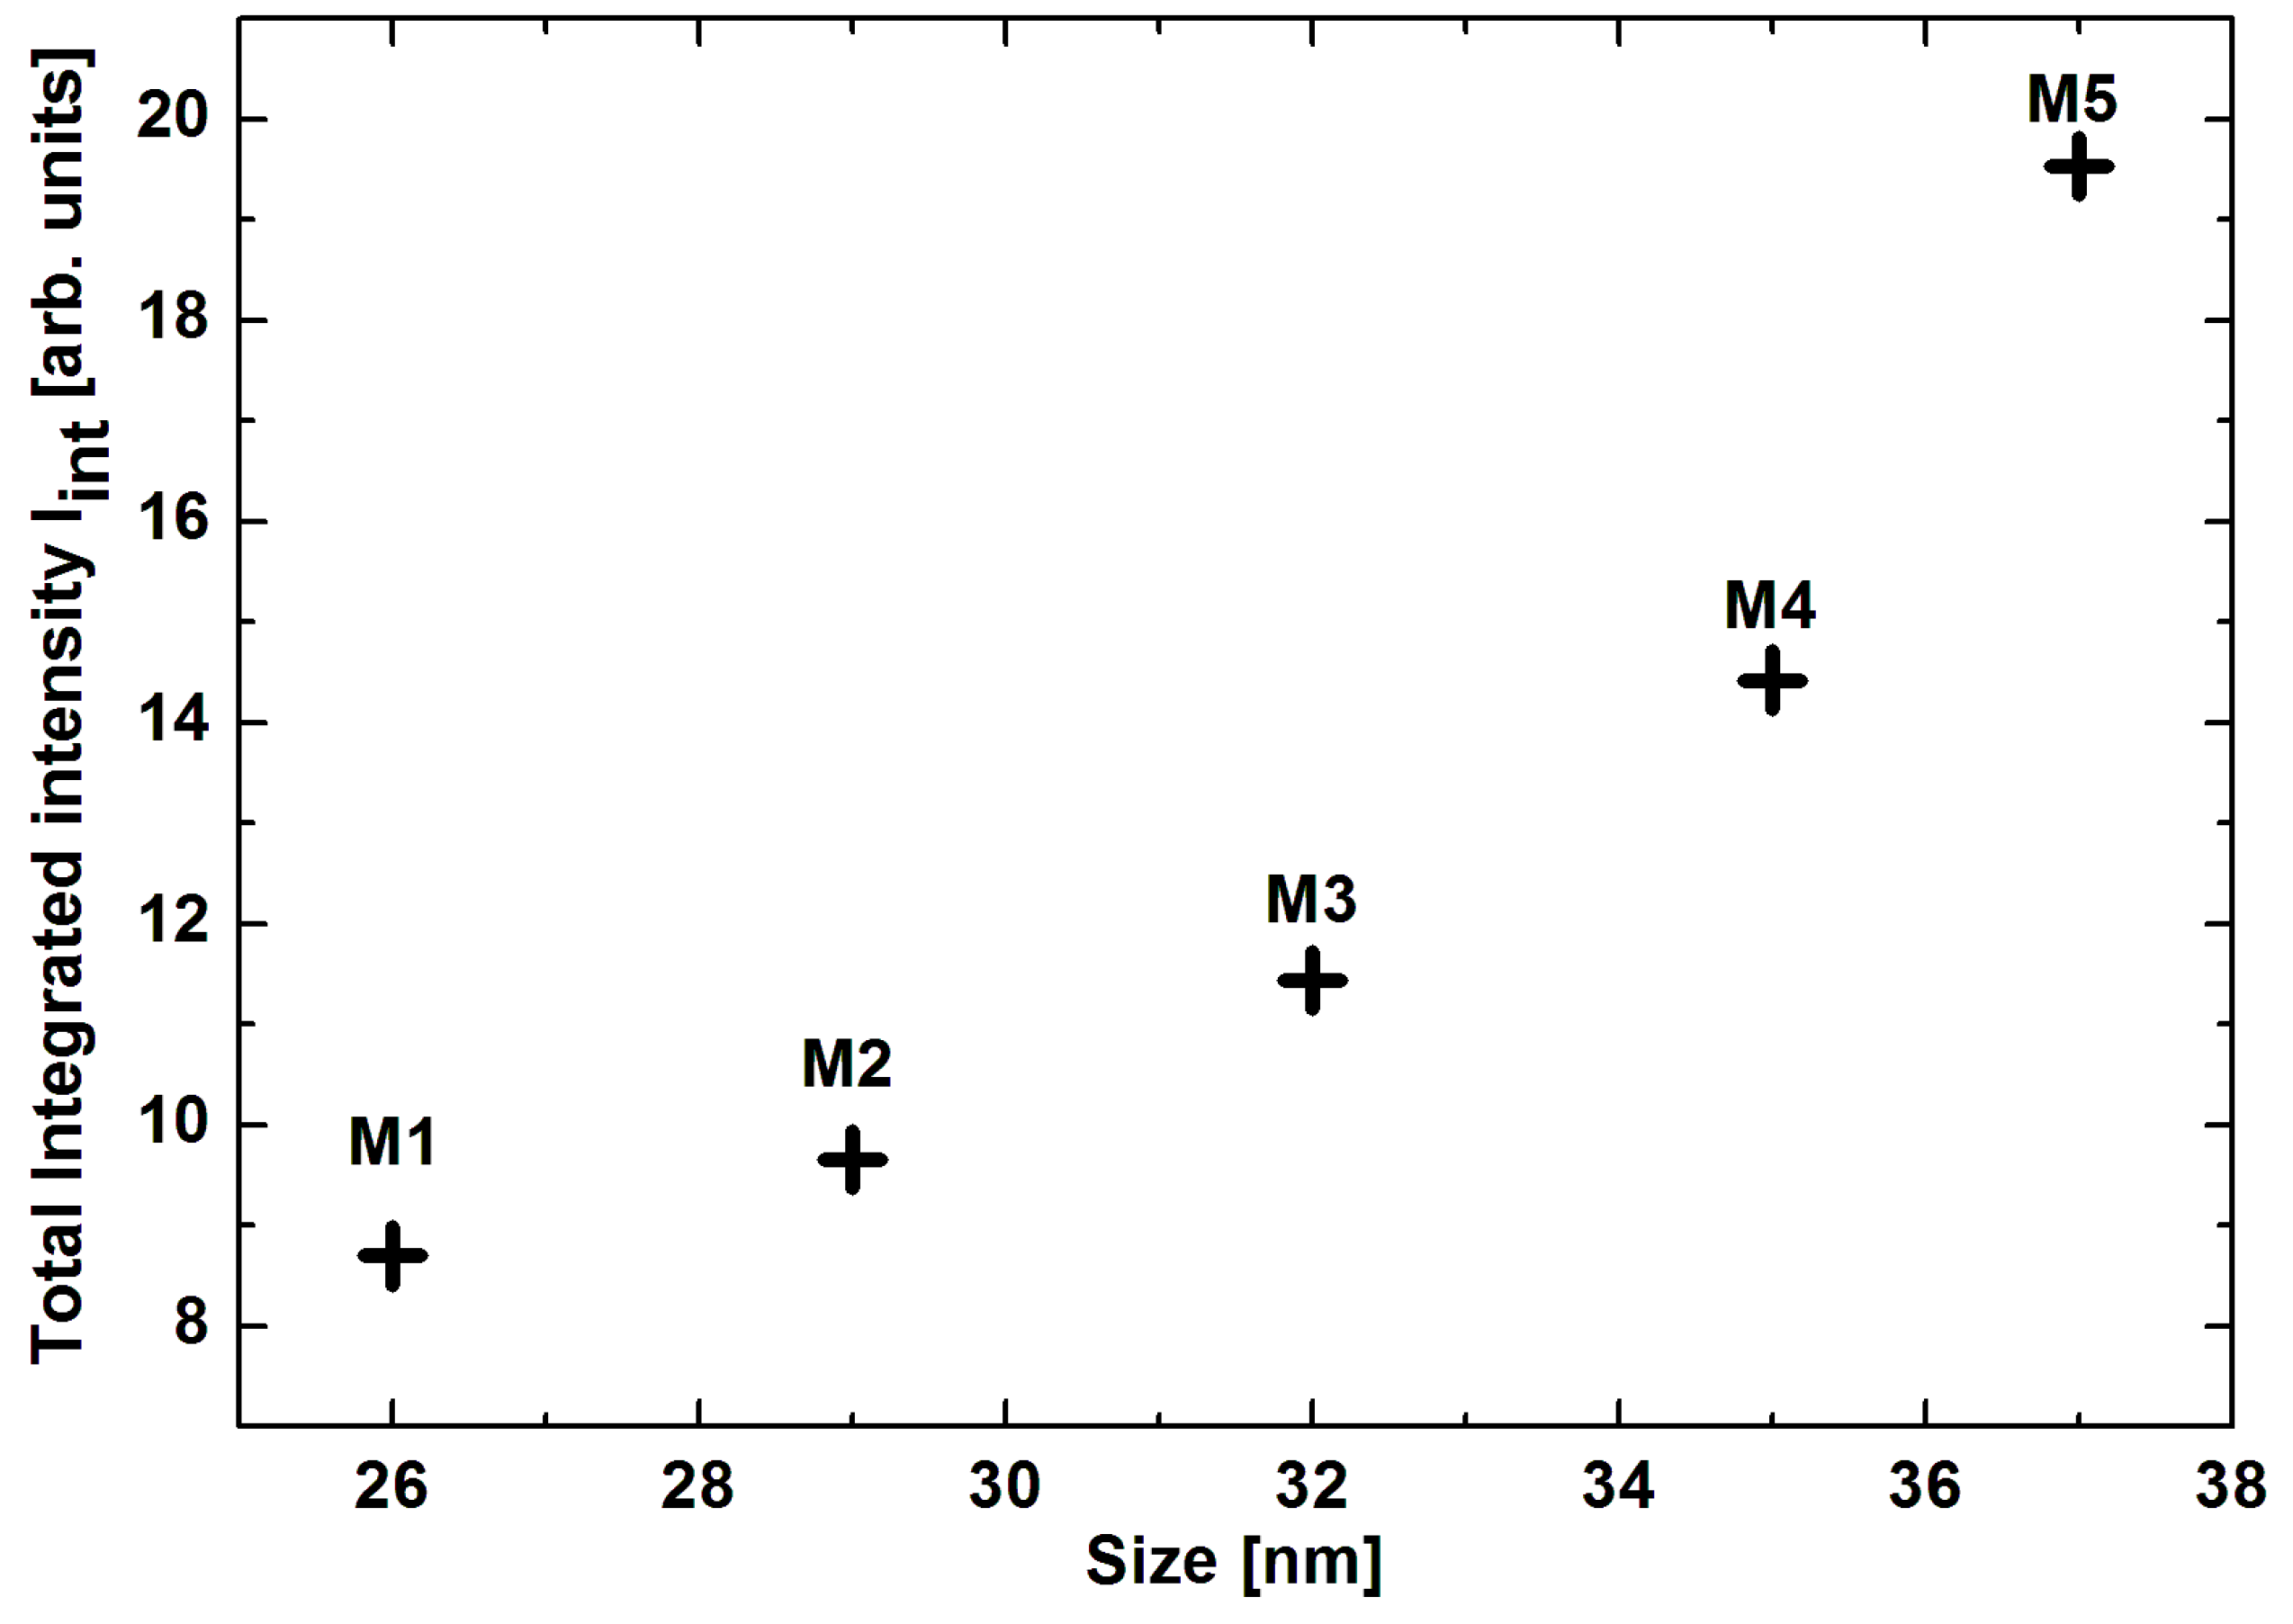
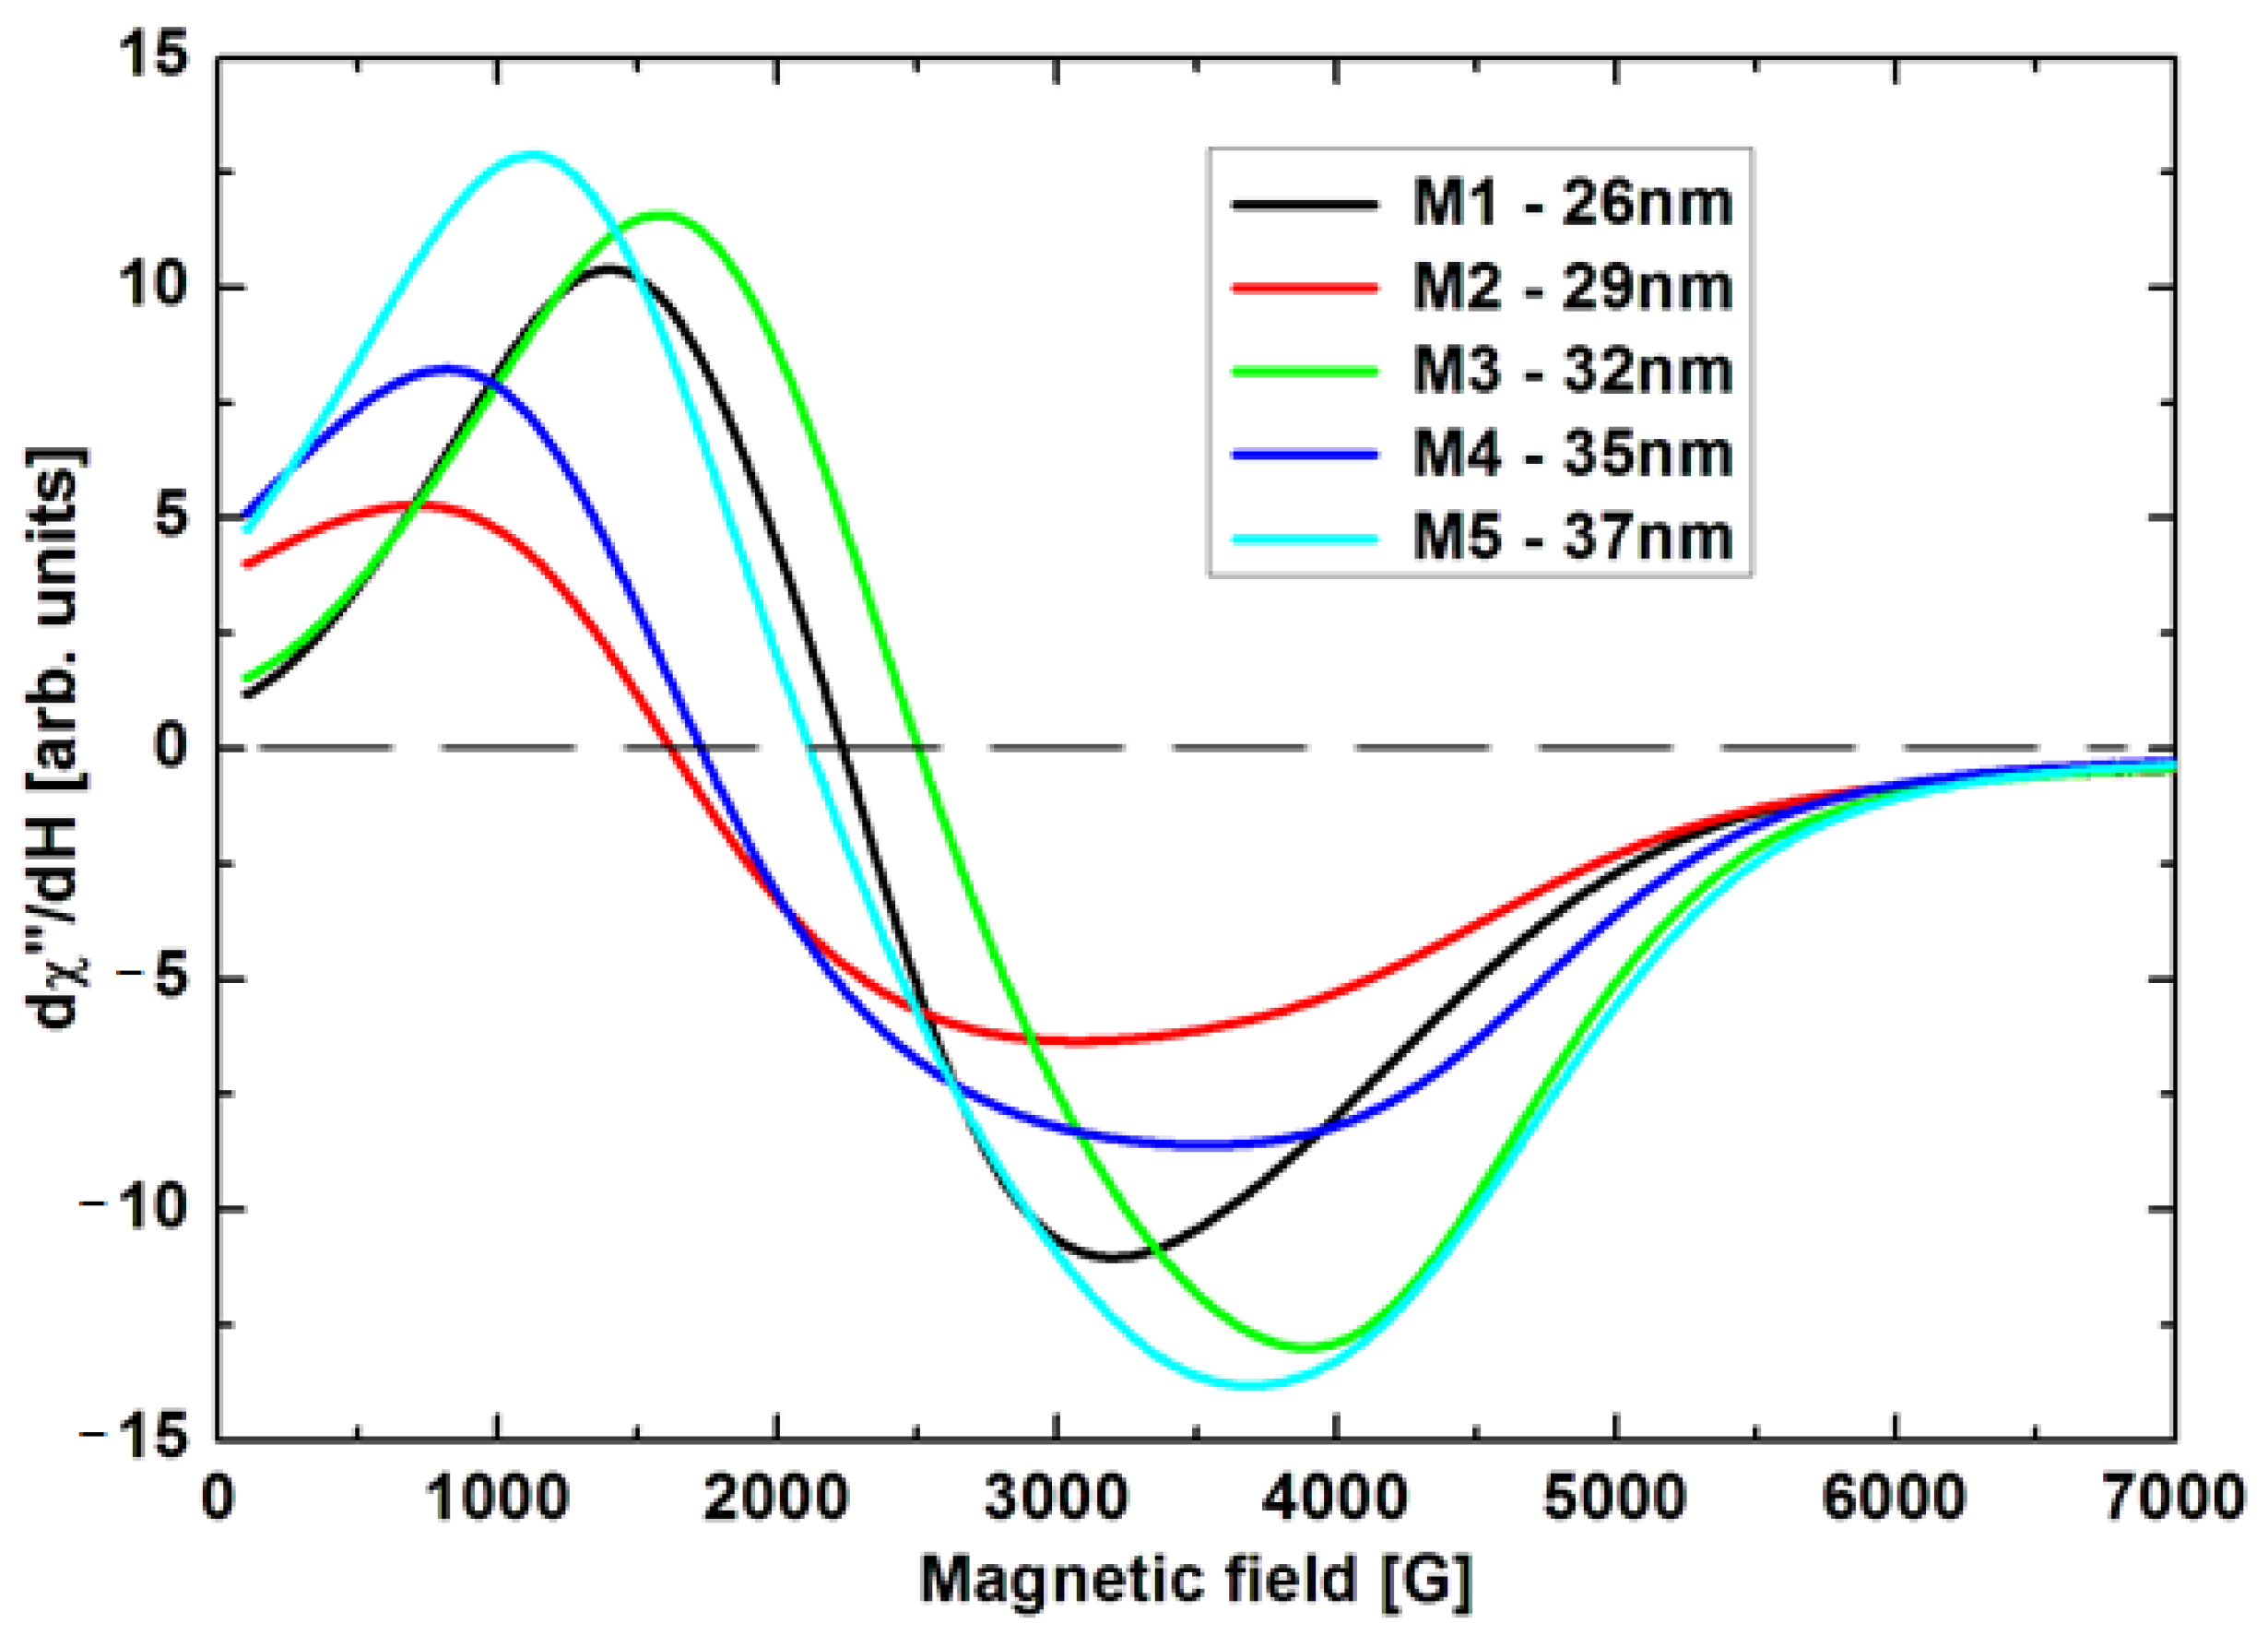
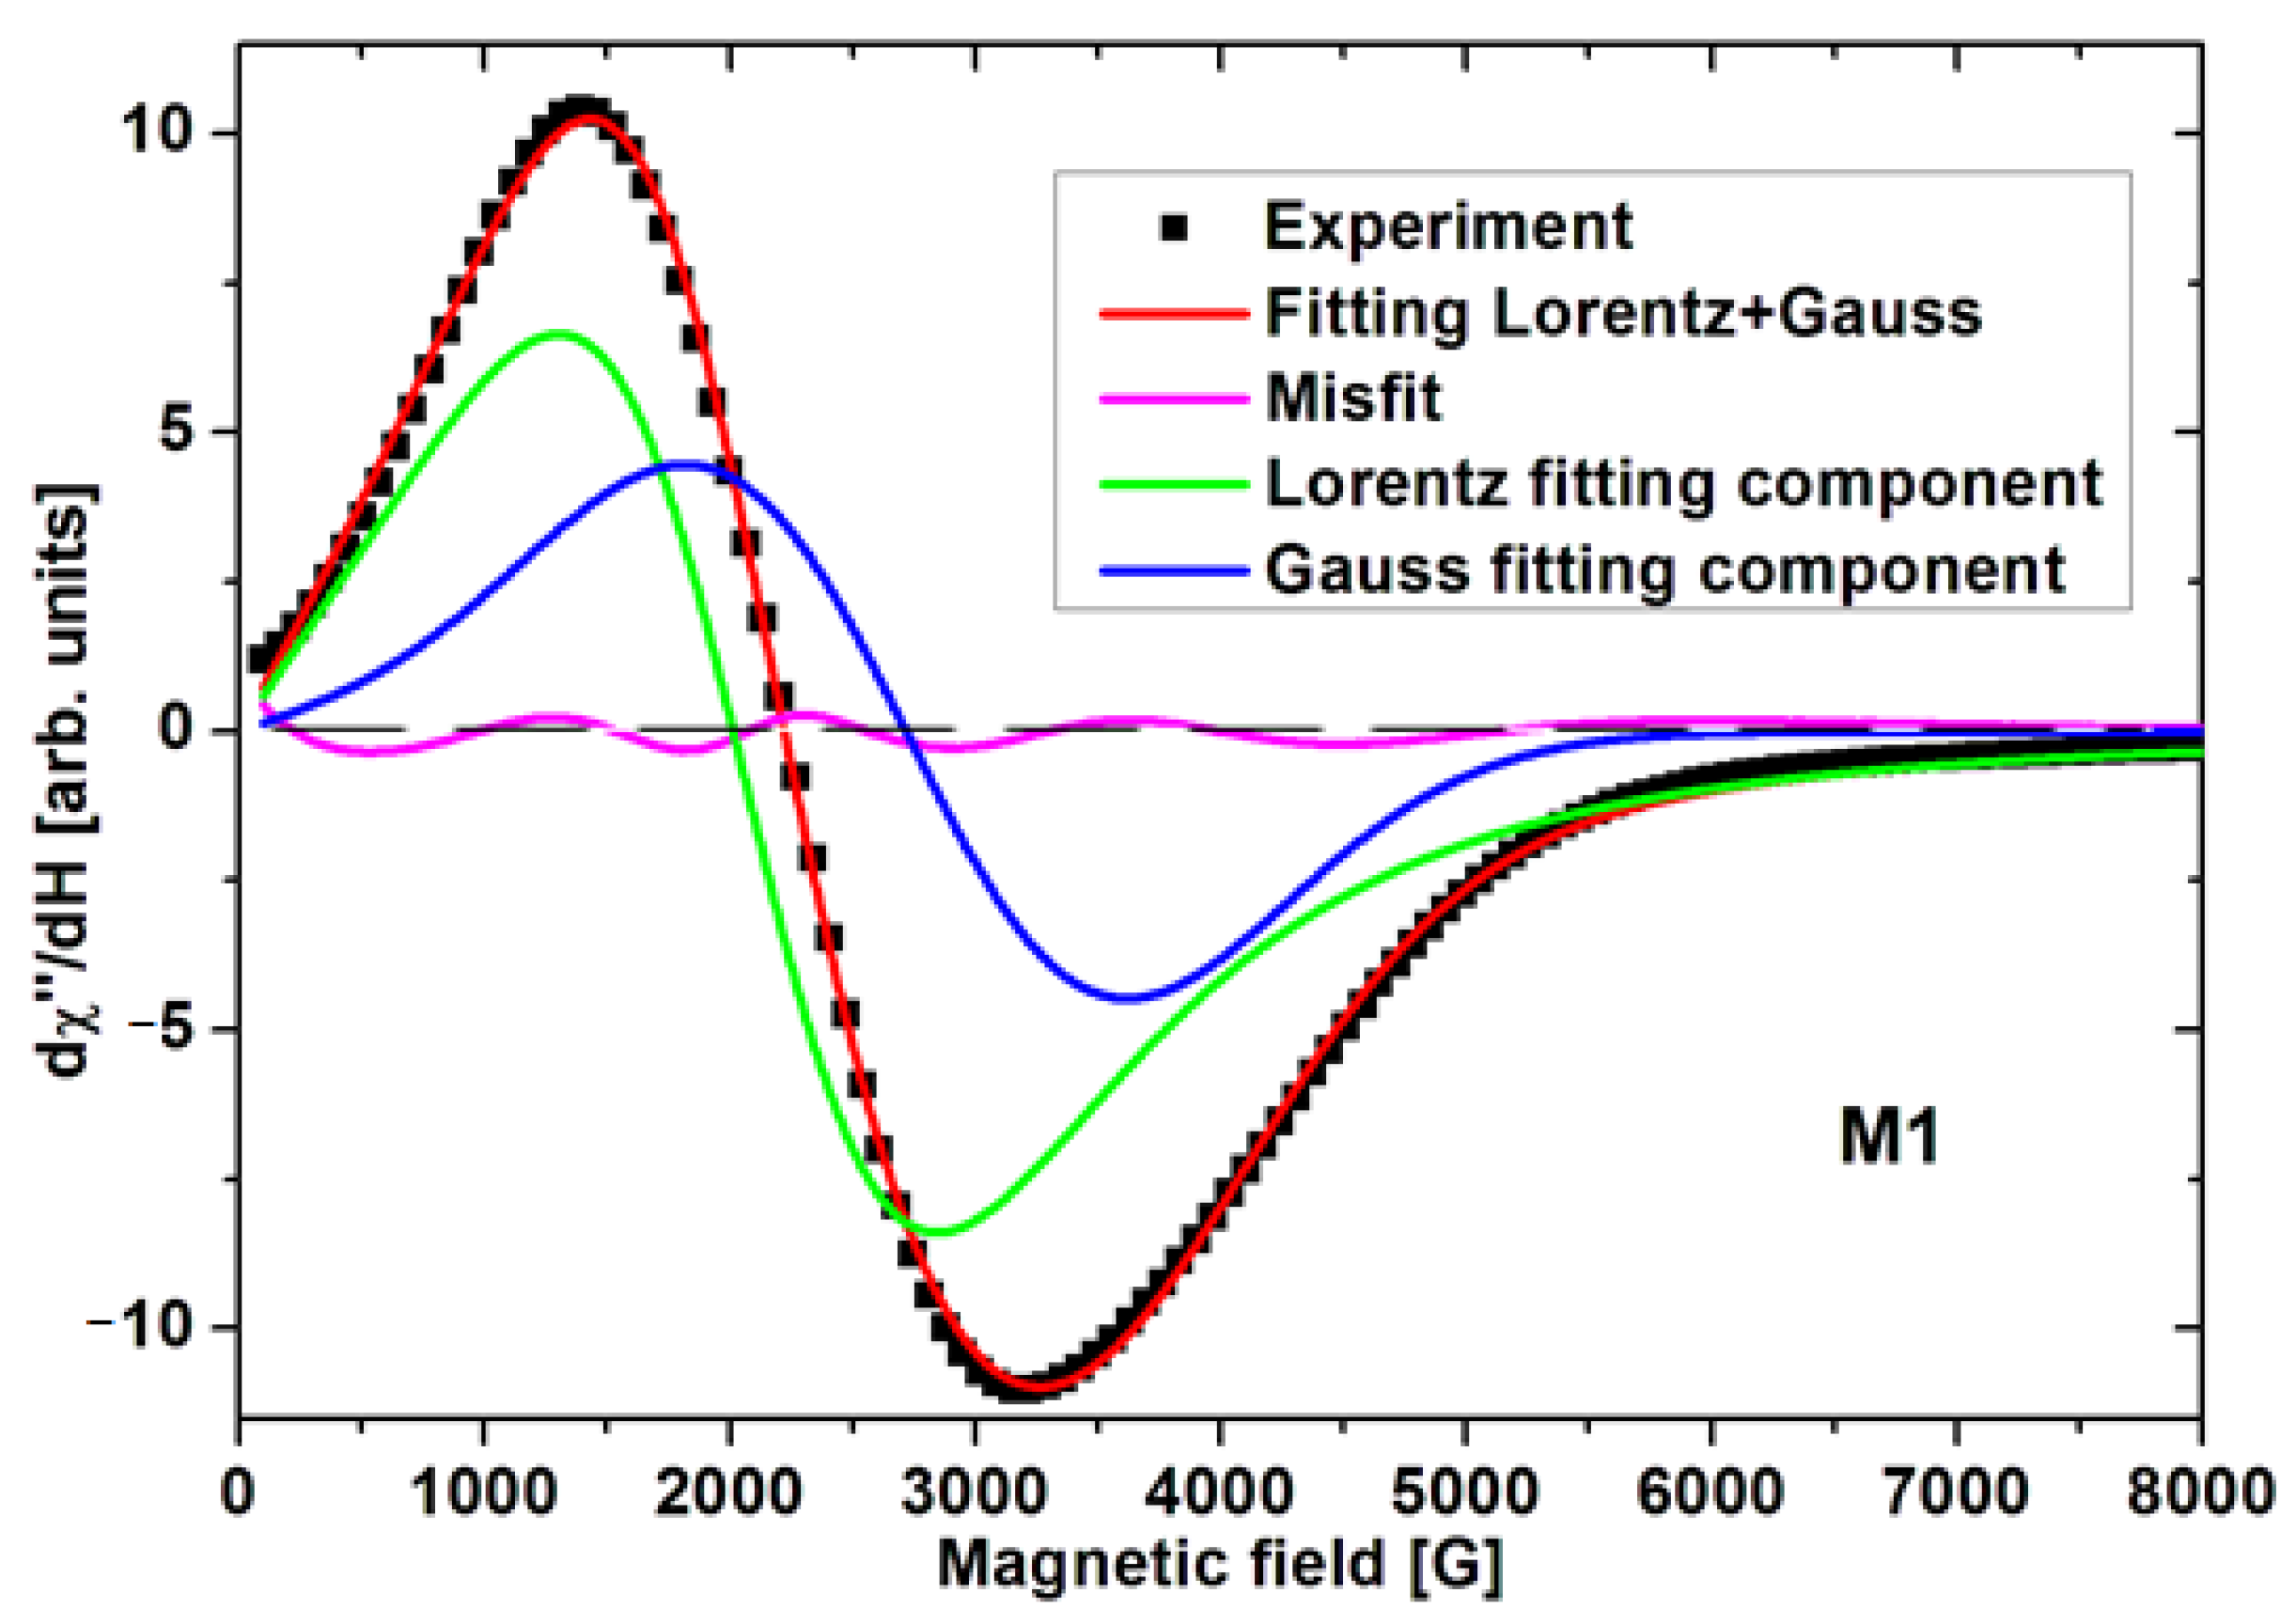
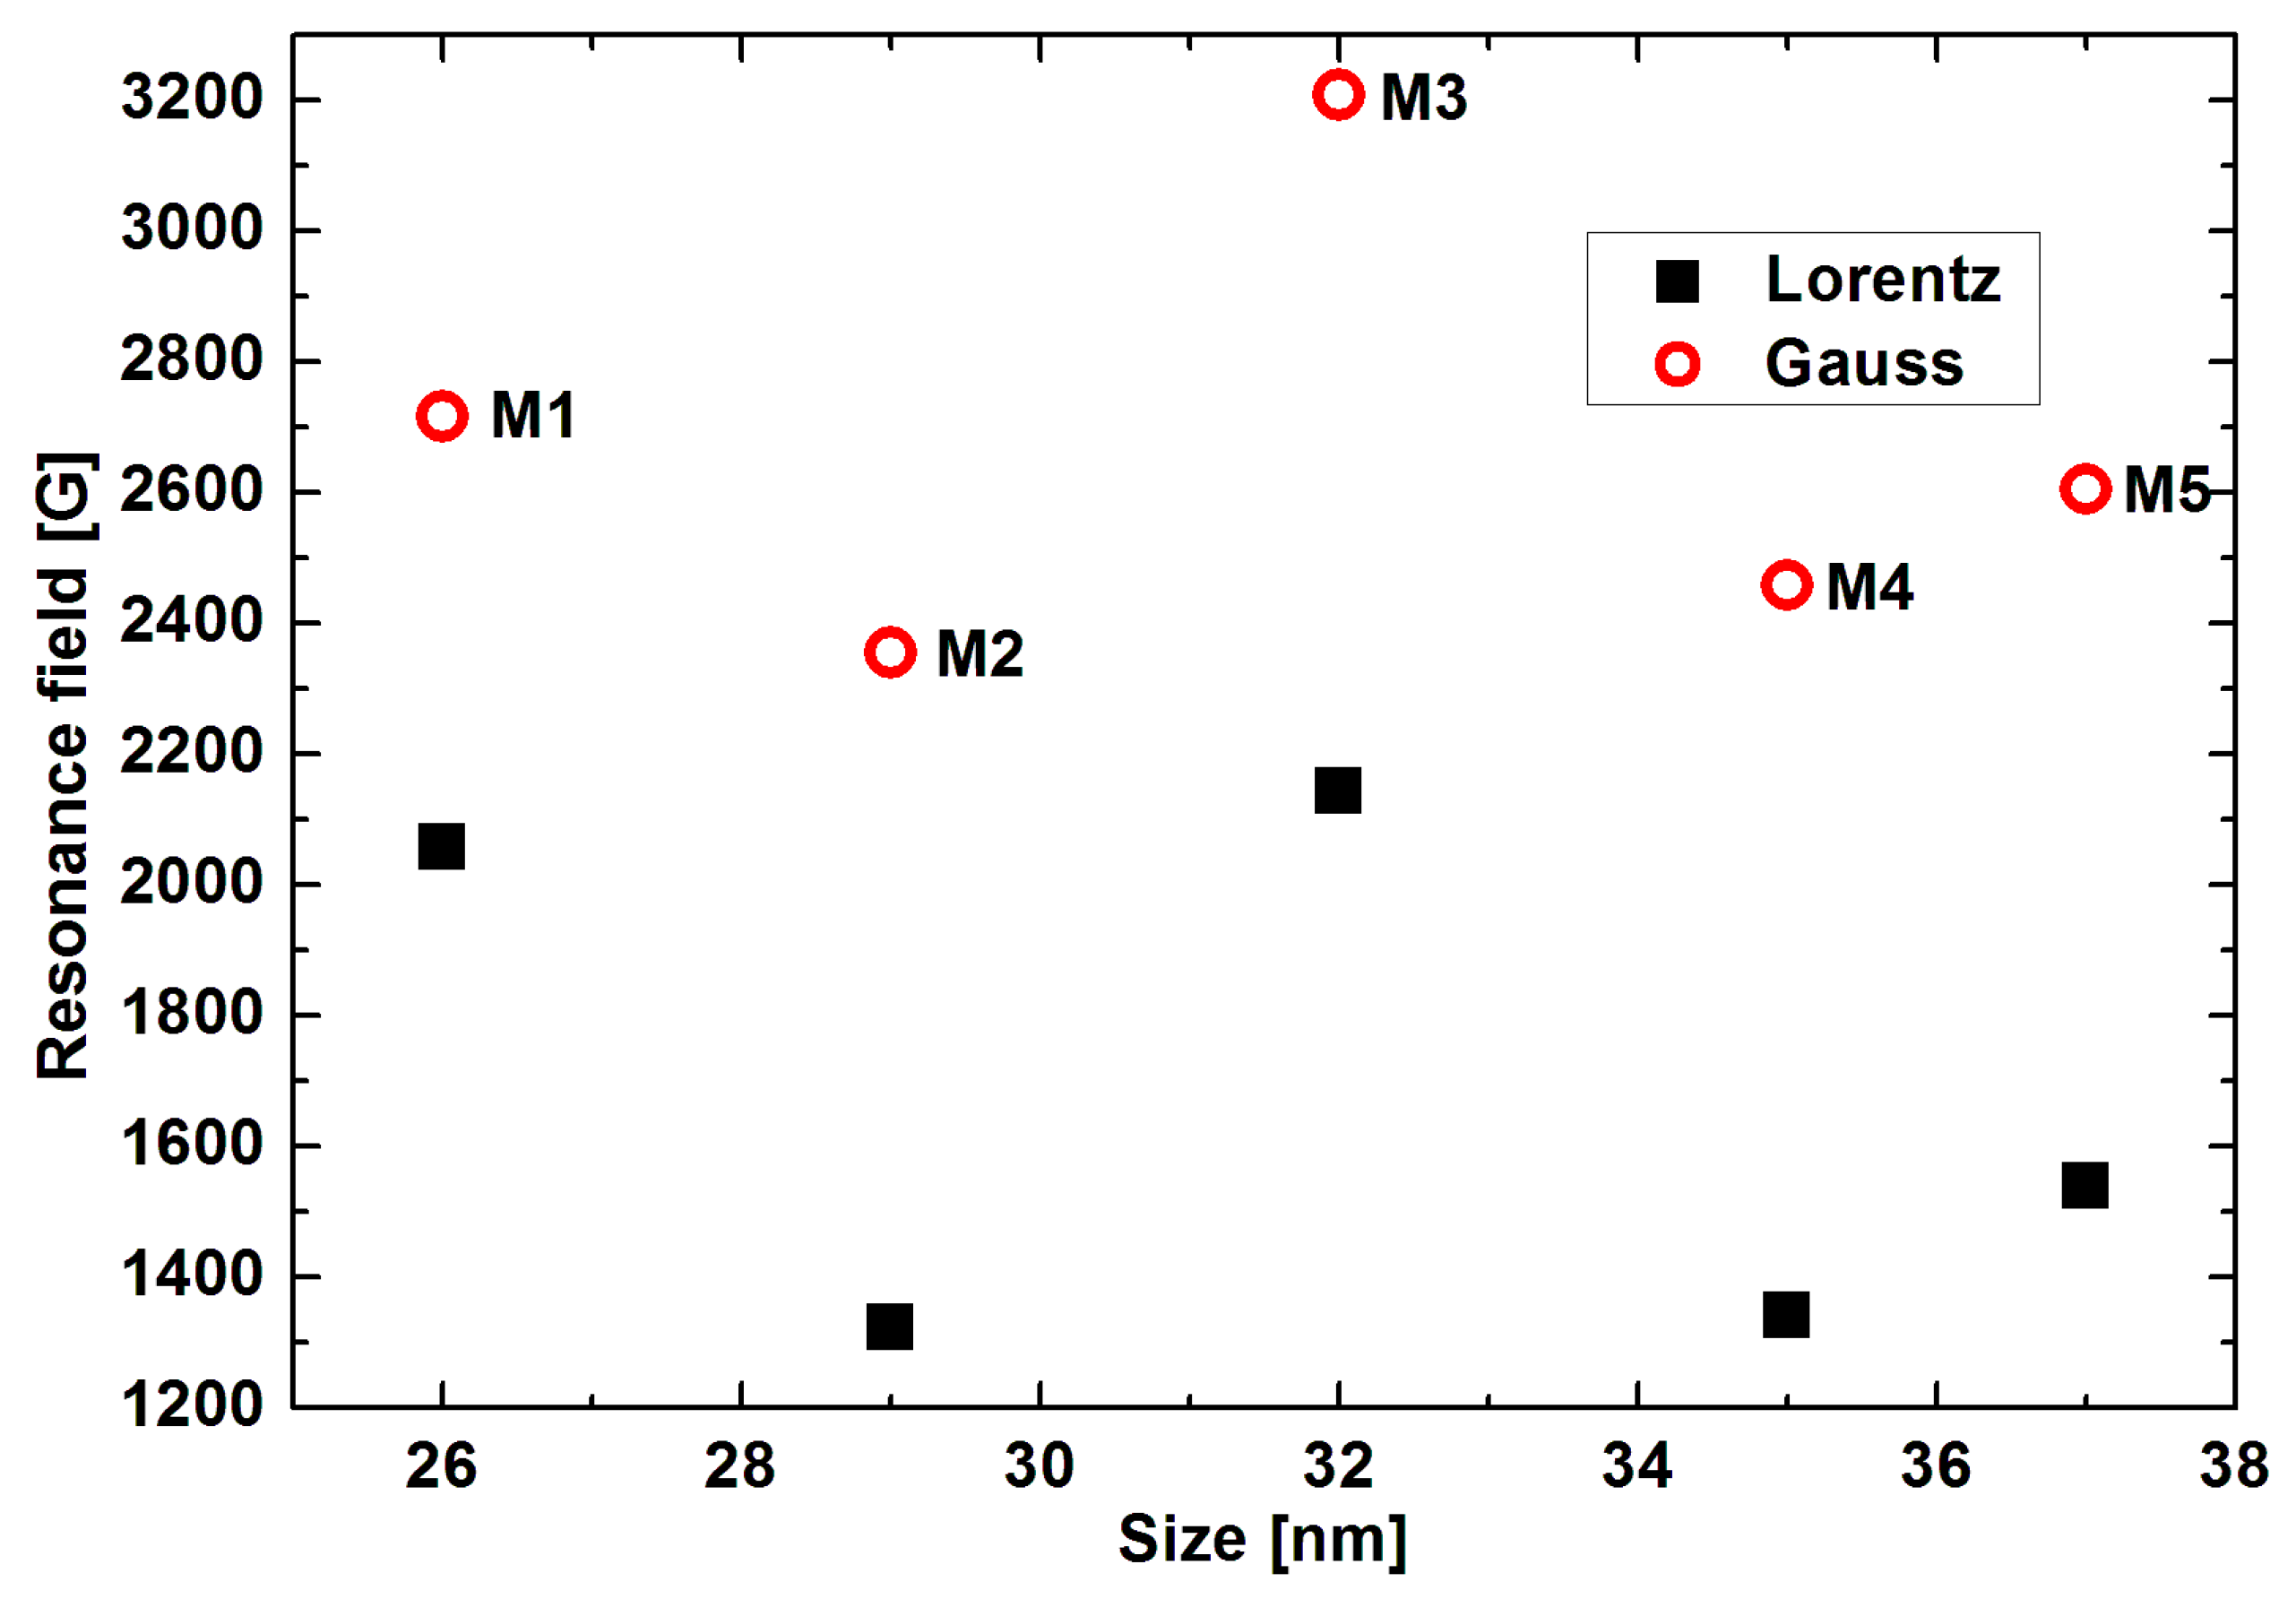
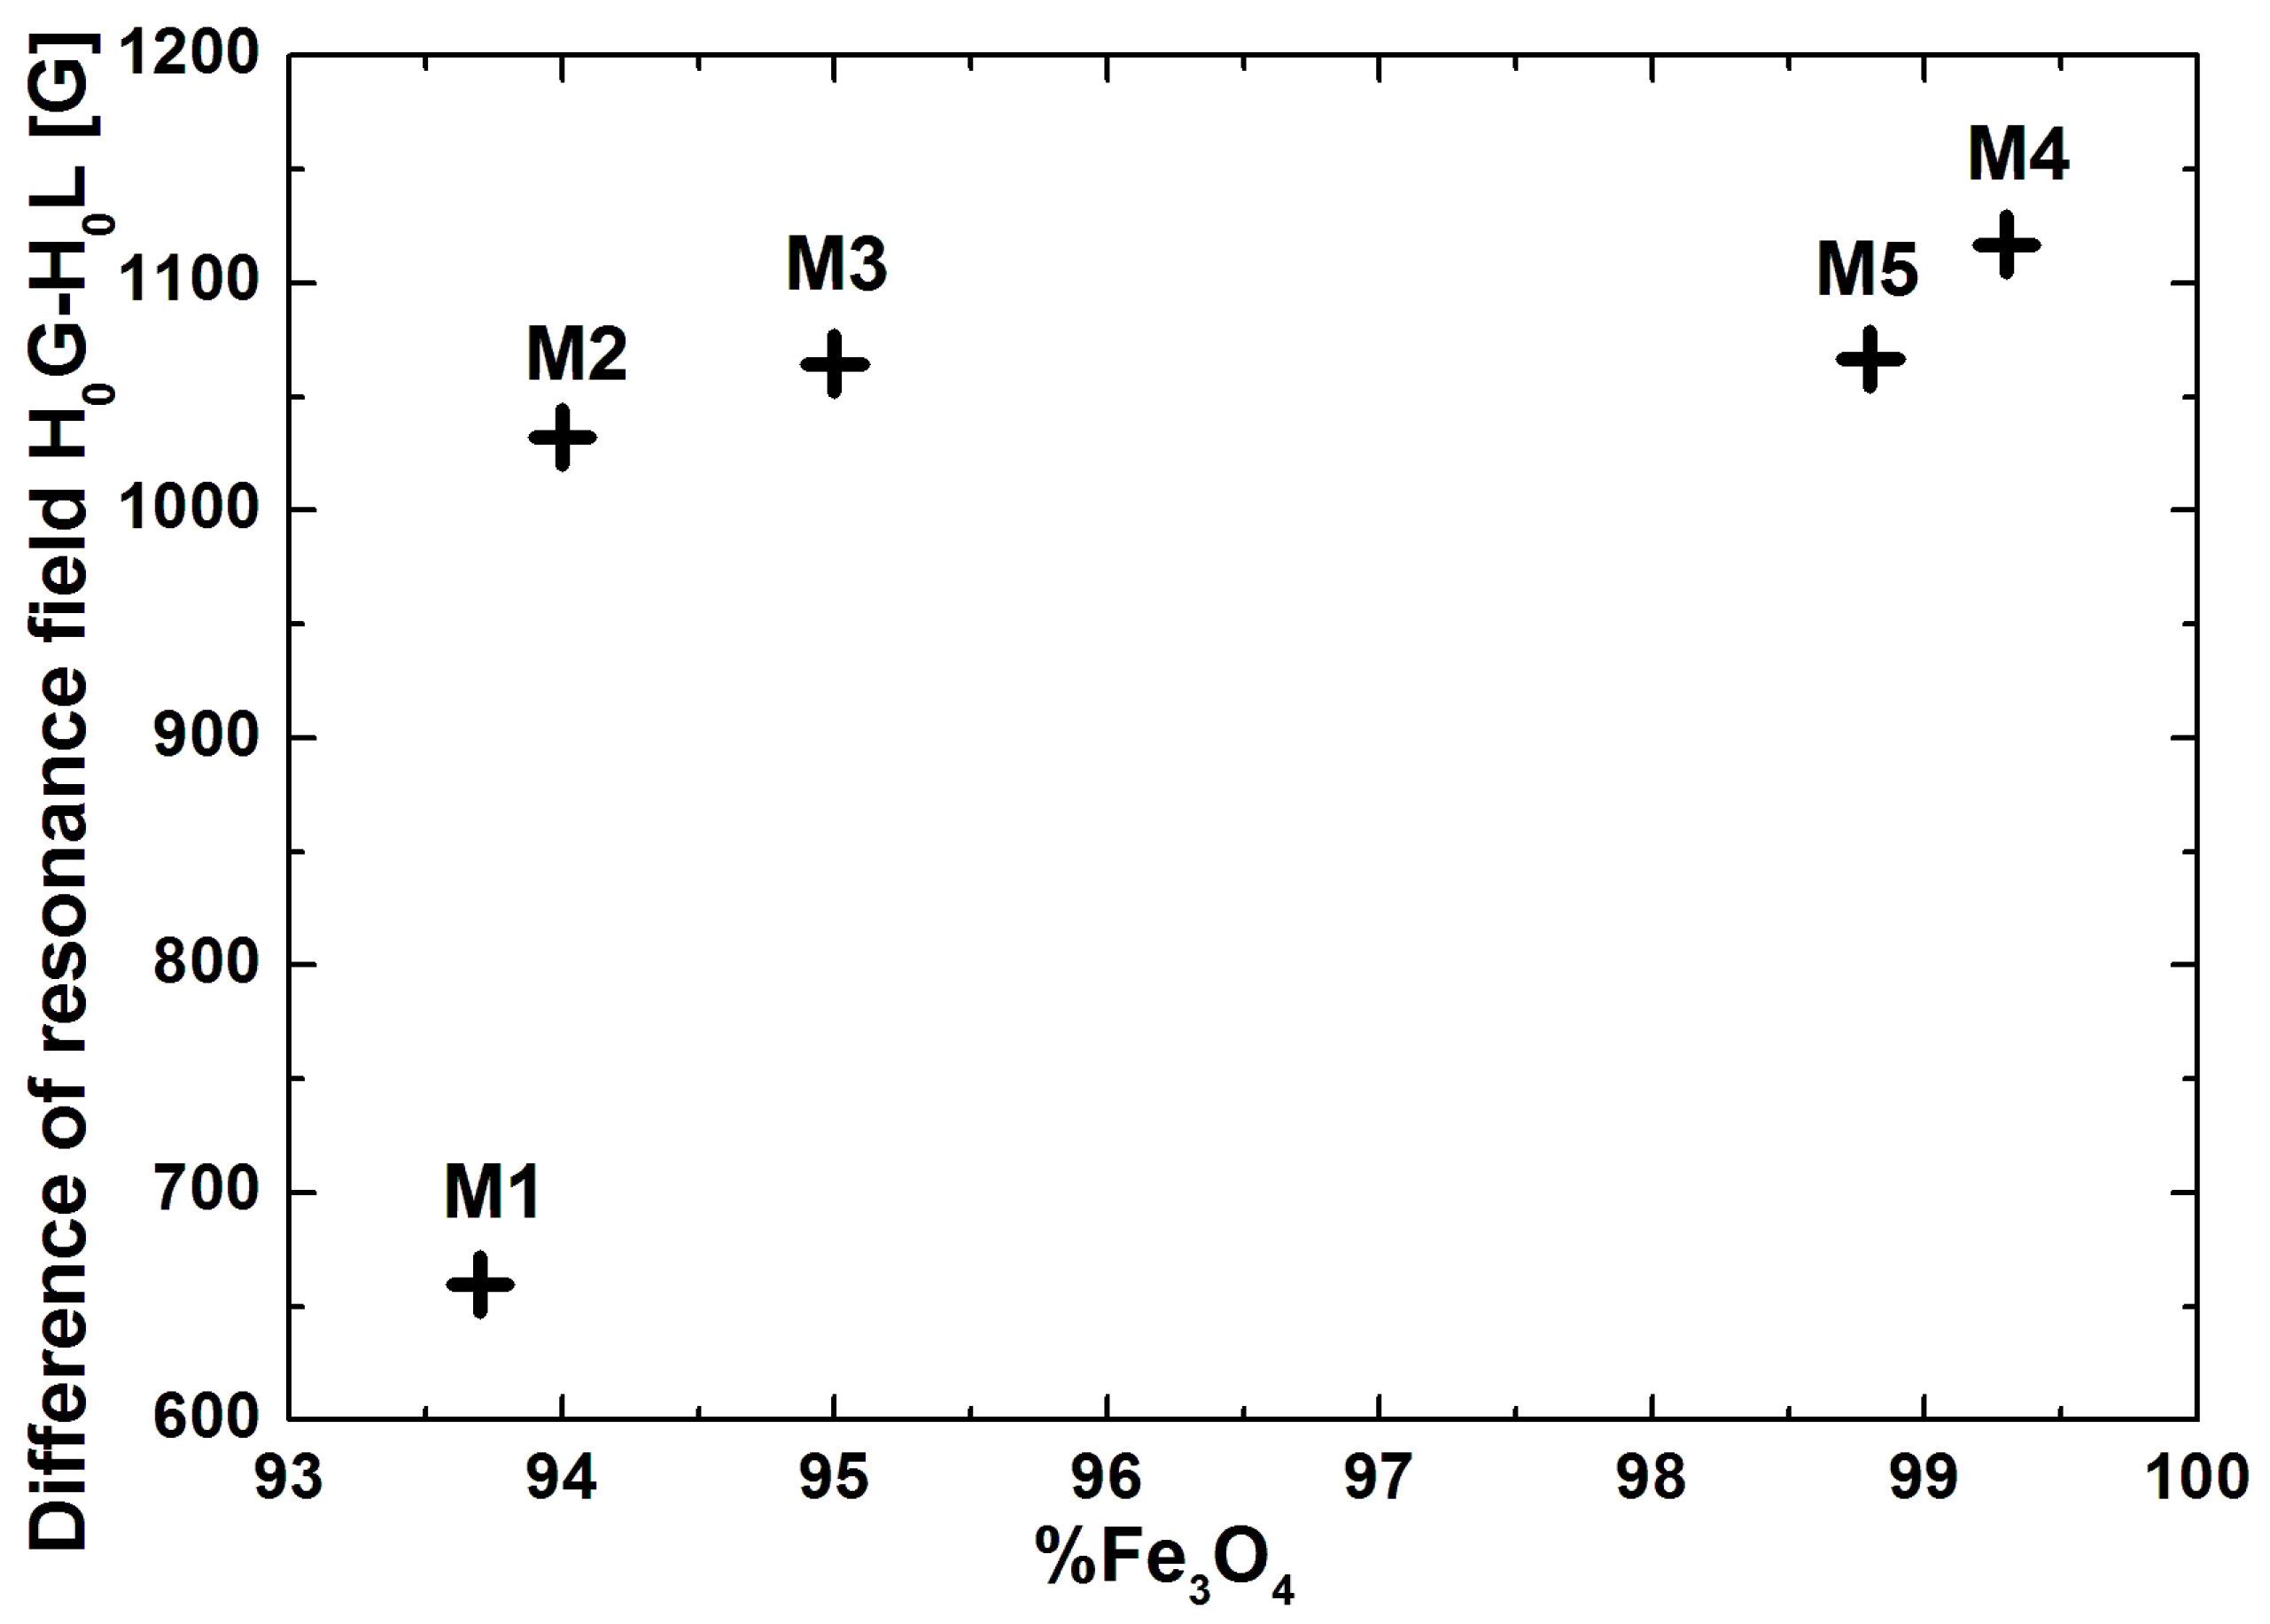
| Sample | Size [nm] | Resonance Field [G] | Difference of Resonance Field H0G-HoL [G] | Linewidth [G] | Integrated Intensity Iint [arb. units] | Total Integrated Intensity Iint [arb. Units] | |||
|---|---|---|---|---|---|---|---|---|---|
| Lorentz | Gauss | Lorentz | Gauss | Lorentz | Gauss | ||||
| M1 | 26 | 2058 | 2718 | 660 | 1601 | 1801 | 5.07 | 3.62 | 8.70 |
| M2 | 29 | 1324 | 2356 | 1032 | 1568 | 2499 | 2.87 | 6.78 | 9.65 |
| M3 | 32 | 2144 | 3209 | 1065 | 1578 | 1680 | 6.07 | 5.38 | 1.44 |
| M4 | 35 | 1341 | 2458 | 1117 | 1522 | 2523 | 3.67 | 10.75 | 14.42 |
| M5 | 37 | 1539 | 2606 | 1067 | 1649 | 2344 | 4.46 | 15.08 | 19.54 |
Disclaimer/Publisher’s Note: The statements, opinions and data contained in all publications are solely those of the individual author(s) and contributor(s) and not of MDPI and/or the editor(s). MDPI and/or the editor(s) disclaim responsibility for any injury to people or property resulting from any ideas, methods, instructions or products referred to in the content. |
© 2024 by the authors. Licensee MDPI, Basel, Switzerland. This article is an open access article distributed under the terms and conditions of the Creative Commons Attribution (CC BY) license (https://creativecommons.org/licenses/by/4.0/).
Share and Cite
Pelka, R.; Nowosielecka, U.; Klimza, K.; Moszyńska, I.; Aidinis, K.; Żołnierkiewicz, G.; Guskos, A.; Guskos, N. Nanocrystalline Iron Oxides with Various Average Crystallite Size Investigated Using Magnetic Resonance Method. Crystals 2024, 14, 363. https://doi.org/10.3390/cryst14040363
Pelka R, Nowosielecka U, Klimza K, Moszyńska I, Aidinis K, Żołnierkiewicz G, Guskos A, Guskos N. Nanocrystalline Iron Oxides with Various Average Crystallite Size Investigated Using Magnetic Resonance Method. Crystals. 2024; 14(4):363. https://doi.org/10.3390/cryst14040363
Chicago/Turabian StylePelka, Rafał, Urszula Nowosielecka, Kamila Klimza, Izabela Moszyńska, Konstantinos Aidinis, Grzegorz Żołnierkiewicz, Aleksander Guskos, and Nikos Guskos. 2024. "Nanocrystalline Iron Oxides with Various Average Crystallite Size Investigated Using Magnetic Resonance Method" Crystals 14, no. 4: 363. https://doi.org/10.3390/cryst14040363
APA StylePelka, R., Nowosielecka, U., Klimza, K., Moszyńska, I., Aidinis, K., Żołnierkiewicz, G., Guskos, A., & Guskos, N. (2024). Nanocrystalline Iron Oxides with Various Average Crystallite Size Investigated Using Magnetic Resonance Method. Crystals, 14(4), 363. https://doi.org/10.3390/cryst14040363