Article

New Insight into the Electronic and Magnetic Properties of Sub-Stoichiometric WO3: A Theoretical Perspective

Istituto di Scienze e Tecnologie Chimiche “Giulio Natta” (SCITEC), Consiglio Nazionale delle Ricerche (CNR), Via Golgi 19, I-20133 Milano, Italy
*
Author to whom correspondence should be addressed.
Current address: Department of Physics, Center for Atomic-Scale Materials Design (CAMD), Technical University of Denmark, DK-2800 Kongens Lyngby, Denmark.
Crystals 2024, 14(4), 372; https://doi.org/10.3390/cryst14040372
Submission received: 25 March 2024 / Revised: 9 April 2024 / Accepted: 11 April 2024 / Published: 16 April 2024
(This article belongs to the Special Issue Emergent Properties in Strongly Correlated Materials)

Abstract

:
We present a theoretical investigation on the wide-band-gap semiconductor WO   3 in its room-temperature monoclinic structure. We carried out density functional theory and GGA-1/2 calculations on the bulk phase and the most stable (001) surface of the material, either in their stoichiometric form or in the presence of oxygen vacancies at various concentrations. Concerning the bulk phase, our results show how the inclusion of these defects correctly reproduces the intrinsic n-type doping of the material. The system is also found to be magnetic at reasonably high defect concentrations. As for the surface, the presence of vacancies gives rise to a magnetic behavior, whose features depend on the relative arrangement of native point defects. Oxygen vacancies are also responsible for additional tungsten oxidation states in both bulk and surface. Based on these results, we provide a rationale for the interpretation of most experimental data of this material and, possibly, other widespread transition metal oxides with similar properties and applications such as ReO   3 , TiO   2 , and SnO   2 .

1. Introduction

Tungsten oxide WO   3 is a wide-band-gap semiconductor with a reference perovskite-like ABO   3 structure, where the A site is empty. The simplest structure of WO   3 is cubic, as for ReO   3 , and consists of a three-dimensional network of corner-sharing regular WO   6 octahedrons. Several distortions occur depending on temperature: the material exhibits a low-temperature monoclinic structure from 0 to 230 K [1,2], a triclinic structure from 230 to 290 K [1,3,4,5], followed by a room temperature γ -monoclinic structure from 290 to 600 K [3,4,6,7]. Above 600 K up to 1010 K, WO   3 converts into an orthorhombic phase [8,9,10,11,12], and above 1010 K it becomes tetragonal [10,12,13].
From an electronic point of view, WO   3 is a binary d 0 transition metal oxide well-known for its electrical and optical properties [14] and for its use as an electrochromic smart window [15], component of lithium-ion batteries [16], gas sensor [17,18,19,20], and chemiresistor [21]. As happens in all metal oxides, also in WO   3 the presence of oxygen vacancies is very common, whether intentionally incorporated during the synthesis or otherwise. In other words, WO   3 is predisposed to be sub-stoichiometric with actual formula WO   3 δ . The detailed study of these point defects and of their concentration is highly relevant because they drive numerous functional properties such as, for example, electrochromism [15,22,23,24,25].
The sub-stoichiometric oxygen content induces the occurrence of oxygen vacancy (V   O ) electronic states, which are considered responsible for the n-type doping of these materials, with two electrons released in the lattice for every absent oxygen atom [15,26,27]. The exact essence of the electronic states associated with these defects and their positions within the band-gap is still debated [28,29,30,31] and deserves, in our opinion, a further investigation. To this end, we present here accurate, periodic density functional theory-based ab initio calculations of the structural, electronic, and magnetic properties of monoclinic WO   3 and defective WO   3 δ , aiming at elucidating the fundamental aspects of the electronic properties induced by oxygen vacancies. The spectral properties only (band structure and density of states) are computed within the GGA-1/2 approach [32,33], a method based on the Janak theorem [34] that describes the energy gap extremely better than standard DFT approaches [35,36,37,38,39].
In the study of stoichiometric and non-stoichiometric bulk tungsten oxide, the following topics will be highlighted: (i) the estimate of the energy gap, (ii) the determination of the oxidation states of W atoms using the quantum theory of atoms in molecules (QTAIM) [40], (iii) the magnetic properties, (iv) the estimate of the formation enthalpy of an oxygen vacancy as a function of vacancy density, and (v) the band structures.
This study also includes the analysis of the properties of the most stable WO   3 δ surface, namely, the (001). The interplay between the electronic states generated by bulk oxygen vacancies and those arising from the truncation of the bulk due to surface formation has been investigated as well, eventually in the presence of surface oxygen vacancies [41,42].
The article is organized as follows: in the next section we report the details of the computational setup adopted in this study. The electronic and magnetic structures of WO   3 -based systems are described in Section 3, which is divided into four main subsections concerning (Section 3.1) the stoichiometric bulk, (Section 3.2) the non-stoichiometric bulk, (Section 3.3) the stoichiometric (001) surface, and (Section 3.4) the non-stoichiometric (001) surface. The conclusions are presented in Section 4.

2. Method

Ab initio calculations were performed on the γ -monoclinic phase of WO   3 using the density functional theory (DFT) with the GGA Perdew–Burke–Ernzerhof exchange-correlation energy functional [43], as implemented in the SIESTA code [44]. We adopted pseudopotentials of non-local norm-conserving Troullier–Martins type [45]. The parameters for the pseudopotential of W atoms (frozen [Xe] 4 f 14 core) were taken from Ref. [46], but with a slightly different valence configuration, i.e., 5 d 5 6 s 1 . As for O atoms (frozen [He] core), we fixed a cutoff radius—equal for all angular channels—to 1.47 Å. The basis set was constituted by double- ζ localized atomic orbitals for various angular components. For W atoms, we used the basis set proposed by Rivero et al. [46], while for oxygens, we adopted the basis set suggested by Lambert-Mauriat et al. [47], except for the second cutoff radius of the 2s basis function, set to 2.2 bohr. In defective systems, we placed a ghost atom in the vacancy site, along with its basis set, to account for the basis set superposition error (BSSE). Integrations in the Brillouin zone were performed by a summation on a dense grid of k-points with maximum spacing between contiguous points equal to 0.075 Å   1 . This choice is equivalent to a 6 × 6 × 6 k-points mesh for the 32 atoms unit cell. The real space grid is equivalent to a plane wave energy cut-off of 550 Ry. The optimization of the cell parameters and the relaxation of atomic positions were performed until the residual atomic forces were smaller than 0.04 eV/Å   1 . We verified in some model cases that when halving this value, the change in total energy per atom is smaller than 2 · 10 6 eV and the largest atomic displacement is less than 0.0015 Å.
At variance with the approach described above, the electronic structure of the relaxed systems was computed within the GGA-1/2 approach, applied to the oxygen atoms only. In particular, we used the same exchange-correlation functional, i.e., GGA-PBE, and a cut-off value C U T equal to 2.5 bohr (see Refs. [32,33] for more details). We adopted the GGA-1/2 scheme instead of the more widespread DFT+U method since it is parameter-free and it does not affect the computational cost of the calculations.
Information on the chemical properties of WO   3 such as, for example, the nature of O–W bonding and the oxidation states of the metal atoms was gathered using the quantum theory of atoms in molecules (QTAIM) [40], as implemented in the Critic2 code [48]. This theory is based on the topological analysis of the real space electron density distribution and is well grounded in quantum chemistry. The QTAIM has a growing popularity because it is model-free, thus enabling us to perform a direct comparison among the results obtained with different approaches, both theoretical and experimental.

3. Results

3.1. Stoichiometric WO   3 Bulk

3.1.1. Structural Properties

We considered the γ -monoclinic phase of WO   3 (space group P2   1 / n ), constituted by eight WO   6 octahedrons joined via oxygen atoms bridging two tungsten ones (W8O24). The optimized unit cell (the guess for the optimization procedure was derived from an experimental determination of this phase [49]) with unique axis b is reported in Table 1, along with other experimental and theoretical results taken from the literature.
The disposition of the atoms inside the unit cell and their connectivity are well-known, and previous computational works [47,58,60] already reported them. The octahedrons are slightly tilted with respect to one another and the W atoms are a bit off-center; hence, the O–W bond lengths along the three crystallographic vectors differ. Their experimental and theoretical values are reported in Table 2.
The overall agreement is good: the differences between pairs of long and short bonds deviate from the experiments by less than 0.1 Å, suggesting that the computational framework adopted is suitable for the description of structural properties.

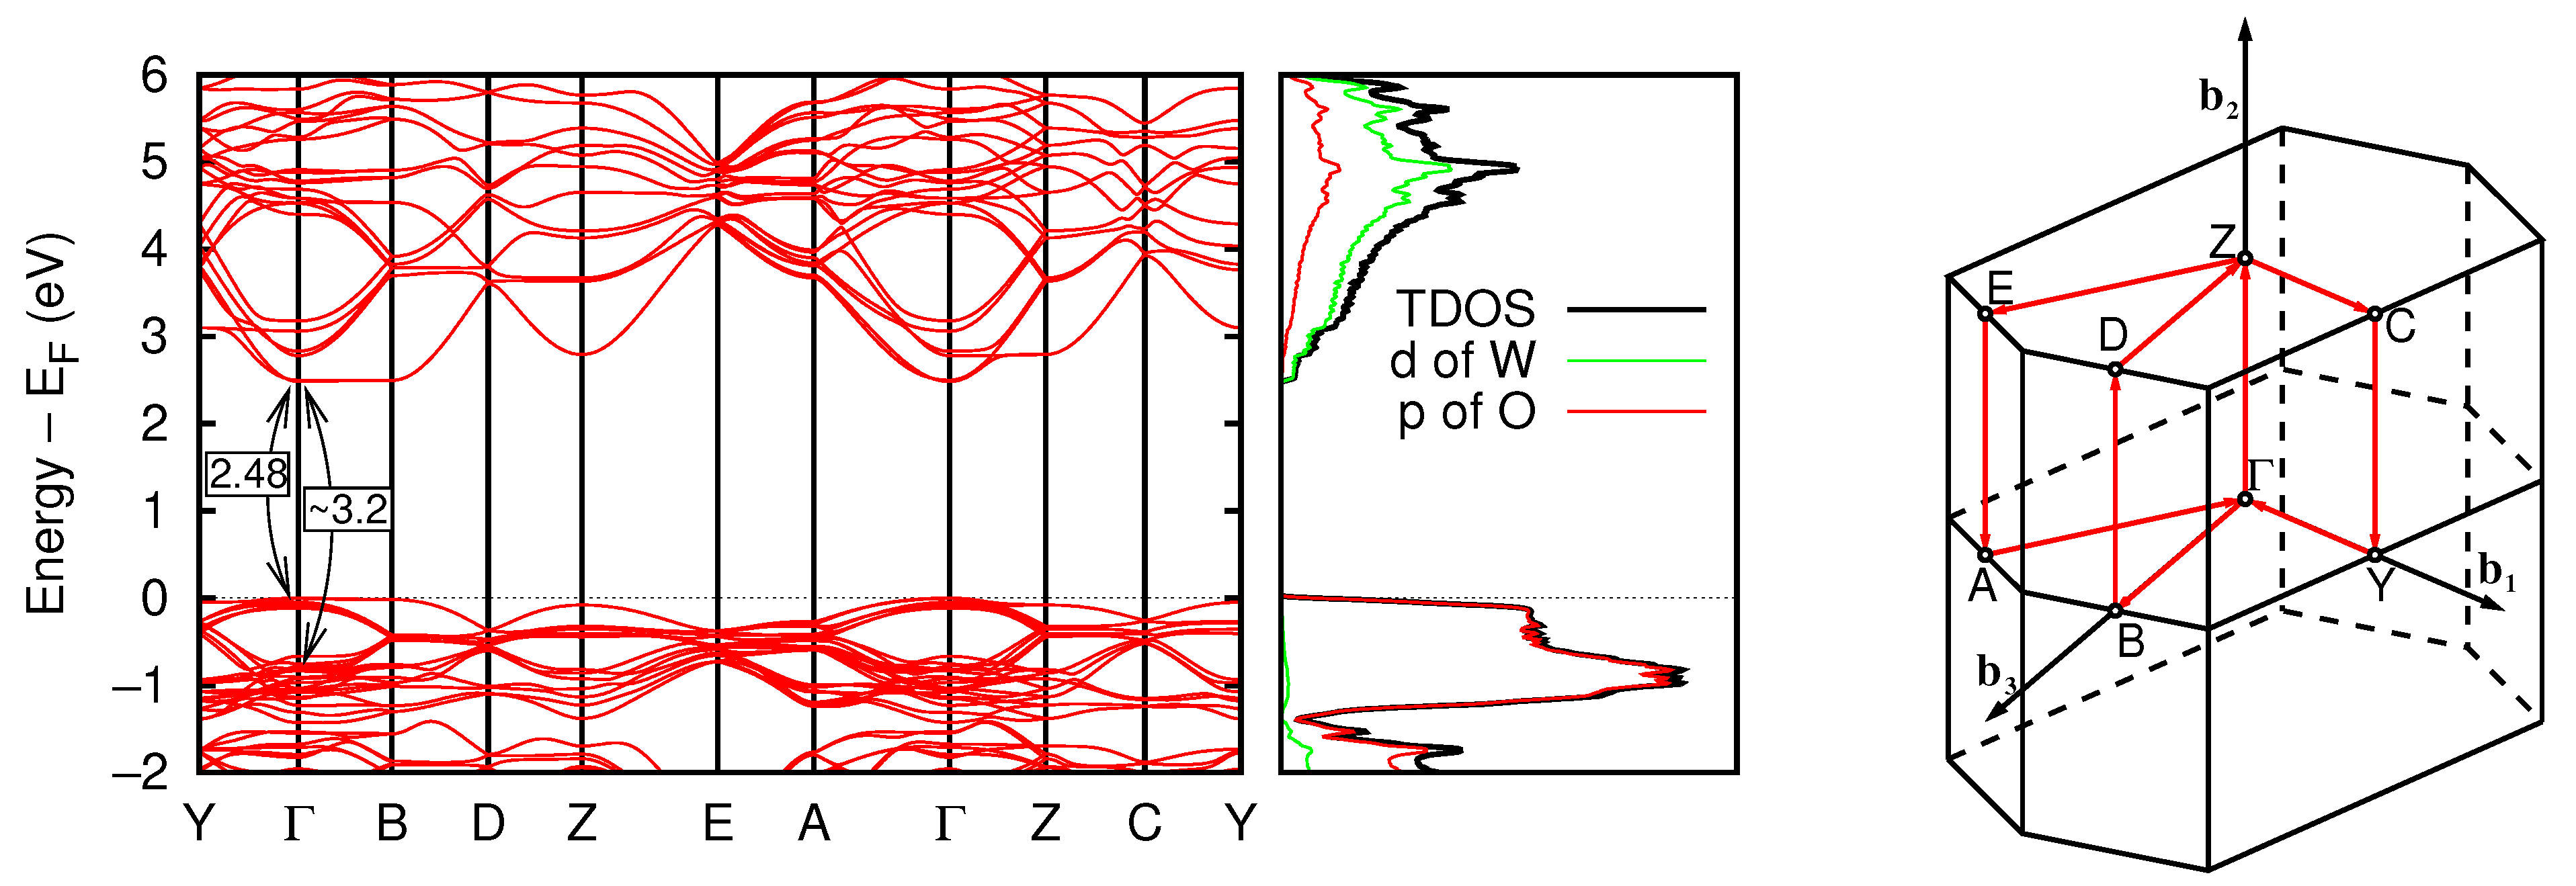
3.1.2. Electronic Properties

For what concerns the electronic properties, the system is a d 0 transition metal oxide with an energy gap in the range of 2.6–2.7 eV [21,52,53,54] (see Table 1 for detailed values), which is in general considered indirect. The energy gap computed with standard exchange-correlation functionals is always significantly underestimated. On the contrary, B3LYP (possibly with different percentages of exact exchange [61,67,68]) and HSE06 [61,62] functionals provide reasonably correct energy gaps, though somewhat overestimated. Noteworthily, the correct evaluation of this quantity plays a key role for a reliable description of the electronic properties of WO   3 -based systems.
Figure 1 reports the band structure together with the density of states (DOS) of non-defective WO   3 . The Brillouin zone and the special points used to draw the bands are also reported (in agreement with the Bilbao Crystallographic Server [69] at http://www.cryst.ehu.es (accessed on 10 January 2023) for the selected space group and unique axis b ; please note the difference with respect to Ref. [68]). The first issue is that the computed energy gap is direct while the experiments suggest that it is indirect [52,53]. This discrepancy between theory and experiment is easily explained by considering that the transition matrix elements have negligible values for transitions between the highest occupied state and the lowest unoccupied state at Γ . Indeed, the γ -monoclinic phase can be considered a small distortion of the cubic phase, in which the gap is definitely indirect. From a detailed inspection of Figure 2, one deduces that the highest energy value of the valence band (VB) in Γ corresponds to the folded M and R points of the Brillouin zone of the simple cubic unit cell. The direct gap must be associated to the transition between unfolded states in Γ . The occupied one resides 0.72 eV below the top of the VB, and the empty one corresponds to the lowest unoccupied state. This was first suggested in Ref. [58] and subsequently proved by Huda et al. [59] and Migas et al. [60] computing the optical absorption. Our computed width of the band-gap at Γ is 2.46 eV, to be compared with the experimental values of 2.6–2.7 eV [21,52,53,54]. The direct transition is found at about 3.2 eV, to be compared with 3.4–3.5 eV [26,52,55].
This excellent agreement—equal or even better than the accord obtained using more demanding approaches like HSE06 or GW—is obtained within the parameter-free GGA-1/2 approach. Furthermore, using the experimental cell parameters (see Table 1) instead of the optimized GGA-PBE ones, which are slightly longer, we find a band-gap amounting to 2.69 eV, in perfect agreement with the measured data. The accuracy of the GGA-1/2 approach is further proved by comparing our theoretical results for the cubic phase to the ones obtained in GW   0 [54]. The indirect gap and the vertical gap at Γ are 1.70 eV and 2.54 eV in our calculation (lattice parameter 3.87 Å), to be compared with 1.6 eV and 2.63 eV in the GW   0 case, without any indication about the lattice parameter.
Looking at the left panel of Figure 1, the presence of three very flat bands in the conduction band (CB) can be detected. They originate at Γ and extend along the three crystallographic directions. Among them, the lowest in energy, not dispersed along the b 3 ( Γ –B direction), is fully localized on the x y plane, as can be clearly seen in Figure 3. The same applies for the other two flat bands in the CB, which have slightly higher energies and are localized along the x z and the y z planes.
We also performed an electron density distribution analysis of the system, based on the QTAIM approach. The population on the two non-equivalent W atoms is 0.43 e and 0.42 e, while for the six inequivalent O we found 8.03 e (O atoms belonging to the chains along a ), and 7.76–7.78 e for the others. From these data, it emerges that O–W bonds along the b and c directions are not purely ionic but contain a hybridization contribution estimated equal to 11%.

3.2. Defective Bulk: WO   3 δ

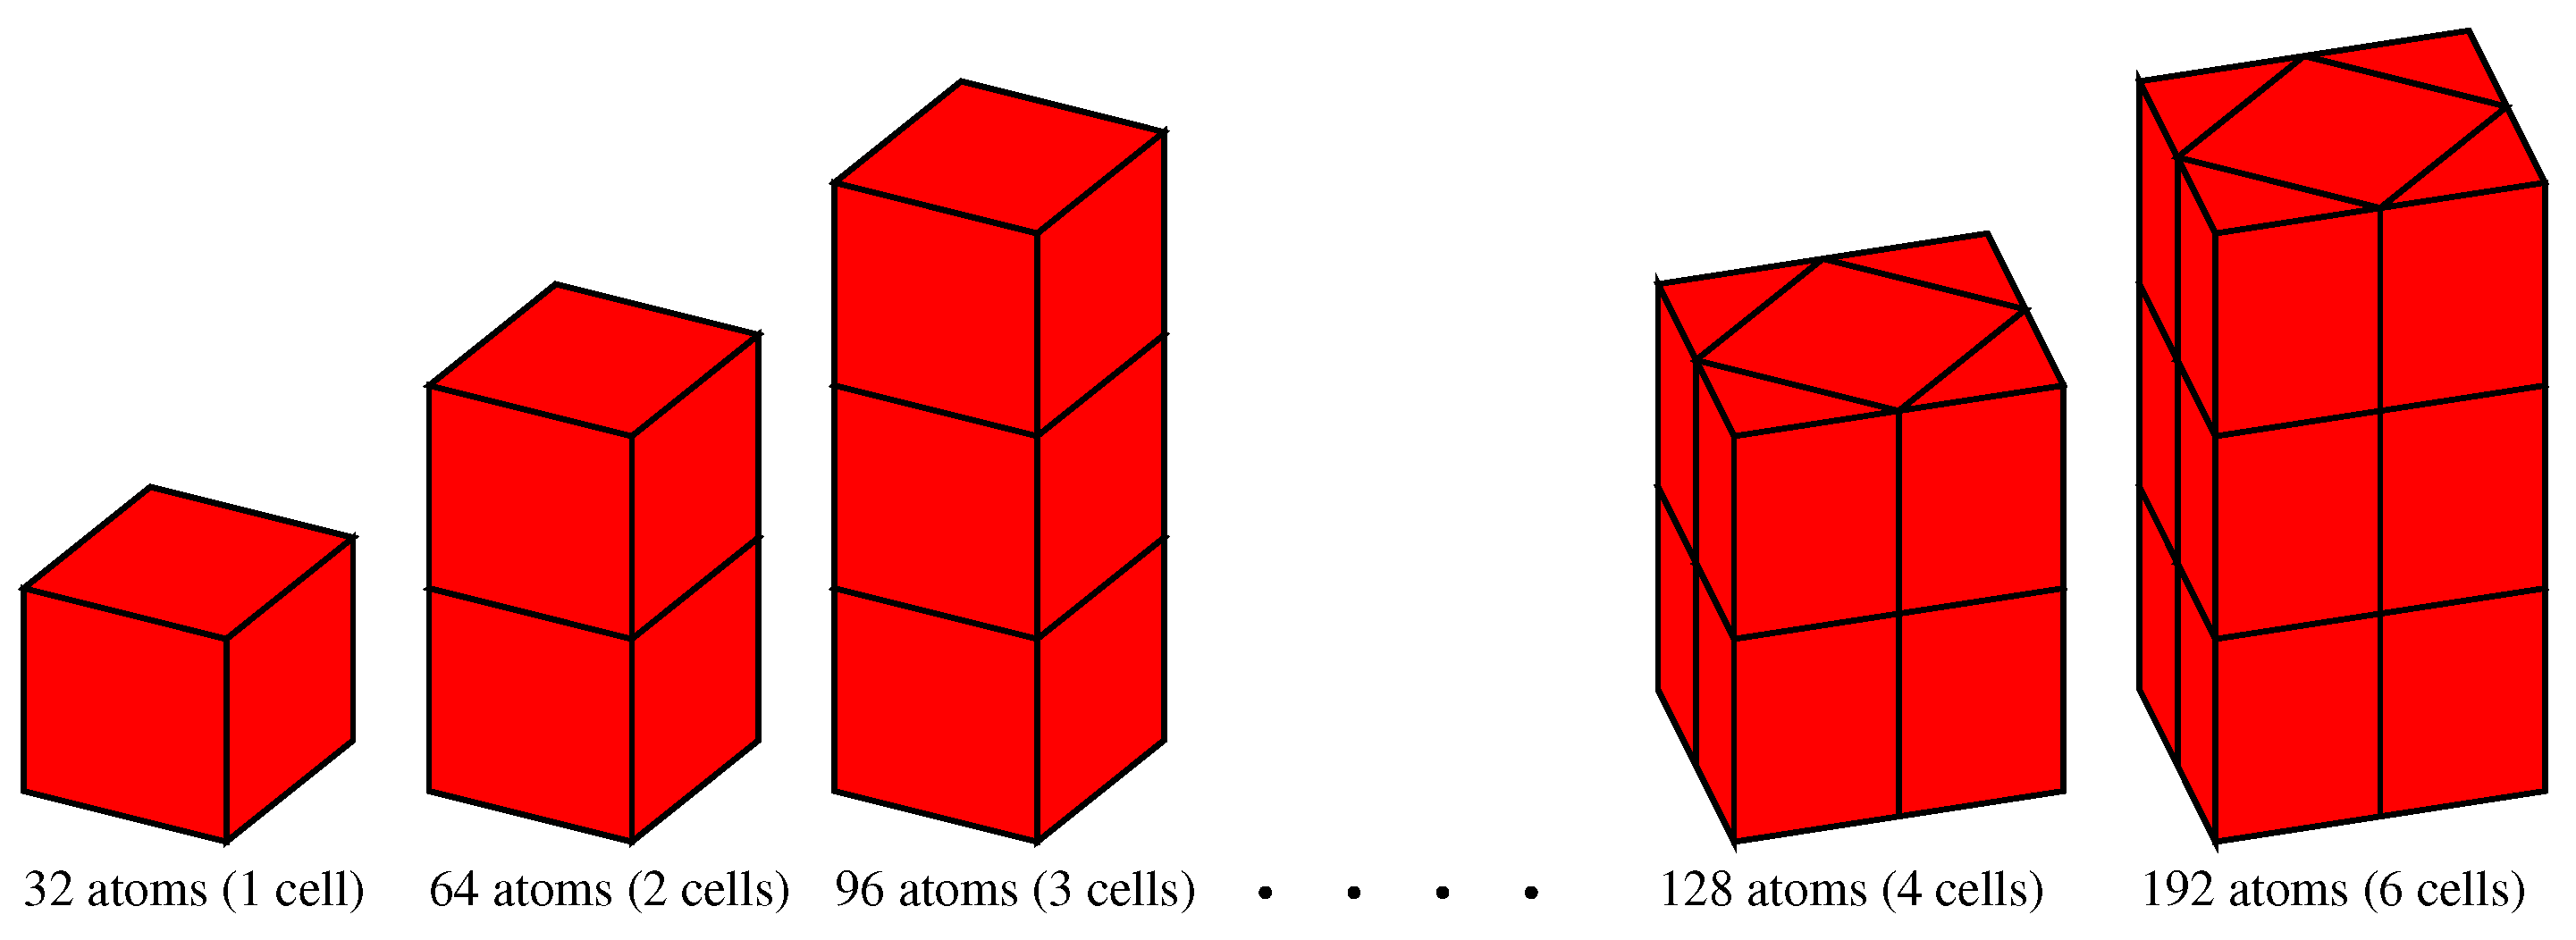
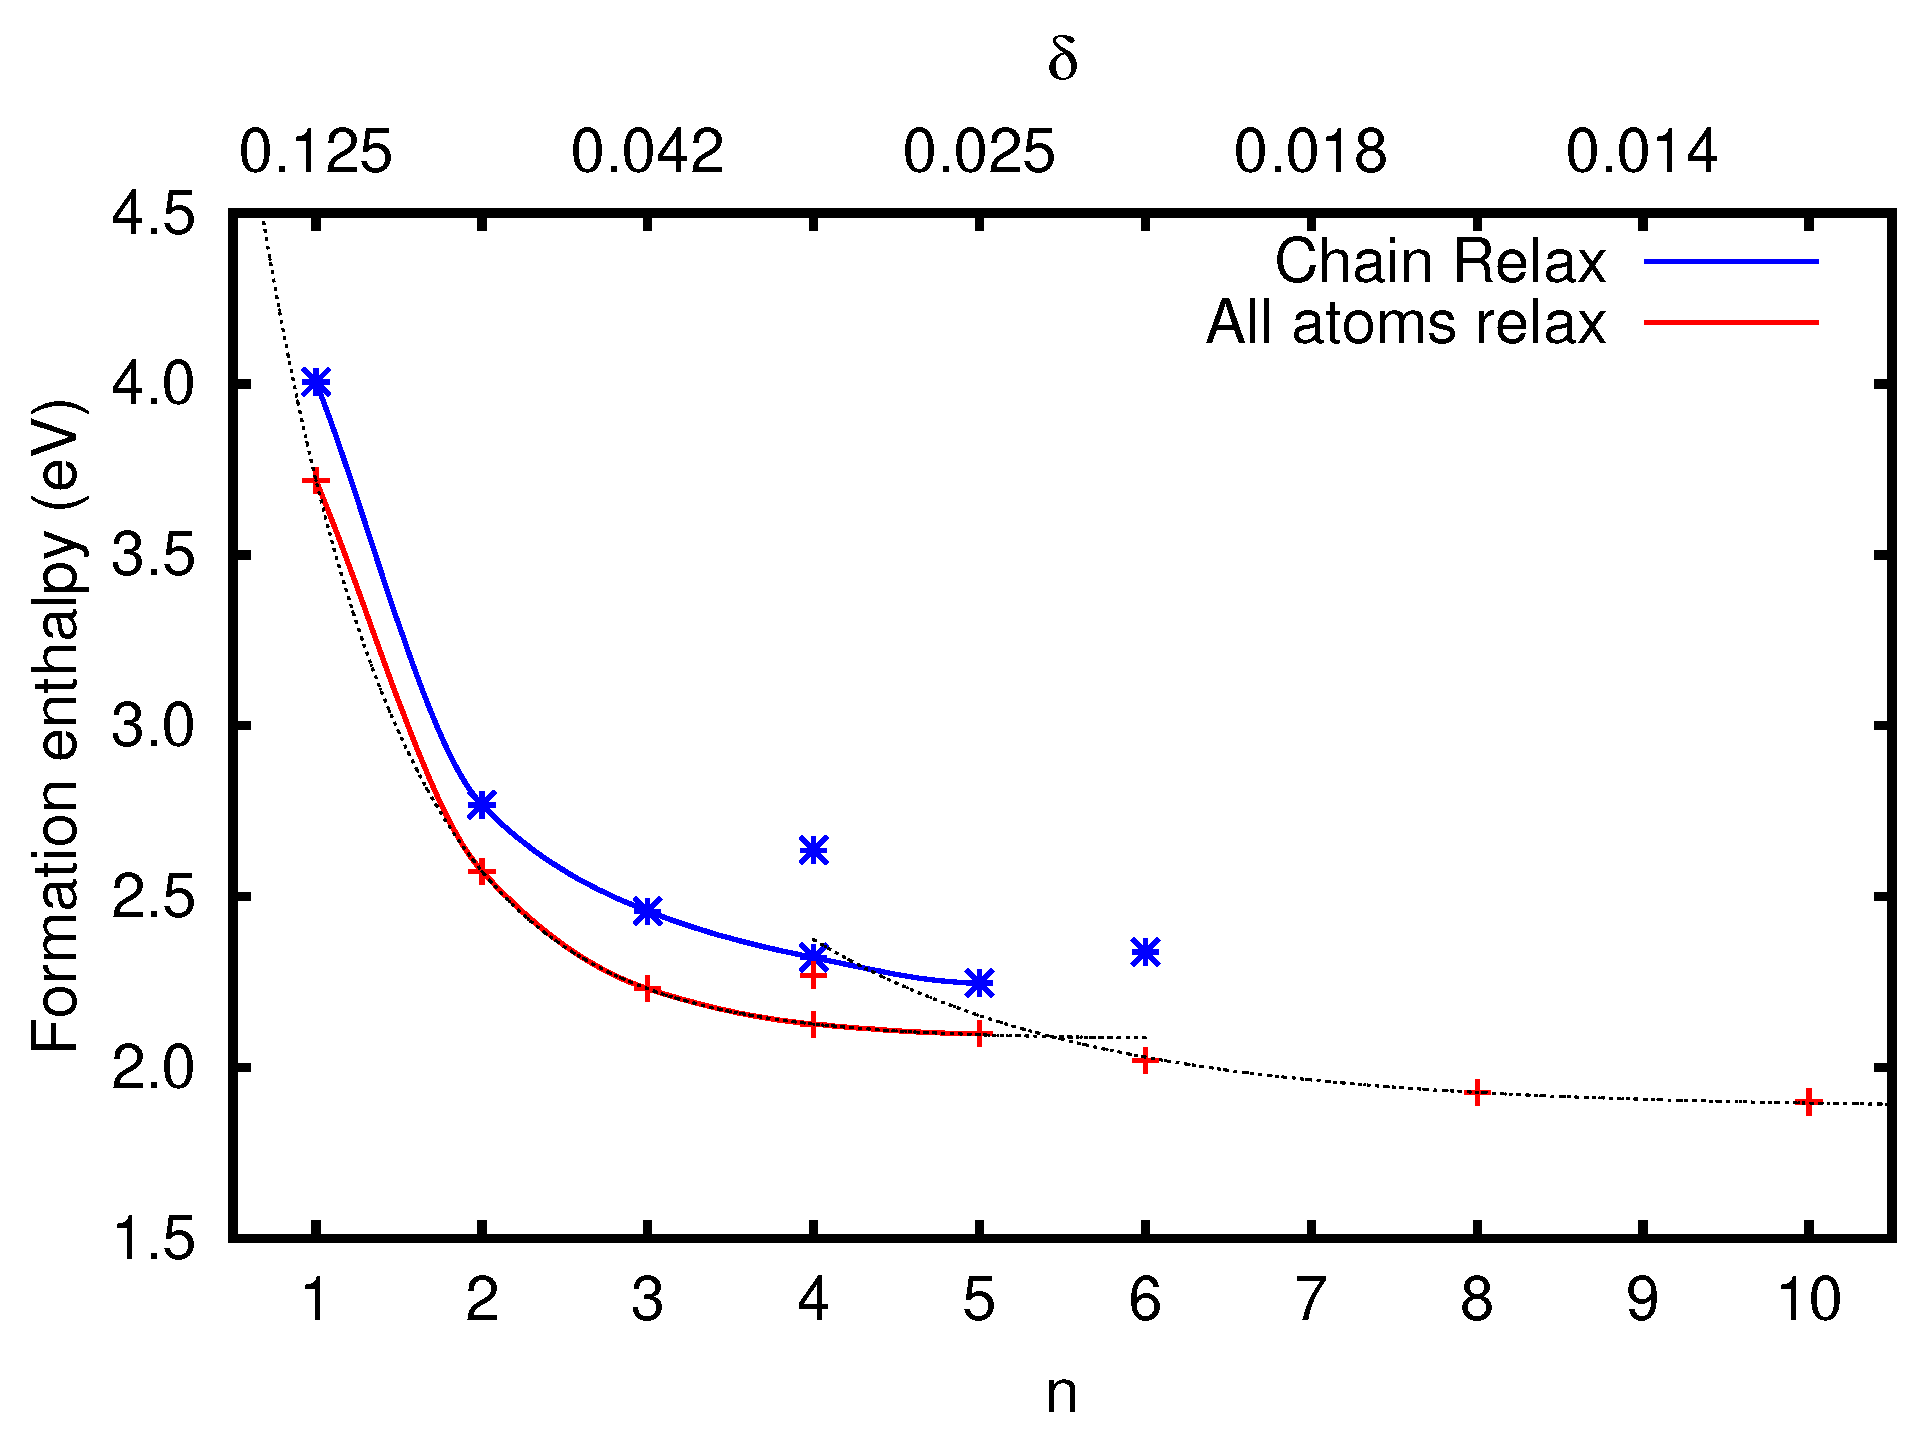
3.2.1. Vacancy Formation Energies

The intrinsic n-doped semiconductor behavior of WO   3 , widely recognized in the literature [26,27,47], is probably due to the most abundant defects found in this material, i.e., oxygen vacancies (V   O ). Indeed, they are likely to induce a shift of the Fermi level towards the CB, populating new states close to it and producing the observed intrinsic n-doping. Our promising results on the stoichiometric material, and especially the excellent agreement between the experimental and calculated energy gap, allow us to approach the defective medium, i.e., the oxygen-deficient case, with a high level of confidence.
The standard procedure for producing WO   3 gives rise to a natural lack of oxygen with respect to the stoichiometric formula. In the literature, different values for δ in WO   3 δ , ranging from 0 up to 0.3, have been reported [29,56,70]. Our study considers 0.0208 δ 0.125 , corresponding to the removal of just one oxygen atom in simulation cells that are 6, 5, 4, 3, 2, and 1 times larger than the unit cell (32 atoms). In Figure 4, the cells used for the defective systems are reported.
Since our computational approach is subject to periodic boundary conditions, the arrangement of the oxygen vacancies is ordered and, especially in the case of small cells, this generates a vacancy–vacancy interaction along the whole lattice. As a consequence, the formation of a vacancy state that is actually a band could be observed. This approach also prevents the finding of any large polaronic solution, which would require the use of a very large supercell [71]. Within this approach, there are six inequivalent positions for an oxygen vacancy, two for each crystallographic direction. In this work, we consider only vacancies distributed along the c axis, being the most energetically stable case [47,67,72].
Since the choice of the structural optimization scheme can affect the results, we tested three different strategies: (i) relaxation of the chain of atoms along the direction of the created vacancy (i.e., along the c axis in this work) and of the nearest neighbor oxygen atoms, (ii) relaxation of the coordinates of all the atoms of the simulation unit cell, and (iii) relaxation of all the atoms and also of the lattice cell vectors. The last case can produce fictitious results because of the strain due to the cooperative effect of the periodically arranged vacancies, especially for small cells (i.e., high vacancy densities), and will be skipped in the discussion. In Table 3, we report the formation energy (enthalpy) of one oxygen vacancy for different vacancy densities, as obtained by the following relation:
E O 2 ( n ) = E O v ( n ) + 1 / 2 E ( O 2 ) E bulk ( n ) ,
where E O v ( n ) is the total energy of the defective bulk, i.e., one single O vacancy in n unit cells, E ( O 2 ) is the computed energy of the O   2 molecule in the gas phase, and E bulk ( n ) is the total energy of n cells of non-defective bulk.
Some values of E O 2 ( n ) are reported in the literature and they span quite a wide range: 3.87, 2.87, and 2.53 eV reported in Ref. [47] must be compared with our 3.72, 2.57, and 2.13 eV. A very large value is proposed in Ref. [67], i.e., 5.32 eV, to be compared with our 3.72 eV. The same authors report 4.2 eV for a smaller density of vacancies (2.27 eV in our study) [68]. Figure 5 shows the computed formation enthalpies while varying the vacancy density. The solid lines report the results obtained as a function of the cell length along the c axis, while the symbols report the results obtained by doubling the cell width in the x y plane (c(2 × 2) supercell).
From the analysis of these results, we note that: (i) the expected decrease in the formation enthalpies, observed while increasing the cell length, converges for computational cells made of five or more unit cells; (ii) the full relaxation of all the atomic coordinates gives a further energy gain that amounts to ∼0.2–0.3 eV and a corresponding decrease in the formation enthalpy; (iii) the same decrease is observed, as expected, while increasing the cell width and it implies an energy gain of 0.1 0.3 eV; (iv) the effect of the cell length is more relevant with respect to the cell width; in fact, the relaxation energy is larger for long cells than for large ones having the same volume (see the case of supercells c ( 2 × 2) × 2 and 1 × 1 × 4). This confirms that the relaxation due to the oxygen vacancy is essentially along the direction containing the defect (the c axis in this case). It is our opinion that the relaxation of the cell parameters could introduce a source of error because of the cooperative strain due to the periodically arranged vacancies, resulting in underestimated values of the formation enthalpy. Additional relaxation of the cell parameters gives a further decrease in this quantity amounting to 0.2 0.3 eV, but it is probably underestimated due to cooperative strain.
We verified that, when no relaxation at all is performed, exactly the same formation enthalpy is obtained for all the systems considered, i.e., independently on the vacancy density, and it amounts to 5.1 eV.

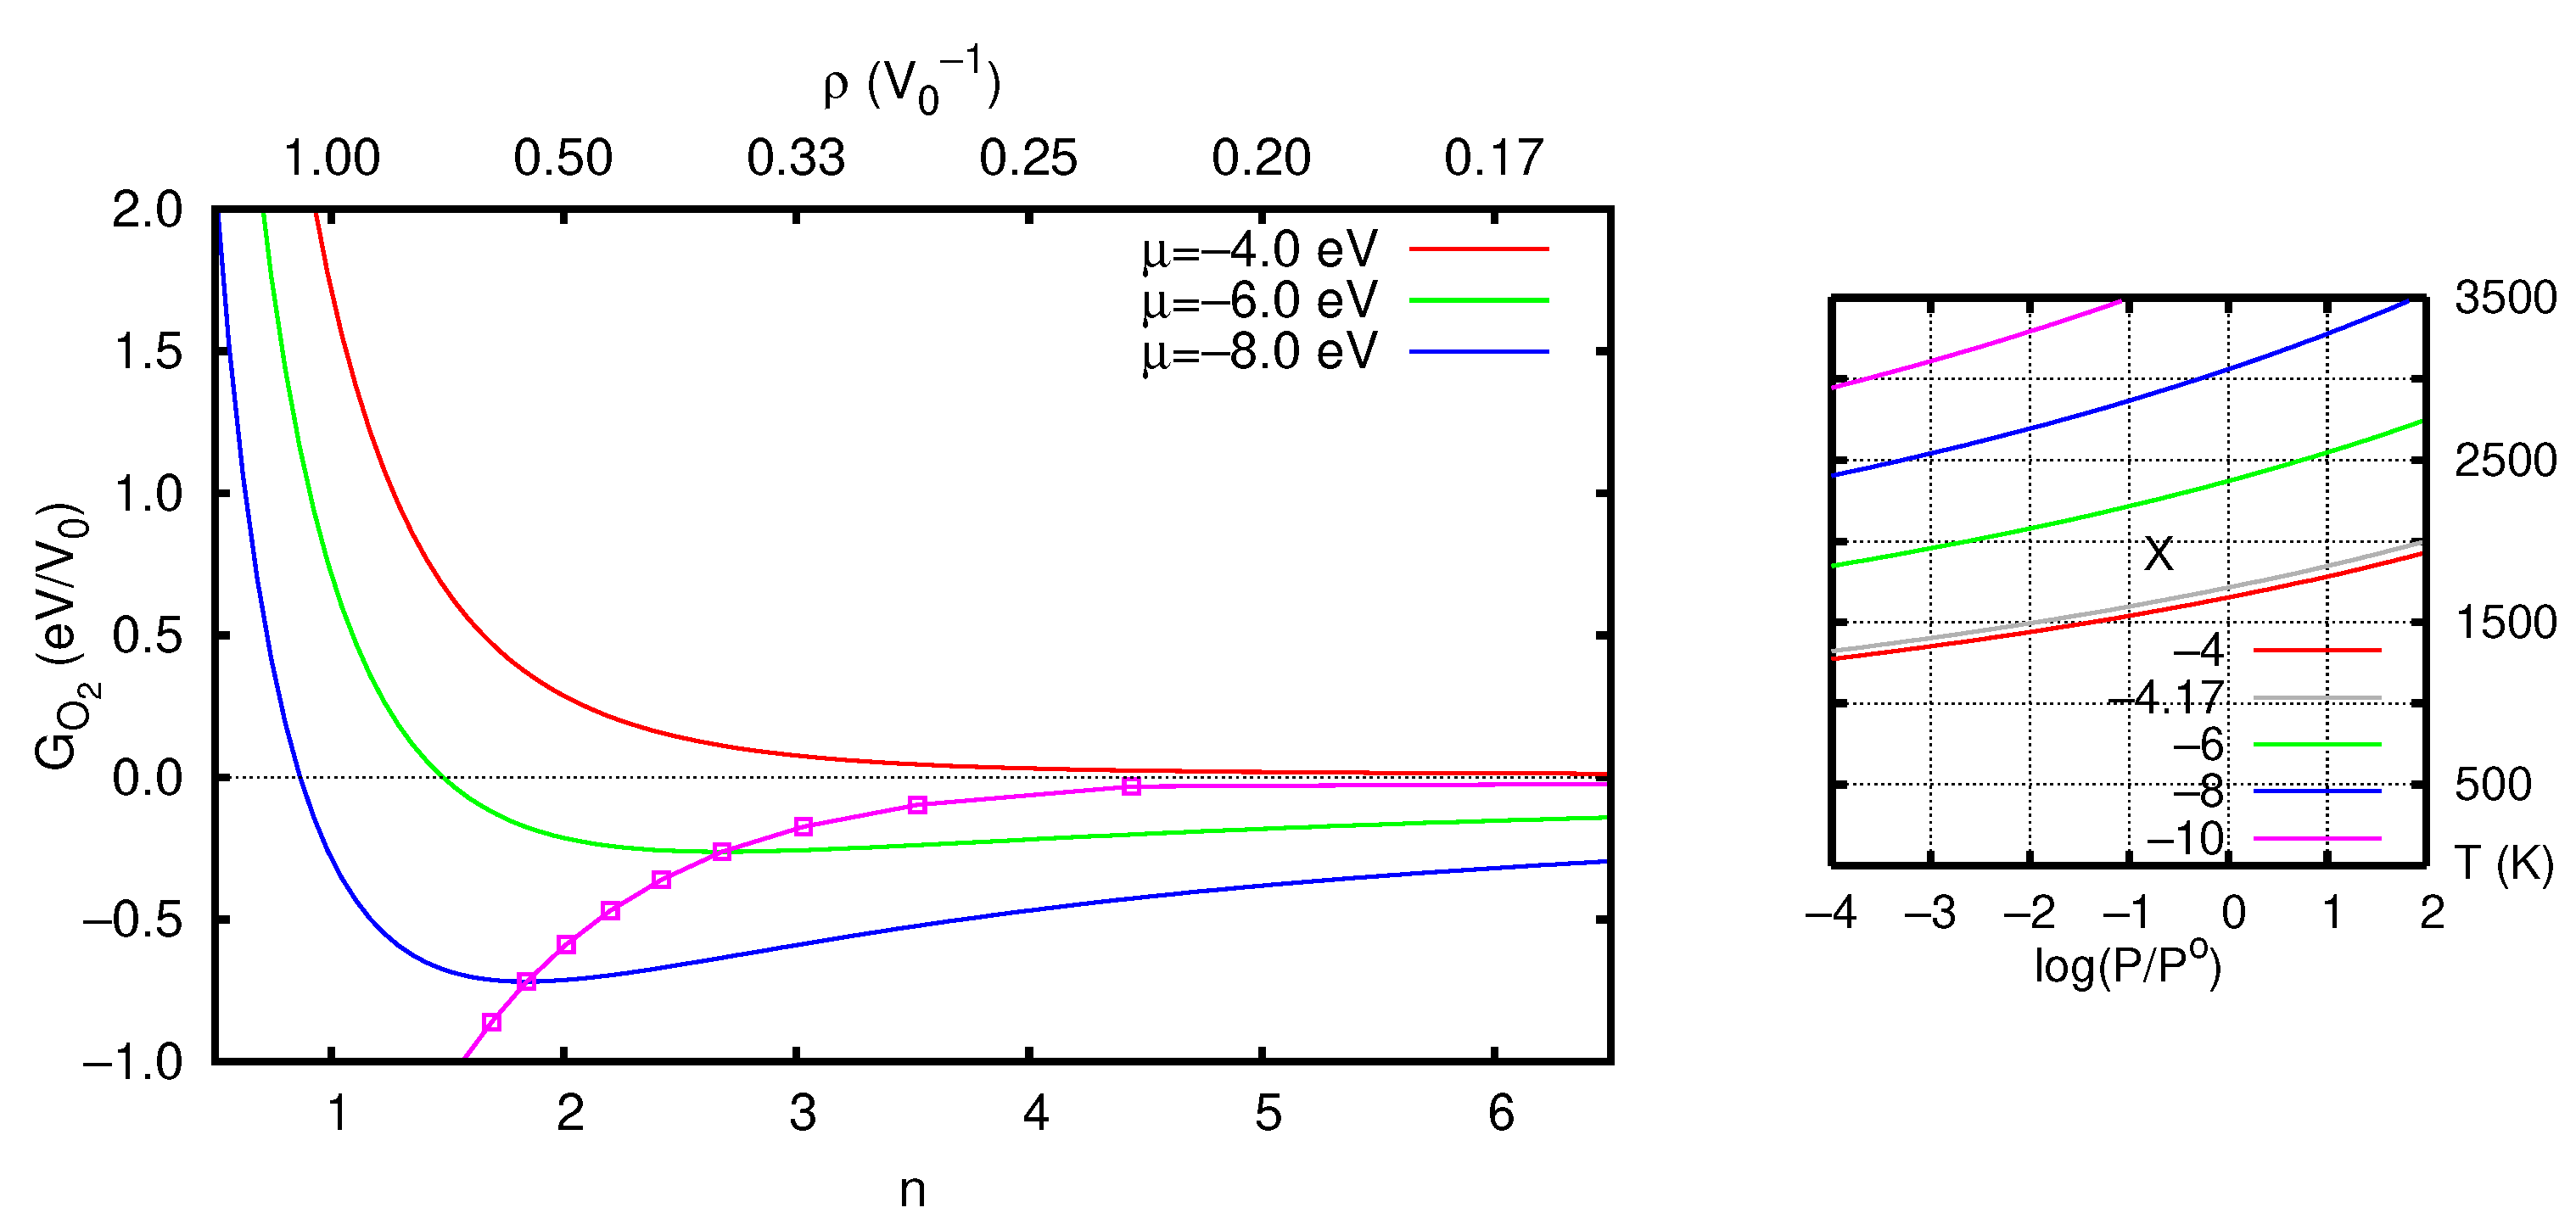
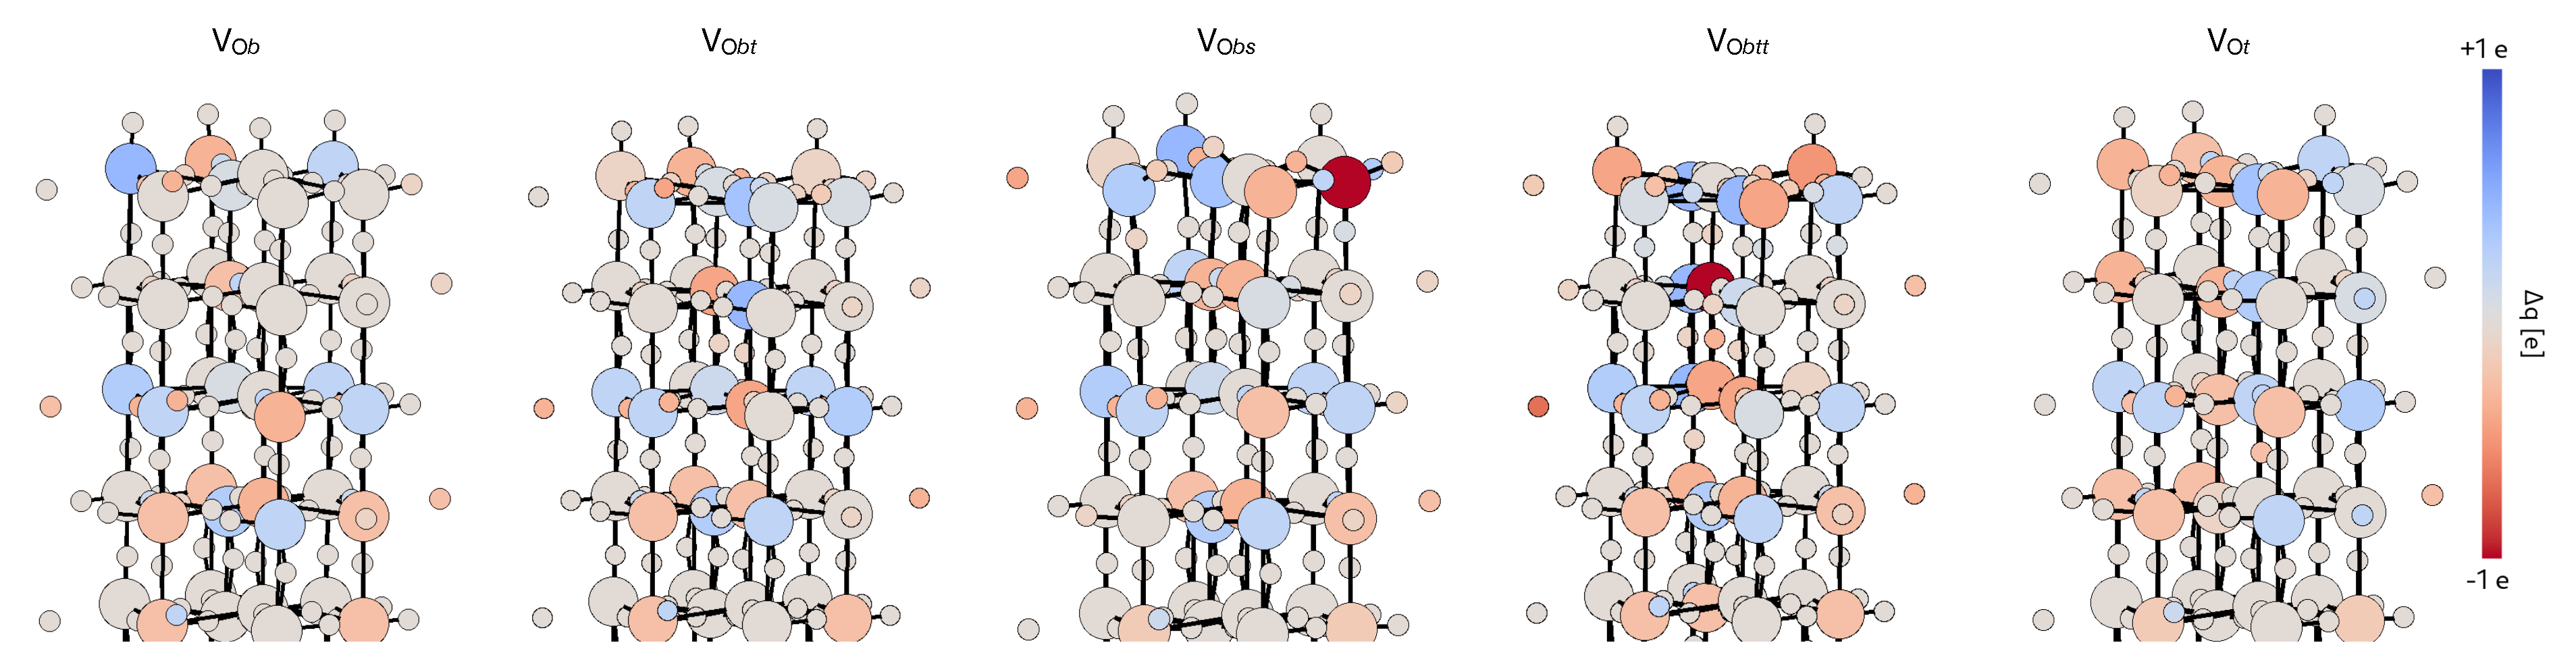
3.2.2. Stability of the O Vacancy

To study the stability of individual vacancy densities ( ρ = 1 n V 0 = 8 δ V 0 ) as a function of the experimental conditions, we can use Equation (1) and compare it with the chemical potential of the O   2 species. Following Ref. [73], we consider the Gibbs free energy G O 2 per cell volume n V 0 ( V 0 being the volume of the unit cell):
G O 2 = [ E O 2 ( n ) + 1 / 2 μ O 2 ( P , T ) ] / ( n V 0 ) ,
where the O   2 chemical potential is defined as
μ O 2 ( P , T ) = H o ( T ) H o ( 0 ) T S o ( T ) + k B T ln ( P / P o ) ,
with P o being the reference pressure of 1 bar. The use of + instead of − in front of μ O 2 is due to the exchange of products with the reactants with respect to Ref. [73]. The values of S o ( T ) and H o ( T ) H o ( 0 ) (at P o ) are taken from JANAF thermochemical tables [74].
The left panel of Figure 6 reports the Gibbs free energy G O 2 , given in Equation (2), as a function of the inverse of the vacancy density. Two different possible behaviors are found: for μ O 2 > 4.17 eV G O 2 has no local minimum, indicating that the most stable situation is the complete absence of vacancies, which, of course can be present for kinetic reasons. Differently, for μ O 2 < 4.17 eV, G O 2 presents a single minimum at the most stable vacancy density. This value is a function of μ O 2 and ultimately, of P and T. Some contour levels of μ O 2 ( P , T ) as a function of P and T are reported in the right panel of Figure 6. The cross (×) corresponds to T = 1920 K and P = 0.2 bar ( μ O 2 = 5 eV). In this case, the optimal vacancy density corresponds to one missing oxygen atom every 84 oxygen atoms ( δ = 0.035 ), which is consistent with the experimental data.
A more accurate estimate can be made considering two different regimes for the formation enthalpy. In fact, in small simulation cells (corresponding to high vacancy densities), the formation enthalpy is smaller as we consider elongated shapes instead of large ones. Of course, once the energy gain due to the relaxation becomes very small, as, for example, for cells longer than 5 unit cells, the energy gain due to the enlargement of the basis of the simulation cell becomes relevant. This happens at about n = 5.4 and from this value ahead a different fitting function could be considered (see Figure 5). The main difference between the two fitting functions is the asymptotic value, which is 0.2 eV smaller for the larger cell. This value is indeed the energy gain for the relaxation of a larger cell once the increase in its length does not give any further energy gain. The results reported above did not consider this more complex procedure. Nevertheless, they are fully valid due to the small value of n in the regime relevant to experiments. Only the formation enthalpy in the limit of extremely diluted vacancies is to be corrected from 2.08 eV to 1.88 eV.
It is worth noting that a correction to the formation enthalpy formula has been suggested [75] that amounts to Δ = 1.36 eV and accounts for the following errors in the GGA approach used here: (i) the binding energy of the O   2 molecule (overbound by about 0.8 eV) and (ii) “adding electrons to the oxygen p orbital when O   2 is formed from O   2 ”. If this term is considered, all the results reported above must be shifted by substituting μ O 2 Δ for μ O 2 . For example, the green line in the left panel of Figure 6 corresponds to μ O 2 = 7.36 eV.

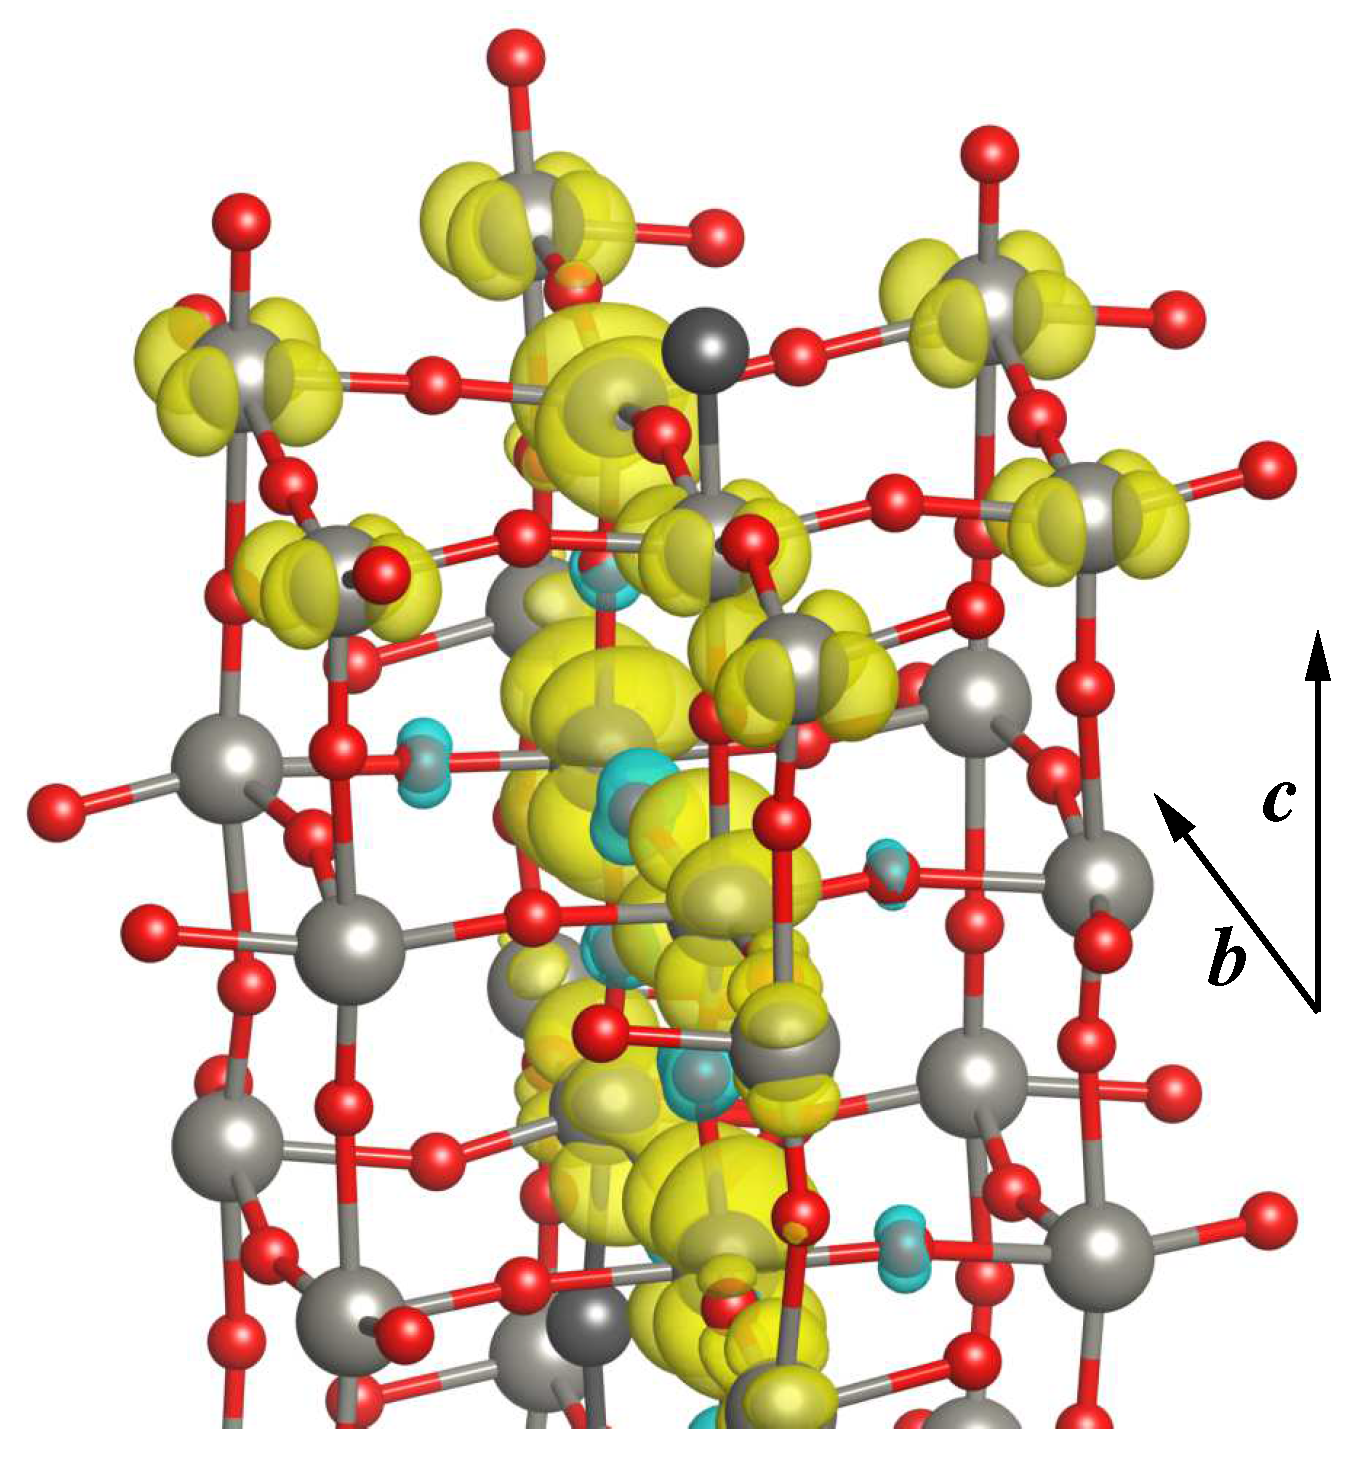
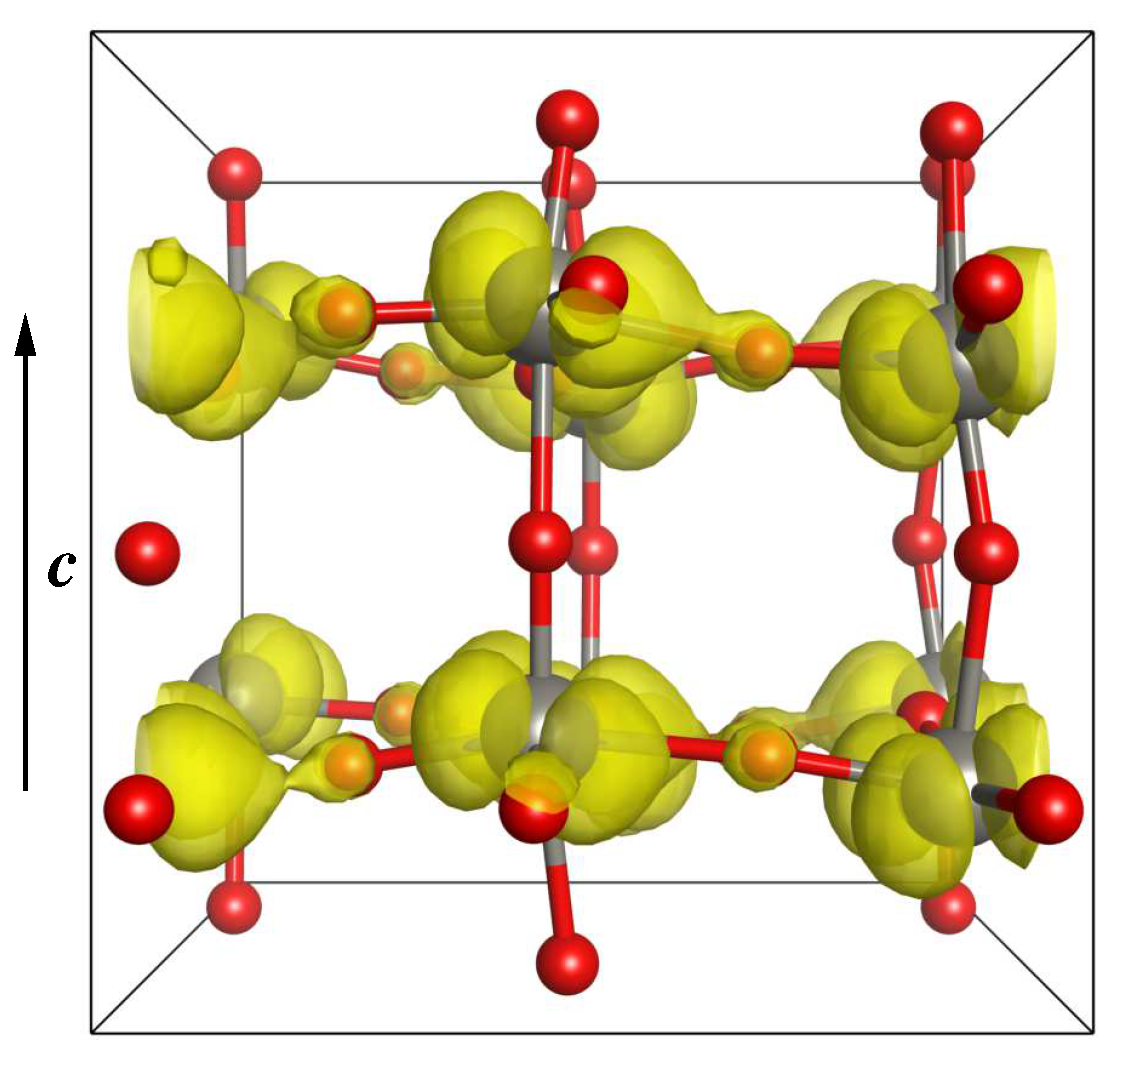
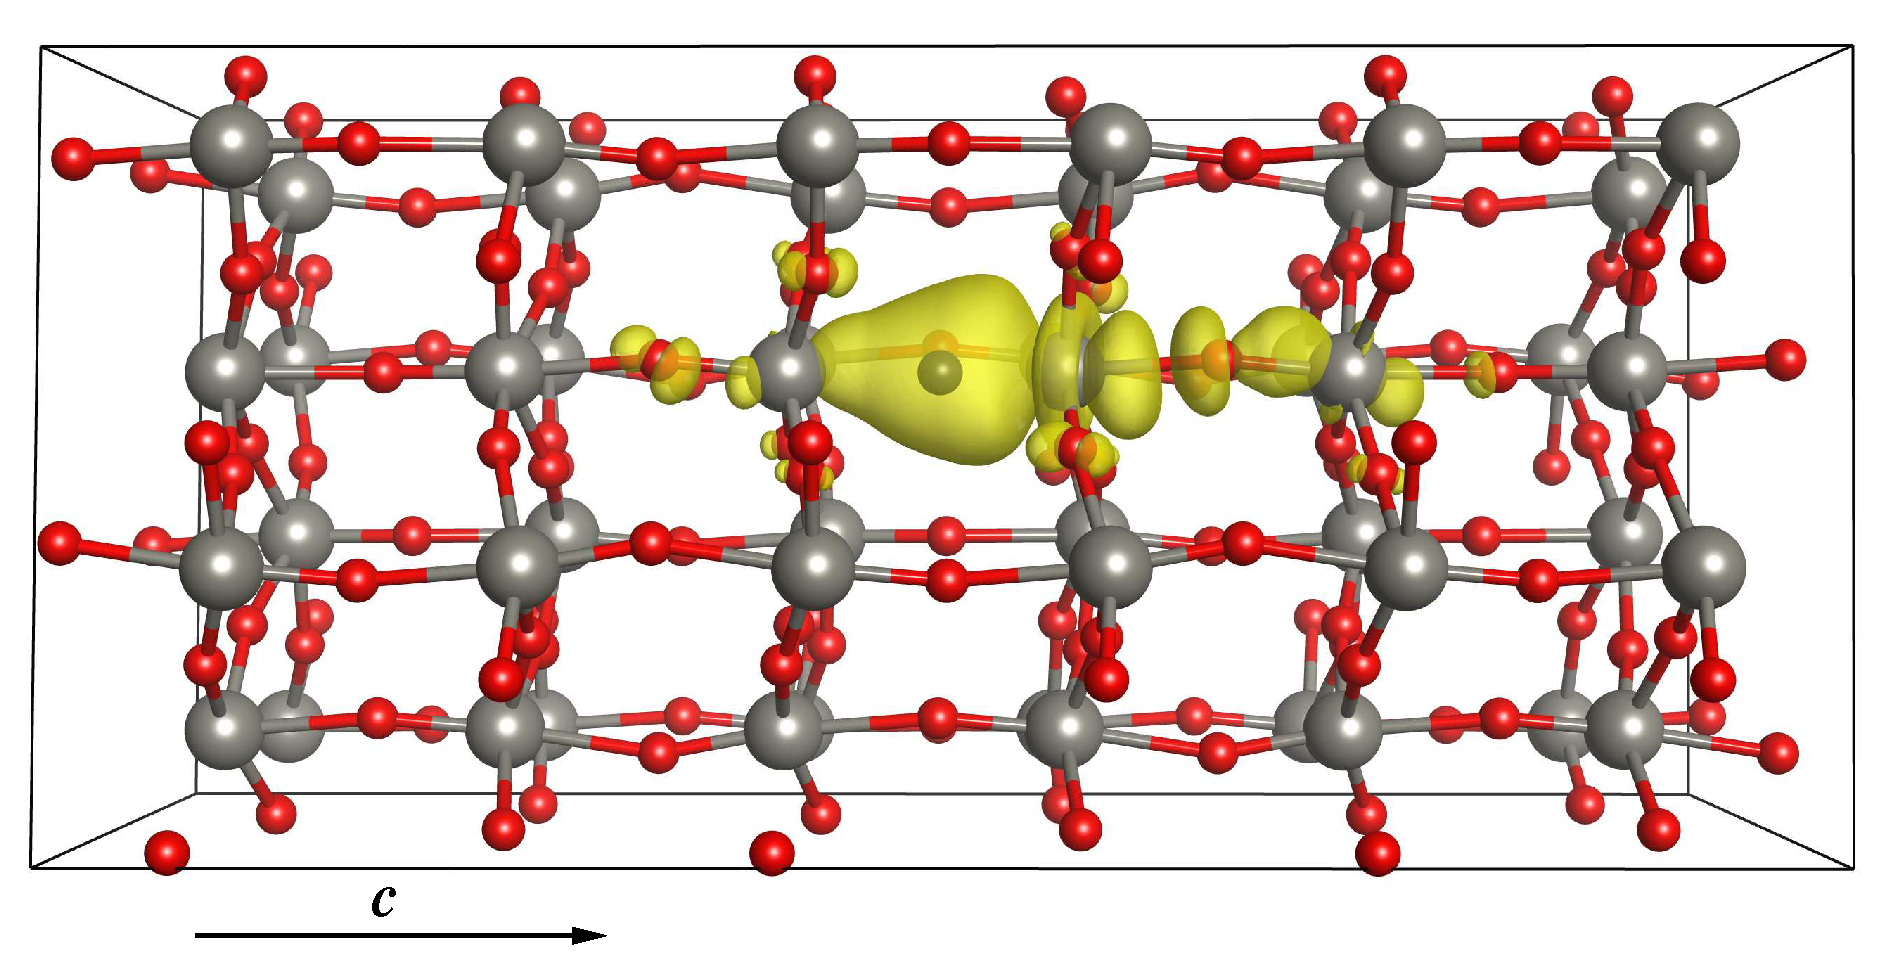
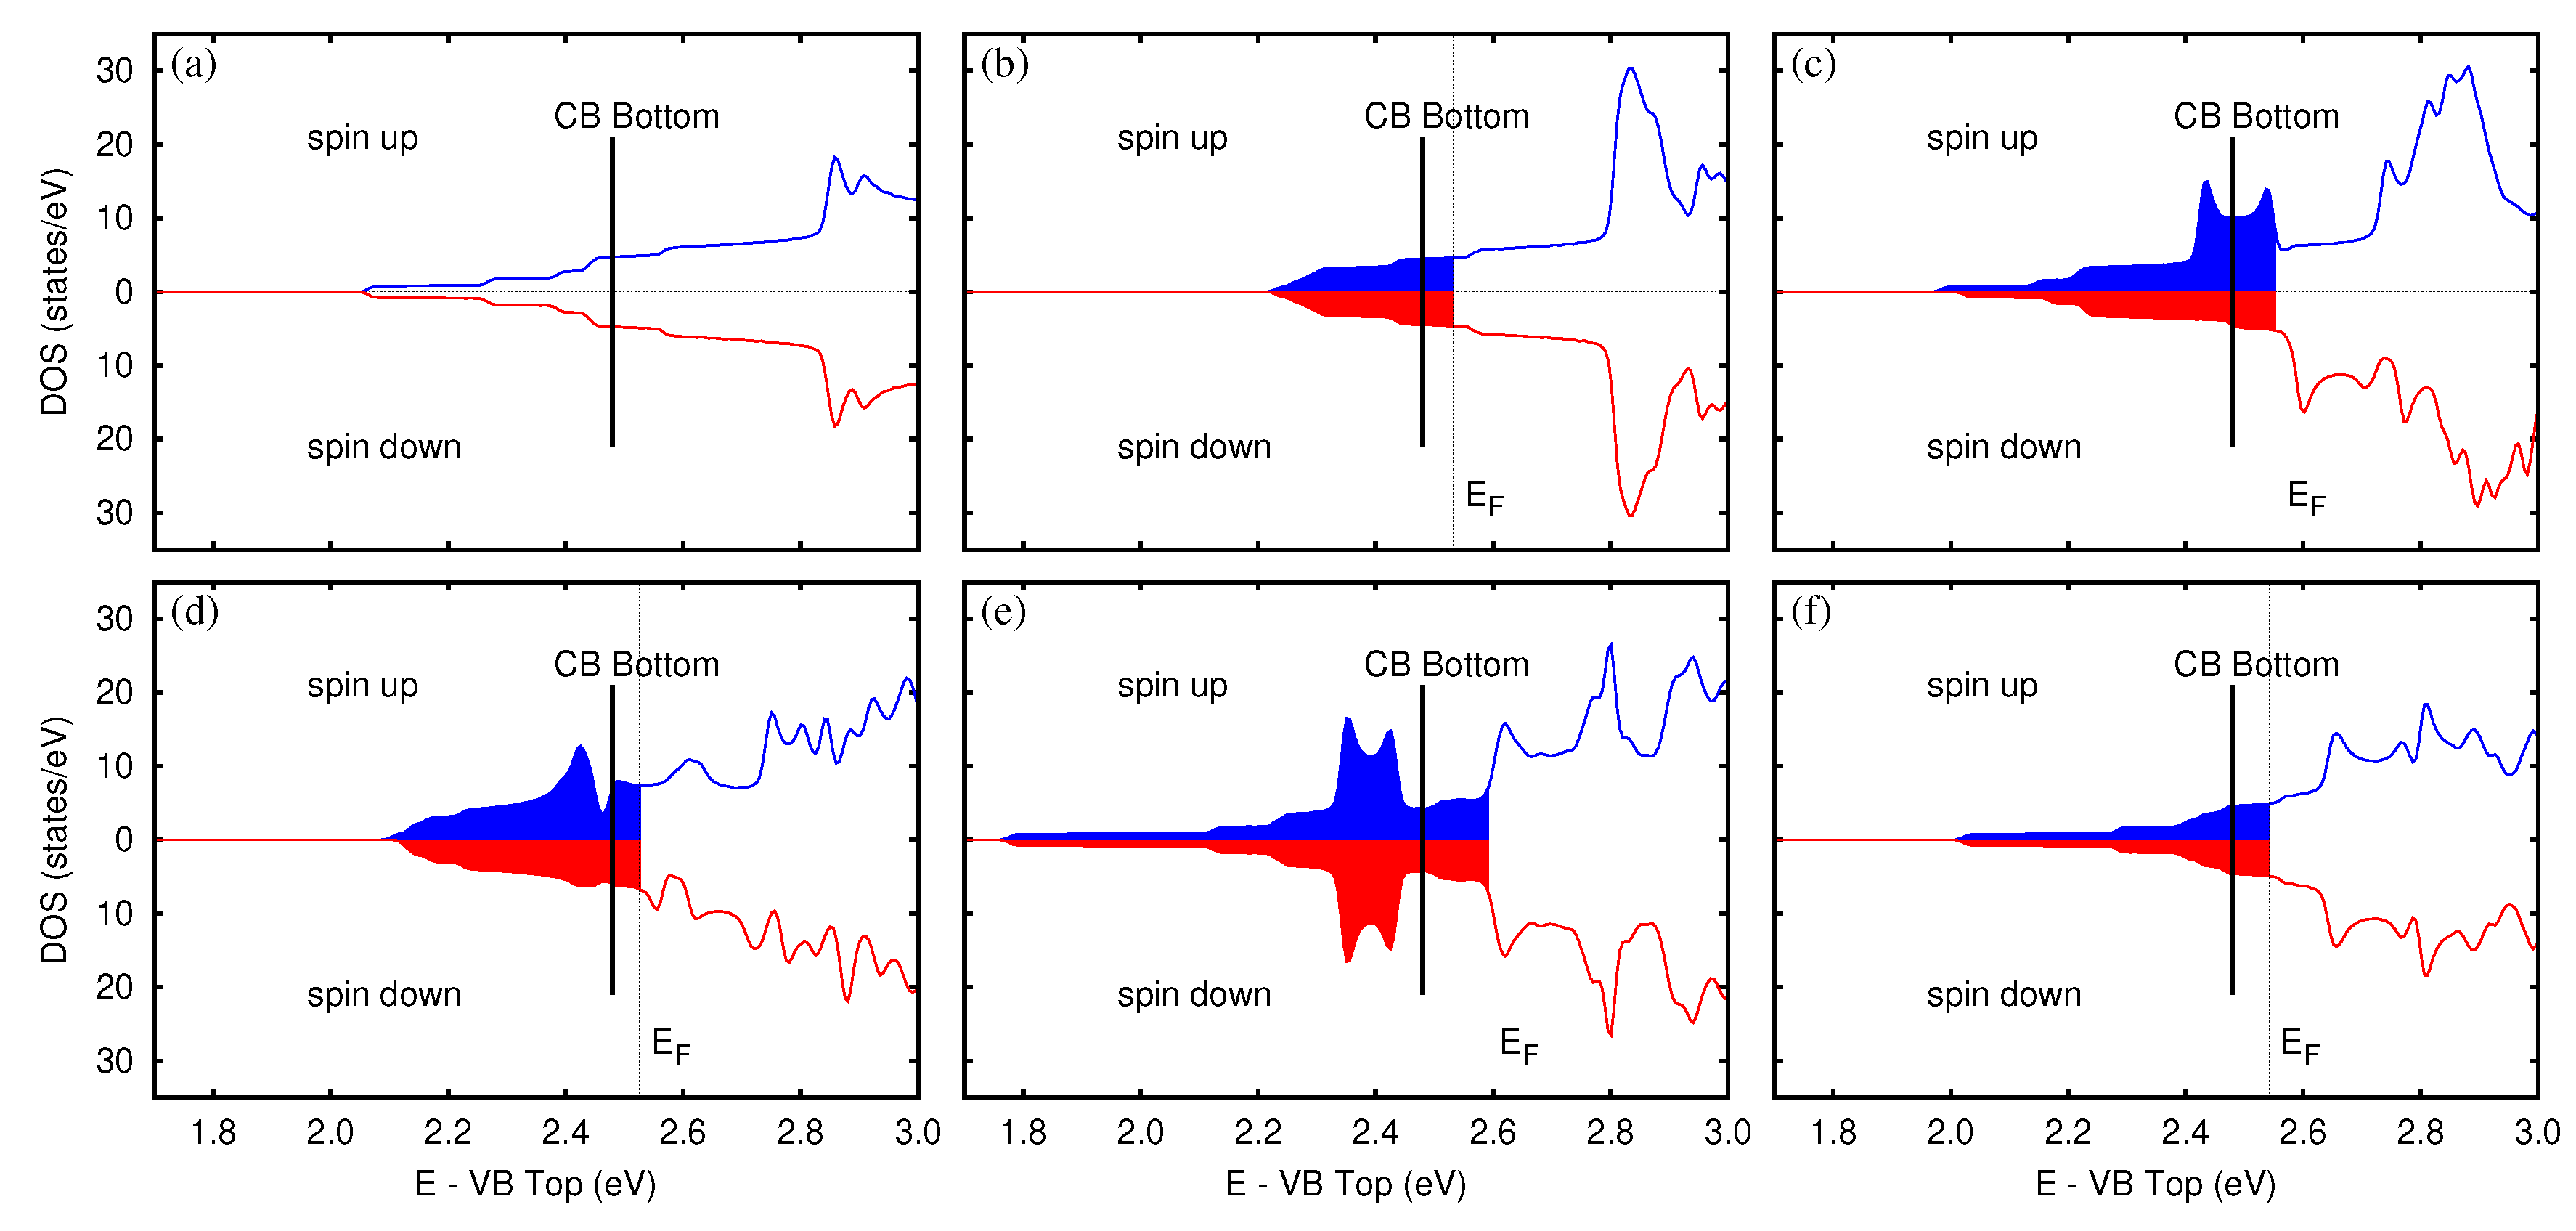
3.2.3. Electronic and Magnetic Properties

One of the aspects that arouses great interest towards this metal oxide concerns the magnetic properties of the system. Experimental evidence suggests the presence of just one unpaired electron localized in correspondence to each O vacancy [56,76]. Indeed, the XPS data [56,77,78,79,80] show that—for reasonable vacancy densities—a single additional oxidation state for the tungsten atoms appears, which is unambiguously assigned to W   5 + .
Also, the electrical characterization [56] shows beyond any doubt that each O vacancy contributes with electrons to the conduction band population. The only possible conclusion is that the O vacancy binds only one electron, releasing the other in the conduction bands.
The electronic/magnetic behavior is governed by the presence of two additional electrons delivered in the solid by the oxygen vacancy, which do not find accommodation in the VB. In principle, there are three different possibilities for these two electrons: (i) Both can populate the CB, giving no localized states and a non-magnetic ground state. In this case, the electronic states induced by the perturbed potential (vacancy states) are located well inside the conduction band. (ii) One of the two electrons is localized while the other is delocalized in the CB. This case is realized if one vacancy state lies in the energy gap (or just at the bottom of the conduction band). The system tends to be in a doublet state ( S = 1 / 2 , μ = 1 μ B ), though we are in the presence of an even number of electrons per unit cell. In extended systems, this situation is easily explained because the second electron fills both spin components of the conduction bands. (iii) Both electrons are localized. This can happen if the two vacancy states fall inside the band-gap, either spin-paired, i.e., forming a singlet ( S = 0 , μ = 0 ), or with parallel spin, i.e., forming a triplet ( S = 1 , μ = 2 μ B ).
It is evident from the literature, as well as from our previous considerations, that the crucial parameters for capturing the correct magnetic state are the value of the energy gap and the position of the vacancy states with respect to the gap edges. As an example, a very large energy gap would likely produce the third case because the vacancy states fall in the gap [68], while an extremely small energy gap would push both electrons into the CB, i.e., falling into the first case [47]. No doubt, the mutual position of the conduction band minimum and the energy of the vacancy states is likely to determine the magnetic and electronic behavior of the system. At the same time, the above scheme is clearly oversimplified, as the vacancy states tend to be sharp only in the limit of small vacancy density; otherwise, they would form an electronic band. In the latter case, a non-integer value of S ( 0 < μ < 2 μ B ) would be found [28]. The case of WO   3 is very intriguing because the two energy levels discussed above are very similar and the picture depicted in case (ii) cannot be ruled out.

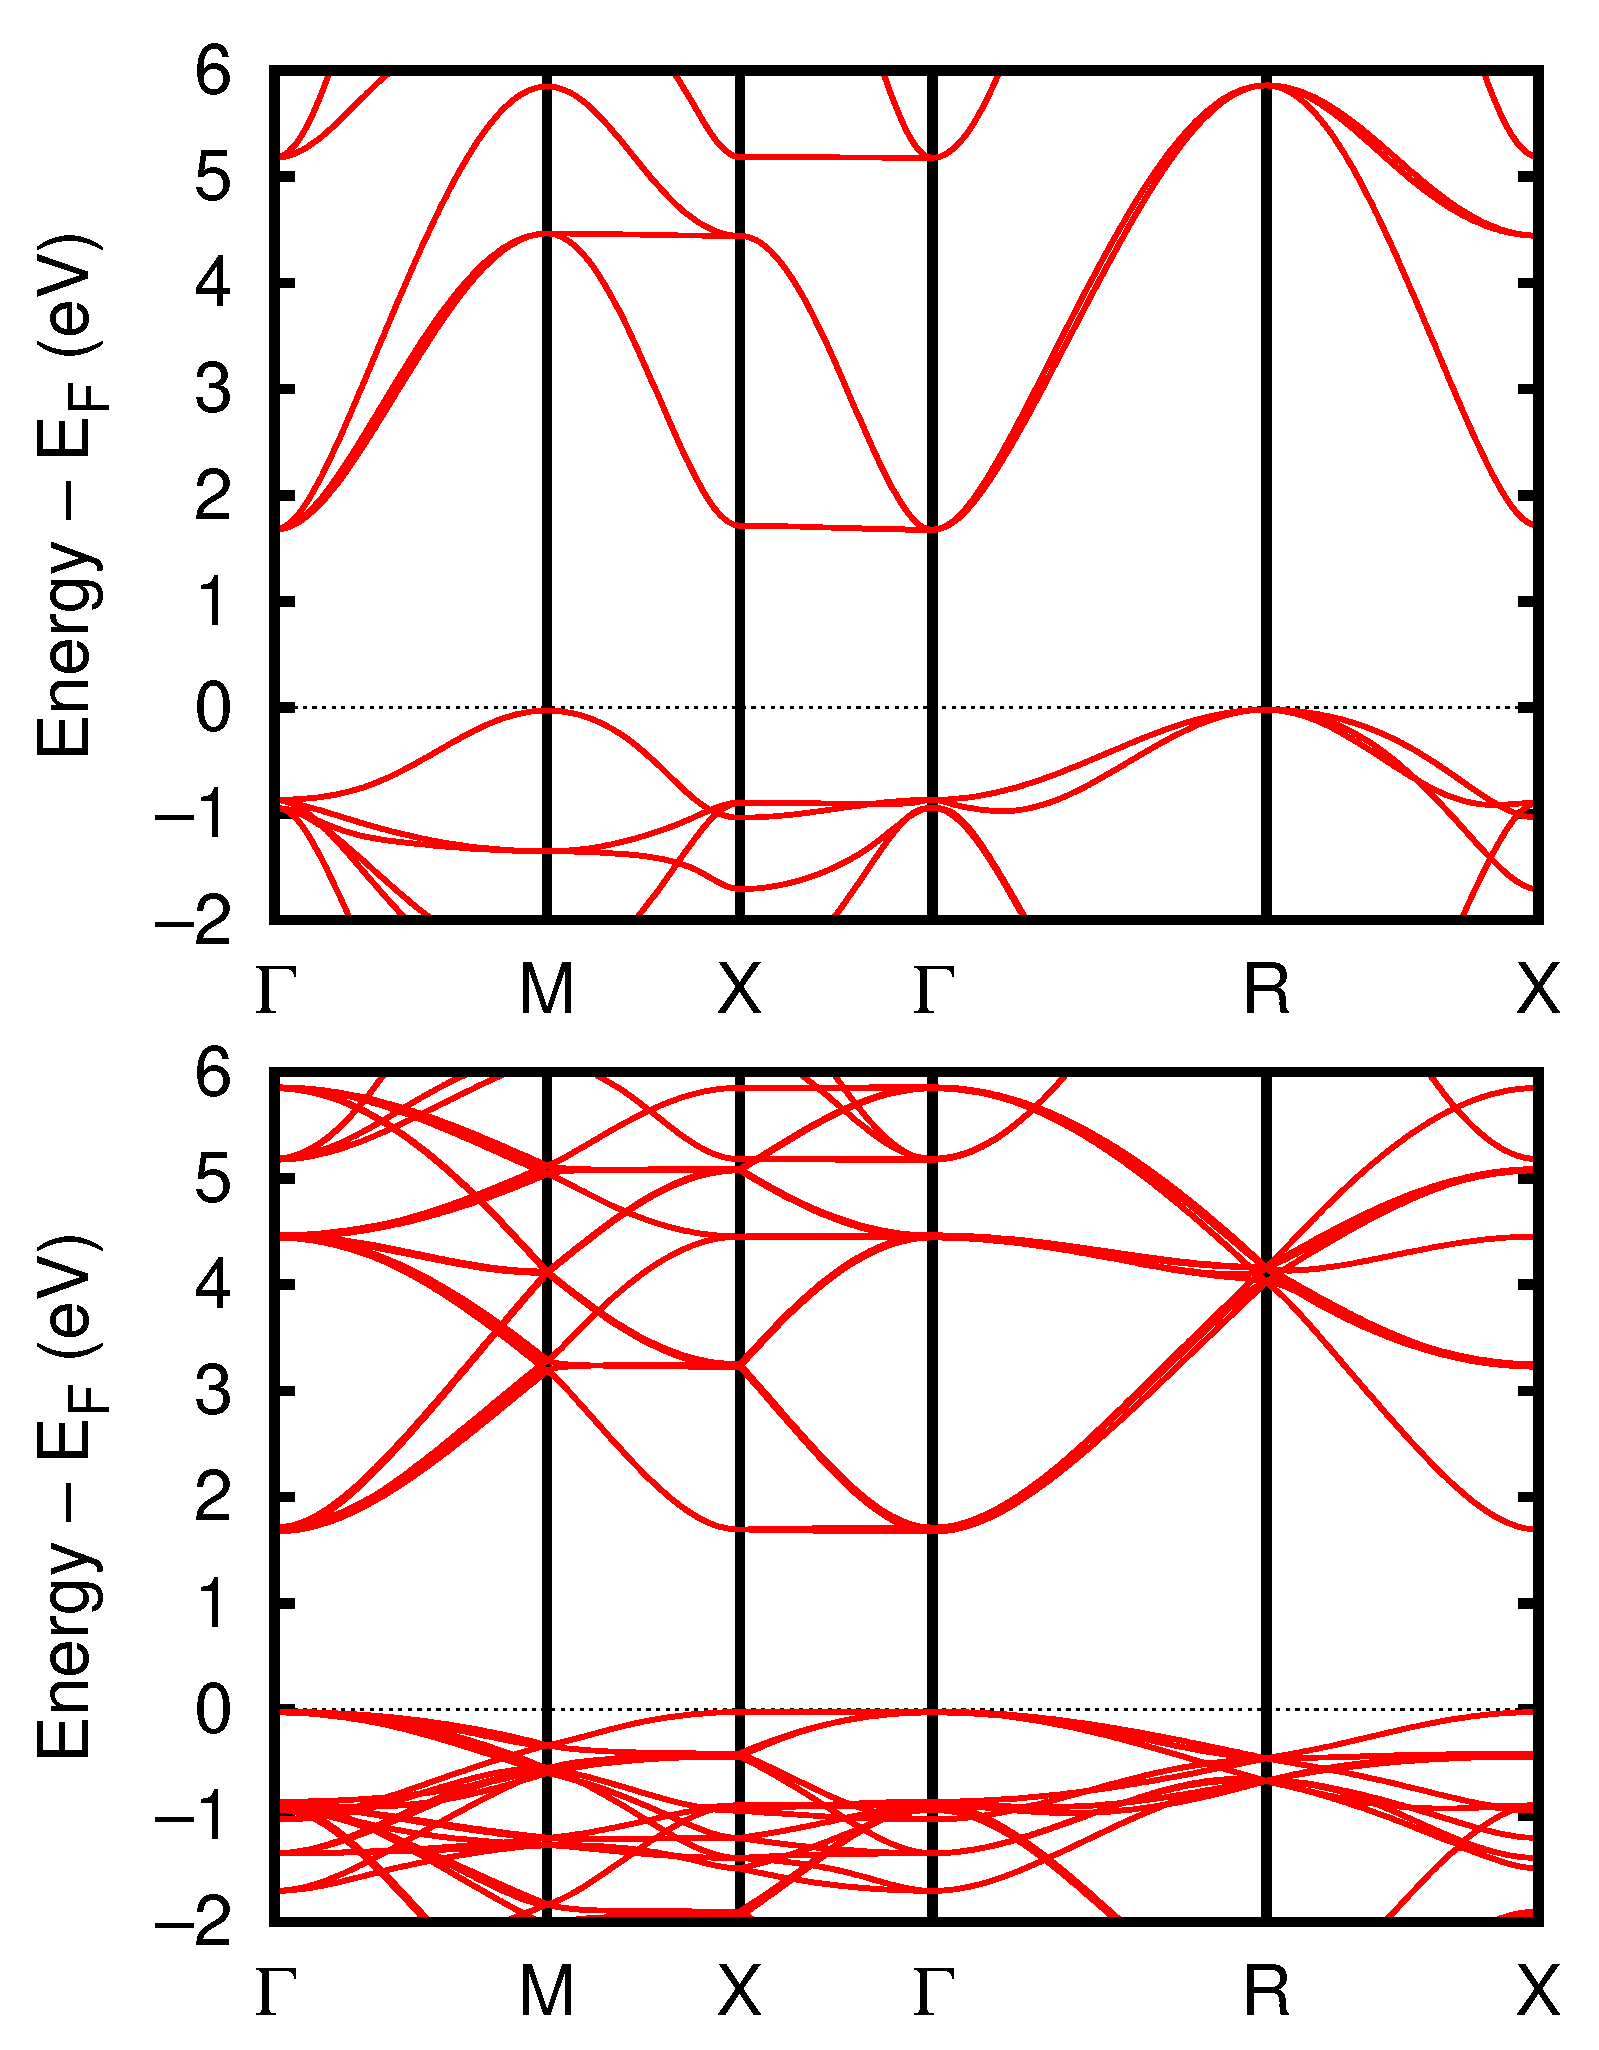
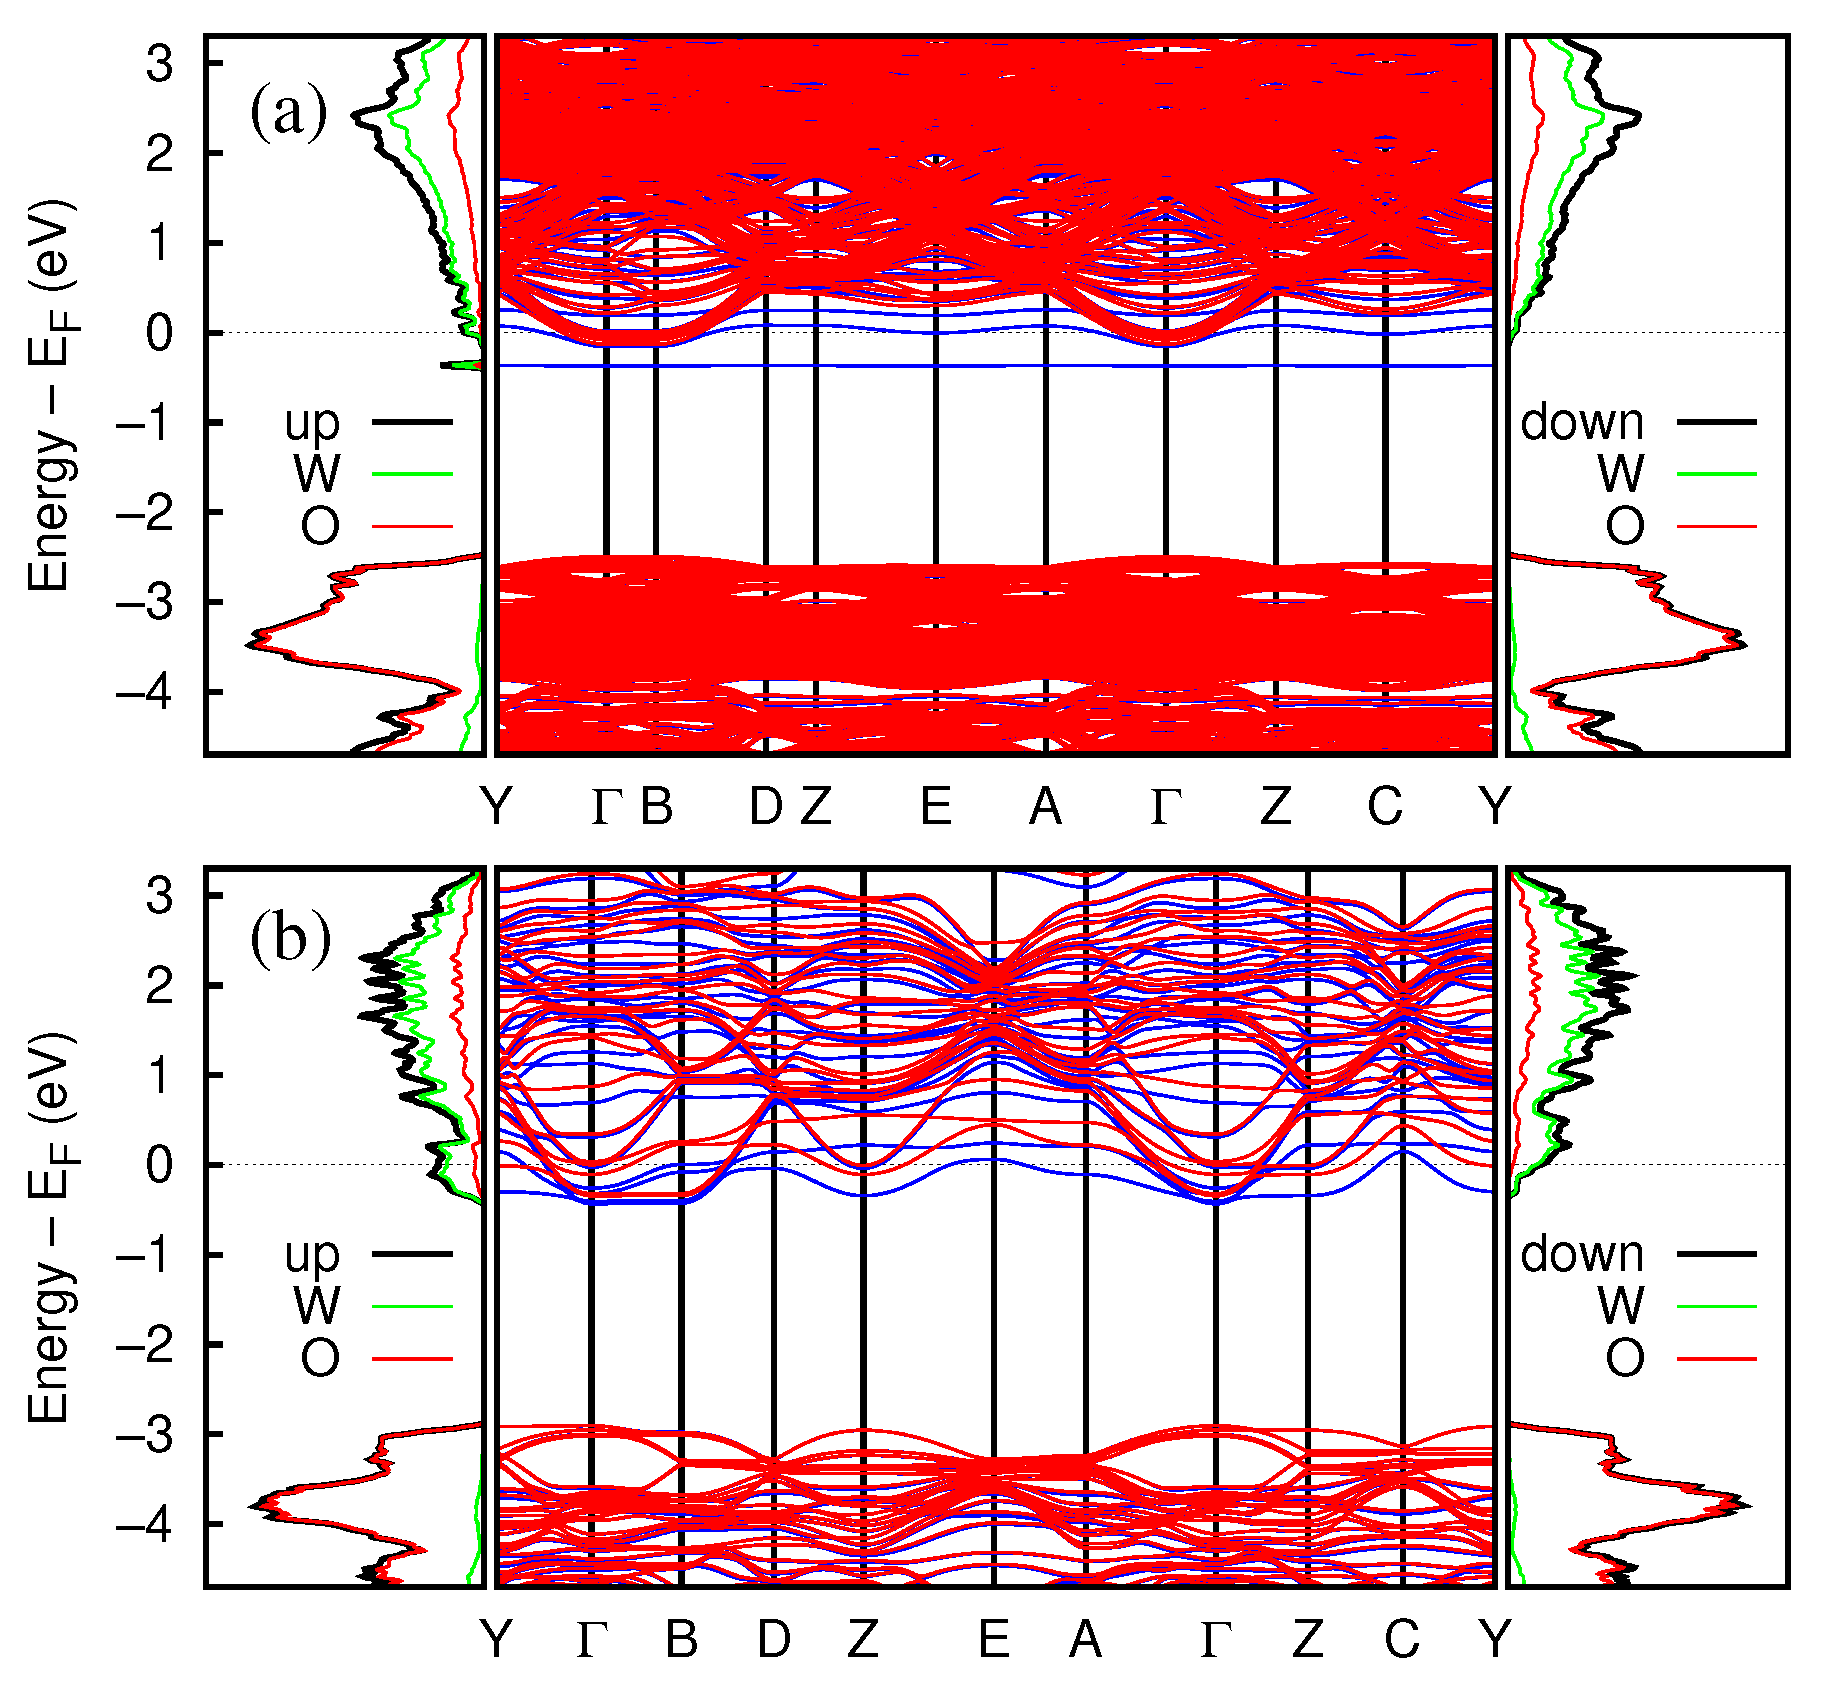
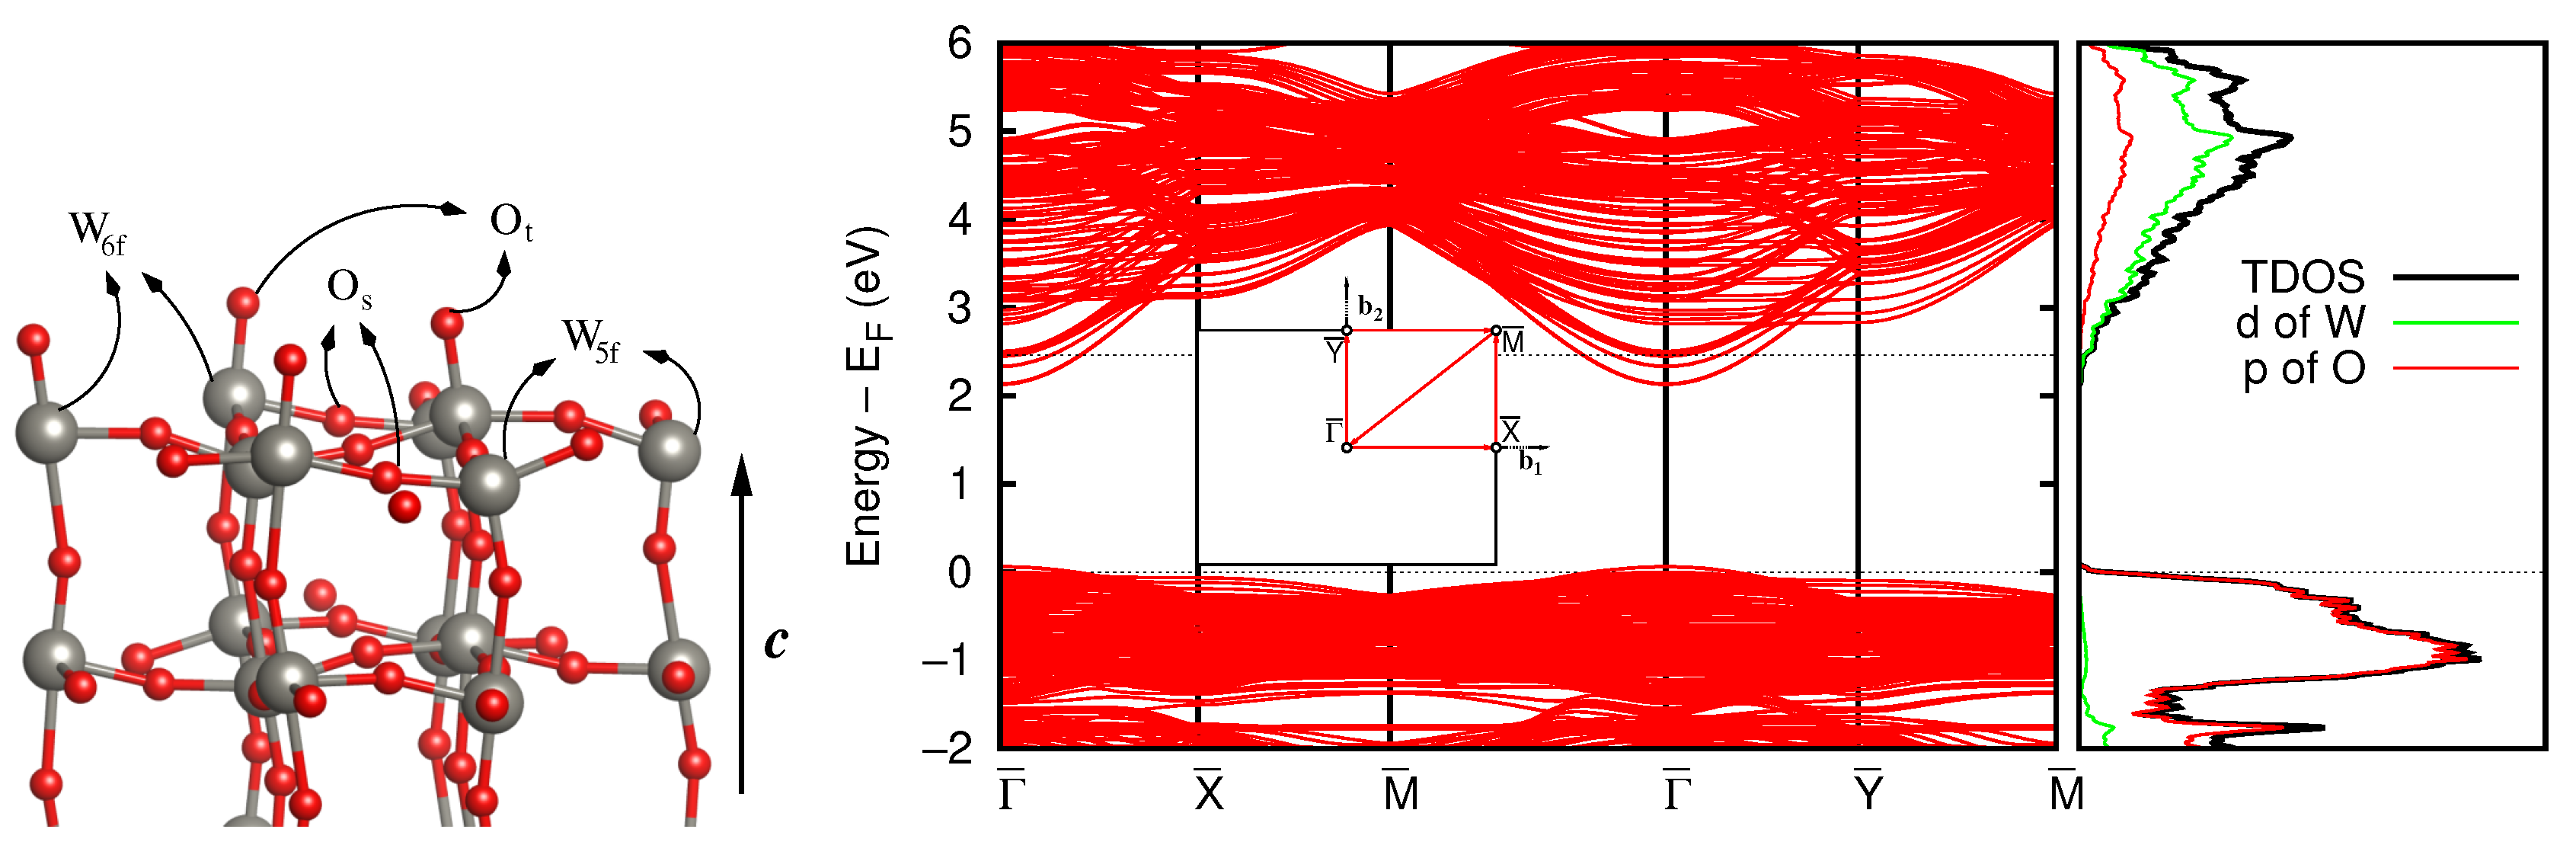
3.2.4. Band Structure

In the following, we present the electronic band structure computed for bulk WO   3 with some representative vacancy densities. As a first example, we report in Figure 7a the band structure and the DOS of the largest cell considered, i.e., the c(2 × 2) × 3, obtained by removing only one oxygen along the c direction and without any relaxation.
This represents the typical situation in which one electronic state falls within the band-gap and the other is spread in the CB. The magnetic moment amounts to 1.435 μ B and not to 1 μ B because of the spin asymmetry of the lowest conduction states. A similar result is reported in Ref. [28] for some locations of the oxygen vacancy. The spatial distribution of the localized state (i.e., the electron density) is reported in Figure 8, showing the partial localization of the electronic density, which spans quite a large region around the vacancy and along the O–W chain. The oxidation numbers of neighboring W atoms are + 5 and + 6 . The second electron released in the lattice by oxygen vacancy formation occupies mainly the lowest flat band in CB and, as previously discussed, it is distributed in a plane orthogonal to the c direction, passing through the W   6 + cation first neighbor of V   O . These findings are in nice agreement with the results reported in Ref. [68].
When relaxation is introduced, the scenario changes completely: the doublet state disappears in favor of a non-magnetic solution where both electrons belong to the CB. This behavior is confirmed for all the cells/densities considered but the smallest one ( n = 1 ). At this high vacancy density, the magnetic behavior is preserved and the magnetic moment is 1.076 μ B ( S = 1 / 2 ). Figure 7b reports the band structure and the DOS of the 32-atom unit cell with one oxygen vacancy along the c direction. Although the GGA-1/2 method is fully reliable for energy gap predictions, it still suffers from the tendency of pure GGA exchange-correlation functionals to underestimate electron localization, which might affect the results reported here. The inclusion of a self-interaction correction, as well as some Fock contribution to the exchange energy, might also generate one localized state for larger value of n, thus increasing the range of vacancy densities where spin doublet states exist. From the experimental point of view, UPS data show the presence of a peak at ∼0.5 eV below the conduction band minimum [26], while XPS data locate the peak at a slightly higher energy [80]. Also this evidence support the possibility that magnetic solutions for vacancy states are persistent over a significant range of defect densities.

3.3. Stoichiometric WO   3 (001) Surface

While the bulk properties are the fundamental starting point for studying WO   3 , the surface of this material plays a major role in many practical purposes, for example, the sensing capability versus volatile organic compounds (VOC) [21]. For this reason, we have studied at first the stoichiometric surface and, secondly, the effect of subsurface oxygen vacancies as well as on the outermost layer.
The most stable surface of γ -WO   3 , according to the literature [81,82,83], is the (001) c ( 2 × 2) reconstructed surface (often improperly referred to as ( 2 × 2 ) R 45   ). In this frame, the c axis is almost normal to the surface. The clean stoichiometric surface has been modeled by a slab whose width corresponds to six unit cells (6 × 32 atoms). We relaxed the four outermost WO   6 octahedron layers in both surfaces in a symmetric way. The surface reconstruction was obtained by removing half of the exposed oxygen atoms in a chessboard fashion. Since these atoms are connected to the W atoms below by alternating long and short W–O bonds, we removed the long-bonded O atoms, i.e, those with the weaker bonding interaction with the underlying W atoms. Indeed, this choice generates no artificial mid-gap states in the surface electronic structure.
The relaxation of the surface atoms does not show relevant features, the most important being the increase by 8% in the bond length between the sixfold coordinated surface W   6 f and the underlying O. The O–W bond length involving the surface O   t decreases by just 4%, while all the other bond lengths change by less than 2%. The surface energy is equal to 0.32 J/m   2 , in almost perfect agreement with the values reported by Wang et al. [82] and Lambert-Mauriat et al. [84]. The estimate of the work function is 5.2 eV (computed from the conduction band minimum), to be compared with experimental values in the range 4.7–6.4 eV [85]. The analysis of the oxidation state (OS) of the surface atoms is relevant for the comprehension of catalytic properties of this surface. Indeed, we are in the presence of undercoordinated oxygen (O   t ) and undercoordinated tungsten (W   5 f ) (see left panel of Figure 9). Interestingly, the QTAIM charges indicate that the W   6 f surface atoms assume + 5 as oxidation state. This means that an electron migrates from W   5 f to the W   6 f , thus exposing towards the vacuum an electronically saturated surface without particularly active sites, with the W   6 f being sterically hindered.
In the right panel of Figure 9, we report the surface band structure and the corresponding DOS of the clean WO   3 surface. It is worth noting the appearance of a couple of parabolic dispersing states just below the bottom of the bulk conduction band (evidenced by the higher horizontal dotted line). These states, which can be considered surface states, come from the lowering of the unoccupied flat band of the bulk in the surface region (the first two W layers). Remarkably, excess electrons released in the system would occupy these states first. The surface band-gap is reduced with respect to the bulk one and amounts to 2.30 eV.

3.4. Defective Surface: WO   3 δ (001)

We now consider the presence of oxygen vacancies in the WO   3 surface. To avoid vacancy–vacancy interaction between periodically repeated cells, we adopted a 192-atom cell (identical to the largest unit cell considered for the bulk case), with facing free surfaces separated by 18 Å of vacuum. We relaxed the four topmost WO   6 octahedron layers, keeping fixed the two at the bottom, except for the terminating O atoms. Concerning the bottom of the slab, we compared two different approaches: in the first case, we saturated the terminal oxygen atoms with hydrogen. Since this choice gives rise to undesired mid-gap states, we opted for a symmetrically terminated slab where, at the bottom, we removed oxygen atoms on the other rows with respect to the top layer. We verified that the surface energy obtained this way is exactly the same as for the model adopted for the stoichiometric surface. This means that both the saturation of the bottom surface and the slab width properly mimic a free surface.
We first inserted an oxygen vacancy in the fourth layer from the top, i.e, deep below the surface (V   O b ), in order to simulate the stoichiometric termination of a defective bulk. We then introduced oxygen vacancies at the surface by (i) removing the O   t atom (V   O b t ), (ii) removing the O   s atom (V   O b s ), (iii) removing two O   t in a chessboard array (V   O b t t ), and, finally, we also considered (iv) a surface vacancy alone (V   O t ), i.e., without any bulk defect.
Table 4 reports the formation enthalpy of vacancies obtained according to Equation (1), where E bulk must be substituted with the total energy of the stoichiometric clean surface. The formation enthalpies for the surface vacancies are very similar to those in the bulk, with the exception of V   O t , which is significantly smaller (i.e., more stable). A previously published value for this defect amounts to 2.98 eV [86].
The analysis of the spectral properties of these systems is very intriguing. Indeed, the presence of one surface oxygen vacancy together with the bulk one gives rise to a magnetic behavior. The DOSs calculated near the bottom of the conduction band, for pristine and defective systems, are reported in Figure 10. As expected, the CB of the defective surfaces becomes populated by the electrons released in the lattice upon oxygen removal. Figure 10b reports the case of a single bulk vacancy and shows that both electrons are delocalized, as happens in the case of low density of vacancies in the bulk. Once a further oxygen O   t is removed (V   O b t ), the picture changes significantly. The system presents a magnetic moment equal to 1.04 μ B , which is due to weakly spin polarized surface states and to a single unpaired electron, as can be seen in Figure 10c.
The QTAIM [40] analysis, pictorially reported in Figure 11, evidenced the presence of a W   5 + cation that is located in the second W layer and along the O–W chain containing the bulk vacancy. Indeed, this configuration of vacancies gives rise to a state that is distributed on the O–W plane lying in the y z direction and contains both oxygen vacancies. Figure 12 reports the spin density for the V   O b t case.
When the O   s is removed (V   O b t , in Figure 10d), only a small residual magnetization is present, but a surface W   5 f acquires electronic charge, becoming W   4 + . Figure 10e reports the case where two additional oxygen vacancies at the surface–vacuum interface are considered. The total magnetic moment vanishes and two coupled electronic states—localized and occupied—can be observed. They are mainly located on the two W surface atoms, which are still esa-coordinated. The QTAIM [40] charges indicate that these two atoms are in OS = + 5 . We also observe the presence of one W   4 + in the second W layer and along the O–W chain containing the bulk vacancy.
In all the systems considered, the localized state is spatially located in a plane containing the c axis and the bulk vacancy, while the delocalized electron is mainly distributed on the surface plane, thus increasing the surface electrical conductivity. Our simulations agree with the main experimental evidence observed upon oxygen vacancy formation: (i) the increase in the conducting population; (ii) the appearance of an active EPR signal, and (iii) the presence of a localized/sharp electronic state just below the conduction band (as revealed by spectroscopic studies) [26,80]. Eventually, Figure 10f reports the DOS obtained when only a single surface vacancy per cell is considered. In this case, any magnetic feature is lost and no localized electrons are found.

4. Conclusions

We presented a thorough and detailed study of the structural, electronic, and magnetic properties of the bulk and the most stable surface of the d 0 metal oxide WO   3 . This material has many different applications thanks to its tunable properties, which are related to its complex phase diagram and to the unavoidable presence of oxygen vacancies. We have shown that these defects are able to modify significantly the electronic and magnetic behavior of this material. Firstly, we considered the non-defective γ -monoclinic bulk phase. By means of the GGA-1/2 approach, we obtained electronic properties that nicely match the experimental data, especially concerning the width of the energy gap.
Considering the presence of vacancies, we worked out the formation energy as a function of vacancy density, also accounting for the role of environmental conditions (P, T) in determining the actual vacancy density. Furthermore, we gave indications about the electronic ground state of the bulk and of the most stable surface of pure and defective tungsten oxide.
A high vacancy density in the bulk material induces a magnetic solution, suggesting that each vacancy contributes one electron to the conduction band, while the other electron is localized in the proximity of the vacancy site, creating a W   5 + species. It is not unlikely that this finding would also be confirmed for more diluted systems if an exchange-correlation functional capable of a better description of the self-interaction correction were adopted.
Moving from the bulk to the surface, the scenario becomes more variegated: the reconstruction of the surface generates W   5 + cations. Furthermore, a topmost oxygen vacancy gives rise to a doublet state ( S = 1 / 2 ) only in the presence of a sub-stoichiometric bulk (V   O b t ). Our results clearly demonstrate that the process of oxygen vacancy formation cannot be simply described by the release of just one localized electron per vacancy, while a second one populates the conduction bands. The relative arrangement of vacancies is undoubtedly capable of significantly changing the charge and the spin distribution, and the excess electrons might reduce bulk W atoms instead of surface ones.
Overall, the main results of our investigation are in very good agreement with several experimental studies of this metal oxide obtained with a variety of techniques. We are, therefore, confident that our study has highlighted the importance of including oxygen vacancies in any theoretical model that aims to reproduce properly the properties of this important material. Furthermore, our findings can provide useful guidelines for modeling other transition metal oxides with similar applications and oxygen–metal connectivity such as TiO   2 , SnO   2 , and ReO   3 , where the presence of oxygen vacancies has also been reported experimentally.

Author Contributions

Conceptualization, M.I.T., F.C. and R.S.; methodology, M.I.T.; software, M.I.T. and S.A.; validation, M.I.T., F.C. and R.S.; investigation, F.C.; data curation, M.I.T. and S.A.; writing—original draft preparation, M.I.T.; writing—review and editing, M.I.T., F.C., S.A. and R.S.; visualization, S.A. and R.S. All authors have read and agreed to the published version of the manuscript.

Funding

This research received no external funding.

Data Availability Statement

Data are contained within the article.

Acknowledgments

The authors gratefully acknowledge the CINECA award under the ISCRA initiative for the availability of high-performance computing resources and support.

Conflicts of Interest

The authors declare no conflicts of interest.

References

  1. Salje, E.K.H.; Rehmann, S.; Pobell, F.; Morris, D.; Knight, K.S.; Herrmannsdörfer, T.; Dove, M.T. Crystal structure and paramagnetic behaviour of ε-WO3−x. J. Phys. Condens. Matter 1997, 9, 6563–6577. [Google Scholar] [CrossRef]
  2. Matthias, B.T.; Wood, E.A. Low Temperature Polymorphic Transformation in WO3. Phys. Rev. 1951, 84, 1255. [Google Scholar] [CrossRef]
  3. Woodward, P.M.; Sleight, A.W.; Vogt, T. Structure refinement of triclinic tungsten trioxide. J. Phys. Chem. Solids 1995, 56, 1305–1315. [Google Scholar] [CrossRef]
  4. Tanisaki, S. On the Phase Transition of Tungsten Trioxide below Room Temperature. J. Phys. Soc. Jpn. 1960, 15, 566–573. [Google Scholar] [CrossRef]
  5. Diehl, R.; Brandt, G.; Salje, E. The Crystal Structure of Triclinc WO3. Acta Crystallogr. B 1978, 34, 1105–1111. [Google Scholar] [CrossRef]
  6. Loopstra, B.O.; Rietveld, H.M. Further refinement of the structure of WO3. Acta Crystallogr. B 1969, 25, 1420–1421. [Google Scholar] [CrossRef]
  7. Loopstra, B.O.; Boldrini, P. Neutron diffraction investigation of WO3. Acta Cryst. 1966, 21, 158–162. [Google Scholar] [CrossRef]
  8. Salje, E. The orthorhombic phase of WO3. Acta Crystallogr. B 1977, 33, 574–577. [Google Scholar] [CrossRef]
  9. Tomaszewski, P.E. Structural phase transitions in crystals. I. Database. Phase Transit. 1992, 38, 127–220. [Google Scholar] [CrossRef]
  10. Ueda, R.; Ichinokawa, T. Domain Structure of Tungsten Trioxide. Phys. Rev. 1950, 80, 1106. [Google Scholar] [CrossRef]
  11. Salje, E.; Viswanathan, K. Physical properties and phase transitions in WO3. Acta Crystallogr. A 1975, A31, 356–359. [Google Scholar] [CrossRef]
  12. Cazzanelli, E.; Vinegoni, C.; Mariotto, G.; Kuzmin, A.; Purans, J. Raman study of the phase transitions sequence in pure WO3 at high temperature and in HxWO3 with variable hydrogen content. Solid State Ionics 1999, 123, 67–74. [Google Scholar] [CrossRef]
  13. Kehl, W.L.; Hay, R.G.; Wahl, D. The Structure of Tetragonal Tungsten Trioxide. J. Appl. Phys. 1952, 23, 212–215. [Google Scholar] [CrossRef]
  14. Wang, B.; Wang, T.; Ma, S.; Bai, J.; Ma, H. Boosted light absorption by WO3−x/Ag/PbS heterostructure for high-efficiency interfacial solar steam generation. J. Colloid Interface Sci. 2024, 660, 192–202. [Google Scholar] [CrossRef] [PubMed]
  15. Deb, S.K. Opportunities and Challenges in Science and Technology of WO3 for Electrochromic and Related Applications. Sol. Energy Mater. Sol. Cells 2008, 92, 245–258. [Google Scholar] [CrossRef]
  16. Yoon, S.; Jo, C.; Noh, S.Y.; Lee, C.W.; Song, J.H.; Lee, J. Development of a high-performance anode for lithium ion batteries using novel ordered mesoporous tungsten oxide materials with high electrical conductivity. Phys. Chem. Chem. Phys. 2011, 13, 11060–11066. [Google Scholar] [CrossRef]
  17. Jin, H.; Zhou, H.; Zhang, Y. Insight into the Mechanism of CO Oxidation on WO3(001) Surfaces for Gas Sensing: A DFT Study. Sensors 2017, 17, 1898. [Google Scholar] [CrossRef]
  18. Righettoni, M.; Tricoli, A.; Gass, S.; Schmid, A.; Amann, A.; Pratsinis, S.E. Breath acetone monitoring by portable Si:WO3 gas sensors. Anal. Chim. Acta 2012, 738, 69–75. [Google Scholar] [CrossRef]
  19. Choi, S.J.; Ku, K.H.; Kim, B.J.; Kim, I.D. Novel Templating Route Using Pt Infiltrated Block Copolymer Microparticles for Catalytic Pt Functionalized Macroporous WO3 Nanofibers and Its Application in Breath Pattern Recognition. ACS Sens. 2016, 1, 1124–1131. [Google Scholar] [CrossRef]
  20. Kim, S.; Park, S.; Park, S.; Lee, C. Acetone sensing of Au and Pd-decorated WO3 nanorod sensors. Sens. Actuators B Chem. 2015, 209, 180–185. [Google Scholar] [CrossRef]
  21. Americo, S.; Pargoletti, E.; Soave, R.; Cargnoni, F.; Trioni, M.I.; Chiarello, G.L.; Cerrato, G.; Cappelletti, G. Unveiling the acetone sensing mechanism by WO3 chemiresistors through a joint theory-experiment approach. Electrochim. Acta 2021, 371, 137611. [Google Scholar] [CrossRef]
  22. Niklasson, G.A.; Berggren, L.; Larsson, A.L. Electrochromic tungsten oxide: The role of defects. Sol. Energy Mater. Sol. Cells 2004, 84, 315–328. [Google Scholar] [CrossRef]
  23. Niklasson, G.A.; Granqvist, C.G. Electrochromics for smart windows: Thin films of tungsten oxide and nickel oxide, and devices based on these. J. Mater. Chem. 2007, 17, 127–156. [Google Scholar] [CrossRef]
  24. Granqvist, C. Electrochromic tungsten oxide films: Review of progress 1993–1998. Sol. Energy Mater. Sol. Cells 2000, 60, 201–262. [Google Scholar] [CrossRef]
  25. Zhao, Y.; Feng, Z.C.; Liang, Y.; Sheng, H.W. Laser-induced coloration of WO3. Appl. Phys. Lett. 1997, 71, 2227–2229. [Google Scholar] [CrossRef]
  26. Greiner, M.T.; Chai, L.; Helander, M.G.; Tang, W.M.; Lu, Z.H. Transition Metal Oxide Work Functions: The Influence of Cation Oxidation State and Oxygen Vacancies. Adv. Funct. Mater. 2012, 22, 4557–4568. [Google Scholar] [CrossRef]
  27. Sachs, M.; Park, J.S.; Pastor, E.; Kafizas, A.; Wilson, A.A.; Francàs, L.; Gul, S.; Ling, M.; Blackman, C.; Yano, J.; et al. Effect of oxygen deficiency on the excited state kinetics of WO3 and implications for photocatalysis. Chem. Sci. 2019, 10, 5667–5677. [Google Scholar] [CrossRef]
  28. Cheng, C.; Fang, Q.; Fernandez-Alberti, S.; Long, R. Depleted Oxygen Defect State Enhancing Tungsten Trioxide Photocatalysis: A Quantum Dynamics Perspective. J. Phys. Chem. Lett. 2022, 13, 5571–5580. [Google Scholar] [CrossRef]
  29. Corby, S.; Francàs, L.; Kafizas, A.; Durrant, J.R. Determining the role of oxygen vacancies in the photoelectrocatalytic performance of WO3 for water oxidation. Chem. Sci. 2020, 11, 2907–2914. [Google Scholar] [CrossRef] [PubMed]
  30. Yu, H.; Guo, J.; Wang, C.; Zhang, J.; Liu, J.; Dong, G.; Zhong, X.; Diao, X. Essential role of oxygen vacancy in electrochromic performance and stability for WO3−y films induced by atmosphere annealing. Electrochim. Acta 2020, 332, 135504. [Google Scholar] [CrossRef]
  31. Wang, G.; Ling, Y.; Wang, H.; Yang, X.; Wang, C.; Zhang, J.Z.; Li, Y. Hydrogen-treated WO3 nanoflakes show enhanced photostability. Energy Environ. Sci. 2012, 5, 6180–6187. [Google Scholar] [CrossRef]
  32. Ferreira, L.G.; Marques, M.; Teles, L.K. Approximation to density functional theory for the calculation of band gaps of semiconductors. Phys. Rev. B 2008, 78, 125116. [Google Scholar] [CrossRef]
  33. Ferreira, L.G.; Marques, M.; Teles, L.K. Slater half-occupation technique revisited: The LDA-1/2 and GGA-1/2 approaches for atomic ionization energies and band gaps in semiconductors. AIP Adv. 2011, 1, 032119. [Google Scholar] [CrossRef]
  34. Janak, J.F. Proof that ∂E/∂ni = ϵi in density-functional theory. Phys. Rev. B 1978, 18, 7165–7168. [Google Scholar] [CrossRef]
  35. Valadares, F.; Guilhon, I.; Teles, L.K.; Marques, M. Electronic Structure Panorama of Halide Perovskites: Approximated DFT-1/2 Quasiparticle and Relativistic Corrections. J. Phys. Chem. C 2020, 124, 18390–18400. [Google Scholar] [CrossRef]
  36. Lahmer, M. Effect of oxygen vacancies on the electronic structure and dielectric properties of SrAl2O4: A first-principles study. J. Phys. Chem. Solids 2022, 160, 110297. [Google Scholar] [CrossRef]
  37. Matusalem, F.; Bechstedt, F.; Guilhon, I.; Marques, M.; Teles, L.K. DFT-1/2 method applied to 2D topological insulators: Fluorinated and hydrogenated group-IV honeycomb systems. J. Phys. Condens. Matter 2021, 33, 435501. [Google Scholar] [CrossRef] [PubMed]
  38. Zhu, Y.; Long, R. Density Functional Theory Half-Electron Self-Energy Correction for Fast and Accurate Nonadiabatic Molecular Dynamics. J. Phys. Chem. Lett. 2021, 12, 10886–10892. [Google Scholar] [CrossRef]
  39. Traore, B.; Even, J.; Pedesseau, L.; Képénekian, M.; Katan, C. Band gap, effective masses, and energy level alignment of 2D and 3D halide perovskites and heterostructures using DFT-1/2. Phys. Rev. Mater. 2022, 6, 014604. [Google Scholar] [CrossRef]
  40. Bader, R.F.W. Atoms in Molecules: A Quantum Theory; Monographs on Chemistry; Oxford University Press: Oxford, UK, 1990; Volume 22. [Google Scholar]
  41. Kong, H.; Yang, H.; Park, J.S.; Chae, W.S.; Kim, H.Y.; Park, J.; Lee, J.H.; Choi, S.Y.; Park, M.; Kim, H.; et al. Spatial Control of Oxygen Vacancy Concentration in Monoclinic WO3 Photoanodes for Enhanced Solar Water Splitting. Adv. Funct. Mater. 2022, 32, 2204106. [Google Scholar] [CrossRef]
  42. Li, W.; Yuan, X.; Qiu, S.; Liu, X. First-principles study of the effect of non-stoichiometry on sensing mechanism of NOx on WO3(001) surfaces. Mater. Today Commun. 2022, 33, 104926. [Google Scholar] [CrossRef]
  43. Perdew, J.P.; Burke, K.; Ernzerhof, M. Generalized Gradient Approximation Made Simple. Phys. Rev. Lett. 1996, 77, 3865–3868. [Google Scholar] [CrossRef] [PubMed]
  44. Soler, J.M.; Artacho, E.; Gale, J.D.; García, A.; Junquera, J.; Ordejón, P.; Sánchez-Portal, D. The SIESTA method for ab initio order-N materials simulation. J. Phys. Condens. Matter 2002, 14, 2745–2779. [Google Scholar] [CrossRef]
  45. Troullier, N.; Martins, J.L. Efficient pseudopotentials for plane-wave calculations. Phys. Rev. B 1991, 43, 1993–2006. [Google Scholar] [CrossRef] [PubMed]
  46. Rivero, P.; García-Suárez, V.M.; Pereñiguez, D.; Utt, K.; Yang, Y.; Bellaiche, L.; Park, K.; Ferrer, J.; Barraza-Lopez, S. Systematic pseudopotentials from reference eigenvalue sets for DFT calculations. Comput. Mater. Sci. 2015, 98, 372–389. [Google Scholar] [CrossRef]
  47. Lambert-Mauriat, C.; Oison, V. Density-functional study of oxygen vacancies in monoclinic tungsten oxide. J. Phys. Condens. Matter 2006, 18, 7361–7371. [Google Scholar] [CrossRef]
  48. Otero-de-la Roza, A.; Johnson, E.R.; Luaña, V. Critic2: A program for real-space analysis of quantum chemical interactions in solids. Comput. Phys. Commun. 2014, 185, 1007–1018. [Google Scholar] [CrossRef]
  49. Vogt, T.; Woodward, P.M.; Hunter, B.A. The High-Temperature Phases of WO3. J. Solid State Chem. 1999, 144, 209–215. [Google Scholar] [CrossRef]
  50. Howard, C.J.; Luca, V.; Knight, K.S. High-temperature phase transitions in tungsten trioxide—The last word? J. Phys. Condens. Matter 2002, 14, 377–387. [Google Scholar] [CrossRef]
  51. Butler, M.A. Photoelectrolysis and physical properties of the semiconducting electrode WO3. J. Appl. Phys. 1977, 48, 1914–1920. [Google Scholar] [CrossRef]
  52. Koffyberg, F.P.; Dwight, K.; Wold, A. Interband transitions of semiconducting oxides determined from photoelectrolysis spectra. Solid State Commun. 1979, 30, 433–437. [Google Scholar] [CrossRef]
  53. Miyake, K.; Kaneko, H.; Sano, M.; Suedomi, N. Physical and electrochromic properties of the amorphous and crystalline tungsten oxide thick films prepared under reducing atmosphere. J. Appl. Phys. 1984, 55, 2747–2753. [Google Scholar] [CrossRef]
  54. González-Borrero, P.P.; Sato, F.; Medina, A.N.; Baesso, M.L.; Bento, A.C.; Baldissera, G.; Persson, C.; Niklasson, G.A.; Granqvist, C.G.; Ferreira da Silva, A. Optical band-gap determination of nanostructured WO3 film. Appl. Phys. Lett. 2010, 96, 061909. [Google Scholar] [CrossRef]
  55. Valyukh, I.; Green, S.; Arwin, H.; Niklasson, G.; Wäckelgård, E.; Granqvist, C. Spectroscopic ellipsometry characterization of electrochromic tungsten oxide and nickel oxide thin films made by sputter deposition. Sol. Energy Mater. Sol. Cells 2010, 94, 724–732. [Google Scholar] [CrossRef]
  56. Shen, Z.; Zhao, Z.; Wen, J.; Qian, J.; Peng, Z.; Fu, X. Role of Oxygen Vacancies in the Electrical Properties of WO3−x Nano/Microrods with Identical Morphology. J. Nanomater. 2018, 2018, 7802589. [Google Scholar] [CrossRef]
  57. Rinaldi, F.G.; Arutanti, O.; Arif, A.F.; Hirano, T.; Ogi, T.; Okuyama, K. Correlations between Reduction Degree and Catalytic Properties of WOx Nanoparticles. ACS Omega 2018, 3, 8963–8970. [Google Scholar] [CrossRef] [PubMed]
  58. De Wijs, G.A.; de Boer, P.K.; de Groot, R.A.; Kresse, G. Anomalous behavior of the semiconducting gap in WO3 from first-principles calculations. Phys. Rev. B 1999, 59, 2684–2693. [Google Scholar] [CrossRef]
  59. Huda, M.N.; Yan, Y.; Moon, C.Y.; Wei, S.H.; Al-Jassim, M.M. Density-functional theory study of the effects of atomic impurity on the band edges of monoclinic WO3. Phys. Rev. B 2008, 77, 195102. [Google Scholar] [CrossRef]
  60. Migas, D.B.; Shaposhnikov, V.L.; Rodin, V.N.; Borisenko, V.E. Tungsten oxides. I. Effects of oxygen vacancies and doping on electronic and optical properties of different phases of WO3. J. Appl. Phys. 2010, 108, 093713. [Google Scholar] [CrossRef]
  61. Wang, F.; Di Valentin, C.; Pacchioni, G. Electronic and Structural Properties of WO3: A Systematic Hybrid DFT Study. J. Phys. Chem. C 2011, 115, 8345–8353. [Google Scholar] [CrossRef]
  62. Alvarez-Quiceno, J.C.; Dalpian, G.M.; Osorio-Guillén, J.M. A systematic first-principles study of the tungsten trioxide polymorphs. Phys. Status Solidi B 2015, 252, 2290–2295. [Google Scholar] [CrossRef]
  63. Wang, W.; Janotti, A.; Van de Walle, C.G. Role of oxygen vacancies in crystalline WO3. J. Mater. Chem. C 2016, 4, 6641–6648. [Google Scholar] [CrossRef]
  64. Hamdi, H.; Salje, E.K.H.; Ghosez, P.; Bousquet, E. First-principles reinvestigation of bulk WO3. Phys. Rev. B 2016, 94, 245124. [Google Scholar] [CrossRef]
  65. Chatten, R.; Chadwick, A.V.; Rougier, A.; Lindan, P.J.D. The Oxygen Vacancy in Crystal Phases of WO3. J. Phys. Chem. B 2005, 109, 3146–3156. [Google Scholar] [CrossRef] [PubMed]
  66. Bondarenko, N.; Eriksson, O.; Skorodumova, N.V. Polaron mobility in oxygen-deficient and lithium-doped tungsten trioxide. Phys. Rev. B 2015, 92, 165119. [Google Scholar] [CrossRef]
  67. Wang, F.; Di Valentin, C.; Pacchioni, G. Semiconductor-to-metal transition in WO3−x: Nature of the oxygen vacancy. Phys. Rev. B 2011, 84, 073103. [Google Scholar] [CrossRef]
  68. Gerosa, M.; Di Valentin, C.; Onida, G.; Bottani, C.E.; Pacchioni, G. Anisotropic Effects of Oxygen Vacancies on Electrochromic Properties and Conductivity of γ-Monoclinic WO3. J. Phys. Chem. C 2016, 120, 11716–11726. [Google Scholar] [CrossRef]
  69. Aroyo, M.I.; Orobengoa, D.; de la Flor, G.; Tasci, E.S.; Perez-Mato, J.M.; Wondratschek, H. Brillouin-zone database on the Bilbao Crystallographic Server. Acta Crystallogr. A 2014, 70, 126–137. [Google Scholar] [CrossRef]
  70. Allpress, J.; Tilley, R.; Sienko, M. Examination of substoichiometric WO3−x crystals by electron microscopy. J. Solid State Chem. 1971, 3, 440–451. [Google Scholar] [CrossRef]
  71. Bousquet, E.; Hamdi, H.; Aguado-Puente, P.; Salje, E.K.H.; Artacho, E.; Ghosez, P. First-principles characterization of single-electron polaron in WO3. Phys. Rev. Res. 2020, 2, 012052. [Google Scholar] [CrossRef]
  72. Le, H.M.; Vu, N.H.; Phan, B.T. Migrations of oxygen vacancy in tungsten oxide (WO3): A density functional theory study. Comput. Mater. Sci. 2014, 90, 171–176. [Google Scholar] [CrossRef]
  73. Wassmann, T.; Seitsonen, A.P.; Saitta, A.M.; Lazzeri, M.; Mauri, F. Structure, Stability, Edge States, and Aromaticity of Graphene Ribbons. Phys. Rev. Lett. 2008, 101, 096402. [Google Scholar] [CrossRef] [PubMed]
  74. Chase, M.W. NIST-JANAF Thermochemical Tables; American Chemical Society: New York, NY, USA, 1998. [Google Scholar] [CrossRef]
  75. Wang, L.; Maxisch, T.; Ceder, G. Oxidation energies of transition metal oxides within the GGA+U framework. Phys. Rev. B 2006, 73, 195107. [Google Scholar] [CrossRef]
  76. Fang, Z.; Jiao, S.; Wang, B.; Yin, W.; Liu, S.; Gao, R.; Liu, Z.; Pang, G.; Feng, S. Synthesis of reduced cubic phase WO3−x nanosheet by direct reduction of H2WO4·H2O. Mater. Today Energy 2017, 6, 146–153. [Google Scholar] [CrossRef]
  77. Xie, F.Y.; Gong, L.; Liu, X.; Tao, Y.T.; Zhang, W.H.; Chen, S.H.; Meng, H.; Chen, J. XPS studies on surface reduction of tungsten oxide nanowire film by Ar+ bombardment. J. Electron Spectrosc. Relat. Phenom. 2012, 185, 112–118. [Google Scholar] [CrossRef]
  78. Qian, J.; Peng, Z.; Shen, Z.; Zhao, Z.; Zhang, G.; Fu, X. Positive impedance humidity sensors via single-component materials. Sci. Rep. 2016, 6, 25574. [Google Scholar] [CrossRef] [PubMed]
  79. Yu, W.; Shen, Z.; Peng, F.; Lu, Y.; Ge, M.; Fu, X.; Sun, Y.; Chen, X.; Dai, N. Improving gas sensing performance by oxygen vacancies in sub-stoichiometric WO3−x. RSC Adv. 2019, 9, 7723–7728. [Google Scholar] [CrossRef] [PubMed]
  80. Zheng, X.; Dong, X.; Zhang, S.; Yang, J. Defect-induced ferromagnetism in W18O49 nanowires. J. Alloys Compd. 2020, 818, 152894. [Google Scholar] [CrossRef]
  81. Oliver, P.M.; Parker, S.C.; Egdell, R.G.; Jones, F.H. Computer simulation of the surface structures of WO3. J. Chem. Soc. Faraday Trans. 1996, 92, 2049–2056. [Google Scholar] [CrossRef]
  82. Wang, F.; Di Valentin, C.; Pacchioni, G. DFT Study of Hydrogen Adsorption On the Monoclinic WO3 (001) Surface. J. Phys. Chem. C 2012, 116, 10672–10679. [Google Scholar] [CrossRef]
  83. Migas, D.B.; Shaposhnikov, V.L.; Borisenko, V.E.; Skorodumova, N.V. The Surface Energy and Band Structure of γ-WO3 Thin Films. Sci. Adv. Mater. 2017, 9, 469–474. [Google Scholar] [CrossRef]
  84. Lambert-Mauriat, C.; Oison, V.; Saadi, L.; Aguir, K. Ab initio study of oxygen point defects on tungsten trioxide surface. Surf. Sci. 2012, 606, 40–45. [Google Scholar] [CrossRef]
  85. Halek, G.; Baikie, I.; Teterycz, H.; Halek, P.; Suchorska-Woźniak, P.; Wiśniewski, K. Work function analysis of gas sensitive WO3 layers with Pt doping. Sens. Actuators B Chem. 2013, 187, 379–385. [Google Scholar] [CrossRef]
  86. Albanese, E.; Di Valentin, C.; Pacchioni, G. H2O Adsorption on WO3 and WO3−x (001) Surfaces. ACS Appl. Mater. Interfaces 2017, 9, 23212–23221. [Google Scholar] [CrossRef] [PubMed]
Figure 1. Left panel: band structure of γ -monoclinic WO   3 and density of states. Right panel: first Brillouin zone.
Crystals 14 00372 g001
Figure 2. Band structure of the cubic phase of WO   3 . The unit cell is considered in the upper panel, while the 2 × 2 × 2 is considered in the lower panel.
Crystals 14 00372 g002
Figure 3. Real space distribution of the squared lowest unoccupied state at Γ . The yellow isosurface corresponds to ρ = 0.001 bohr   3 .
Crystals 14 00372 g003
Figure 4. Cells used for the defective systems calculation, containing one oxygen vacancy each.
Crystals 14 00372 g004
Figure 5. Formation enthalpy of a single oxygen vacancy for different vacancy densities. The dotted line is an analytical fit for one of the cases (the last two points are obtained by extrapolation of the other results). n represents the number of unit cells for one vacancy.
Crystals 14 00372 g005
Figure 6. Left panel: Gibbs free energy of the oxygen vacancy formation for three different values of μ O 2 . The line with symbols represents the minima of G O 2 as a function of μ O 2 , the first point at the right side of the line corresponds to μ O 2 = 4.5 eV, and each further point (towards the left) corresponds to a decrease of 0.5 eV. n represents the number of unit cells for each vacancy. Right panel: contour plot of μ O 2 ( P , T ) . The symbol X marks the chemical potential of O   2 at T = 1920 K and P = 0.2 bar (see text for more details).
Crystals 14 00372 g006
Figure 7. Band structure and density of states of WO   3 δ : (a) large unrelaxed cell, vacancy concentration corresponding to δ = 0.021 ; (b) small relaxed cell, vacancy concentration corresponding to δ = 0.125 . Both panels reports in black the total DOS of the majority (up) and minority (down) spin components, as well as their projection on tungsten atoms (W, in green) and on oxygen atoms (O, in red).
Crystals 14 00372 g007
Figure 8. Charge density of the mid-gap localized electronic state for the large unrelaxed cell (see Figure 7a). The yellow isosurface corresponds to ρ = 0.001 e/bohr   3 .
Crystals 14 00372 g008
Figure 9. Left panel: cartoon of the clean WO   3 surface (for pictorial reasons we doubled the surface area). Right panel: surface band structure and density of states. The higher horizontal dotted line represents the position of the bottom of the bulk conduction band.
Crystals 14 00372 g009
Figure 10. Zoom of the DOS near the bottom of the conduction bands (CB), for pure and some defective systems: (a) clean surface, (b) V   O b , (c) V   O b t , (d) V   O b s , (e) V   O b t t , (f) V   O t . The filled part of the DOS represents occupied states. The black vertical line indicates the position of the bottom of the bulk CB (at 2.46 eV from the top of the valence band). The broadening of the eigenvalues is 0.01 eV.
Crystals 14 00372 g010
Figure 11. Atomic charge differences color-mapped onto the atomic structures of the systems considered. The charges are referenced to those of the clean surface. The color bar is reported on the right.
Crystals 14 00372 g011
Figure 12. Spin density for the V   O b t case. The black spheres represent the oxygen vacancies. The isosurfaces correspond to ρ = ± 0.001 e/bohr   3 . The crystallographic axes b and c are shown on the right hand side of the plot.
Crystals 14 00372 g012
Table 1. Structural properties of WO   3 pristine system (non-defective) and band energy gap. Lengths in Å and volumes in Å   3 .
abc β (Degree)Vol *Gap (eV), (D) Direct (I) Indirect
Ref. [6] [Exp.]7.306 (1)7.540 (1)7.692 (1)90.881 (5)52.96 (7)
Ref. [3] [Exp.]7.3008 (5)7.5388 (1)7.6896 (3)90.892 (1)52.898
Ref. [49] [Exp.]7.3271 (2)7.5644 (2)7.7274 (3)90.488 (3)53.535 (3)
Ref. [50] [Exp.]7.3033 (2)7.5375 (2)7.6920 (2)90.855 (1)52.923
Ref. [51] [Exp.] 2.65, 2.70, 2.77 (I)
Ref. [52] [Exp.] 2.62 ± 0.04 (I), 3.53 ± 0.02 (D)
Ref. [53] [Exp.] 2.57, 2.70, 2.75 (I)
Ref. [54] [Exp.] 2.70–2.75 ± 0.06
Ref. [55] [Exp.] 3.150 ± 0.003 (D)
Ref. [56] [Exp.] 2.75
Ref. [57] [Exp.] 2.61
Ref. [21] [Exp.] 2.6
This work [PBE]7.467.687.8890.456.52.48   (I), 3.2   (D)
Ref. [58] [PW91]7.557.627.8390.256.30.90
Ref. [58] [LDA]7.377.467.6490.652.31.10
Ref. [47] [PBE]7.487.667.8590.456.2∼1.0
Ref. [59] [LDA]7.3817.4727.633∼52.61.31
Ref. [60] [PBE]7.4987.6497.78990.6155.81.40
Ref. [61] [HSE06]7.397.647.7590.354.72.80
Ref. [61] [B3LYP]7.447.737.9190.256.93.13, 2.80  
Ref. [62] [PBEsol]7.4927.5467.75790.0654.81.31, 2.76  
Ref. [63] [HSE06]7.417.637.7990.1555.12.56
Ref. [64] [B1-WC]7.3597.4867.54491.3151.92.85
* Per formula unit.   PBE-1/2.   HSE06.
Table 2. Bond sequences along the three cell axes (mean standard deviations are reported in parentheses).
Along a (Å)Along b (Å)Along c (Å)
Ref. [6] [Exp.]1.861 (15)–1.940 (16)1.741 (15)–2.119 (15)1.736 (10)–2.176 (10)
Ref. [49] [Exp.]1.860 (11)–1.926 (11)1.813 (17)–2.051 (17)1.713 (11)–2.197 (11)
This work [PBE]   1.919–1.9341.820–2.0931.793–2.189
Ref. [47] [PBE]1.916–1.9401.819–2.1021.791–2.178
Ref. [65] [PBE]   1.865–1.9371.785–2.0871.795–2.166
Ref. [61] [B3LYP]1.90–1.911.77–2.151.75–2.22
Ref. [66] [PBE+U]1.89–1.901.84–2.041.80–2.10
  The Wyckoff positions of all atoms are available from the authors on request.   For the P21-m structure.
Table 3. Formation enthalpy for a single vacancy in WO   3 δ , E O 2 ( n ) in eV.
n δ E O 2 ( n )     E O 2 ( n )    
10.12504.013.72
20.06252.772.57
30.04172.462.23
40.03132.322.13
50.02502.252.10
2 × 20.03132.642.27
3 × 20.02082.342.02
  Relaxation of the chain.   Relaxation of all atoms.
Table 4. Formation enthalpy for vacancy in WO   3 δ (001) surface.
N. of V   O E O 2 (eV) (per vac.) μ   ( μ B )
V   O b 12.270.00
V   O b t 24.20 (2.10)1.04
V   O b s 24.48 (2.24)0.41
V   O b t t 36.16 (2.05)0.00
V   O t 11.400.00
Disclaimer/Publisher’s Note: The statements, opinions and data contained in all publications are solely those of the individual author(s) and contributor(s) and not of MDPI and/or the editor(s). MDPI and/or the editor(s) disclaim responsibility for any injury to people or property resulting from any ideas, methods, instructions or products referred to in the content.

