Article

The Influence of In3+ on the Crystal Growth and Visible Band Photorefraction of Uranium-Doped Lithium Niobate Single Crystals

1
Institute of Crystal Growth, School of Materials Science and Engineering, Shanghai Institute of Technology, Shanghai 201418, China
2
MOE Key Laboratory of Weak-Light Nonlinear Photonics, School of Physics and TEDA Institute of Applied Physics, Nankai University, Tianjin 300071, China
*
Authors to whom correspondence should be addressed.
Crystals 2024, 14(4), 380; https://doi.org/10.3390/cryst14040380
Submission received: 1 April 2024 / Revised: 14 April 2024 / Accepted: 15 April 2024 / Published: 18 April 2024

Abstract

:
A series of lithium niobate crystals co-doped with uranium and indium was successfully grown by the modified vertical Bridgman method for the first time. With increasing In3+ ion doping concentration, the segregation coefficient of uranium and indium progressively deviated from 1. The structural refinement indicated that uranium ions with high valence preferred to occupy the Nb sites in LN: In, U crystals. LN: In2.0, U0.6 achieved multi-wavelength holographic writing with diffraction efficiency comparable to commercial crystals LN:Fe0.3, demonstrating a response time that was four times shorter than LN:Fe0.3. XPS analysis was employed to investigate the valence states of In3+ ions in LN: In2.0, U0.6, in which uranium ions presented three valences of +4, +5 and +6. Furthermore, the ‘real threshold concentration’ of In3+ ions in LN: In, U was calculated using the Li-vacancy model, which is consistent with the results obtained from the experimental study of the OH absorption spectrum. Discussions on the photorefractive centers in LN: In, U are also provided. This study not only demonstrates the impact of doping In3+ ions on the growth of LN:U crystals, but also offers new insights into the photorefractive properties of LN in the visible band.

1. Introduction

Lithium niobate (LN), distinguished for its superior electro-optic, acoustic–optic, photoelastic, piezoelectric, pyroelectric, nonlinear optical properties and photorefractive (PR) effects [1], is acclaimed as the ‘silicon of photonics’ [2]. With the evolution of lithium niobate-on-insulator (LNOI) technology, LN-based platforms have fostered the development of filters, laser [3], optical waveguide devices [4] and integrated microwave photonic chips [5,6], establishing a robust application framework. Scholars have posited that humanity is progressing toward a lithium niobate valley [7]. The PR effect in LN underpins platforms for applications such as holographic data storage [8] and real-time dynamic displays [9], marking a significant stride in the utilization of this versatile material. The intrinsic and extrinsic defects always serve as the PR centers. In particular, congruent lithium niobate (CLN) typically refers to a composition with a Li-to-Nb ratio of 48.38/51.62. This specific composition allows for a highly adaptable structure in CLN, characterized by the incorporation of intrinsic defects, such as anti-Nb5+ ( Nb Li 4 + ) and lithium vacancy ( V Li ) [10]. Hence, it provides a broad space for modulating the PR properties of CLN through doping variable valence ions [11].
Numerous efforts have been made to modify the PR properties of lithium niobate (LN). Early investigations involved doping LN with low-valence ions, including Fe, Mn and Cu, among others [12,13]. These efforts enhanced some parameters about the photorefractive properties, but are still far from meeting the requirement of the commercial holographic application. Recent research has suggested that doping lithium niobate (LN) with high-valence ions, including V [14], Mo [15] and U [8,16], could more effectively enhance its PR properties. In particular, our group has grown a series of uranium ion-doped LN (LN: U) crystals and investigated their PR properties. The results showed that the LN: U0.6 demonstrated a short response time of 1.17 s, and the saturation diffraction efficiency and sensitivity reached as high as 67.15% and 2.24 cm/J, respectively [8].
Kong et al. [17] proposed that based on a mono-doped LN with good PR properties, co-doping optical damage-resistant ions to remove intrinsic defects might enhance its PR performance. The indium ion (In3+) is found to be a significant ion resistant to optical damage [17]. Consequently, efforts to co-dope LN with indium ions and PR ions have been undertaken. For instance, Zhang et al. [18] synthesized a series of lithium niobate (LN) crystals co-doped with indium and iron (LN: Fe, In), and the results demonstrated that the inclusion of indium ions significantly enhanced the PR properties compared to those observed in LN doped solely with iron. Furthermore, Zhu et al. [19] reported that lithium niobate crystals co-doped with 1.0 mol% indium and 0.5 mol% molybdenum achieved a diffraction efficiency of 61.57% at 488 nm and response times of 0.61, 0.76 and 0.74 s at wavelengths of 422, 488 and 532 nm, respectively, indicating superior properties to LN: Mo. So, the strategy of co-doping with indium has proven to be important for adjusting the PR properties of LN doped with PR ions. To date, there has been no investigation into the effects of co-doping LN with both uranium and indium, making such a study a valuable pursuit for understanding the influence of indium ions on the crystal growth and PR properties of LN: U.
In this work, we synthesized a series of LN crystals co-doped with uranium and indium via the modified vertical Bridgman method. Among these, LN: In2.0, U could realize holography in multi-visible bands, and exhibited the highest diffraction efficiency of 55.61% at 488 nm and the shortest response time of 5.53 s at 532 nm. The threshold concentration of In3+ in LN: In, U was different from that in LN: In. The PR centers and mechanisms were also discussed.

2. Materials and Methods

The raw materials of the crystal growth of LN: In, U were Li2CO3, Nb2O5, In2O3 and UO2, with a purity of 99.99%. The Nb2O5 was processed by defluorinated calcination treatment. The crystal growth of LN: In, U was carried out by the modified vertical Bridgman method. The [Li]/[Nb] ratio was chosen as 48.38/51.62. The doping concentration of uranium was 0.6 mol% for all samples because the study about LN mono-doped with uranium showed that 0.6 mol% was the best concentration for uranium ions [8]. The doping concentration of indium was 2.0 mol% (LN: In2.0, U0.6), 4.0 mol% (LN: In4.0, U0.6) and 6.0 mol% (LN: In6.0, U0.6). First, the polycrystalline powder was synthesized by a muffle furnace. The temperature of the raw material was then raised to 800 °C and maintained for 6 h, and then it was increased up to 1150 °C within another 6 h and maintained for a further 8 h. Finally, the powder was left to cool naturally to room temperature. After the sintering process, the powder was put into the oven to prevent deliquescence. In the growth step, a pure congruent LN crystal (CLN) seed crystal was put at the bottom of a 1-inch platinum crucible, and a thermocouple was put at the bottom of the seed to record the temperature change. Then, the prepared polycrystalline powder was put into the platinum crucible and placed into a sealed alumina insulation tube. The function of alumina powder was to maintain the stability of the thermal field. The max temperature of the crystal growth was selected as 1430 °C, ensuring the fusion of polycrystalline materials and promoting the thorough diffusion of dopant ions within the melt. In the crystal growth process, the polycrystalline powder was lifted to the high-temperature region to melt the powder thoroughly; then the descent process was carried out at the rate of 0.3–0.5 mm/h for about 15 days. After the descent process, the temperature was decreased at a rate of 40 °C/h.
The PR characteristics of the sample were investigated by holographic experiment, using dual-wave mixing in transmission geometry, with wavelengths provided by an Ar+ laser and a continuous-wave second harmonic solid-state laser at 488 nm (400 mW/cm2), 532 nm (400 mW/cm2) and 671 nm (3000 mW/cm2), respectively. The same equipment and the diffraction efficiency definition formula were used as in the previous study [20].
The element analysis of the sample was performed by ZEISS GeminiSEM 300 (Zeiss, Oberkochen, Germany). The powder X-ray diffraction test was carried out by Dandong Tongda TD3500 diffractometer (Dandong Tongda Technology Co., Ltd., Dandong, China) with the Cu Kα radiation (λ = 0.15406 nm), and the test range and step width were over a 2θ range from 5° to 120° with a step size of 0.02°. The rocking curves were obtained by SmartLab X-ray diffractometer (Rigaku, Tokyo, Japan). The X-ray photoelectron spectroscopy was tested by AlKα Microfocus monochrome light source, with a test range of 30–400 µm and a step width of 5 µm. The separation coefficient was obtained by Agilent 7700(MS) plasma mass spectrometer (Agilent Technologies, Santa Clara, CA, USA). The OH absorption spectrum was obtained by Nicolet 10 Fourier infrared spectrometer (Thermo Scientific, Madison, WI, USA), with a range of 1900–3900 cm−1.

3. Results and Discussion
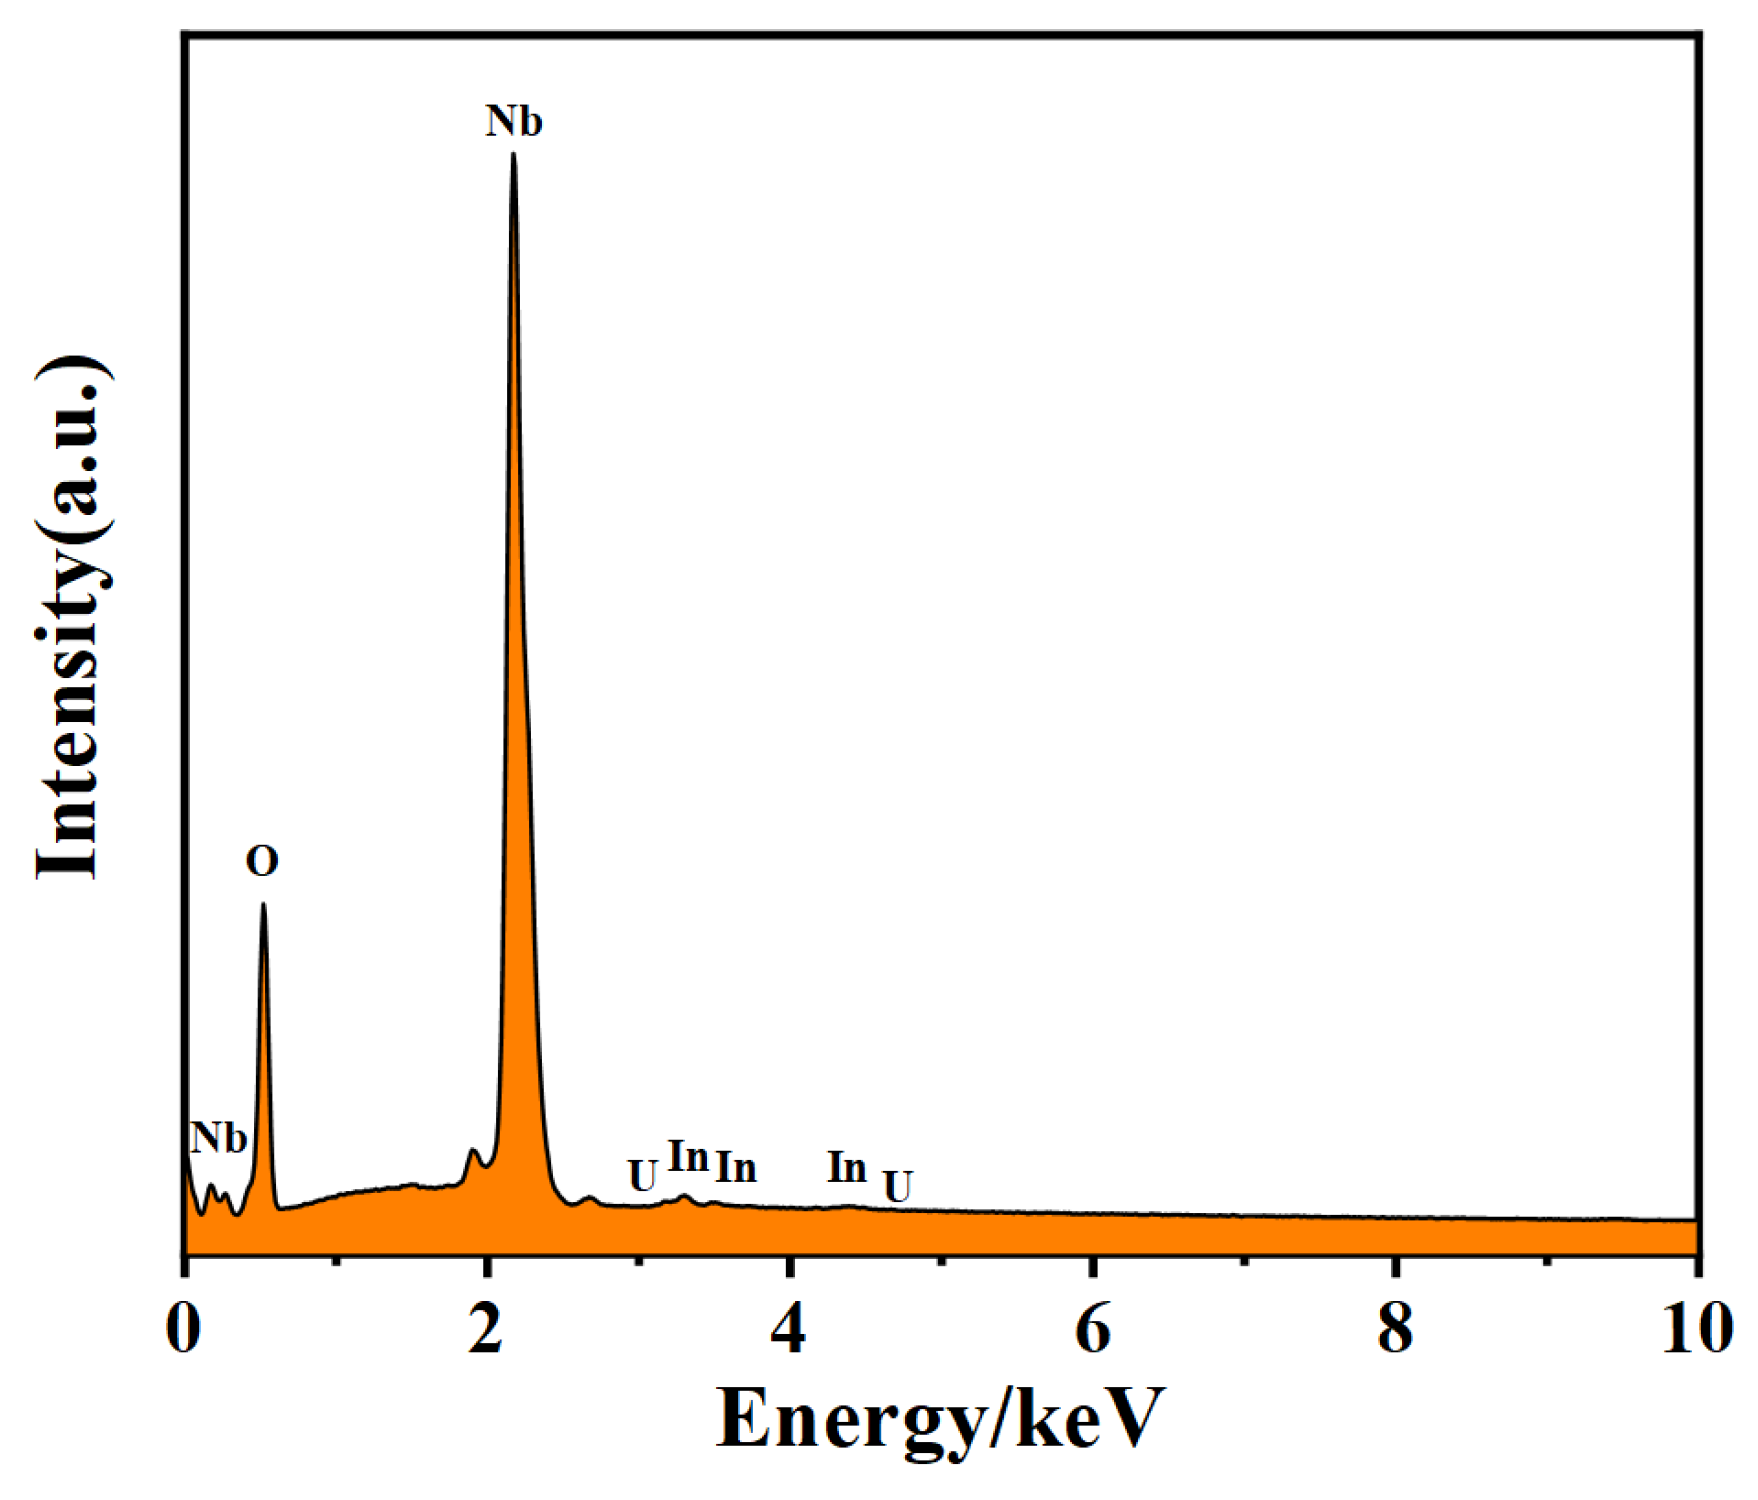
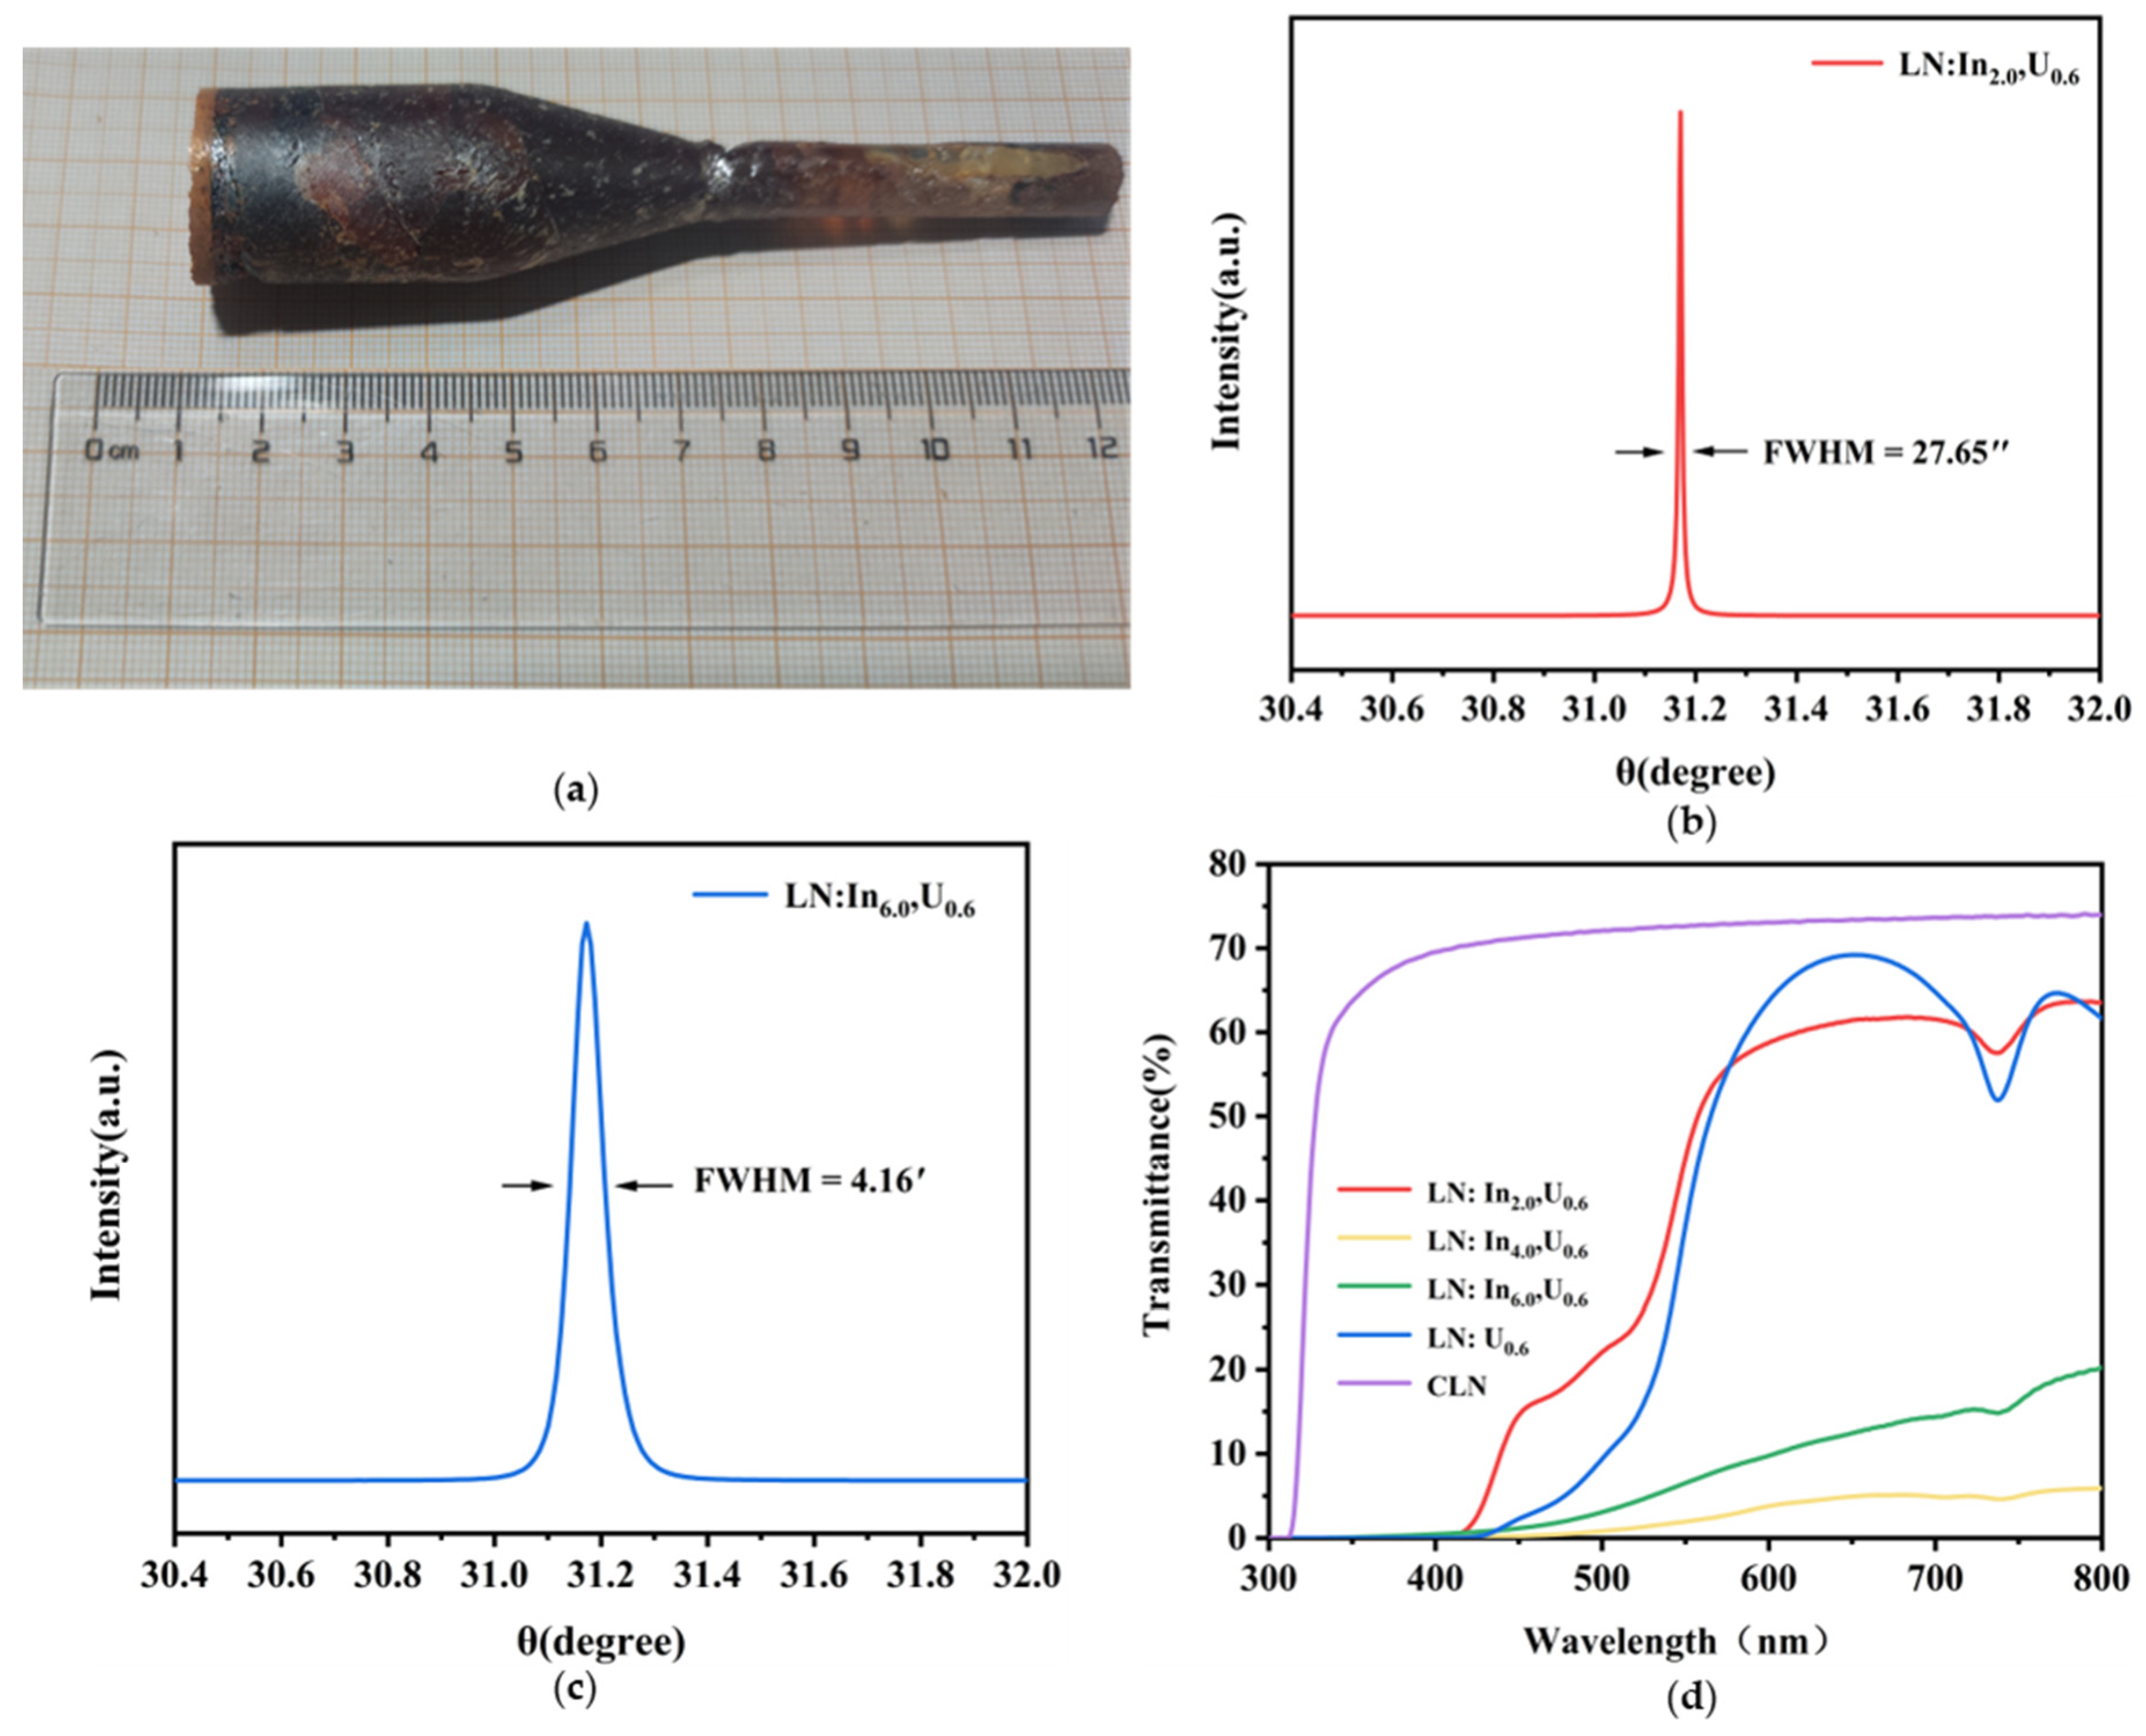
3.1. Crystal Growth

To ascertain the successful incorporation of dopant ions into the LN crystal, the energy dispersive spectrum of the LN: In2.0, U0.6 crystal was performed after grinding it into powder, as shown in Figure 1. The analysis reveals that the constituent elements of the crystal sample, Nb, U and In, are consistent with the targeted crystals of this study. It should be noted that Li is absent from the spectrum, which is attributed to the inability of the scanning electron microscope used for testing to detect elements preceding boron. Consequently, it is concluded that In and U ions have successfully been incorporated into the LN: In2.0, U0.6 crystal.
A series of LN: In, U crystals 12 cm in length and 1 inch in diameter was successfully grown, as shown in Figure 2a. The LN: In2.0, U0.6 crystal was integrated and brown in color. Typically, high-resolution X-ray rocking curves are extensively utilized for assessing the crystal quality of single crystals. It should be noted that the rocking curves of the LN: In4.0, U0.6 and LN: In6.0, U0.6 samples are nearly identical, thereby presenting the curve of LN: In6.0, U0.6 as representative. The rocking curves for LN: In2.0, U0.6 and LN: In6.0, U0.6 crystals are depicted in Figure 2b,c. The LN: In2.0, U0.6 crystal exhibited an FWHM of 27.65″, which is narrower than that of BSO (0.63°) [21] and GaAs (0.224°) [22]. This meant that LN: In2.0, U0.6 had little internal stress and defects, thereby denoting a high crystal quality. But the LN: In6.0, U0.6 crystal demonstrated a wide FWHM of 4.16′, which meant a much lower crystallization quality. To clarify the reason for the difference in quality, the segregation coefficients of In and U within LN were measured. The segregation coefficient is defined as the ratio of the experimentally designed ion doping concentration to the doping concentration that enters the crystal. As listed in Table 1, with the increment of In3+ doping concentration, the segregation coefficient of In3+ gradually decreases from 1 to 0.84. More importantly, with more In3+ doped, the segregation coefficient of U deviates more from 1 and decreases rapidly to 0.84. Therefore, doping In3+ declines the quality of crystal growth. The difference between the crystallization quality also brought the difference in the transmittance of LN: In, U. As shown in Figure 2d, the transmittance spectra showed that the transmittances of LN: In4.0, U0.6 and LN: In6.0, U0.6 were much lower than LN: U0.6 (≤69%) and LN: In2.0, U0.6. The transmittances of LN: In4.0, U0.6 and LN: In6.0, U0.6 could not meet the requirement of the holographic experiment, so the PR properties of the LN: In4.0, U0.6 and LN: In6.0, U0.6 samples were not successfully carried out.
To further study the crystal structure in detail, the XRD diffraction data of LN: In2.0, U0.6 were refined by the General Structure Analysis System (GSAS) software of TOPAS academic. The structural refinement yielded Rp = 4.699%, Rwp = 6.354%, and a goodness-of-fit factor (Gof) of 1.973. The reliability of the refinement is supported by the inequality of Rp < Rwp < 10%, and the Gof falls within the range of 1 < Gof < 2, which means the refinement results are deemed reliable [8,23]. The Rietveld refinement pattern of LN: In2.0, U0.6 is illustrated in Figure 3, utilizing data from the PDF#74-2238 card as the initial model. Crystallographic data and reliability factors are listed in Table 2. From the table, it is evident that the LN: In2.0, U0.6 crystal belongs to the R3c space group, with crystallographic parameters of a = 5.15847 Å, b = 5.15852 Å, c = 13.87605 Å and V = 319.7733 Å3. The atomic coordinates and isotropic displacement parameters for the LN: In2.0, U0.6 crystal are presented in Table 3. It can be observed that the occupancy of U ions at the normal Nb sites is 0.006, while the In ions at the anti-Nb5⁺ sites (essentially the Li sites) is 0.021, corresponding to the nominal doping level of indium ions in LN: In2.0, U0.6.

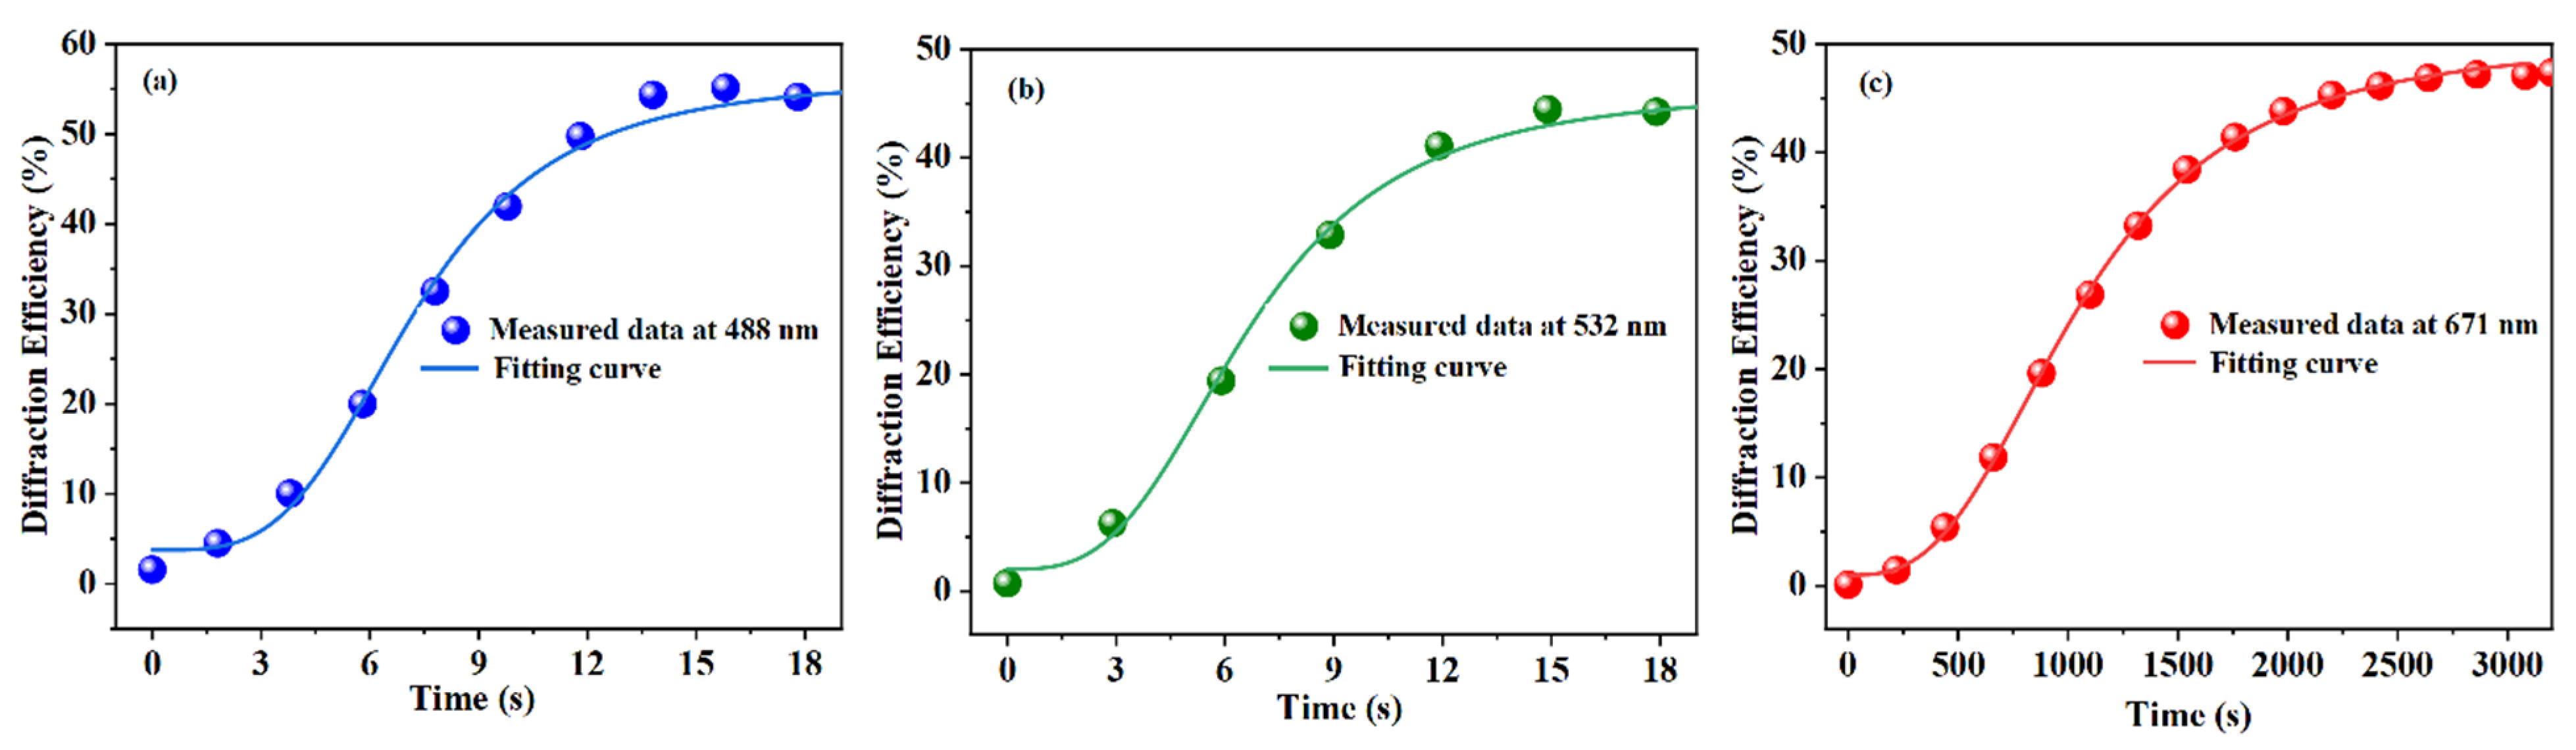
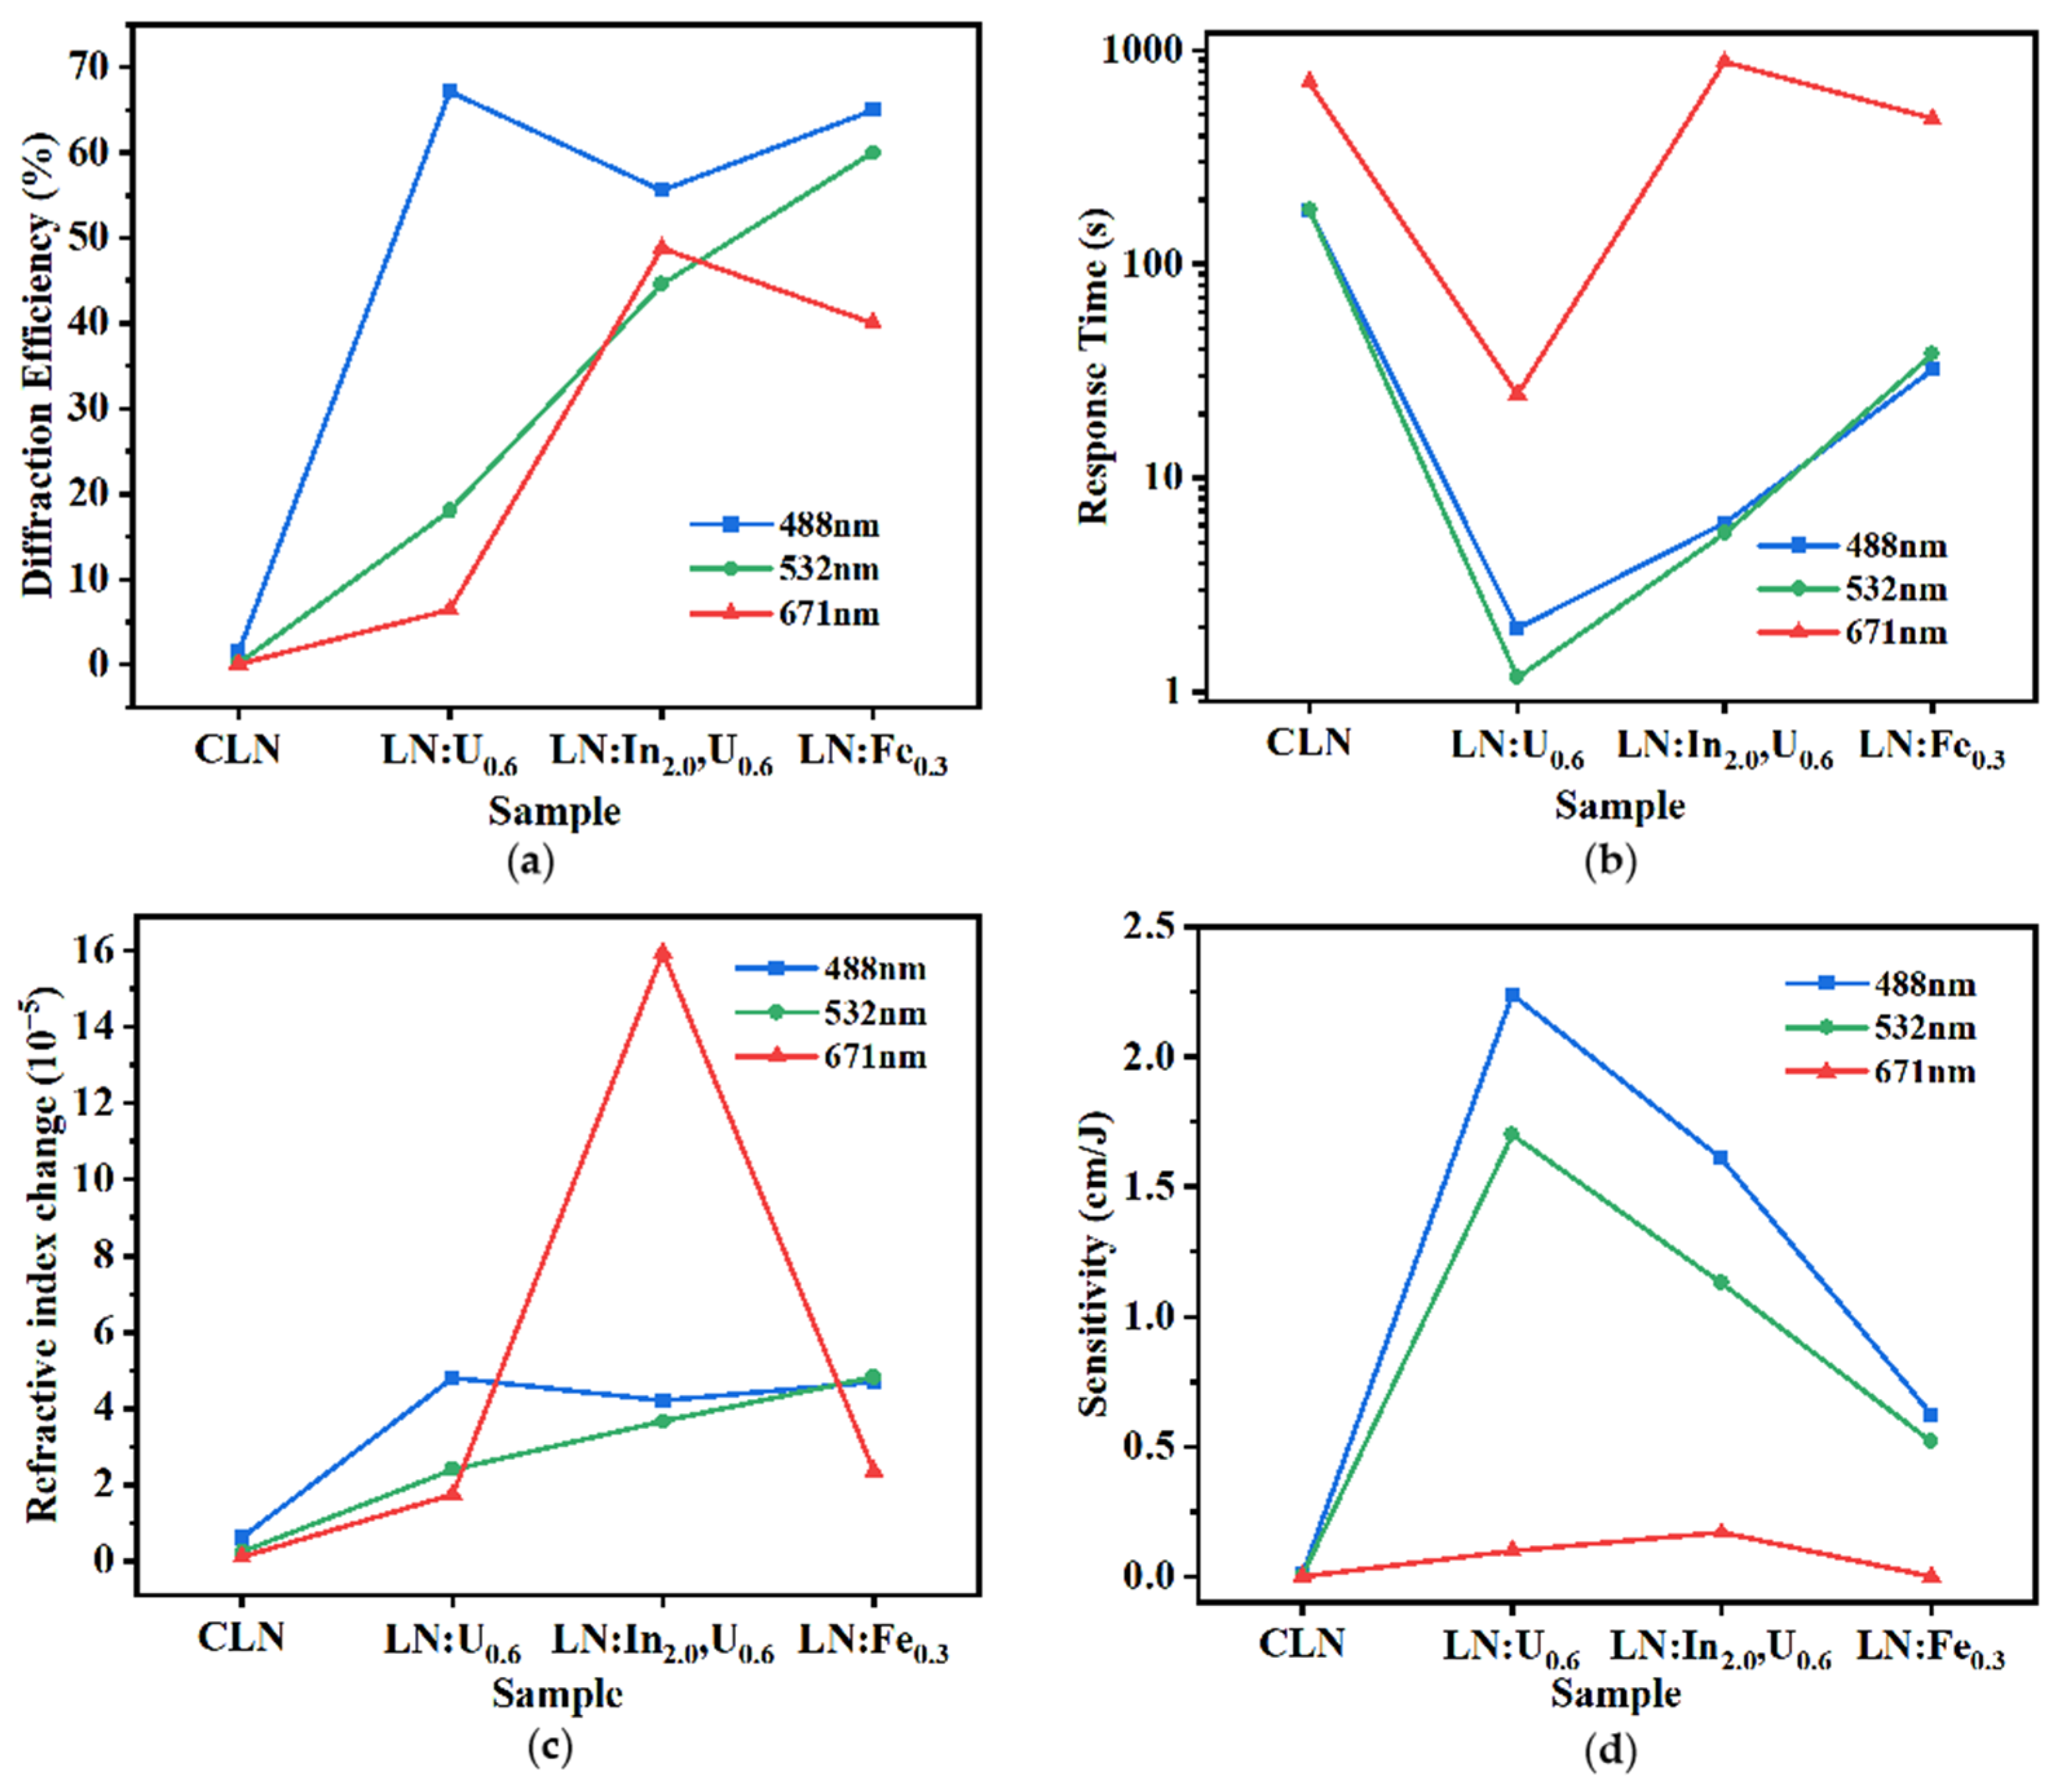
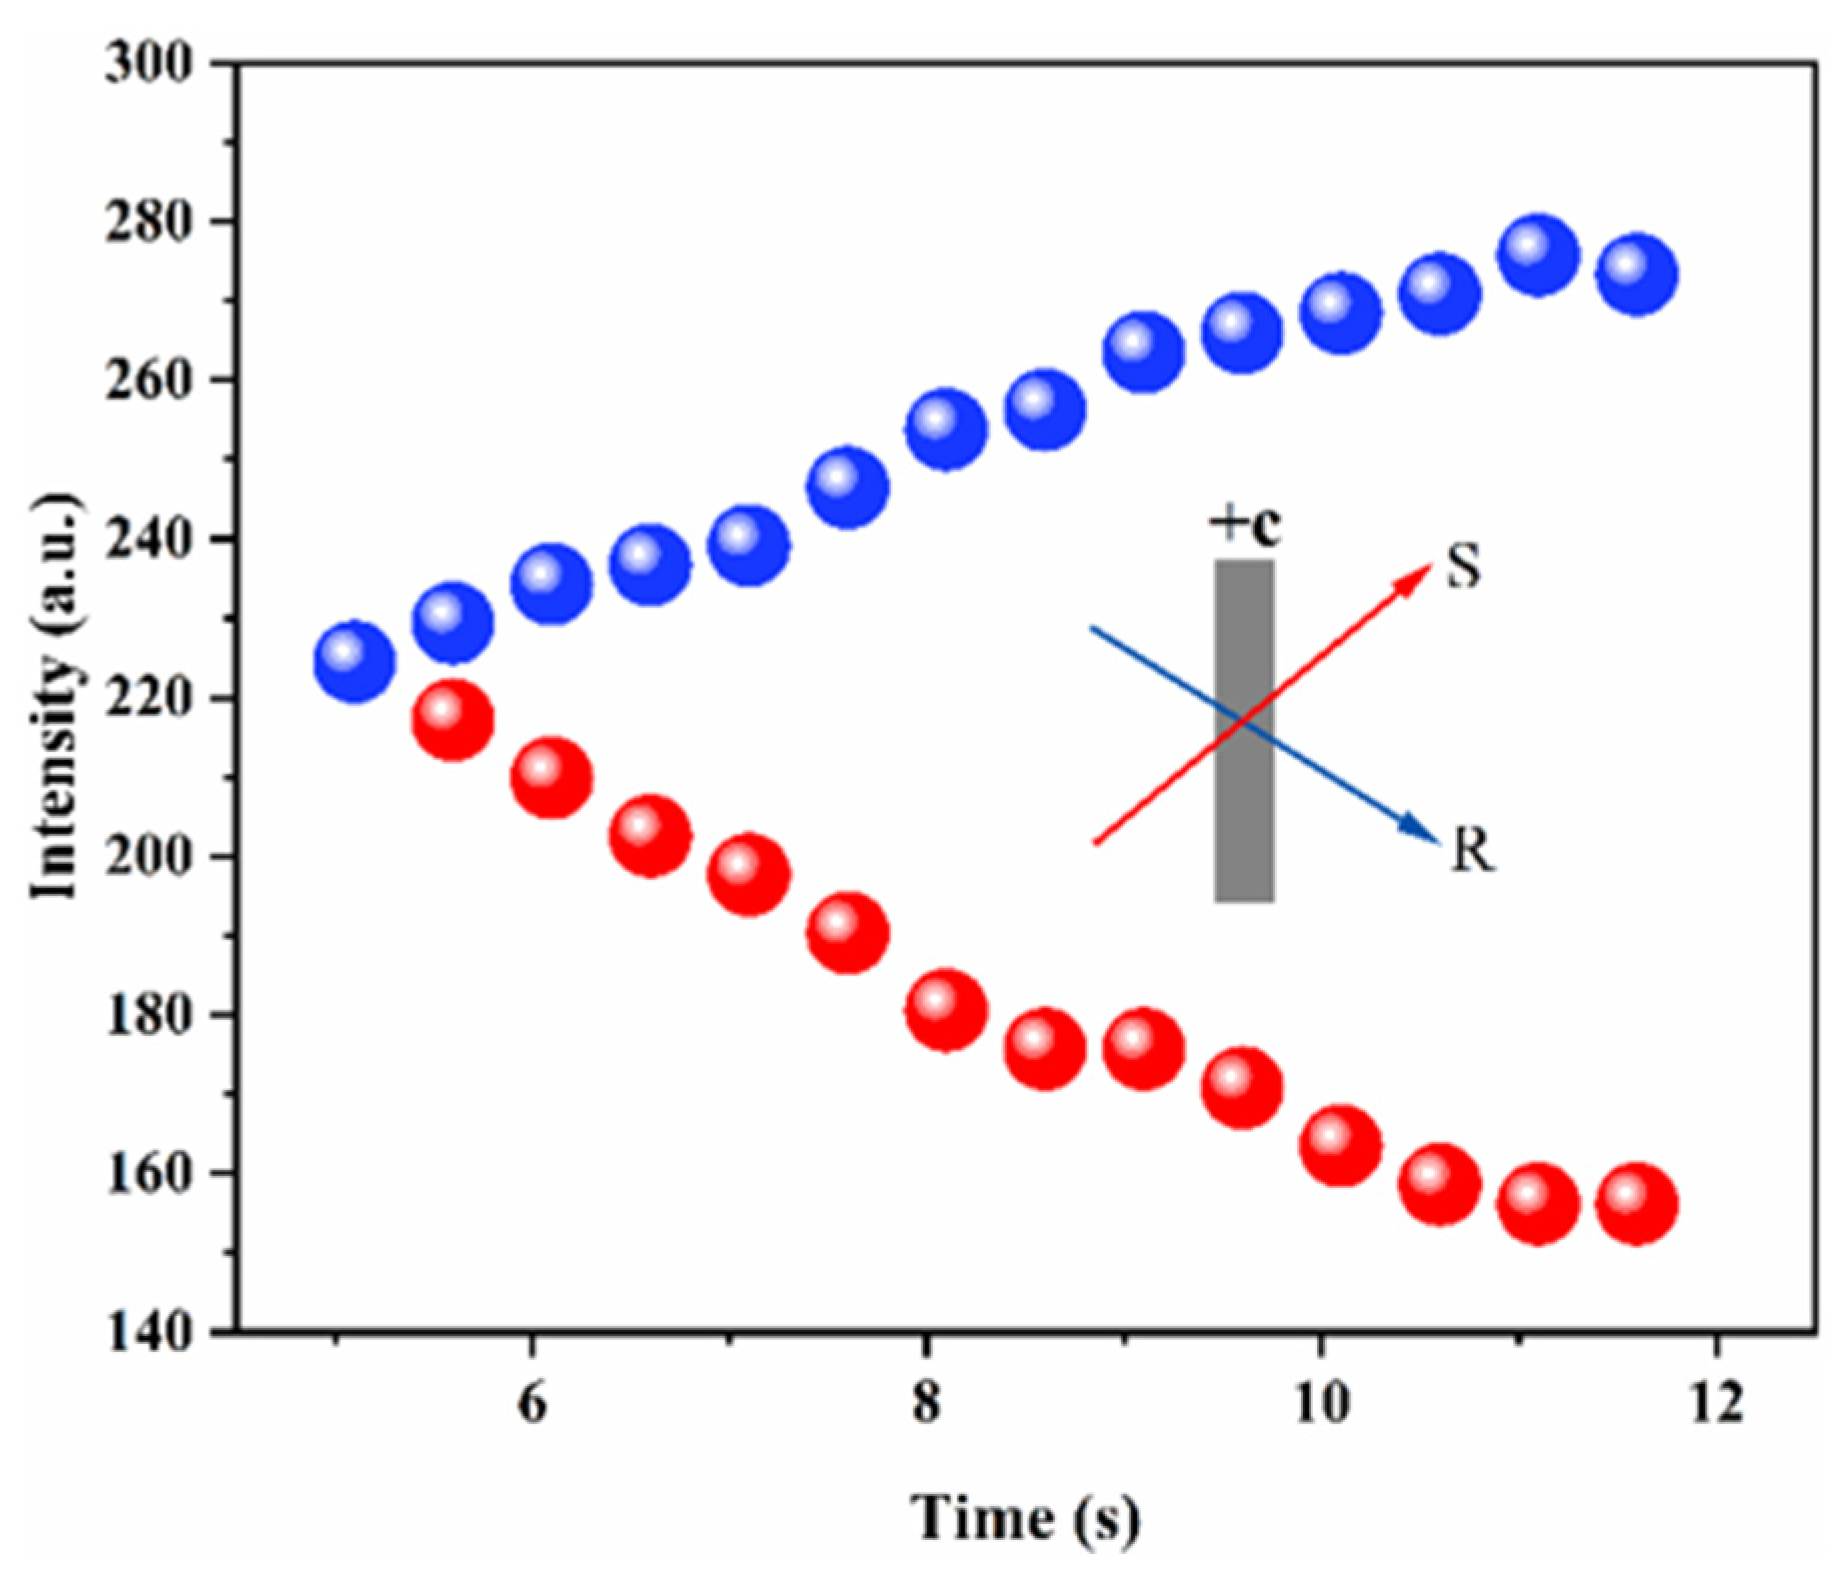
3.2. Photorefractive Properties

The PR properties of the LN: In2.0, U0.6 crystal were measured and the writing curves are shown in Figure 4. Multi-visible band holography was successfully achieved in LN: In2.0, U0.6 crystal. In a comparative analysis of PR properties, LN: In2.0, U0.6 was evaluated against CLN, LN: U0.6, and commercial holographic storage crystal LN: Fe0.3, as shown in Figure 5. The response times of LN: In2.0, U0.6 were 6.14 s, 5.53 s and 881.5 s at 488 nm, 532 nm and 671 nm, respectively. The crystal demonstrates a stable diffraction efficiency of over 44% at 488 nm, 532 nm and 671 nm, with a particularly notable performance at 671 nm. The diffraction efficiency of LN: In2.0, U0.6 is nearly 50 times higher than that of CLN, with a reduction of two orders of magnitude in response time at 488 nm and 532 nm, and an increase of two orders of magnitude in sensitivity. LN: In2.0, U0.6 exhibits a slightly lower diffraction efficiency at 488 nm compared to LN: U0.6. Although the saturation diffraction efficiency of LN: In2.0, U0.6 is slightly lower than LN: U0.6 at 488 nm, it is approximately double that of LN: U0.6 with response times in the same order of magnitude at 532 nm. However, at 671 nm, the saturation diffraction efficiency of LN: In2.0, U0.6 is about eight times higher than that of LN: U0.6, but the response time has significantly increased. In comparison, LN: In2.0, U0.6 demonstrates a diffraction efficiency comparable to LN: Fe0.3. Meanwhile, LN: In2.0, U0.6 exhibits a response speed that is approximately four times shorter than that of LN: Fe0.3. The LN: In2.0, U0.6 shows a distinct refractive index change of at 671 nm, while in other bands, it is similar to that of LN: Fe0.3. Based on the above analysis, although the In3+ ions did not comprehensively enhance the PR properties of LN: U, the diffraction efficiency of LN: In2.0, U0.6 is comparable to that of the commercial photorefractive crystal of LN: Fe0.3. Furthermore, it exhibits a response time one-fifth that of LN: Fe0.3 and a doubled sensitivity compared to LN: Fe0.3, which is beneficial to holographic applications.
The dual optical energy coupling method was engaged in the judgment of the dominant carrier type and the dominant carrier migration mechanism. Two beams of light at the wavelength of 488 nm and the intensity of 400 mW/cm2 were involved in this study. Figure 6 shows that the energy of dual optical coupling was transferred from the S light to R light, which meant that the energy coupling direction pointed to the −c direction of the crystal. These indicated that the dominant carrier type was electron and the dominant carrier migration mechanism was diffusion mechanism [24].

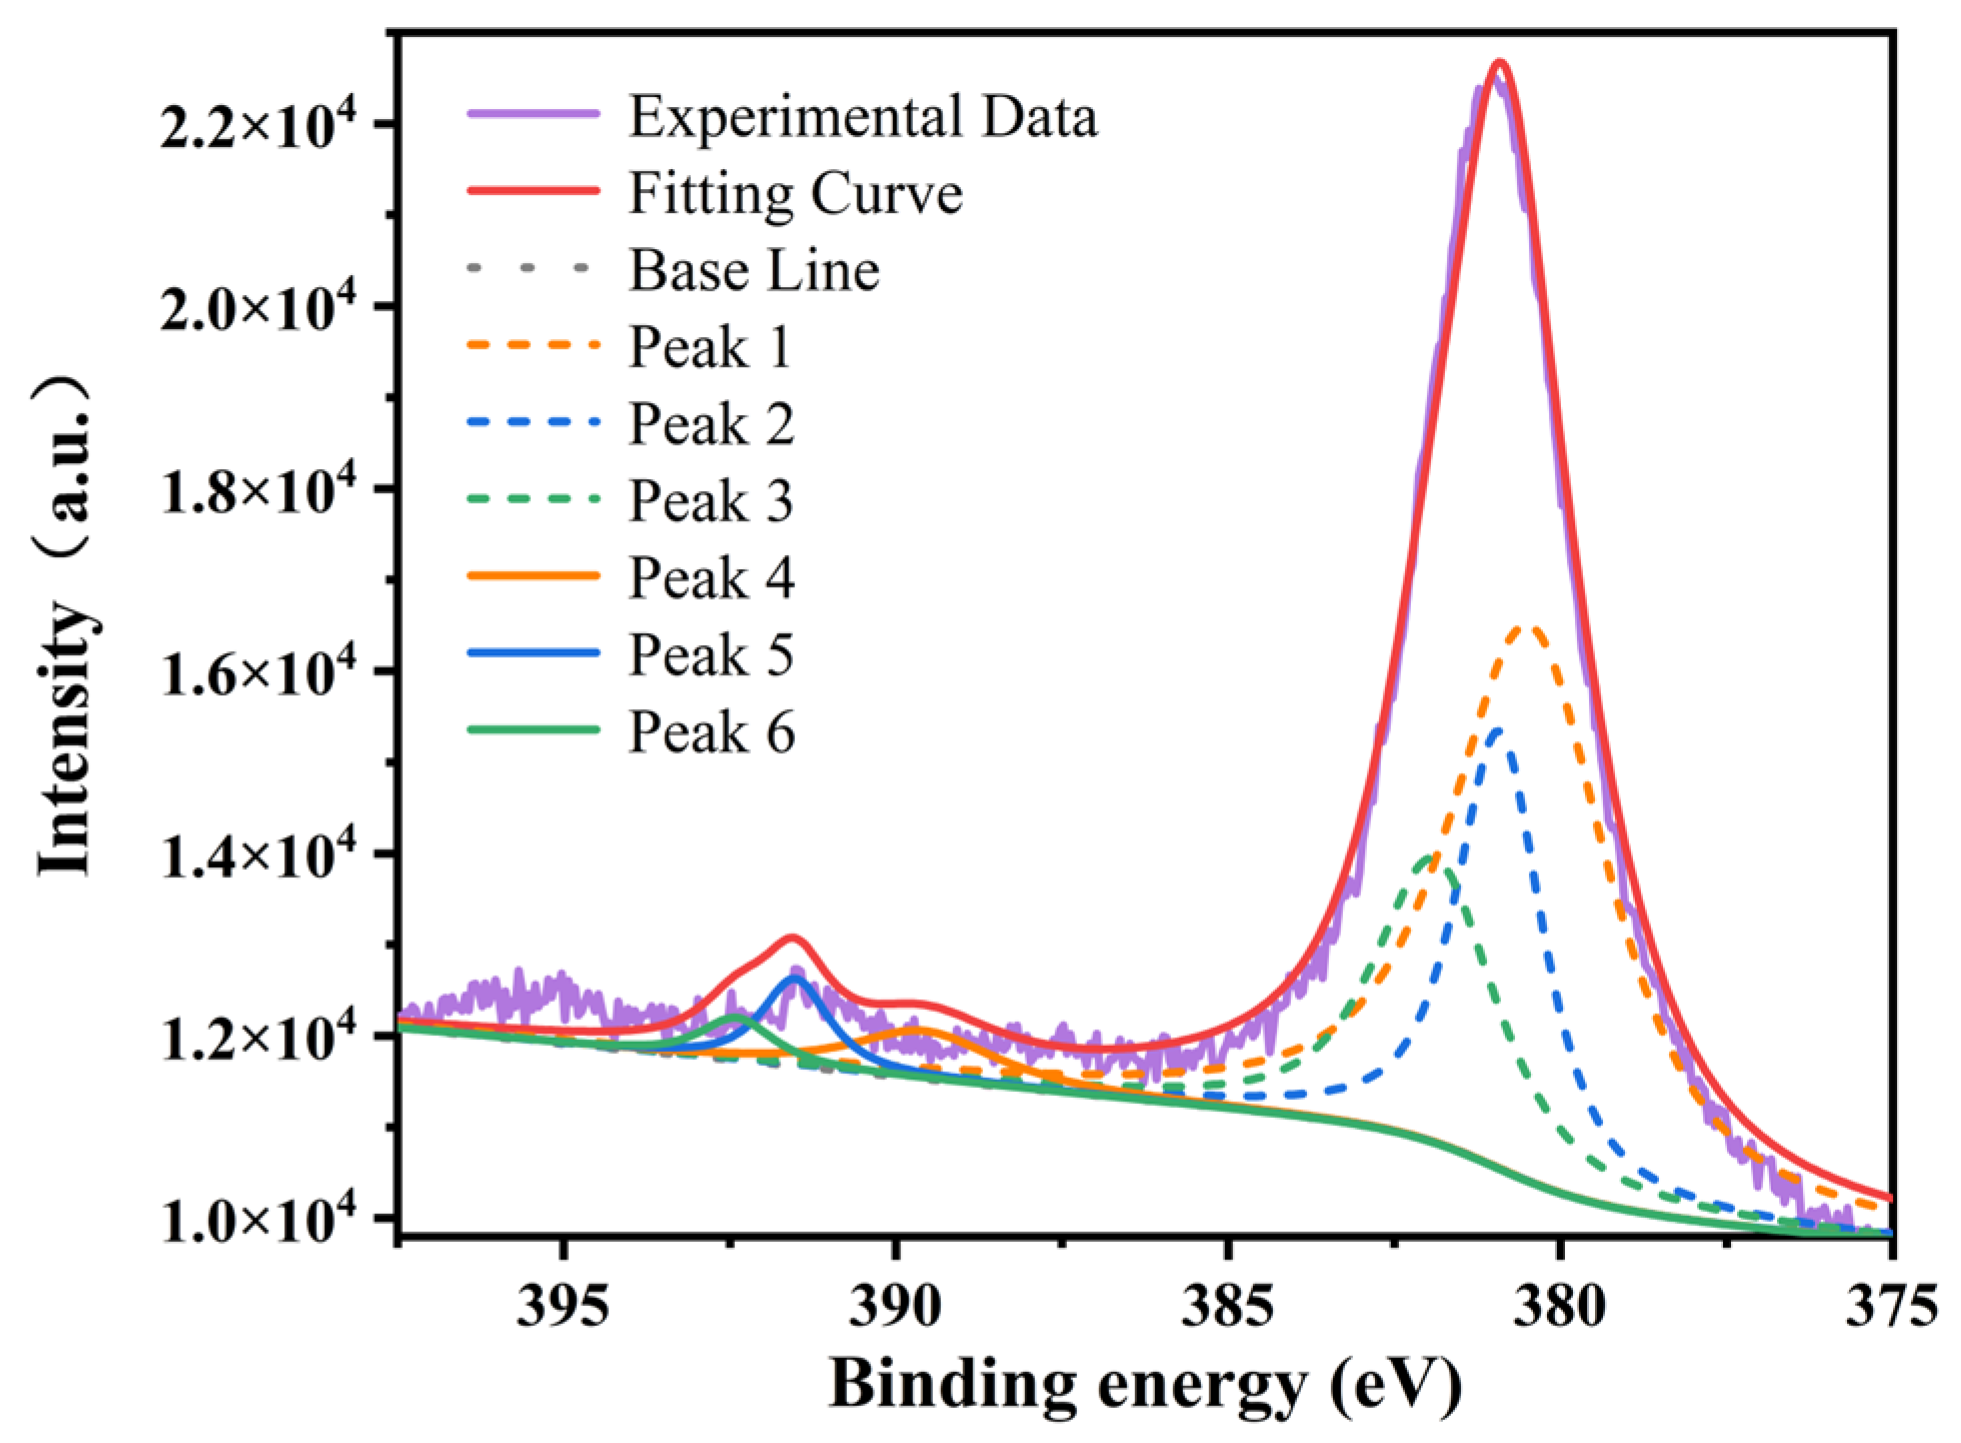
3.3. Valence States of Uranium Ions

X-ray photoelectron spectroscopy (XPS) was involved in determining the valence states of uranium ions in LN crystals. In the previous study, the strongest peaks of the U4f spectrum in U were about 380 eV and 392 eV, and that led to the orbital spin splitting and formed a doublet structure of U4f7/2 and U4f5/2 [25]. In this study, the XPS spectra of LN: In2.0, U0.6 crystal and the fitting peaks are shown in Figure 7. The binding energy of U4f7/2 and U4f5/2 was about 380.93 eV and 391.63 eV, which showed that the distance between these two peaks was about 10.7 eV. This result is consistent with the previous study [26,27]. The strength-binding energy curve was well fitted by six peaks to determine the valence states of uranium ions in these crystals. The XPS fitting parameters of LN: In2.0, U0.6 are shown in Table 4. According to the distance between the peaks of U4f7/2 and U4f5/2, these six peaks were divided into three groups. Group 1 consisted of Peak 1 (380.53 eV) and Peak 4 (389.63 eV), which matched with U4+ ions [25,28,29]. Group 2 consisted of Peak 2 (380.93 eV) and Peak 5 (391.53 eV), which matched with U5+ ions [25,28]. Group 3 consisted of Peak 3 (381.93 eV) and Peak 6 (392.43 eV), which matched with U6+ ions [28,30,31]. These changes in the valence states of uranium ions can be attributed to the oxidation of the UO2 by O2 in the high-temperature process of crystal growth [30,32,33]. In conclusion, the uranium ions showed the valance states as U4+, U5+ and U6+ in LN: In, U crystals, which were equal to the result of LN: U. It also meant that the introduction of the In3+ ions made no difference in the valence states of uranium ions in LN.

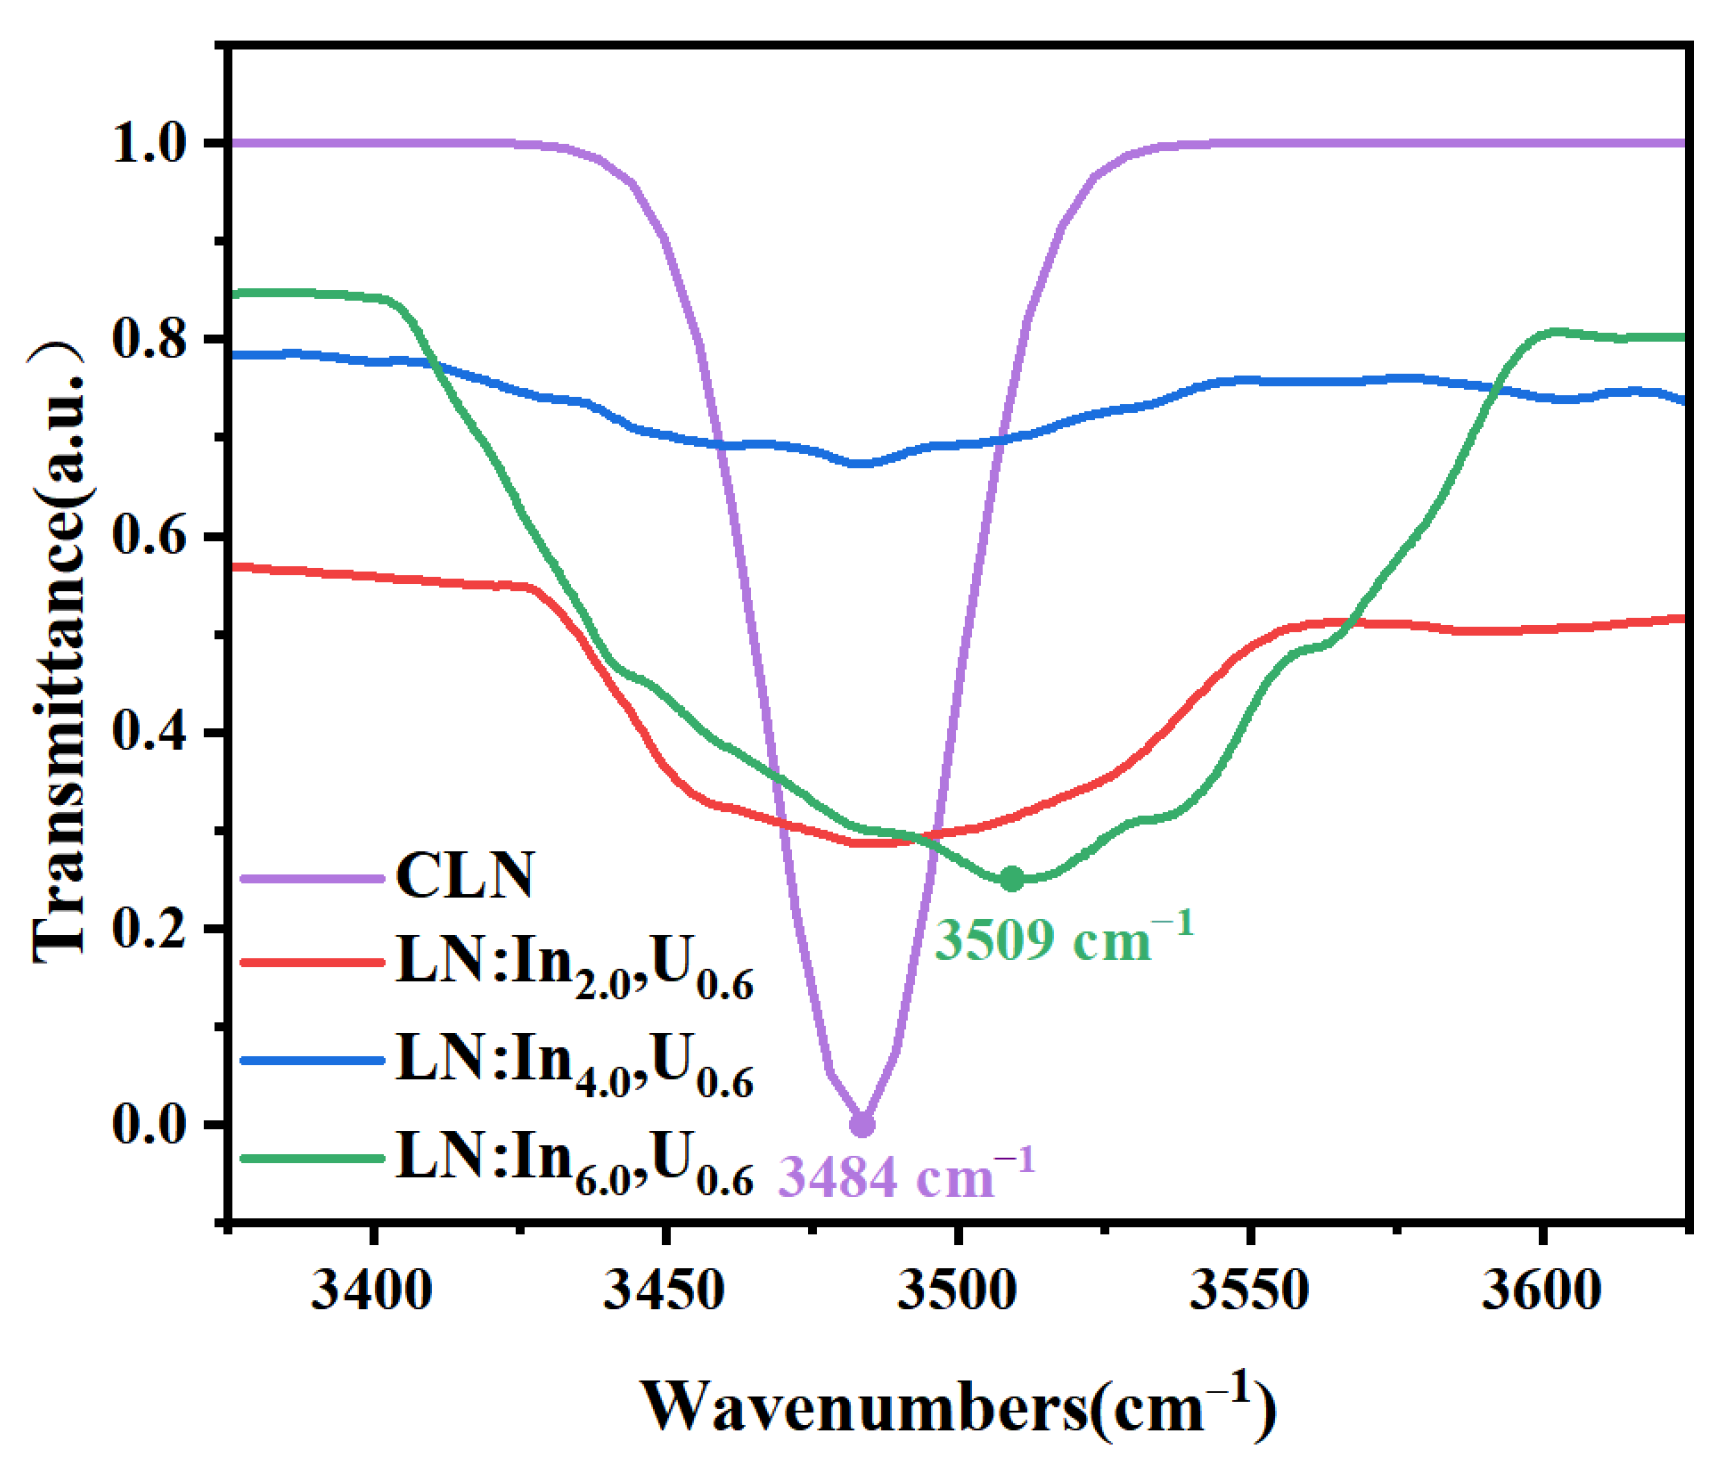
3.4. Real Threshold Concentration of Indium in LN: In, U

In LN crystals, protons are invariably present as OH groups and the OH absorption spectrum is regarded as a probe for the defect structure. The OH absorption spectrum analysis was involved in determining whether the In3+ concentration of three samples exceeded the threshold concentration. As shown in Figure 8, the OH absorption spectrum inferred that the peak positions of LN: In2.0, U0.6 and LN: In4.0, U0.6 were similar to that of CLN (3484 cm−1), while the peak position of LN: In6.0, U0.6 was moved to 3509 cm−1. The peak shift to 3509 cm−1 in the LN: In6.0, U0.6 crystal corresponds to the vibration of ( In Nb 2 –OH), which is due to In3+ occupying the normal Nb site after exceeding the doping threshold [34]. For CLN, it was reported that the removal of intrinsic defects Nb Li 4 + [8] requires 3 mol% In3+ [17]. However, even 4 mol% did not exceed the threshold concentration in our experiments. So, there may exist another threshold concentration of In3+ in LN: In, U; here, we define it as ‘the real threshold concentration’.
The real threshold concentration of In3+ in LN: In, U was estimated based on the Li-vacancy model. In estimating this value, all uranium ions are assumed to be U6+. The study about mono-doped LN: U showed that U6+ occupied the normal Nb site and drove the Nb5+ ions to the Li site, leading to the formation of more Nb Li 4 + , as shown in Equation (1). The concentration of uranium ions was 0.6 mol%; so, according to Equation (2), 2.4 mol% In3+ should be involved in eliminating Nb Li 4 + formed by the introduction of uranium ions. As discussed above, the real threshold concentration of In3+ ions in LN: In, U0.6 should be 5.4 mol%, which contains the In3+ concentration to remove the intrinsic defects Nb Li 4 + caused by the congruent composition and doping U6+ ions. This is consistent with the experimental result that only 6 mol% exceeded the threshold concentration.
6 LiNbO 3 + UO 3 = ( V Li ) ( U Nb + ) O 3 + 5 ( Nb Li 4 + ) 1 / 5 ( V Li ) 4 / 5 ( NbO 3 ) + 3 Li 2 O
2 LiNbO 3 + 2 In 2 O 3 + UO 3 = ( V Li ) ( U Nb + ) O 3 + 12 ( In Li 2 ) 1 / 3 ( V Li ) 2 / 3 ( NbO 3 ) + 6 Li 2 O

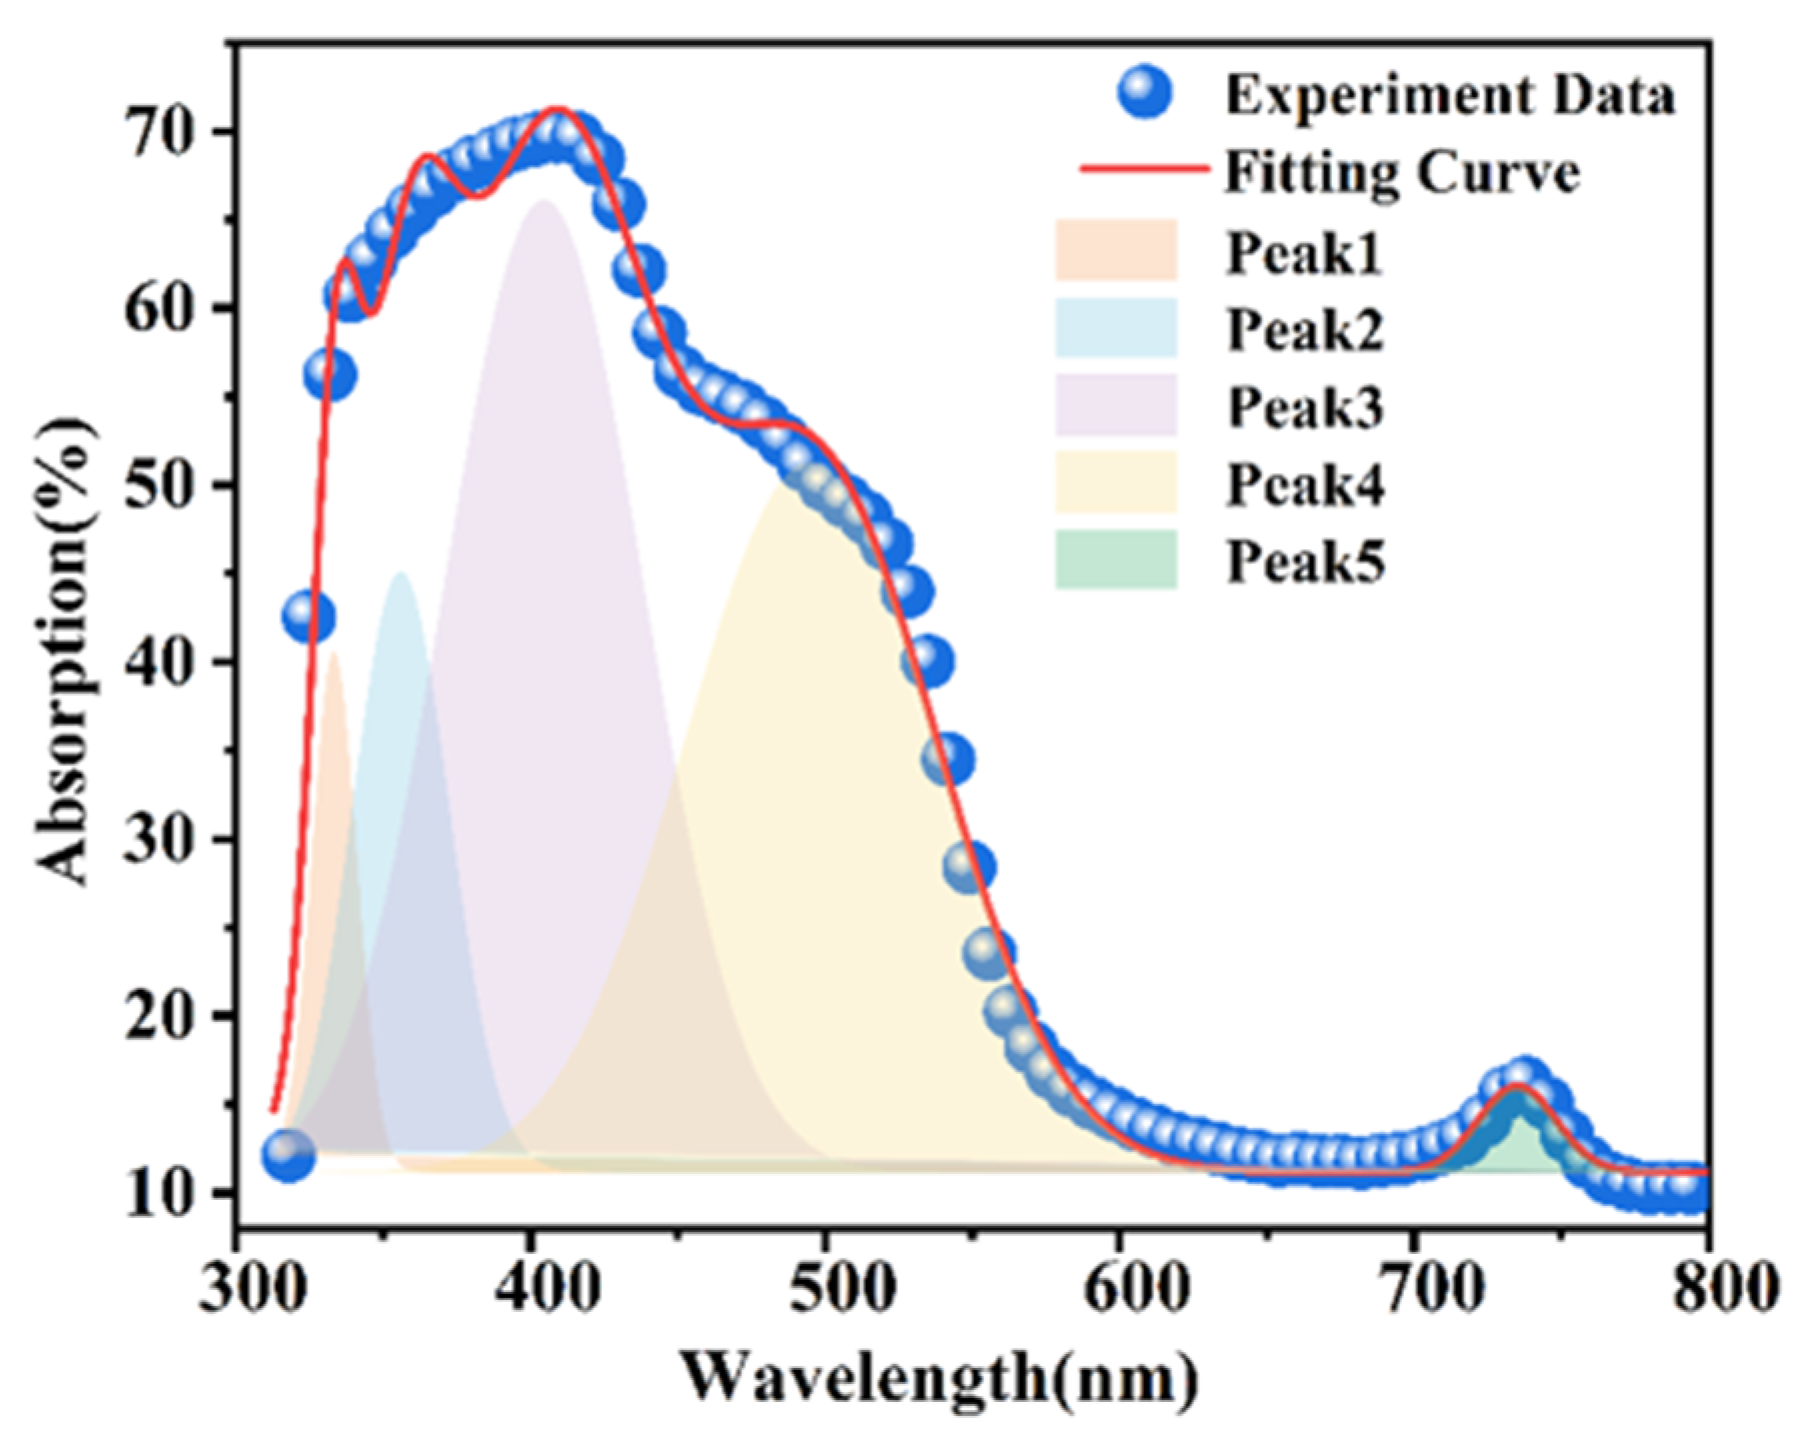
3.5. Absorption Difference Analysis

The curve of the absorption difference of LN: In2.0, U0.6 crystal relative to CLN is shown in Figure 9. The absorption difference spectrum explains the difference in response time. At 671 nm, the crystal exhibits lower absorbance, indicating less efficient exciton generation or defect excitation, which results in a significant difference in response time. Despite a slightly higher absorbance at 488 nm compared to 532 nm, the shorter wavelength may capture more defects, leading to a longer response time. It was well fitted by five peaks using the Gaussian function. The experimental curve is well fitted by five peaks centered around 333 nm, 356 nm, 405 nm, 495 nm and 735 nm. Peak 1 (333 nm) should be related to (O2−/− V Li ) because of its similar position with the absorption edge of CLN, which was proven in a previous study [25]. Small polarons (an electron trapped at Nb Li 4 + ) together with bipolarons (a pair of electrons trapped at adjacent Nb Li 4 + and Nb Nb 5 + ) play the role of photorefractive centers in CLN, with energy levels of 1.6 eV and 2.5 eV, corresponding to 780 nm and 490 nm wavelengths, respectively. Since the absorption peak of the small polaron could be observed only at 80 K, Peak 4 could be attributed to the bipolaron [35]. Because co-doped In3+ ions can remove a part of Nb Li 4 + , a lesser amount of bipolarons served as the PR center in LN: In2.0, U0.6. It also explains why the high saturation diffraction efficiency of LN: In2.0, U0.6 is lower than that of LN: U at 488 nm. Peak 5 can be related to U4+ because of the similar absorption peak position (760 nm) of U4+ in CaF2 [36]. Peak 2 and Peak 3 can be attributed to the new defects caused by U5+ and U6+. However, the underlying mechanism warrants further investigation [37].

4. Conclusions

A series of lithium niobate crystals co-doped with uranium and indium (LN: In2.0, U0.6, LN: In4.0, U0.6, LN: In6.0, U0.6) was successfully grown using the modified vertical Bridgman method. Experimental findings suggest that the LN: In2.0, U0.6 crystal exhibited a high crystallization quality, while the segregation coefficient of In and U ions gradually deviated further from 1 with increasing indium doping concentration. The element analysis indicates that the doping of In and U into the crystal lattice is successful. Structural refinement results suggest that high-valence state U ions tend to occupy normal Nb sites. The holographic writing was achieved in LN: In2.0, U0.6 at multi-visible bands. The response time was 6.14 s, 5.53 s and 881.5 s at 488 nm, 532 nm and 671 nm, and the diffraction efficiency was higher than 44%. The sensitivities of LN: In2.0, U0.6 at 488 nm, 532 nm and 671 nm were 1.61 cm/J, 1.13 cm/J and 0.17 cm/J, respectively. LN: In2.0, U0.6 possesses a comparable diffraction efficiency and a response time four times shorter than the commercial LN: Fe0.3 crystal. The carrier type in the LN: In2.0, U0.6 crystal was identified as the electron, and the predominant mechanism of carrier migration was diffusion. The result of XPS spectra showed that uranium ions presented three valences (+4, +5, +6). Additionally, 6 mol% exceeded the real threshold concentration of In3+ ions in the LN: In, U0.6, which is consistent with the calculated result based on the Li-vacancy model. The PR centers of LN: In, U were studied by analyzing the absorption difference related to CLN. LN: In, U demonstrates exceptional potential as a photorefractive medium across multiple visible bands, serving as a pivotal platform for photorefractive applications. Moreover, the insights garnered from this study not only advance our understanding of the optical properties of co-doped LN crystals, but also contribute to the broader field of photorefractive materials research. Furthermore, LN: In, U crystals have strong absorption in the ultraviolet band, which can be further studied in ultraviolet photorefraction.

Author Contributions

T.T.: Supervision, project administration, validation, methodology, review and editing, validation, investigation, writing—original draft preparation and funding acquisition; W.X., C.F. and Y.C. (Yuheng Chen): methodology, visualization, investigation, validation data curation and writing—original draft preparation; H.L., Y.C. (Yaoqing Chu) and H.S.: review and editing, methodology and supervision; J.X.: supervision, validation, methodology, review and editing, validation, investigation and writing—original draft preparation. All authors have read and agreed to the published version of the manuscript.

Funding

This work was supported by the National Natural Science Foundation of China (52372013) and the Natural Science Foundation of Shanghai (22ZR1460600).

Data Availability Statement

Due to privacy reasons, dataset available on request from the authors.

Conflicts of Interest

The authors declare no conflicts of interest.

References

  1. Kong, Y.; Bo, F.; Wang, W.; Zheng, D.; Liu, H.; Zhang, G.; Rupp, R.; Xu, J. Recent Progress in Lithium Niobate: Optical Damage, Defect Simulation, and On-Chip Devices. Adv. Mater. 2019, 32, 1806452. [Google Scholar] [CrossRef] [PubMed]
  2. Broderick, N.G.R.; Bratfalean, R.T.; Monro, T.M.; Richardson, D.J. Temperature and wavelength tuning of second-, third-, and fourth-harmonic generation in a two-dimensional hexagonally poled nonlinear crystal. J. Opt. Soc. Am. B 2002, 19, 2263–2272. [Google Scholar] [CrossRef]
  3. Wang, F.; Sun, D.; Liu, Q.; Song, Y.; Zhang, F.; Zhou, W.; Sang, Y.; Wang, D.; Liu, H. Growth of Large Size Near-Stoichiometric Lithium Niobate Single Crystals with Low Coercive Field for Manufacturing High Quality Periodically Poled Lithium Niobate. Opt. Mater. 2022, 125, 112058. [Google Scholar] [CrossRef]
  4. Bazzan, M.; Sada, C. Optical Waveguides in Lithium Niobate: Recent Developments and Applications. Appl. Phys. Rev. 2015, 2, 040603. [Google Scholar] [CrossRef]
  5. Feng, H.; Ge, T.; Guo, X.; Wang, B.; Zhang, Y.; Chen, Z.; Zhu, S.; Zhang, K.; Sun, W.; Huang, C.; et al. Integrated Lithium Niobate Microwave Photonic Processing Engine. Nature 2024, 627, 80–87. [Google Scholar] [CrossRef] [PubMed]
  6. Boes, A.; Chang, L.; Langrock, C.; Yu, M.; Zhang, M.; Lin, Q.; Lončar, M.; Fejer, M.; Bowers, J.; Mitchell, A. Lithium Niobate Photonics: Unlocking the Electromagnetic Spectrum. Science 2023, 379, eabj4396. [Google Scholar] [CrossRef] [PubMed]
  7. Leah, B. Now Entering, Lithium Niobate Valley. Available online: https://otd.harvard.edu/news/now-entering-lithium-niobate-valley (accessed on 22 February 2024).
  8. Tian, T.; Chen, Y.; Zhang, J.; Wang, S.; Yuan, W.; Liu, H.; Chu, Y.; Mao, C.; Xu, W.; Zheng, D. Photorefraction of uranium-doped lithium niobate crystals at multiple visible wavelengths. CrystEngComm 2023, 25, 1207. [Google Scholar] [CrossRef]
  9. Wang, S.; Shan, Y.; Zheng, D.; Liu, S.; Bo, F.; Liu, H.; Kong, Y.; Xu, J. The real-time dynamic holographic display of LN:Bi,Mg crystals and defect-related electron mobility. Opto-Electron. Adv. 2022, 5, 210135. [Google Scholar] [CrossRef]
  10. Kling, A.; Marques, J.G. Unveiling the Defect Structure of Lithium Niobate with Nuclear Methods. Crystals 2021, 11, 501. [Google Scholar] [CrossRef]
  11. Chen, K.; Li, Y.; Peng, C.; Lu, Z.; Luo, X.; Xue, D. Microstructure and Defect Characteristics of Lithium Niobate with Different Li Concentrations. Inorg. Chem. Front. 2021, 8, 4006–4013. [Google Scholar] [CrossRef]
  12. Phillips, W.; Amodei, J.J.; Staebler, D.L. Optical and holographic storage properties of transition metal doped lithium niobate. RCA Rev. 1972, 33, 94–109. [Google Scholar]
  13. Mcmillen, D.; Hudson, T.; Wagner, J.; Singleton, J. Holographic recording in specially doped lithium niobate crystals. Opt. Express 1998, 2, 491–502. [Google Scholar] [CrossRef] [PubMed]
  14. Dong, Y.; Liu, S.; Kong, Y.; Chen, S.; Rupp, R.; Xu, J. Fast photorefractive response of vanadium-doped lithium niobate in the visible region. Opt. Lett. 2012, 37, 1841–1843. [Google Scholar] [CrossRef] [PubMed]
  15. Tian, T.; Kong, Y.; Liu, S.; Li, W.; Wu, L.; Chen, S.; Xu, J. Photorefraction of molybdenum-doped lithium niobate crystals. Opt. Lett. 2012, 37, 2679–2681. [Google Scholar] [CrossRef] [PubMed]
  16. Tian, T.; Yuan, W.; Liu, W.; Shen, H.; Zhang, Y.; Chu, Y.; Ma, Y.; Xu, J. Crystal Growth and Spectroscopic Properties of Uranium Dioxide Doped LiNbO3 with Multiband Absorption. J. Cryst. Growth 2021, 565, 126132. [Google Scholar] [CrossRef]
  17. Kong, Y.; Wen, J.; Wang, H. New doped lithium niobate crystal with high resistance to photorefraction-LiNbO3: In. Appl. Phys. Lett. 1995, 66, 280–281. [Google Scholar] [CrossRef]
  18. Zhang, T.; Geng, T.; Sun, W. Effect of In ions on photorefractive properties in Fe: In: LiNbO3 crystals. Proc. SPIE 2007, 6595, 65950P-2. [Google Scholar]
  19. Zhu, L.; Zheng, D.; Liu, H.; Saeed, S.; Wang, S.; Liu, S.; Chen, S.; Kong, Y.; Xu, J. Enhanced photorefractive properties of indium co-doped LiNbO3: Mo crystals. AIP Adv. 2018, 8, 095316. [Google Scholar] [CrossRef]
  20. Tian, T.; Yan, X.; Kong, Y.; Liu, H.; Zheng, D.; Liu, S.; Chen, S.; Xu, J.; Xu, J. Improvement in the Photorefractive Response Speed and Mechanism of Pure Congruent Lithium Niobate Crystals by Increasing the Polarization Current. Crystals 2017, 7, 368. [Google Scholar] [CrossRef]
  21. Kim, Y.; Kim, Y.M.; Shin, J.; Char, K. LaInO3/BaSnO3 Polar Interface on MgO Substrates. APL Mater. 2018, 6, 096104. [Google Scholar] [CrossRef]
  22. Lebib, A.; Ben Amara, E.; Beji, L. Structural and Luminescent Characteristics of Porous GaAs. J. Lumin. 2017, 188, 337–341. [Google Scholar] [CrossRef]
  23. Tian, T.; Wang, Z.; Mao, C.; Chen, M.; Chu, Y.; Li, Y. Structure, Luminescence Properties and Anti-Thermal Quenching of a Novel Eu3+-Activated Red Phosphor Based on the Negative Thermal Expansion Material In0.5Sc1.5(MoO4)3. J. Alloys Compd. 2024, 973, 172887. [Google Scholar]
  24. Zheng, D.; Wang, W.; Wang, S.; Qu, D.; Liu, H.; Kong, Y.; Liu, S.; Chen, S.; Rupp, R.; Xu, J. Real-Time Dynamic Holographic Display Realized by Bismuth and Magnesium Co-Doped Lithium Niobate. Appl. Phys. Lett. 2019, 114, 241903. [Google Scholar] [CrossRef]
  25. Kushwaha, S.; Sreedhar, B.; Padmaja, P. XPS, EXAFS, and FTIR as tools to probe the unexpected adsorption-coupled reduction of U(VI) to U(V) and U(IV) on borassus flabellifer-based adsorbents. ACS J. Surf. Colloids 2012, 28, 16038–16048. [Google Scholar] [CrossRef]
  26. Fu, X.; Zhong, Y.; Wang, X.; Liu, K.; Zhao, Z.; Liu, C. Investigation of surface oxidation of uranium monocarbide by in situ XPS technique. Acta. Chim. Sinica 2005, 3, 648–652. [Google Scholar]
  27. Allen, G.C.; Tucker, P.M.; Tyler, J.W. The behaviour of uranium oxides in low partial pressures of O2 studied using X-ray photoelectron spectroscopy. Vacuum 1982, 32, 481–486. [Google Scholar] [CrossRef]
  28. Bagus, P.S.; Nelin, C.J.; Ilton, E.S. Theoretical modeling of the uranium 4f XPS for U (VI) and U(IV) oxides. J. Chem. Phys. 2013, 139, 1549. [Google Scholar]
  29. Liu, K.; Luo, L.; Luo, L.; Long, Z.; Hong, Z.; Yang, H.; Wu, S. Initial oxidation behaviors of nitride surfaces of uranium by XPS analysis. Appl. Surf. Sci. 2013, 280, 268–272. [Google Scholar] [CrossRef]
  30. Donald, S.B.; Davisson, M.L.; Dai, Z.R.; Roberts, S.K.; Nelson, A.J. Relative impact of H2O and O2 in the oxidation of UO2 powders from 50 to 300 °C. J. Nucl. Mater. 2017, 496, 353–361. [Google Scholar] [CrossRef]
  31. Mårtensson, N.; Malmquist, P.Å.; Svensson, S.; Johansson, B. The electron spectrum of UF6 recorded in the gas phase. J. Chem. Phys. 1984, 80, 5458. [Google Scholar] [CrossRef]
  32. McEachern, R.J.; Taylor, P. A review of the oxidation of uranium dioxide at temperatures below 400 °C. J. Nucl. Mater. 1998, 254, 87–121. [Google Scholar]
  33. Skomurski, F.N.; Shuller, L.C.; Ewing, R.C.; Becker, U. Corrosion of UO2 and ThO2: A quantum-mechanical investigation. J. Nucl. Mater. 2008, 375, 290–310. [Google Scholar] [CrossRef]
  34. Kong, Y.; Deng, J.; Zhang, W.; Wen, J.; Zhang, G.; Wang, H. OH Absorption Spectra in Doped Lithium Niobate Crystals. Phys. Lett. A 1994, 196, 128–132. [Google Scholar] [CrossRef]
  35. Smyth, D.M. Defects and transport in LiNbO3. Ferroelectrics 1983, 50, 93–102. [Google Scholar] [CrossRef]
  36. Hargreaves, W.A. High-Resolution measurements of absorption, fluorescence, and crystal-field splittings of solutions of divalent, trivalent, and tetravalent Uranium ions in fluoride crystals. Phys. Rev. 1967, 156, 331–342. [Google Scholar]
  37. Ashkin, A.; Boyd, G.D.; Dziedzic, J.M.; Smith, R.G.; Ballman, A.A.; Levinstein, J.J.; Nassau, K. Optical-induced refractive index inhomogeneities in LiNbO3 and LiTaO3. Appl. Phys. Lett. 1966, 9, 72–74. [Google Scholar] [CrossRef]
Figure 1. The energy dispersive spectra of LN: In2.0, U0.6 crystal powder.
Crystals 14 00380 g001
Figure 2. (a) LN: In, U crystal grown by Bridgman method. (b) The rocking curves of LN: In2.0, U0.6 and (c) LN: In6.0, U0.6. (d) Transmittance spectra of LN: In, U, LN: U0.6 and CLN crystals.
Crystals 14 00380 g002
Figure 3. Rietveld refinement map of LN: In2.0, U0.6 crystal.
Crystals 14 00380 g003
Figure 4. The writing curves of LN: In2.0, U0.6 crystal at different wavelengths; (ac) are 488 nm, 532 nm and 671 nm, respectively.
Crystals 14 00380 g004
Figure 5. The photorefractive parameters of CLN, LN: U0.6, LN: In2.0, U0.6 and LN: Fe0.3. (a) Saturated diffraction efficiency. (b) Response time. (c) Refractive index change. (d) Sensitivity.
Crystals 14 00380 g005
Figure 6. Dual optical energy coupling curve of LN: In2.0, U0.6 crystal.
Crystals 14 00380 g006
Figure 7. XPS spectra of LN: In2.0, U0.6 crystal and the fitting peaks.
Crystals 14 00380 g007
Figure 8. OH absorption spectrum of CLN and LN: In, U crystals.
Crystals 14 00380 g008
Figure 9. Absorption difference of LN: In2.0, U0.6 crystal relative to CLN.
Crystals 14 00380 g009
Table 1. The concentration and segregation coefficient of doping ion.
SampleLN: In2.0, U0.6LN: In4.0, U0.6LN: In6.0, U0.6
IonInUInUInU
Effective segregation coefficient (keff)1.000.980.930.890.840.84
Table 2. Rietveld refinement data of LN: In2.0, U0.6.
FormulaLN: In2.0, U0.6
Space groupR3c
a (Å)5.15847 (8)
b (Å)5.15852 (2)
c (Å)13.87605 (12)
A (°)90
β (°)90
γ (°)120
V3)319.7733 (16)
Rp (%)4.699%
Rwp (%)6.354%
Gof1.973
Table 3. Fractional atomic coordinates and equivalent isotropic displacement parameters in LN: In2.0, U0.6.
LN: In2.0, U0.6SitexYzUeqOccupancy
Li1Li0.000000.000000.279010.029120.968
InLi0.000000.000000.279010.029120.021
Nb1Nb0.000000.000000.000000.007990.983
Nb2Li0.000000.000000.279010.029120.011
OO0.320900.041510.895440.014051.000
UNb0.000000.000000.000000.007990.006
Table 4. The XPS fitting parameters of LN: In2.0, U0.6.
Fitting ParametersU4f7/2U4f5/2
Binding Energy (eV)FWHMBinding Energy (eV)FWHM
U4+380.532.9389.636.4
U5+380.931.5391.531.3
U6+381.932.1392.431.2
Disclaimer/Publisher’s Note: The statements, opinions and data contained in all publications are solely those of the individual author(s) and contributor(s) and not of MDPI and/or the editor(s). MDPI and/or the editor(s) disclaim responsibility for any injury to people or property resulting from any ideas, methods, instructions or products referred to in the content.

