Article

Combustion-Induced Endothermic Process in Carbon Dots Synthesized on Magnetite Nanoparticle Substrate

by
Khalid Zouhri
1,*,
Luke J. Snyder
1,
Michael McFarland
2,
Parker O. Laubie
1,
K. A. Shiral Fernando
3 and
Christopher E. Bunker
1,4,*
1
Department of Engineering Management, Systems & Technology, University of Dayton, 300 College Park, Kettering Lab 241M, Dayton, OH 45469, USA
2
Civil and Environmental Engineering Department, Utah State University, 4110 Old Main Hill, Logan, UT 84322, USA
3
Structural Materials Division, University of Dayton Research Institute, 1700 South Patterson Blvd, Dayton, OH 45469, USA
4
Air Force Research Laboratory, Aerospace Systems Directorate, 1790 Loop Road N., Bldg. 490, Wright-Patterson AFB, OH 45433, USA
*
Authors to whom correspondence should be addressed.
Crystals 2024, 14(6), 520; https://doi.org/10.3390/cryst14060520
Submission received: 10 May 2024 / Revised: 27 May 2024 / Accepted: 28 May 2024 / Published: 30 May 2024
(This article belongs to the Special Issue Synthesis and Application of Nanocomposite Materials)

Abstract

:
Carbon dots are synthesized alone and in the presence of commercial magnetite nanoparticles using a simple hydrothermal reaction. The spectroscopic and structural characteristics of CDot and CDot–magnetite materials are presented and their behaviors under combustion conditions are studied. A careful examination of their combustion behaviors reveals interesting results for the CDot–magnetite material: it undergoes early catalytic combustion at ~200 °C and a strong endothermic process that quenches combustion. By investigating the physical mixtures of pre-formed CDots and magnetite and the starting material ascorbic acid and magnetite, it is determined that the strong endothermic behavior requires intimate interactions between the carbon source and the magnetite, highlighting the importance of the nano-interface of the CDots being synthesized onto the magnetite substrate. The results are discussed in the context of the fuels used for low-temper combustion, materials with stored endothermic potential, and the use of combustion-quenching materials for fire control.

1. Introduction

Carbon dots (CDots) are carbon-based nanomaterials that have been of significant scientific interest over the past decade. Much of the interest stems from the advantageous properties of the CDot systems: low cost, low toxicity, robust photophysical and catalytic characteristics, great versatility in chemical functionalization, excellent biocompatibility, and potential for multifunctional behaviors [1,2,3,4,5,6,7,8,9,10,11,12,13]. A more recent effort to explore the multifunctional potential of CDot materials has seen CDots being utilized as building blocks for the assembly of more complex nanoparticle systems [13]. A great example of multifunctionalism is the development of magnetic CDots for dual-mode imaging (fluorescence and magnetic resonance), drug delivery and tumor suppression, and in separation and purification science [8,14,15]. Of particular interest are CDots with magnetite due to their low cost and low toxicity and the biodegradable nature of the magnetite particles [16]. Hu et al. prepared carbon–iron oxide hybrid dots via a microwave-induced solid thermal reaction and demonstrated that the photophysical properties of the CDots were not impacted by the presence of, or their interaction with, the iron oxide [17]. Stachowska et al. prepared a series of C/Fe-NPs by reacting iron acetylacetonate with a pre-formed carbon nanoparticle precursor with polyethylene glycol as capping agent to produce C/Fe-NPs of varying compositions [18]. The particles were studied to determine the effect of composition on their optical and magnetic properties. Xie et al. prepared Fe3O4/CD samples from melamine, ammonium ferric citrate, and diethylenetriamine using the hydrothermal method; the particles’ dual ability to detect Hg2+ through binding and fluorescence quenching was explored, followed by their removal with magnetic filtering [19]. As an example of the great interest in their biomedical application, and their use in bioimaging in particular, a number of researchers have developed syntheses for iron oxide–carbon dot materials and explored the properties that could be used in bioimaging applications [20,21,22,23,24].
While examples of these types of multi-functional CDot compounds are numerous, and applications for them are continuously being developed, much is still unknown about the CDot materials. We know little of how they are formed, what their overall structure is like, and how their structure relates to their observed properties. Detailed investigations of simple CDot systems still have great value in working toward a more universal understanding of the structure–property relationships. Here, we prepare and characterize CDot and CDot–magnetite samples, examining the differences in the CDot properties caused by the inclusion of magnetite nanoparticles in the synthesis process using thermal analysis tools and differential scanning calorimetry with a simultaneous thermal gravity analysis (DSC/TGA). Our motivation for this study is to probe the nano-interface to obtain a greater understanding of nanoparticles and their properties, and to exploit the potential applications of the nano-interface-induced properties. To demonstrate the importance of the nano-interface between the CDots and the magnetite nanoparticles, samples are prepared by mixing synthesized CDots with magnetite and by synthesizing the CDots onto the magnetite. The extent of the interfacial interaction between the CDots and the magnetite nanoparticles is shown to be critical in determining the combustion outcome, and by maximizing the interfacial interactions through the direct synthesis of the CDots onto the magnetite nanoparticles, we can achieve unique results. These results include catalyzed combustion, a combustion-induced strong endothermic process, and potential combustion-quenching. The results suggest three potential applications; as fuel for low-temperature combustion with an improved environmental impact, as a stored endothermic potential for cooling applications, and as potential additives for fire mitigation in combustible materials.

2. Materials and Methods

2.1. Materials

Ascorbic acid and iron (II, III) oxide (Fe3O4) NPS (magnetite) were purchased from Sigma-Aldrich and used as received. Dialysis membrane tubing (cutoff molecular weight 500) was supplied by Spectrum Laboratories. Water was locally obtained as distilled and used as received. Naked carbon dots, previously prepared in-house, were utilized as a quantum yield reference compound [25].

2.2. Methods

Absorption spectra were obtained using a Genesys 50 UV–Vis spectrophotometer (Thermo Scientific, Waltham, MA, USA). Fluorescence spectra were measured on a Fluorolog-3 (Spex, Metuchen, NJ, USA) equipped with a 450 W xenon lamp. All spectra were corrected for the non-linear response of the fluorescence system using pre-determined calibration files. FTIR spectra were recorded using a Spectrum 3 FT-IR (Perkin Elmer, Waltham, MA, USA) instrument equipped with an attenuated total reflectance (ATR) solid sample attachment. Powder X-ray spectra were collected with a MiniFlex (Rigaku, The Woodlands, TX, USA) equipped with a 600 W X-ray source and D/teX Ultra silicon strip detector. AFM images were obtained using a CoreAFM (NanoSurf, Woburn, MA, USA) instrument, operated in tapping mode, with blank Si wafers as sample supports. Image processing was performed with the Gwyddion (ver. 2.59) software package, where the processing steps were as follows: (1) level data through mean plane subtraction, (2) level data so that the facets point upward, and (3) align rows using the median, match, or polynomial method. Simultaneous DSC/TGA data were collected using a Q600 (Thermo Fisher, Waltham, MA, USA) instrument. Samples were analyzed in air using an open alumina pan referenced against a separate, empty alumina pan, and heated at a rate of 10 °C/min. Calculations were performed with the TA universal analysis software package provided with the Q600 instrument. Marked data supporting the DSC/TGA calculations are provided in the Supporting Information.

2.3. Preparation

CDots were prepared by dissolving 1.5 g of ascorbic acid into 7 mL water. The solution was then transferred to a 25 mL Teflon-lined stainless-steel reactor and heated to 180 °C for 16 h. After completion of the reaction, the stainless-steel reactor was allowed to cool to room temperature. To recover and clean the CDots, the reaction mixture from the reactor was placed into two 50 mL centrifuge tubes and centrifuged at 1000 rpms for 10 min. After the centrifugation cycle, the supernatant was discarded, distilled water was added to the centrifuge tubes, and centrifugation was repeated. The whole process was repeated 2–3 times to remove unreacted ascorbic acid. Following this process, the sample was either dried under mild heat and nitrogen gas flow or transferred to a dialysis tube and dialyzed for 3 h in distilled water to remove any remaining impurities. The sample in the dialysis tube was transferred into a 50 mL glass vial and dried under mild heat and nitrogen gas flow. The CDot–magnetite sample was prepared following the same procedure, except that 0.25 g (6:1 w/w) iron oxide nano-powder was added to the ascorbic acid (1.5 g) and water (7 mL) prior to hydrothermal reaction for 16 h. The cleaning procedures and the recovery procedure were identical to the synthesis of CDots.

3. Results and Discussion

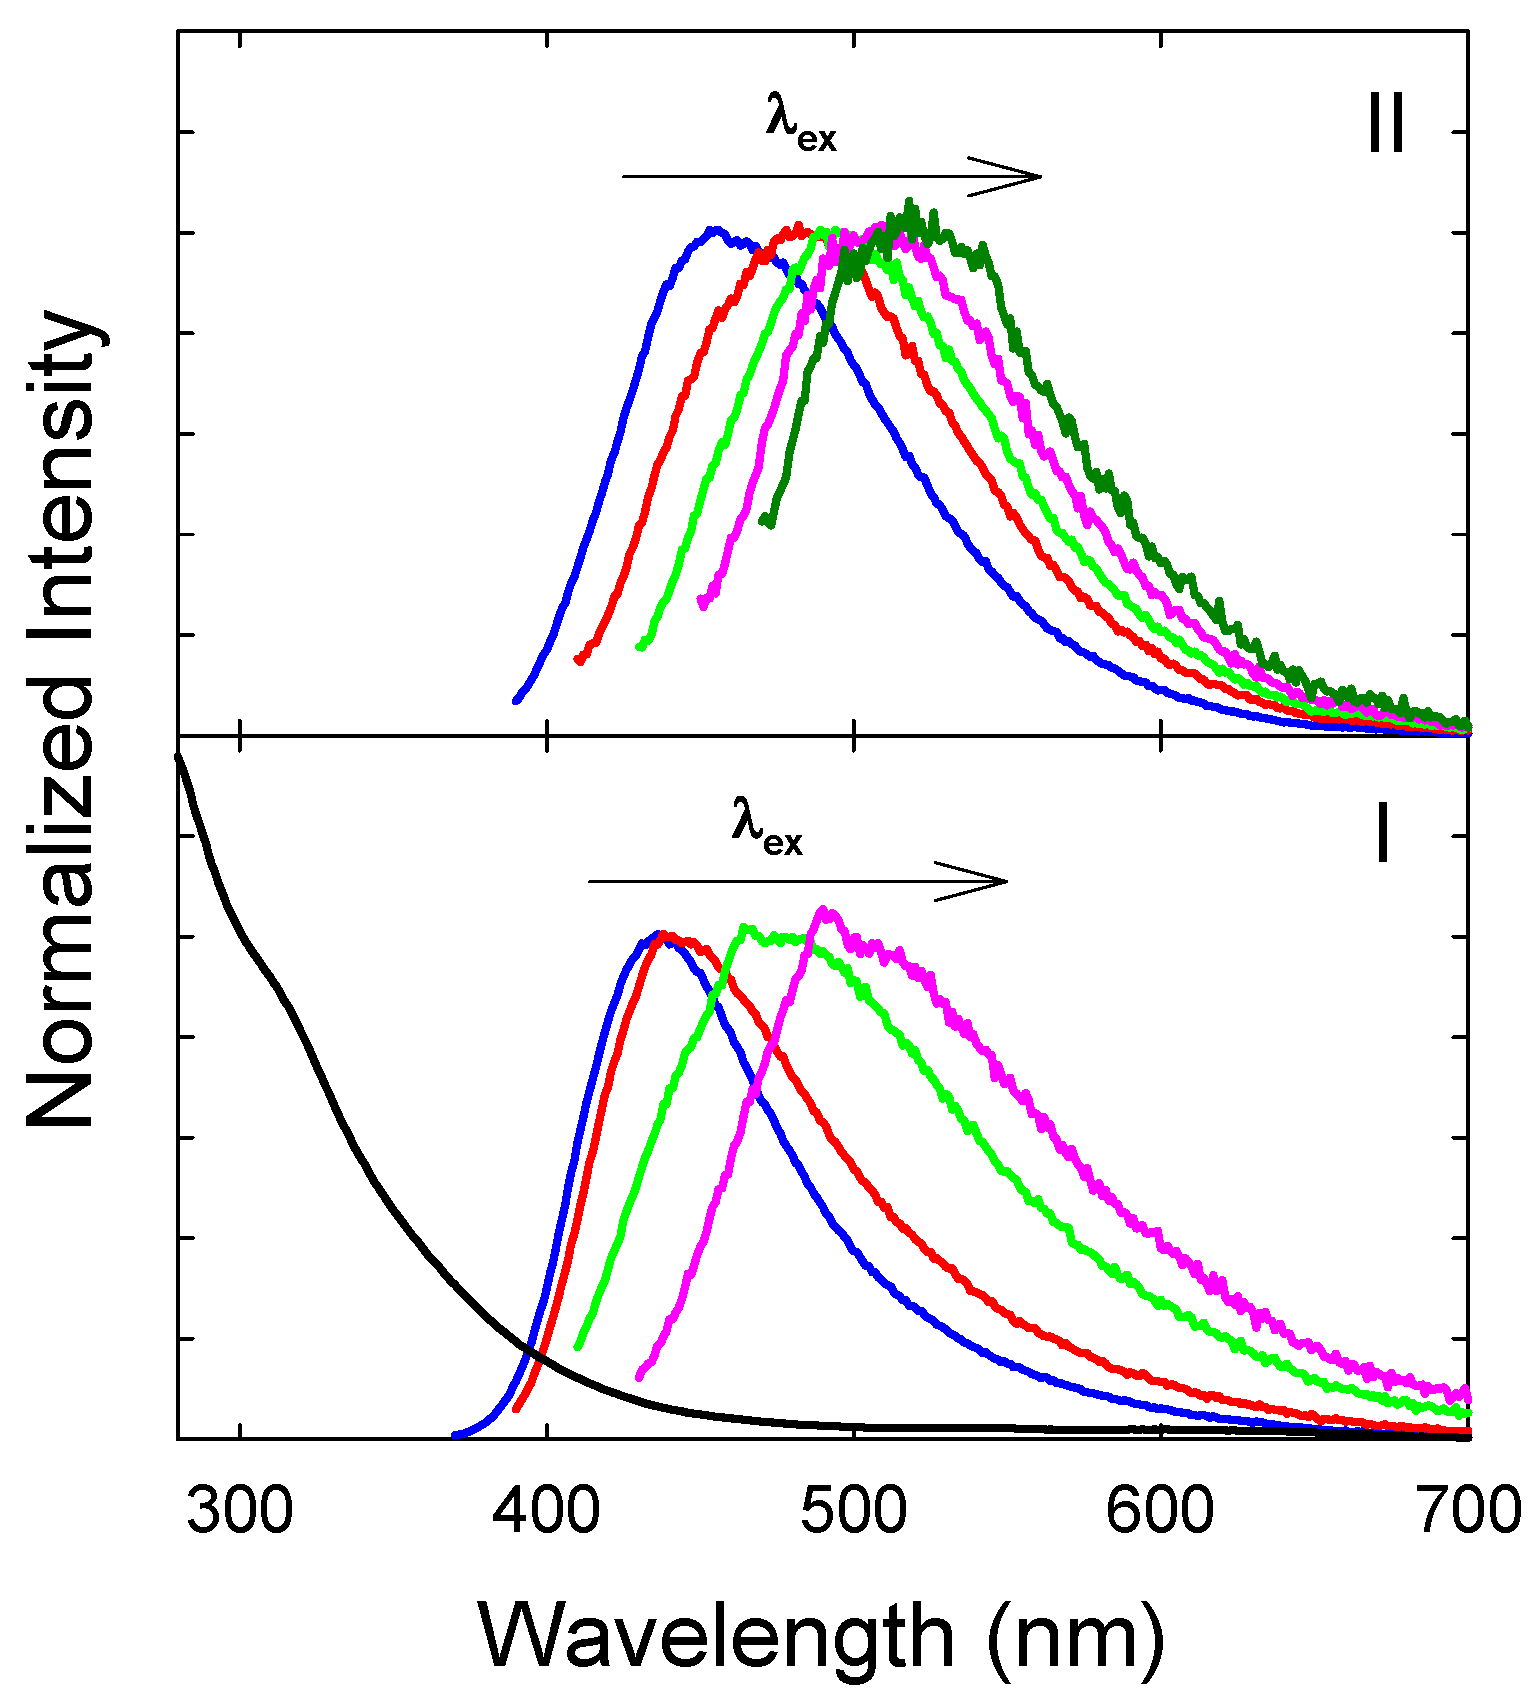
The CDot samples were synthesized from ascorbic acid and water using a simple hydrothermal method (Scheme 1, path A). The concentration, reaction time, and reaction temperature were optimized such that the CDots obtained from the reaction demonstrated fluorescence spectral properties characteristic of the small carbon clusters identified as carbon dots [1,4,5]. The data in Figure 1 show the absorption and fluorescence spectra for the CDot samples in water collected at various wavelengths. The fluorescence spectra show broad, featureless spectra that tail toward the red, and a strong excitation wavelength dependence that shows the spectra shifting to the red with the excitation wavelength moving towards the red. Also shown are the fluorescence spectra obtained for the CDot–magnetite samples (Scheme 1, path B), which show the same spectral properties. The shapes of the spectra and the excitation wavelength dependence demonstrate classic CDot spectral behavior, confirming the synthesis of the small, emissive CDots [1,4,5]. Quantum yields for the CDot samples were estimated using the known yield for a calibrated naked CDot sample [25] and determined to be on the order of 10 percent.
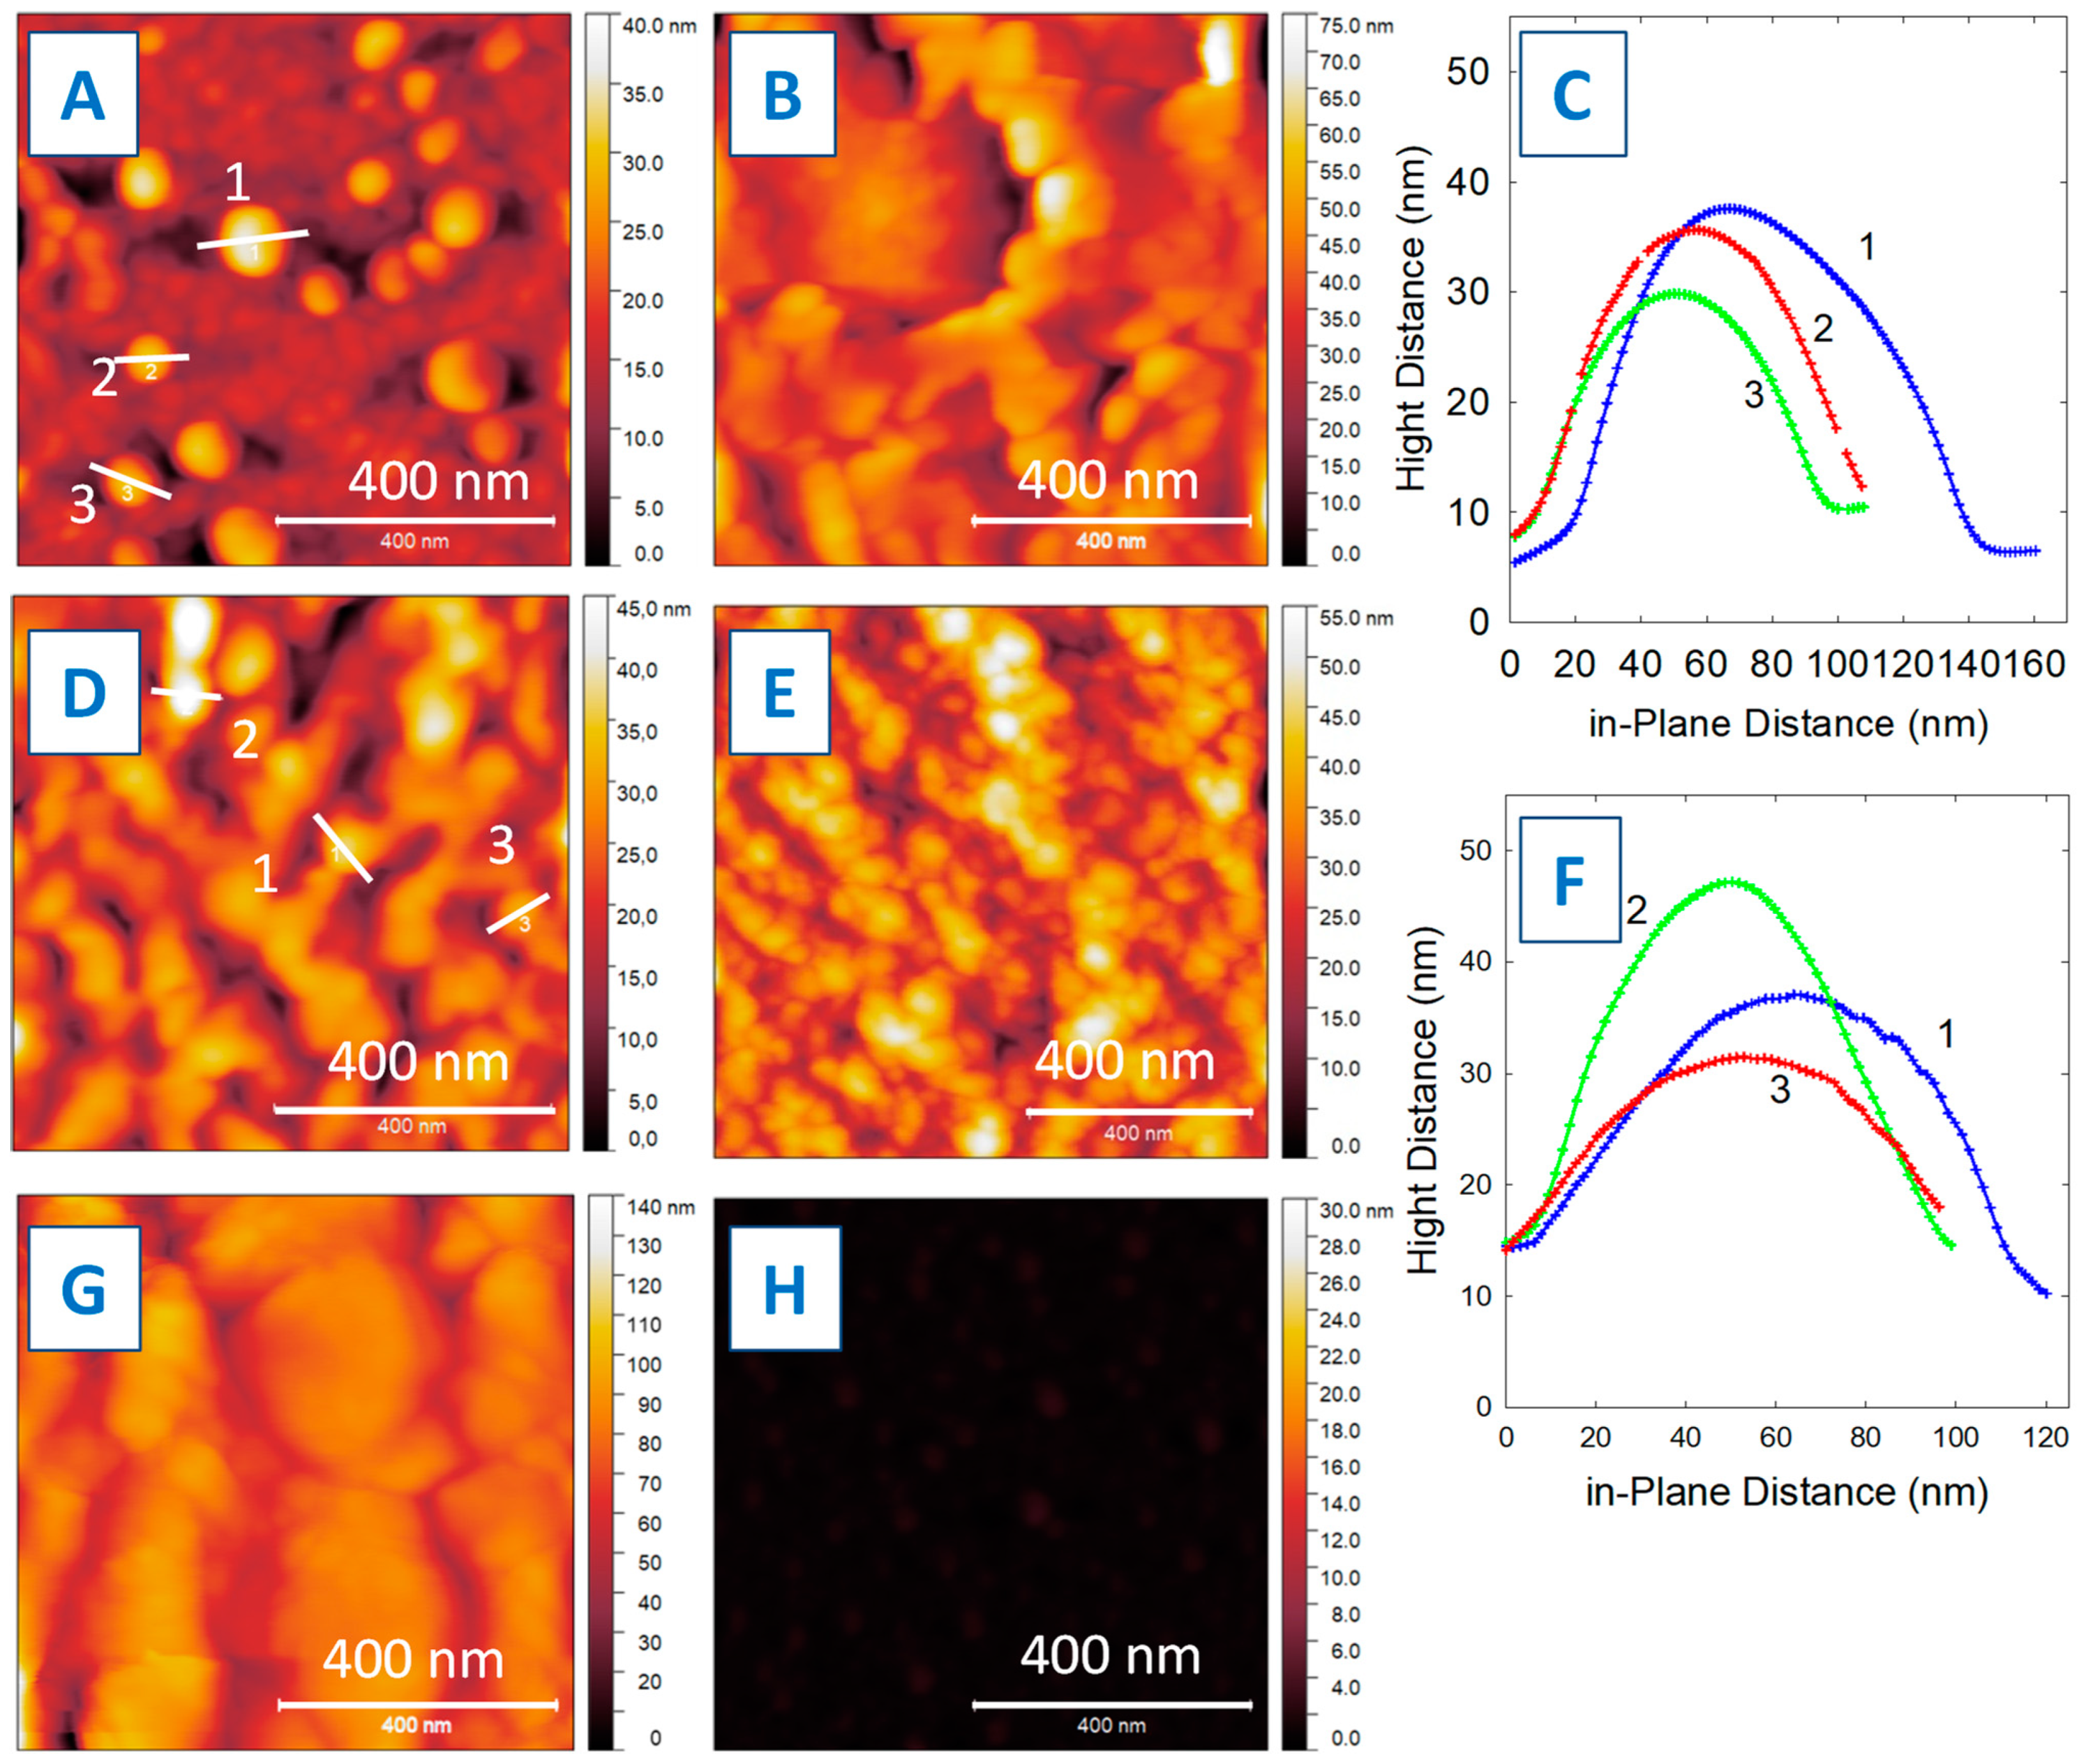
CDot–magnetite nanoparticles were prepared under the same conditions, with commercial magnetite nanoparticles added to the ascorbic acid water solution prior to the hydrothermal reaction (Scheme 1, path B). All samples were prepared with the same ascorbic acid/magnetite mass ratio (6:1). The recovered, washed, and dried CDot samples appear as a brown powder, while the CDot–magnetite samples appear as a black powder. The change in color is attributed to the black magnetite nanoparticles. The presence of magnetite in the CDot–magnetite sample was verified through its response to an external magnetic field (Figure S1) (see Supplementary Materials). The behavior was similar to that observed for the magnetite nanoparticles alone. Figure 2 shows a series of AFM images obtained for both the CDot and CDot–magnetite samples. CDots are characterized as spherical nanoparticles that range in size from approximately 30 nm to as large as 120 nm. Figure 2A shows a number of isolated CDot particles obtained by analyzing a dilute sample. A cross-section analysis of three selected CDots is presented in Figure 2C. Figure 2B shows the same sample of Cdots imaged from a more concentrated solution. The cross-sections for the CDot particles show diameters of ~65 nm (dots 2 and 3) and ~90 nm (dot 1). The sizes determined for these CDots are unusual, as CDots are normally 10 nm or less, especially those known to exhibit the observed fluorescent spectral properties. However, recent discussions about the nature of CDots and their structure has suggested models that are core-shell-like, where CDots (small carbon clusters of only a few nm) are contained within larger carbon structures whose properties would be highly dependent on the variations in the synthesis [3,10,23]. This simple, bottom-up hydrothermal reaction would seem to lend itself to the potential for such shell-like structures (Scheme 1). These images seem to support such conclusions and further investigations are needed to determine the local environments within the spherical particle.
The CDot–magnetite sample was also analyzed using AFM. Figure 2D,E show images of the CDot–magnetite particles obtained from solutions of differing concentration (low to high). The particles have an estimated size distribution from ~50 nm to ~80 nm. Figure 2D depicts three particles for which a cross-section analysis was performed, with the results shown in Figure 2F. The sizes were determined as ~70 nm (particles 1 and 2) and ~55 nm (particle 3). The CDot–magnetite sample is significantly different from the precursor commercial magnetite, with the commercial magnetite showing large platelets of agglomerated particles (Figure 2G). The reported size of the commercial magnetite is ~20 nm. Apparently, the reaction required to form CDot–magnetite results in the separation of the large agglomerates and the coating of the magnetite with the carbon dot material. The result is conceptualized in Scheme 1, where the CDot–magnetite exists as a core-shell-like material. If we assume 20 nm is the average size distribution for the magnetite particles, then we can estimate the volume fractions for carbon vs. magnetite for the CDot–magnetite material. For the case with the larger diameter of 80 nm, this would yield a volume ratio of 63:1 (carbon–magnetite), and if we utilize the densities of carbon (2.2 gm/cm3) and magnetite (5.17 gm/cm3), we obtain a mass ratio of ~27:1. However, the carbon surrounding the magnetite is unlikely to be pure carbon; thus, as a lower limit estimate, we can use the density of dodecanol (0.831 gm/cm3). This yields a ~10:1 mass ratio. Following the same process, we can estimate a volume ratio of 14:1 and mass ratios of 6:1 (carbon) to 2:1 (dodecanol) for a CDot–magnetite particle size of 50 nm. These mass ratios serve as bounds for estimating the carbon content of the particles.
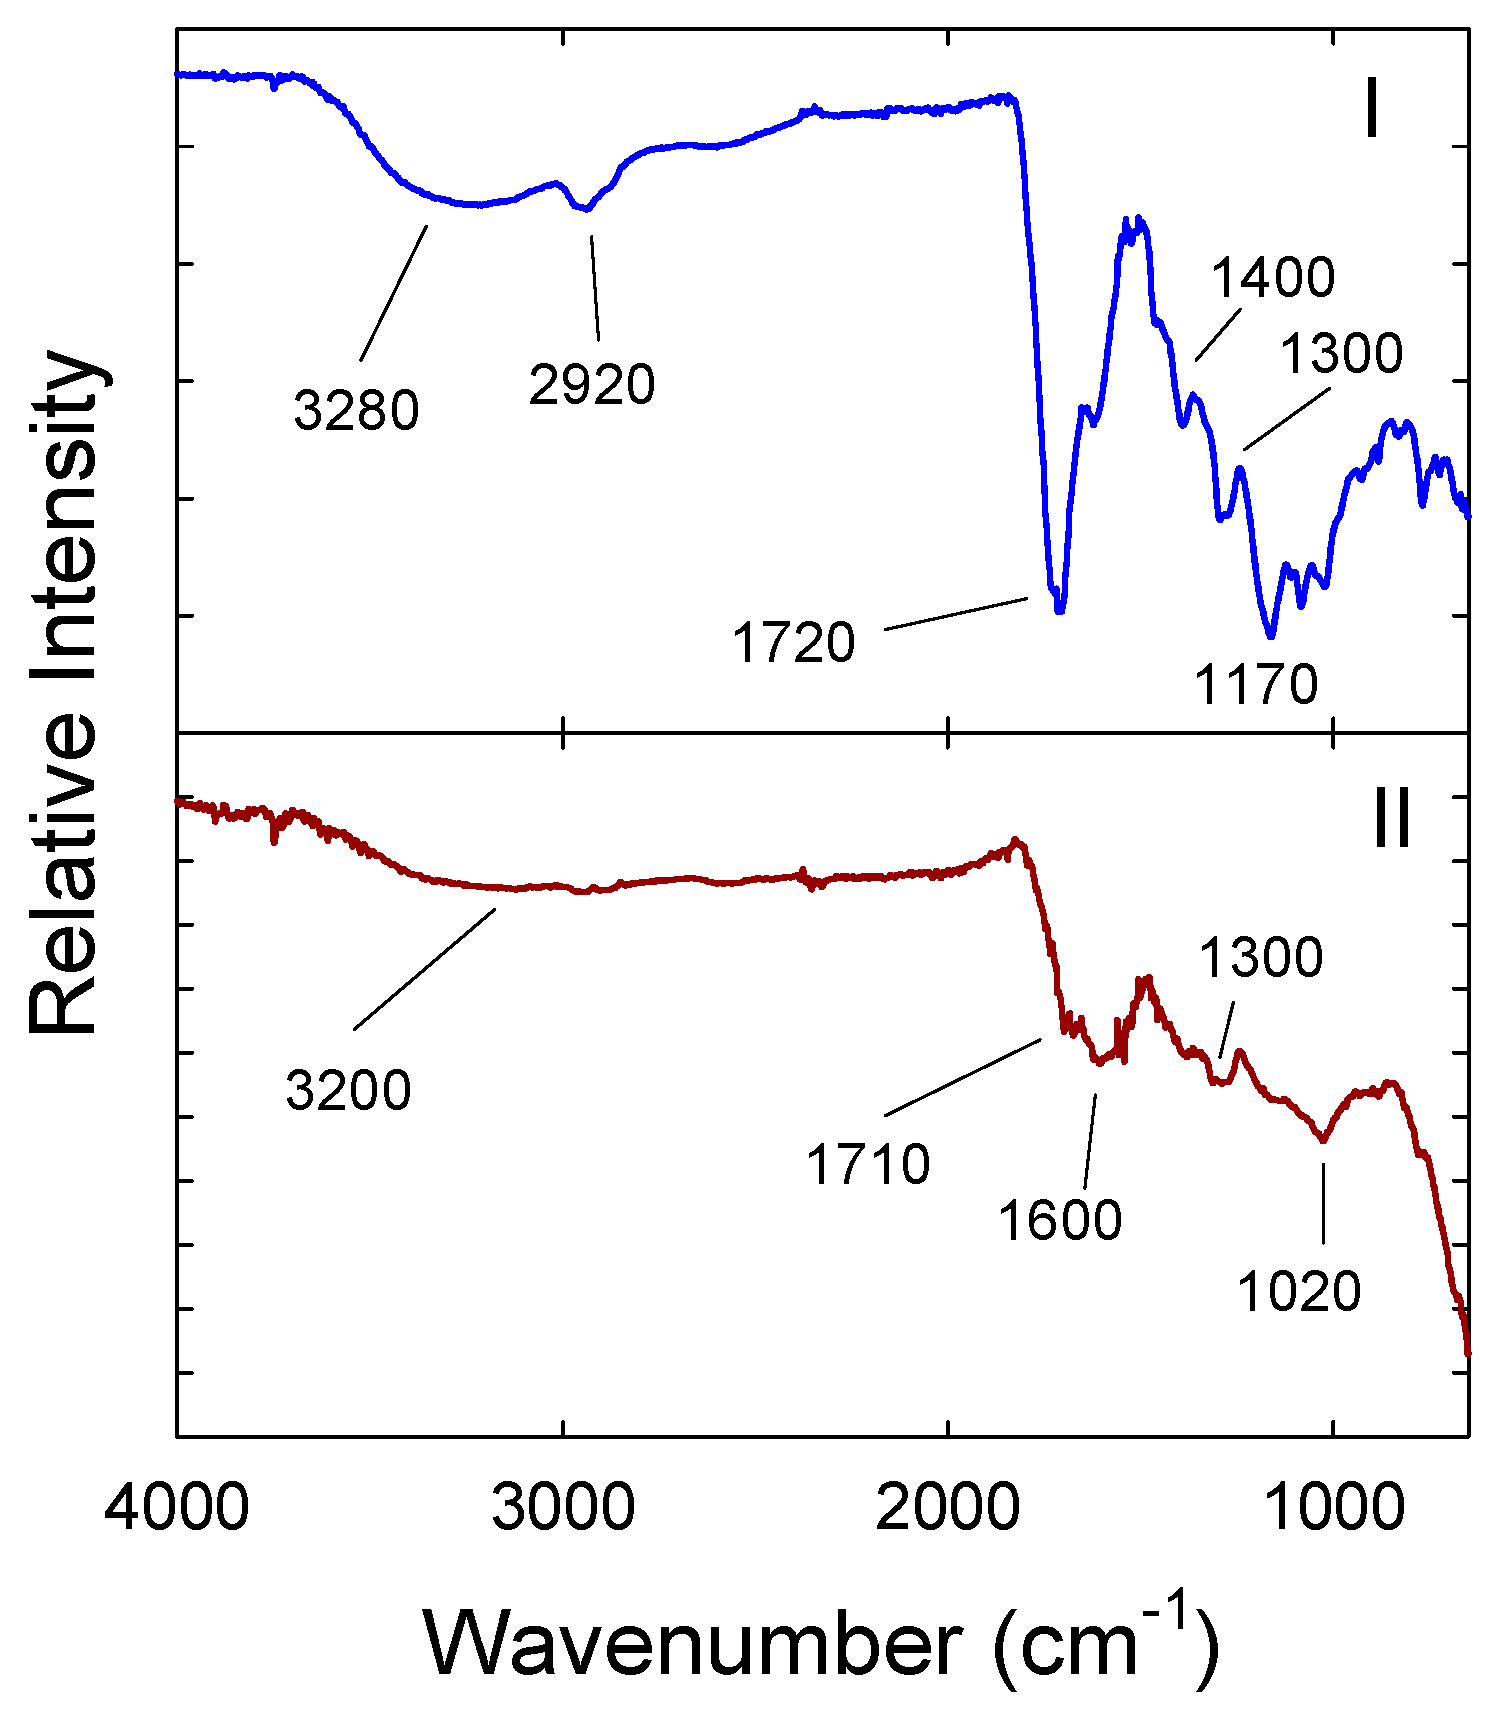
Figure 3 provides the FTIR spectra for the CDot and CDot–magnetite samples. The CDot sample has similar features to many reported CDot samples serving as a means of fingerprint identification of carbon dot formation [18,20,23]. An analysis of the IR spectrum shows strong OH features (>3000 cm−1), CH stretch (~2920), and carbonyl (~1700 cm−1) signatures, and a multitude of stretches within the fingerprint region. While somewhat reduced due to a significant change in the relative contribution of carbon to the overall sample, the spectrum for the CDot–magnetite sample clearly shows the presence of organic components: a broad OH signature, contribution in the carbonyl region with a spectral shift to lower wavenumbers, some signal in the fingerprint region, and the magnetite signature at the tail end of the spectrum (<1000 cm−1). The spectrum further confirms the presence of the CDots (organic) on the magnetite nanoparticles.
The carbon content of the CDot–magnetite samples can also be determined using thermal analysis techniques. Figure 4 shows the data for the DSC/TGA analysis of both the CDot and the CDot–magnetite samples (see Figures S2–S6 for the marked up data). Both samples were analyzed in air in an open pan configuration; as such, the data at high temperatures represent the combustion of the carbon material. For an initial mass of 10.72 mg and a final mass of 3.34 mg, we can estimate that there is 69% carbon in the CDot–magnetite sample. However, the TGA data for the CDot-only sample show a remaining mass due to residual ash that is approximately nine percent. Correcting for that, we obtained a final mass of 2.6 mg magnetite; the carbon content of the sample was determined to be approximately 75 percent. When the CDot–magnetite sample is purified by dialysis (denoted as CDot–magnetite dialysis in Figure 4), the carbon content is found to decrease to approximately 69%, suggesting that the bulk CDot–magnetite sample contains a small fraction of the ascorbic acid decomposition product. This mass estimate is in good agreement with the estimate derived from the AFM images, assuming that a greater fraction of the particles show a trend toward smaller diameters (i.e., ~50 nm).
Figure 4 also provides calorimetric data for the CDot and CDot–magnetite samples, an analysis of which can provide insight into the nature of the CDot material. For our system, DSC data with an upward trend represent exothermic processes, while downward data would be endothermic. The positive peak for the CDot sample in Figure 4 represents the actual combustion of the carbon materials to form, ideally, CO2 and water. If we integrate the peak, correct for the original mass, and then divide by the mass lost during that combustion peak, we obtain an estimated heat of combustion of 21.8 kJ/g with an error of ~14%, or ±3 kJ/g. The error was determined from five replicate analyses of the CDot–magnetite sample, applying ± three times the standard deviation. The reported value for graphitic carbon is 32 kJ/g [26]. There are at least two reasons for this substantially lower value: first, the DSC open-pan method is a very inaccurate technique, incapable of recording the energy release from partially reacted species that may be volatile and may have left the bounds of the reaction container. Second, the carbon material in the CDot samples does contain significant oxygen functionality, which reduces the energy content of the carbon-based material. As an absolute number, the 21.8 kJ/g heat of combustion value is only a very rough estimate for these carbon dot samples, but is considered to be not unreasonable compared to the value for pure carbon. Of greater value is the comparison of these values between the different CDot and CDot–magnetite samples. Following the same procedure, we obtained estimated heat of combustion values of 21.2 and 21.6 kJ/g for the CDot–magnetite and the purified CDot–magnetite–dialysis samples, respectively. Within the measured uncertainty of 14%, these values are the same, suggesting consistency between the samples with respect to the nature of the carbon material.
While the values obtained for the estimated heat of combustion are similar for the CDot and CDot–magnetite samples, the nature of the combustion process is quite different. The CDot sample is shown to have a maximum combustion energy release at around 560 °C. This is typical for spontaneous combustion in air for simple carbon materials. Graphene oxide is observed to combust in the same region and graphene at a somewhat higher temperature [27]. However, the CDot–magnetite sample undergoes combustion at a significantly lower temperature, starting below 200 °C, completing by 400 °C, and showing a peak maximum at 360 °C (Figure 4). In addition, the combustion process shows two overlapping peaks, with the smaller first peak showing a maximum at approximately 280 °C. The difference can be attributed to the fact that the CDot–magnetite combustion process is a catalyzed, heterogeneous reaction, where the magnetite nanoparticle substructure serves as the catalyst [28]. This observation leads to the first potential application of the CDot–magnetite material. The ability to move the combustion process 200 °C lower can have valuable implications, for example, propulsion systems could be developed that could operate at lower ignition temperatures with improved stability, which could presumably yield significant emission reductions and be more compliant with environmental regulations [29,30,31,32]. However, such gains would be offset by the loss of fuel due to this particular system being 25 to 30% dead weight material in terms of energy (i.e., the magnetite catalyst). It would be interesting to determine the effect of reducing the magnetite concentration on the synthesis and combustion of the CDot–magnetite samples or how low a catalyst concentration is possible while still obtaining the catalyzed low-temperature combustion with an equal energy output.
While significant, the above-mentioned results are not the only interesting observations contained in Figure 4. A close examination of the data obtained for the CDot–magnetite sample after the exothermic peak maximum, T > 360 °C, shows a very unusual behavior. Figure 4b shows the peak in an expanded temperature window. Just after passing the peak, the heat flow trace is observed to take a dramatic downward (endothermic) turn. In fact, the downward trajectory is so significant (negative heat flow) that the thermocouple measuring the reactor pan temperature observes a cooling event, or as can be seen in Figure 4b, the recorded temperature appears to go backwards relative to the instrument furnace. The same backwards event can be seen in the TGA trace. While an exothermic peak would naturally return to the baseline in a Gaussian-like behavior (for example, the CDot trace in Figure 4a), the very abrupt and backward-moving traces seen for the CDot–magnetite sample are highly unusual and suggest a strong endothermic event is underway. The data show that the endothermic process occurs at the same time that mass is being lost from the sample. An X-ray analysis of the magnetite pre- and post-DSC shows a slight change after the reaction (Figure 5). The magnetite (black) is observed to become dark red (Figure 5 inset), and the powder X-ray spectrum is shown to include a small contribution from hematite (Fe2O3). Based on published accounts, there is no indication that the oxidation of magnetite to hematite is highly endothermic [33,34,35]; thus, as a phase change, this change in crystal structure should not be directly responsible for the negative heat flow observed for the CDot–magnetite samples.
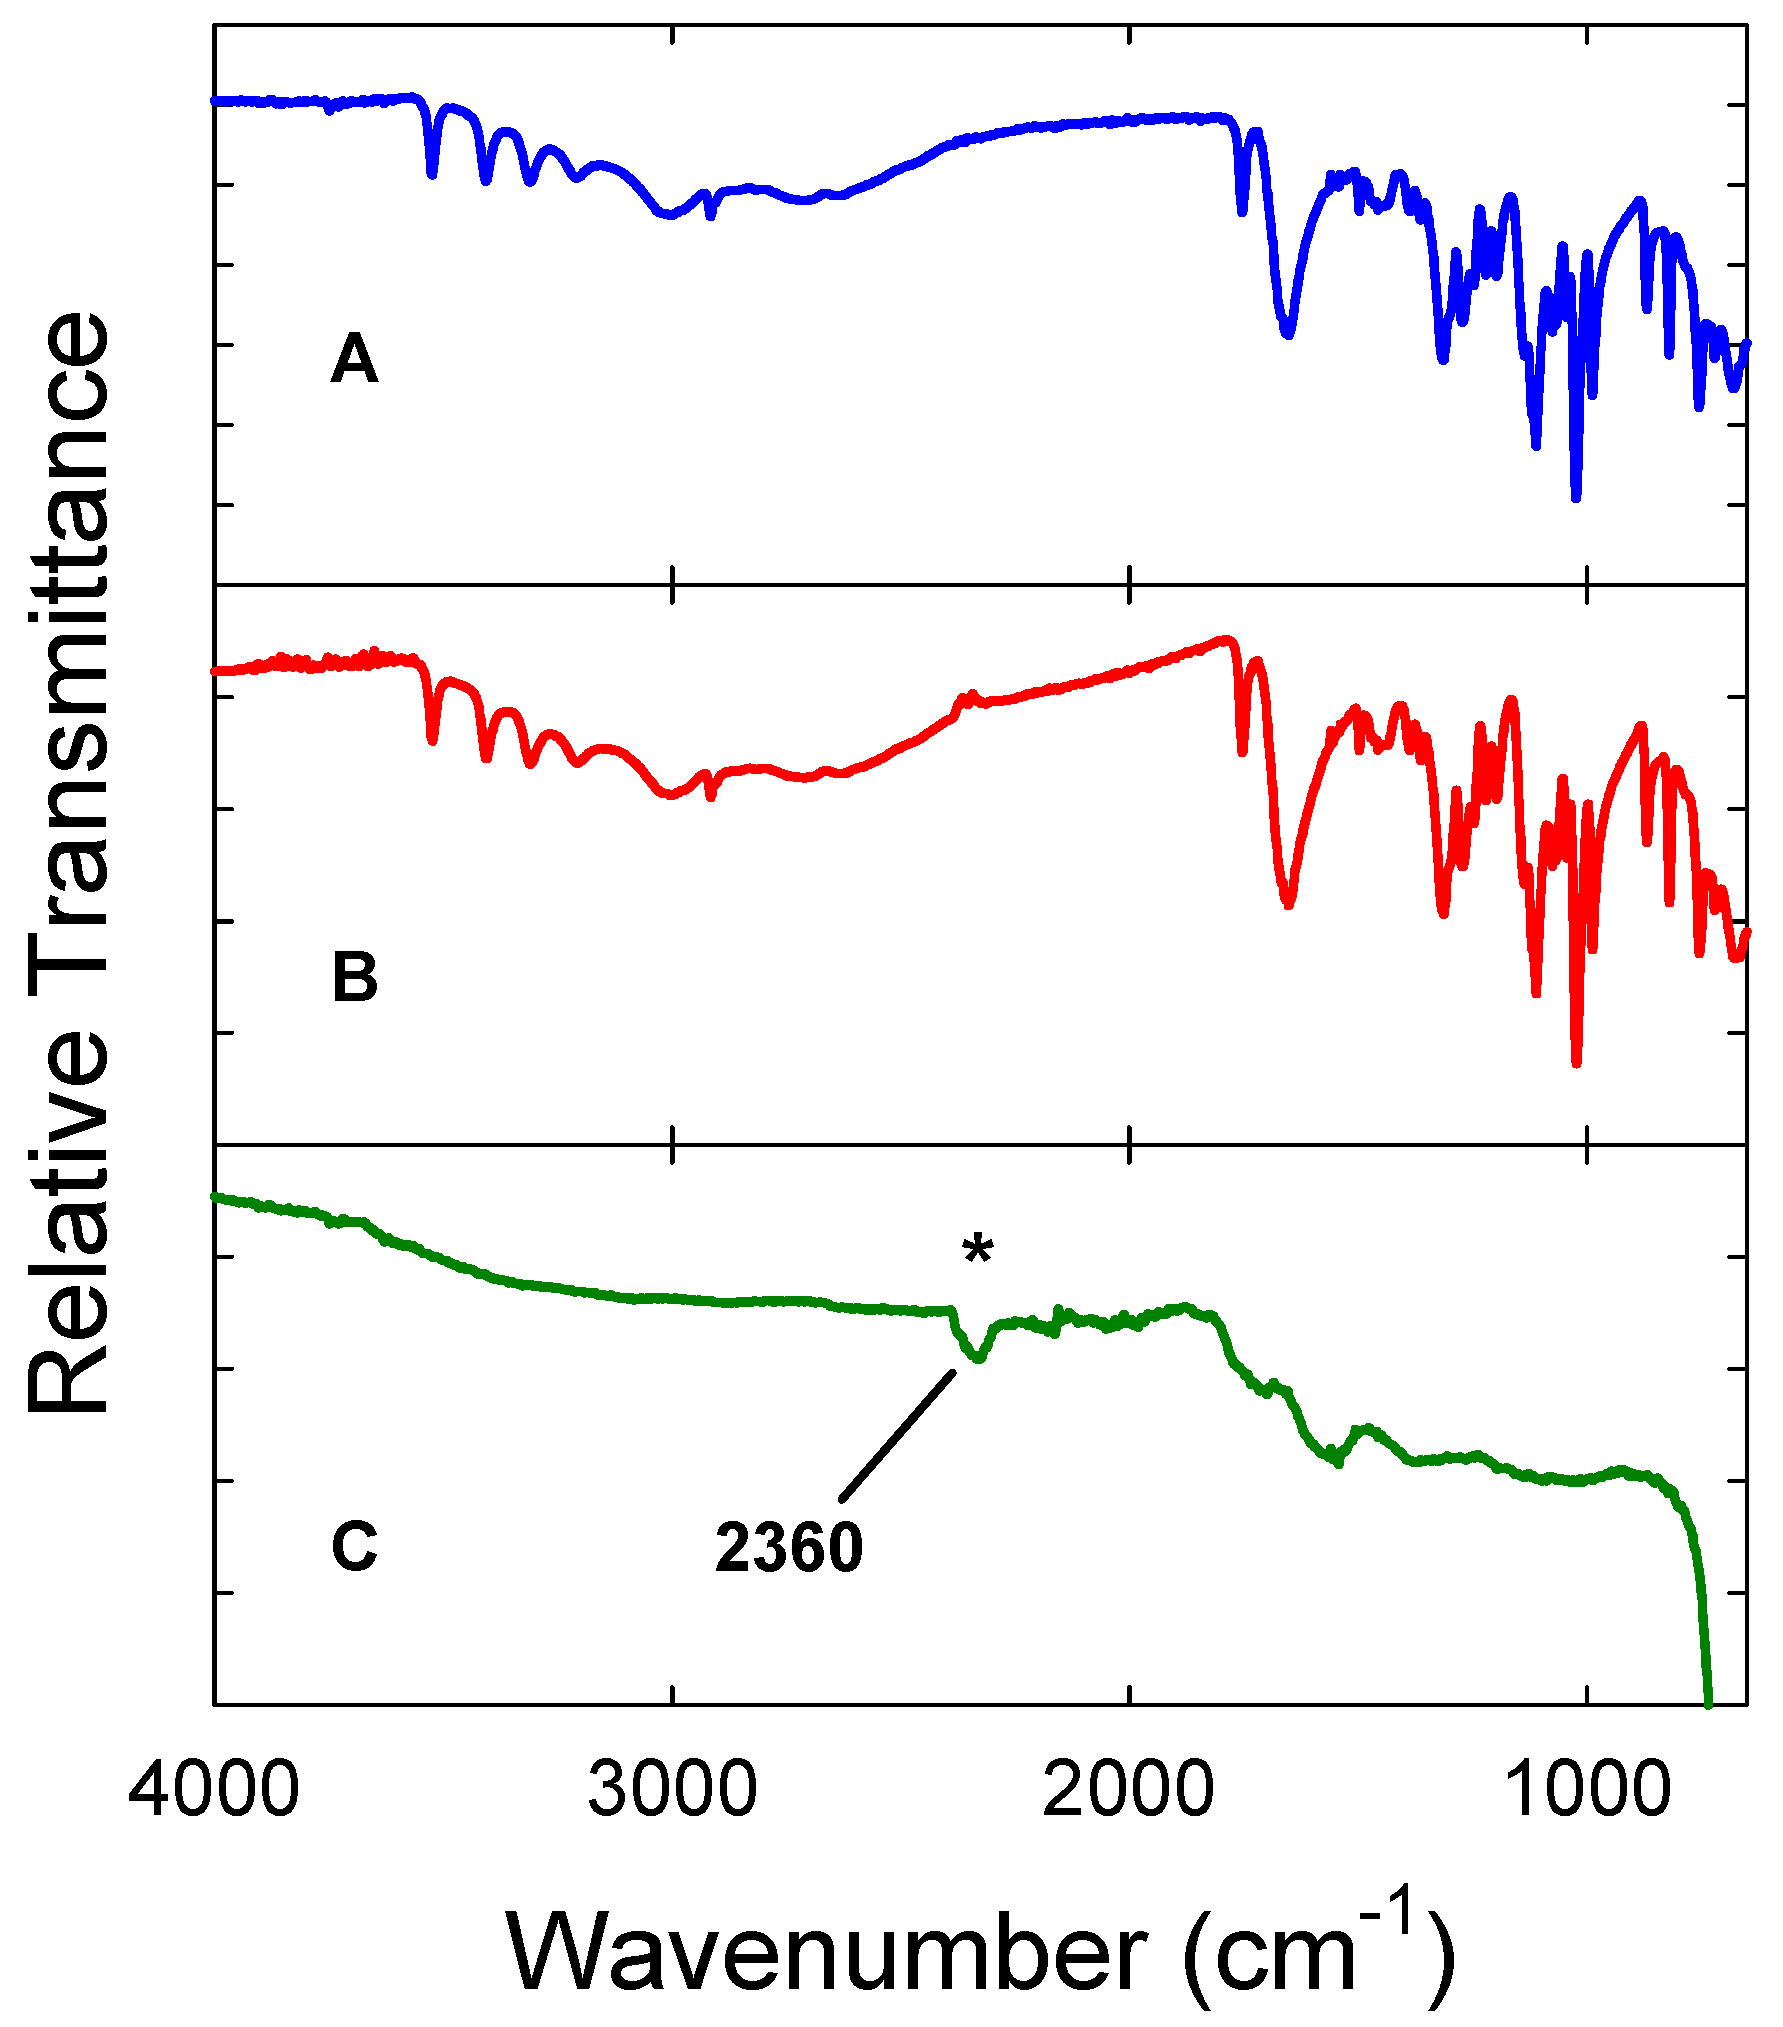
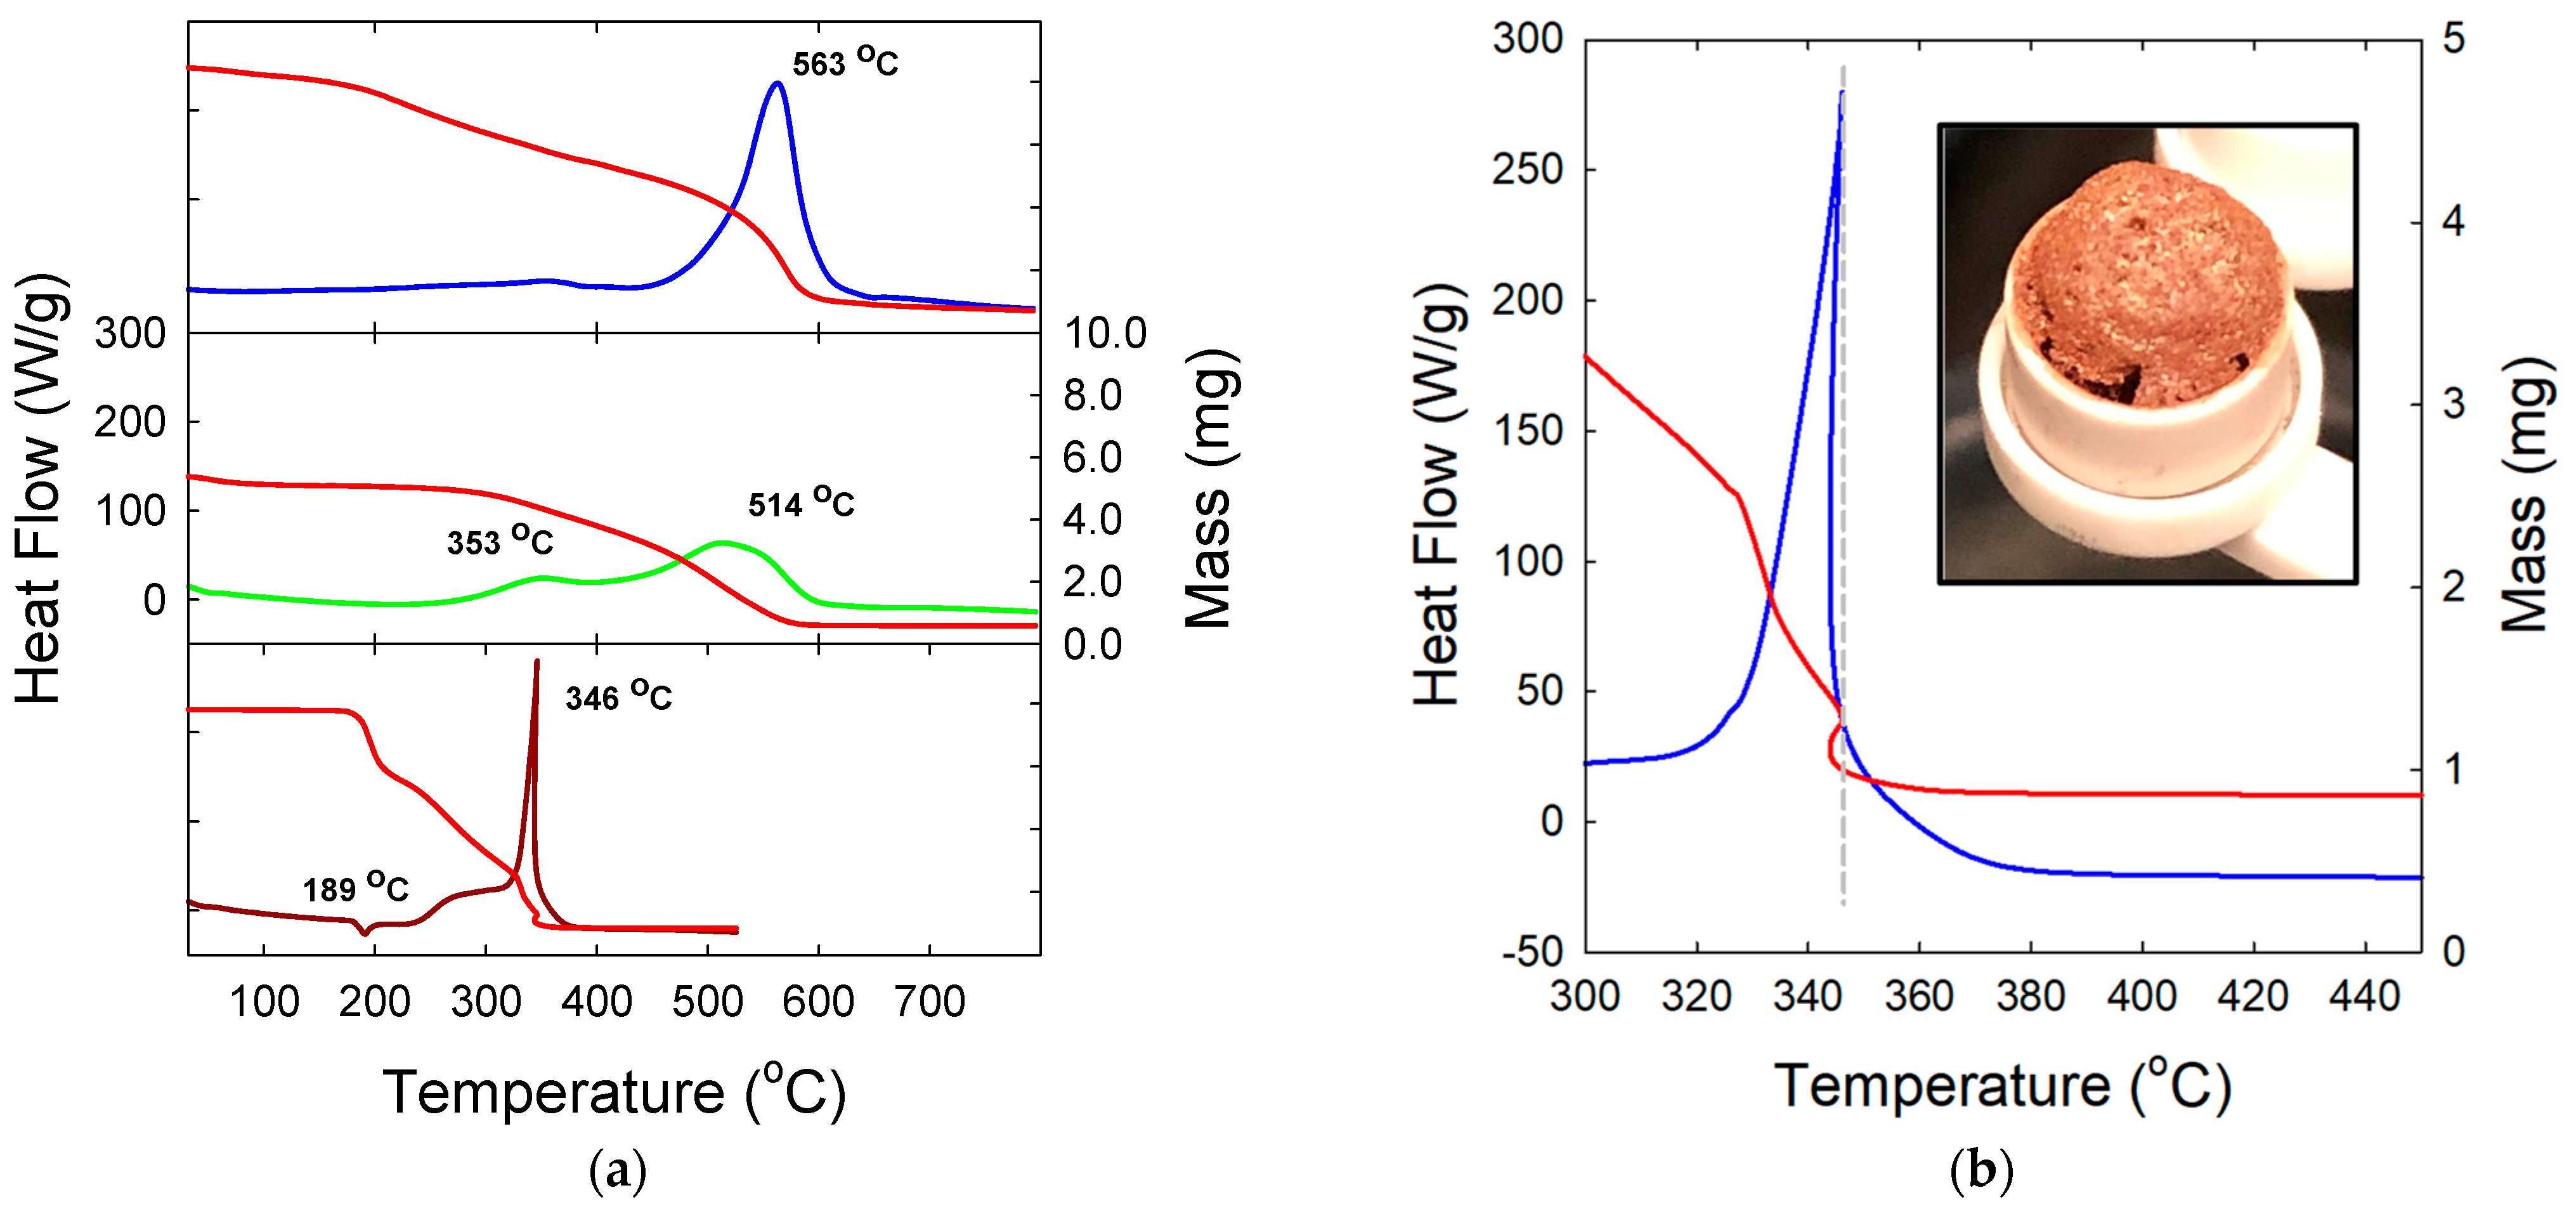
In an attempt to better understand the parameters by which the endothermic event occurs, we prepared and analyzed two reference samples: a physical mixture of the CDot sample and the magnetite nanoparticles and a physical mixture of the starting material ascorbic acid and the magnetite nanoparticles. Both mixtures were prepared using the initial synthesis carbon-to-magnetite mass ratio of 6:1. Figure 6a shows the DSC/TGA data for these samples, analyzed using the same procedure as the CDot–magnetite samples. The data for the mixture of CDots with magnetite show two exothermic peaks at 353 °C and at 514 °C. These data suggest that the physical mixing provides some benefit to the magnetite catalysis, but the majority of the energy release still occurs as natural combustion (approximately 1/3 to 2/3 of the relative contribution). However, the total integrated energy for the two peaks yields an estimated heat of combustion of only 16 kJ/g (±2.2 kJ/g), lower than the 21.2 kJ/g (±3.0 kJ/g) obtained from the synthesized CDot–magnetite sample, suggesting that the loose interaction between the catalyst and the CDot in the physically mixed sample might result in greater quantities of partially reacted products escaping the reaction container. No endothermic behavior is observed. The data for the ascorbic acid magnetite mixture are quite different. First, the ascorbic acid magnetite sample shows a melting endotherm just below 200 °C, attributed to the melting of ascorbic acid. The endotherm is accompanied by a significant mass loss due to the decomposition of ascorbic acid. These processes and their decomposition products are known [36,37,38,39,40] and may be partially responsible for the success of ascorbic acid in forming CDots. Following this, the heat trace shows two exothermic combustion peaks that are very similar to the CDot–magnetite sample (Figure 4a), with a smaller peak at ~280 °C and a larger peak following that; however, for the ascorbic acid case, the second peak does not appear to be able to reach a maximum before the abrupt onset of a very strong endothermic event (@346 °C). Figure 6b shows an expanded temperature window view of this endothermic event. Similar to the CDot–magnetite sample, the ascorbic acid–magnetite mixture shows both the heat flow and mass traces going backwards with respect to the furnace temperature and a clear mass loss during the event. Also shown in Figure 6b is an image of the post-reaction sample. Similar to the post-reaction CDot–magnetite sample, it is a reddish color, but this sample also shows an unusual domed structure, suggesting a significant gas release event. To our knowledge, this endothermic process has not been previously reported for ascorbic acid or for CDots prepared from ascorbic acid. It may be that this process is very system-dependent. Ascorbic acid and the CDots prepared from ascorbic acid seem to only demonstrate this phenomenon when intimately integrated with magnetite nanoparticles; the CDots through their direct synthesis onto the particles, and the ascorbic acid through melting and mixing with the magnetite particles. A simple mixture does not reproduce the effect. Figure 7 shows the FTIR spectra for ascorbic acid and for the ascorbic acid–magnetite mixture sample. The spectrum for the ascorbic acid is very interesting, showing a strong carbonyl stretch, detailed fingerprint region, and multiple well resolved OH stretch signals (>3000 cm−1), all characteristic of ascorbic acid [41]. When mixed with the magnetite nanoparticles, no change to the FTIR spectrum is observed, indicating a lack of ‘ground state’ interaction. The intimate interaction between the ascorbic acid and magnetite most likely occurs after the melting transition; however, the data in Figure 6a show that the thermal decomposition associated with the melting of ascorbic acid results in approximately 28% of the mass being lost. This indicates that the active material(s) responsible for the unique interaction with the magnetite nanoparticles is likely a decomposition product of ascorbic acid, and not ascorbic acid itself [37,39]. This compound(s) could also be generated in the hydrothermal reaction to form the CDots.
Clearly, the endothermic process is related to the thermal chemistry of ascorbic acid and magnetite; however, there are no studies under these conditions. The following facts have been established: (1) Ascorbic acid and magnetite are part of a well-known oxidation reduction reaction termed the Fenton Reaction [42,43,44]. (2) Iron oxides are known to be valuable components of modern CO2 sequestration technologies [45,46,47,48,49]. (3) CO2 is known to form metal carbides, and specifically to form FeCO3 under certain reaction conditions [50,51]. From our experiments, we observe (a) ascorbic acid–magnetite samples reacting in air exothermically. with concomitant mass loss, (b) a strong endothermic event following the exothermic process, and (c) a final composition of iron oxides that shows a small conversion of magnetite to hematite.
While the actual processes occurring during the DSC experiment might be quite complex and involve multiple reactions, we can attempt to explain the observations in two simple steps: first, a combustion process (exothermic) where the carbon reacts with oxygen in the presence of a solid catalyst, followed by an endothermic event that appears to release gas. The catalyzed combustion of ascorbic acid and its thermal decomposition products results in the formation of CO2 molecules, as expected for an ideal combustion process. Because the combustion reaction is a catalyzed heterogeneous reaction, the combustion products are formed at the surface of the catalyst material, resulting in a high local concentration of CO2. Under these conditions, iron and iron oxides can react to form iron carbonate (FeCO3), a reaction that is reported to be exothermic [47,49]. It is also reported that at temperatures of approximately 367 °C, the iron carbonate decomposes to release CO2 in an endothermic reaction [47]. The fact that the endothermic process appears to be so significant is not due to new or novel chemistry, but is attributable to the impact of the nano-interface on local concentrations and reaction rates. The behavior is conceptually similar to that observed for the energetic reaction of aluminum and oxygen, where the nano-scale is exploited for the same reasons [52,53]. Being a chemisorbed species, there is some level of stability for this compound and it can possibly be recovered. Figure 6 shows the FTIR for a CDot–magnetite sample that was processed in the DSC/TGA, but halted at 340 °C, cooled to room temperature, and recovered. Interestingly, the spectrum shows a signal at ~2350 cm−1, attributable to the CO2 adsorbed on Fe3O4 [48]. While we can reproduce the spectrum, we have been unable to achieve a strong CO2 signal on magnetite from a thermally treated sample. It is possible that the complexity of this compound matches the complexity of the heterogeneously catalyzed combustion environment, and the isolation of a highly loaded CO2–magnetite or FeCO3–magnetite product may not be possible; however, if such a compound could be isolated, then the stored endothermic potential would have great utility. Based on the behaviors of the CDot–magnetite sample vs. the ascorbic acid magnetite mixture, in our opinion, any success in isolating this compound would be greater with the CDot sample, as the approach to the endothermic event is moderated and can be better controlled. In addition, the endothermic event is observed to terminate an ongoing combustion process. It is possible that the CDot–magnetite material could serve as an additive to other high-value materials that might prevent or reduce the likelihood of combustion, i.e., the material could act as a combustion quencher.
Figure 7. FTIR spectra for (A) ascorbic acid, (B) ascorbic acid–magnetite mixture, and (C) CDot–magnetite post DSC analysis, halted at 340 °C. The asterisk in (C) indicates the absorption transition attributed to the asymmetric stretching mode of the physisorbed CO2 [48].
Crystals 14 00520 g007

4. Conclusions

We investigated a relatively simple CDot system where CDots are synthesized with and without commercial magnetite nanoparticles. By comparing the properties of CDots and CDot–magnetite, we observed strong similarities in their spectroscopic properties as well as significant structural differences, suggesting that magnetite serves as a structural template for CDot growth. A thermal analysis of these materials revealed (1) the similarities between CDots and other carbon-based nanomaterials, (2) the action of magnetite as a combustion catalyst, and (3) the properties of CDot–magnetite, which led to a combustion-induced endothermic event. The critical importance of the nano-interface for this endothermic phenomenon was further established by examining the synthesized samples compared to physically mixed samples. Weak interfacial interactions (CDots mixed with magnetite) did not show endothermic behavior while strong interactions (melted ascorbic acid and magnetite) did. We believe these findings clearly demonstrate the significance of the nano-interface for multicomponent nanoparticle systems, and that exploitation of the interface can result in unique and unusual properties. The CDot–magnetite material presented here has multiple potential applications. If it can be isolated in its reacted form, the CO2–magnetite or FeCO3–magnetite material may find application in advanced cooling technologies due to its stored endothermic potential. In its original form, the CDot–magnetite material may serve as a specialty fuel for low-temperature combustors with a better environmental performance. Alternatively, the CDot–magnetite material may serve as an exothermic quencher of combustion, preventing or retarding fire propagation. This material and all its potential applications warrant further investigation.

Supplementary Materials

The following supporting information can be downloaded at: https://www.mdpi.com/article/10.3390/cryst14060520/s1, Figure S1: Images of the magnetic nature of the synthesized samples; Figures S2–S6: DSC/TGA data with quantitative markup.

Author Contributions

Conceptualization, C.E.B.; synthesis and preparation, K.Z., L.J.S., M.M., P.O.L. and K.A.S.F.; analysis, C.E.B., K.Z., L.J.S., P.O.L. and K.A.S.F.; writing—review and editing, C.E.B. and K.Z. All authors have read and agreed to the published version of the manuscript.

Funding

K.Z. and M.M. acknowledge support from the Air Force Research Laboratory Summer Faculty Fellowship Program (2022). L.J.S. and P.O.L. received support from the University of Dayton Summer Undergraduate Research Experience.

Data Availability Statement

The original contributions presented in the study are included in the article/Supplementary Materials; further inquiries can be directed to the corresponding author.

Acknowledgments

C.E.B. would like to acknowledge Michel Berman of AFOSR for his interest and support, energy and energetic research. The team expresses thanks to L. Cao (University Dayton) and Y.-P. Sun (Clemson University) and to Weixiong (Luke) Liang for helpful discussion and assistance with XRD identification. K.Z. thanks K. Miller of AFRL for the assistance with material analysis.

Conflicts of Interest

The authors declare no conflicts of interest.

References

  1. Sun, Y.-P.; Zhou, B.; Lin, Y.; Wang, W.; Fernando, K.A.S.; Pathak, P.; Meziani, M.J.; Harruff, B.A.; Wand, X.; Wang, H.; et al. Quantum-Sized Carbon Dots for Bright and Colorful Photoluminescence. J. Am. Chem. Soc. 2006, 128, 7756–7757. [Google Scholar] [CrossRef]
  2. Cao, L.; Fernando, K.A.S.; Liang, W.; Seilkop, A.; Veca, L.M.; Sun, Y.-P.; Bunker, C.E. Carbon dots for energy conversion applications. J. Appl. Phys. 2019, 125, 220903. [Google Scholar] [CrossRef]
  3. Wang, P.; Meziani, M.J.; Fu, Y.; Bunker, C.E.; Hou, X.; Yang, L.; Msellek, H.; Zaharias, M.; Darby, J.P.; Sun, Y.-P. Carbon dots versus nano-carbon/organic hybrids—Dramatically different behaviors in fluorescence sensing of metal cations with structural and mechanistic implications. Nanoscale Adv. 2021, 3, 2316–2324. [Google Scholar] [CrossRef] [PubMed]
  4. Liang, W.; Bunker, C.E.; Sun, Y.-P. Carbon Dots: Zero-Dimensional Carbon Allotrope with Unique Photoinduced Redox Characteristics. ACS Omega 2020, 5, 965–971. [Google Scholar] [CrossRef]
  5. LeCroy, G.E.; Sonkar, S.K.; Yang, F.; Veca, L.M.; Wang, P.; Tackett, K.N., II; Yu, J.-J.; Vasile, E.; Qian, H.; Liu, Y.; et al. Toward Structurally Defined Carbon Dots as Ultracompact Fluorescent Probes. ACS Nano 2014, 8, 4522–4529. [Google Scholar] [CrossRef] [PubMed]
  6. Ullal, N.; Muthamma, K.; Sunil, D. Carbon dots from eco-friendly precursors for optical sensing application: An up-to-date review. Chem. Pap. 2022, 76, 6097–6127. [Google Scholar] [CrossRef]
  7. Kumar, P.; Dua, S.; Kaur, R.; Kumar, M.; Bhatt, G. A review on advancements in carbon quantum dots and their application in photovoltaics. RSC Adv. 2022, 12, 4714–4759. [Google Scholar] [CrossRef] [PubMed]
  8. Zhu, P.; Wang, S.; Zhang, Y.; Li, Y.; Liu, Y.; Li, W.; Wang, Y.; Yan, X.; Luo, D. Carbon Dots in Biomedicine: A Review. ACS Appl. Bio Mater. 2022, 5, 2031–2045. [Google Scholar] [CrossRef] [PubMed]
  9. Ozyurt, D.; Kobaisi, M.A.; Hocking, R.K.; Fox, B. Properties, synthesis, and applications of carbon dots: A review. Carbon Trends 2023, 12, 100276. [Google Scholar] [CrossRef]
  10. Liu, J.; Li, R.; Yang, B. Carbon Dots: A New Type of Carbon-Based Nanomaterial with Wide Applications. ACS Cent. Sci. 2020, 6, 2179–2195. [Google Scholar] [CrossRef]
  11. Omar, N.A.S.; Fen, Y.W.; Irmawati, R.; Hashim, H.S.; Ramdzan, N.S.M.; Fauzi, N.I.M. A Review on Carbon Dots: Synthesis, Characterization and Its Application in Optical Sensor for Environmental Monitoring. Nanomaterials 2022, 12, 2365. [Google Scholar] [CrossRef] [PubMed]
  12. Anuar, N.K.K.; Tan, H.L.; Lim, Y.P.; So’aid, M.S.; Bakar, N.F.A. A Review on Multifunctional Carbon-Dots Synthesized From Biomass Waste: Design/Fabrication, Characterization and Applications. Front. Energy Res. 2021, 9, 686549. [Google Scholar]
  13. Zhou, Y.; Zhang, W.; Leblanc, R.M. Structure−Property−Activity Relationships in Carbon Dots. J. Phys. Chem. B 2022, 126, 10777–10796. [Google Scholar] [CrossRef]
  14. Zhong, Y.; Chen, L.; Yu, S.; Yang, Y.; Liu, X. Advances in Magnetic Carbon Dots: A Theranostics Platform for Fluorescence/Magnetic Resonance Bimodal Imaging and Therapy for Tumors. ACS Biomater. Sci. Eng. 2023, 9, 6548–6566. [Google Scholar] [CrossRef] [PubMed]
  15. Kailasa, S.K.; Koduru, J.R. Perspectives of magnetic nature carbon dots in analytical chemistry: From separation to detection and bioimaging. Trends Environ. Anal. Chem. 2022, 33, e00153. [Google Scholar] [CrossRef]
  16. Klekotka, U.; Zambrzycka-Szelewa, E.; Satula, D.; Kalska-Szostko, B. Stability Studies of Magnetite Nanoparticles in Environmental Solutions. Materials 2021, 14, 5069. [Google Scholar] [CrossRef] [PubMed]
  17. Hu, Y.; Wang, P.; Bunker, C.E.; Teisl, L.R.; Reibold, M.; Yan, S.; Qian, H.; He, D.; Sun, Y.-P. Preparation and optical properties of magnetic carbon/iron oxide hybrid dots. RSC Adv. 2017, 7, 41304–41310. [Google Scholar] [CrossRef]
  18. Stachowska, J.D.; Gamza, M.B.; Mellor, C.; Gibbons, E.N.; Krysmann, M.J.; Kelarakis, A.; Gumieniczek-Chlopek, E.; Straczek, T.; Kapusta, C.; Szwajca, A. Carbon dots/iron oxide nanoparticles with tuneable composition and properties. Nanomaterials 2022, 12, 674. [Google Scholar] [CrossRef]
  19. Xie, R.; Qu, Y.; Tang, M.; Zhao, J.; Chua, S.; Li, T.; Zhang, F.; Wheatley, A.E.H.; Chai, F. Carbon dots-magnetic nanocomposites for the detection and removal of Hg2+. Food Chem. 2021, 364, 130366. [Google Scholar] [CrossRef]
  20. Perelshtein, I.; Perkas, N.; Rahimipour, S.; Gedanken, A. Bifunctional Carbon Dots—Magnetic and Fluorescent Hybrid Nanoparticles for Diagnostic Applications. Nanomaterials 2020, 10, 1384. [Google Scholar] [CrossRef]
  21. Stepanova, M.; Dubavik, A.; Efimova, A.; Konovalova, M.; Svirshchevskaya, E.; Zakharov, V.; Orlova, A. Magneto-Luminescent Nanocomposites Based on Carbon Dots and Ferrite with Potential for Bioapplication. Nanomaterials 2022, 12, 1396. [Google Scholar] [CrossRef] [PubMed]
  22. Yao, Y.-Y.; Gedda, G.; Girma, W.M.; Yen, C.-L.; Ling, Y.-C.; Chang, J.-Y. Magnetofluorescent Carbon Dots Derived from Crab Shell for Targeted Dual-Modality Bioimaging and Drug Delivery. ACS Appl. Mater. Interfaces 2017, 9, 13887–13899. [Google Scholar] [CrossRef]
  23. Wang, H.; Shen, J.; Li, Y.; Wei, Z.; Cao, G.; Gai, Z.; Hong, K.; Banerjee, P.; Zhou, S. Magnetic iron oxide–fluorescent carbon dots integrated nanoparticles for dual-modal imaging, near-infrared light-responsive drug carrier and photothermal therapy. Biomater. Sci. 2014, 2, 915–923. [Google Scholar] [CrossRef]
  24. Liu, X.; Jiang, H.; Ye, J.; Zhao, C.; Gao, S.; Wu, C.; Li, C.; Li, J.; Wang, X. Nitrogen-Doped Carbon Quantum Dot Stabilized Magnetic Iron Oxide Nanoprobe for Fluorescence, Magnetic Resonance, and Computed Tomography Triple-Modal In Vivo Bioimaging. Adv. Funct. Mater. 2016, 26, 8694–8706. [Google Scholar] [CrossRef]
  25. Cao, L.; Anilkumar, P.; Wang, X.; Liu, J.H.; Sahu, S.; Meziani, M.J.; Myers, E.; Sun, Y.-P. Reverse Stern–Volmer Behavior for Luminescence Quenching in Carbon Nanoparticles. Can. J. Chem. 2011, 89, 104–109. [Google Scholar] [CrossRef]
  26. Jessup, R.S. Heats of Combustion of Diamond and of Graphite. J. Res. Nat. Bur. Stand. 1938, 21, 475. [Google Scholar] [CrossRef]
  27. Farivar, F.; Yap, P.L.; Karunagaran, R.U.; Losic, D. Thermogravimetric Analysis (TGA) of Graphene Materials: Effect of Particle Size of Graphene, Graphene Oxide and Graphite on Thermal Parameter. C 2021, 7, 41. [Google Scholar] [CrossRef]
  28. He, H.; Zhong, Y.; Liang, X.; Tan, W.; Zhu, J.; Wang, C.Y. Natural Magnetite: An efficient catalyst for the degradation of organic contaminant. Sci. Rep. 2015, 5, 10139. [Google Scholar] [CrossRef] [PubMed]
  29. Trimm, D.L. Catalytic Combustion (Review). Appl. Catal. 1983, 7, 249–282. [Google Scholar] [CrossRef]
  30. Jones, R.L. Catalytic Combustion Effects in Internal Combustion Engines. Combust. Sci. Tech. 1997, 129, 185–195. [Google Scholar] [CrossRef]
  31. Forzatti, P.; Groppi, G. Catalytic combustion for the production of energy. Catal. Today 1999, 54, 165–180. [Google Scholar] [CrossRef]
  32. Dey, S.; Sun, S.; Mehta, N.S. Carbon monoxide catalytic oxidation over various iron-based nanoparticles at ambient conditions: A Review. Carbon Capture Sci. Technol. 2021, 1, 100013. [Google Scholar] [CrossRef]
  33. Monazam, E.R.; Breault, R.W.; Siriwardane, R. Kinetics of Magnetite (Fe3O4) Oxidation to Hematite (Fe2O3) in Air for Chemical Looping Combustion. Ind. Eng. Chem. Res. 2014, 53, 13320. [Google Scholar] [CrossRef]
  34. Smiltens, J. The Standard Free Energy of Oxidation of Magnetite to Hematite at Temperatures above 1000°. J. Am. Chem. Soc. 1957, 79, 4877–4880. [Google Scholar] [CrossRef]
  35. Zheng, H.; Schenk, J.; Spreitzer, D.; Wolfinger, T.; Daghagheleh, O. Review on the Oxidation Behaviors and Kinetics of Magnetite in Particle Scale. Steel Res. Int. 2021, 92, 2000687. [Google Scholar] [CrossRef]
  36. Jingyan, S.; Yuwen, L.; Zhiyong, W.; Cunxin, W. Investigation of thermal decomposition of ascorbic acid by TG-FTIR and thermal kinetics analysis. J. Pharm. Biomed. Anal. 2013, 77, 116–119. [Google Scholar] [CrossRef] [PubMed]
  37. Vernin, G.; Chakib, S.; Rogacheva, S.M.; Obretenov, T.D.; Parkanyi, C. Thermal decomposition of ascorbic acid. Carbohydr. Res. 1997, 305, 1–15. [Google Scholar] [CrossRef]
  38. Rahmawati, S.; Bundjali, B. Kinetics of the Oxidation of Vitamin C. Indo. J. Chem. 2012, 12, 291. [Google Scholar] [CrossRef]
  39. Yin, X.; Chen, K.; Cheng, H.; Chen, X.; Feng, S.; Song, Y.; Liang, L. Chemical Stability of Ascorbic Acid Integrated into Commercial Products: A Review on Bioactivity and Delivery Technology. Antioxidants 2022, 11, 153. [Google Scholar] [CrossRef]
  40. Lerdkanchanaporn, S.; Dollimore, D.; Alexander, K.S. A Thermal Analysis Study of Ascorbic Acid and Its Pharmaceutical Formulations, A Consideration of Time-Temperature Plots. J. Therm. Anal. 1997, 49, 887–896. [Google Scholar] [CrossRef]
  41. Yadav, R.A.; Rani, P.; Kumar, M.; Singh, R.; Singh, P.; Singh, N.P. Experimental IR and Raman spectra and quantum chemical studies of molecular structures, conformers and vibrational characteristics of L-ascorbic acid and its anion and cation. Spectrochim. Acta Part A Mol. Biomol. Spectrosc. 2011, 84, 6–21. [Google Scholar] [CrossRef] [PubMed]
  42. Sun, H.; Guihong, X.; He, D.; Zhang, L. Ascorbic acid promoted magnetite Fenton degradation of alachlor: Mechanistic insights and kinetic modeling. Appl. Catal. B Environ. 2020, 267, 118383. [Google Scholar] [CrossRef]
  43. Usman, M.; Monfort, O.; Haderlein, S.; Hanna, K. Enhancement of Pentachlorophenol Removal in a Historically Contaminated Soil by Adding Ascorbic Acid to H2O2/Magnetite System. Catalysts 2021, 11, 331. [Google Scholar] [CrossRef]
  44. Hou, X.; Huang, X.; Li, M.; Zhang, Y.; Yuan, S.; Ai, Z.; Zhao, J.; Zhang, L. Fenton oxidation of organic contaminants with aquifer sediment activated by ascorbic acid. Chem. Eng. J. 2018, 348, 255–262. [Google Scholar] [CrossRef]
  45. Hakim, A.; Marliza, T.S.; Tahari, N.M.A.; Isahak, R.W.N.W.; Yusop, T.M.; Hisham, W.M.M.; Yarmo, A.M. Studies on CO2 Adsorption and Desorption Properties from Various Types of Iron Oxides (FeO, Fe2O3, and Fe3O4). Ind. Eng. Chem. Res. 2016, 55, 7888. [Google Scholar] [CrossRef]
  46. Kumar, S.; Drozd, V.; Durygin, A.; Saxena, S.K. Capturing CO2 Emissions in the Iron Industries using a Magnetite–Iron Mixture. Energy Technol. 2016, 4, 560. [Google Scholar] [CrossRef]
  47. Mendoza, E.Y.M.; Santos, A.S.; Lopez, E.V.; Drozd, V.; Durygin, A.; Chen, J.; Saxena, S.K. Iron oxides as efficient sorbents for CO2 capture. J. Mater. Res. Technol. 2019, 8, 2944–2956. [Google Scholar] [CrossRef]
  48. Mirabella, F.; Zaki, E.; Ivars-Barcelo, F.; Schauermann, S.; Shaikhutdinov, S. CO2 Adsorption on Magnetite Fe3O4(111). J. Phys. Chem. C 2018, 122, 27433. [Google Scholar] [CrossRef]
  49. Santos-Carballal, D.; Roldan, A.; Dzade, N.Y.; de Leeuw, N.H. Reactivity of CO2 on the surfaces of magnetite (Fe3O4), greigite (Fe3S4) and mackinawite (FeS). Phil. Trans. R. Soc. A 2018, 376, 20170065. [Google Scholar] [CrossRef] [PubMed]
  50. Heuer, J.K.; Stubbins, J.F. An XPS characterization of FeCO3 films from CO2 corrosion. Corr. Sci. 1999, 41, 1231–1243. [Google Scholar] [CrossRef]
  51. Barker, R.; Burkle, D.; Charpentier, T.; Thompson, H.; Neville, A. A review of iron carbonate (FeCO3) formation in the oil and gas industry. Corr. Sci. 2018, 142, 312–341. [Google Scholar] [CrossRef]
  52. Lewis, W.K.; Rumchik, C.G.; Smith, M.J.; Fernando, K.S.; Crouse, C.A.; Spowart, J.E.; Guliants, E.A.; Bunker, C.E. Comparison of post-detonation combustion in explosives incorporating aluminum nanoparticles: Influence of the passivation layer. J. Appl. Phys. 2013, 113, 044907. [Google Scholar] [CrossRef]
  53. Fernando, K.S.; Smith, M.J.; Harruff, B.A.; Lewis, W.K.; Guliants, E.A.; Bunker, C.E. Sonochemically assisted thermal decomposition of alane N, N-dimethylethylamine with titanium (IV) isopropoxide in the presence of oleic acid to yield air-stable and size-selective aluminum core−shell nanoparticles. J. Phys. Chem. C 2009, 113, 500. [Google Scholar] [CrossRef]
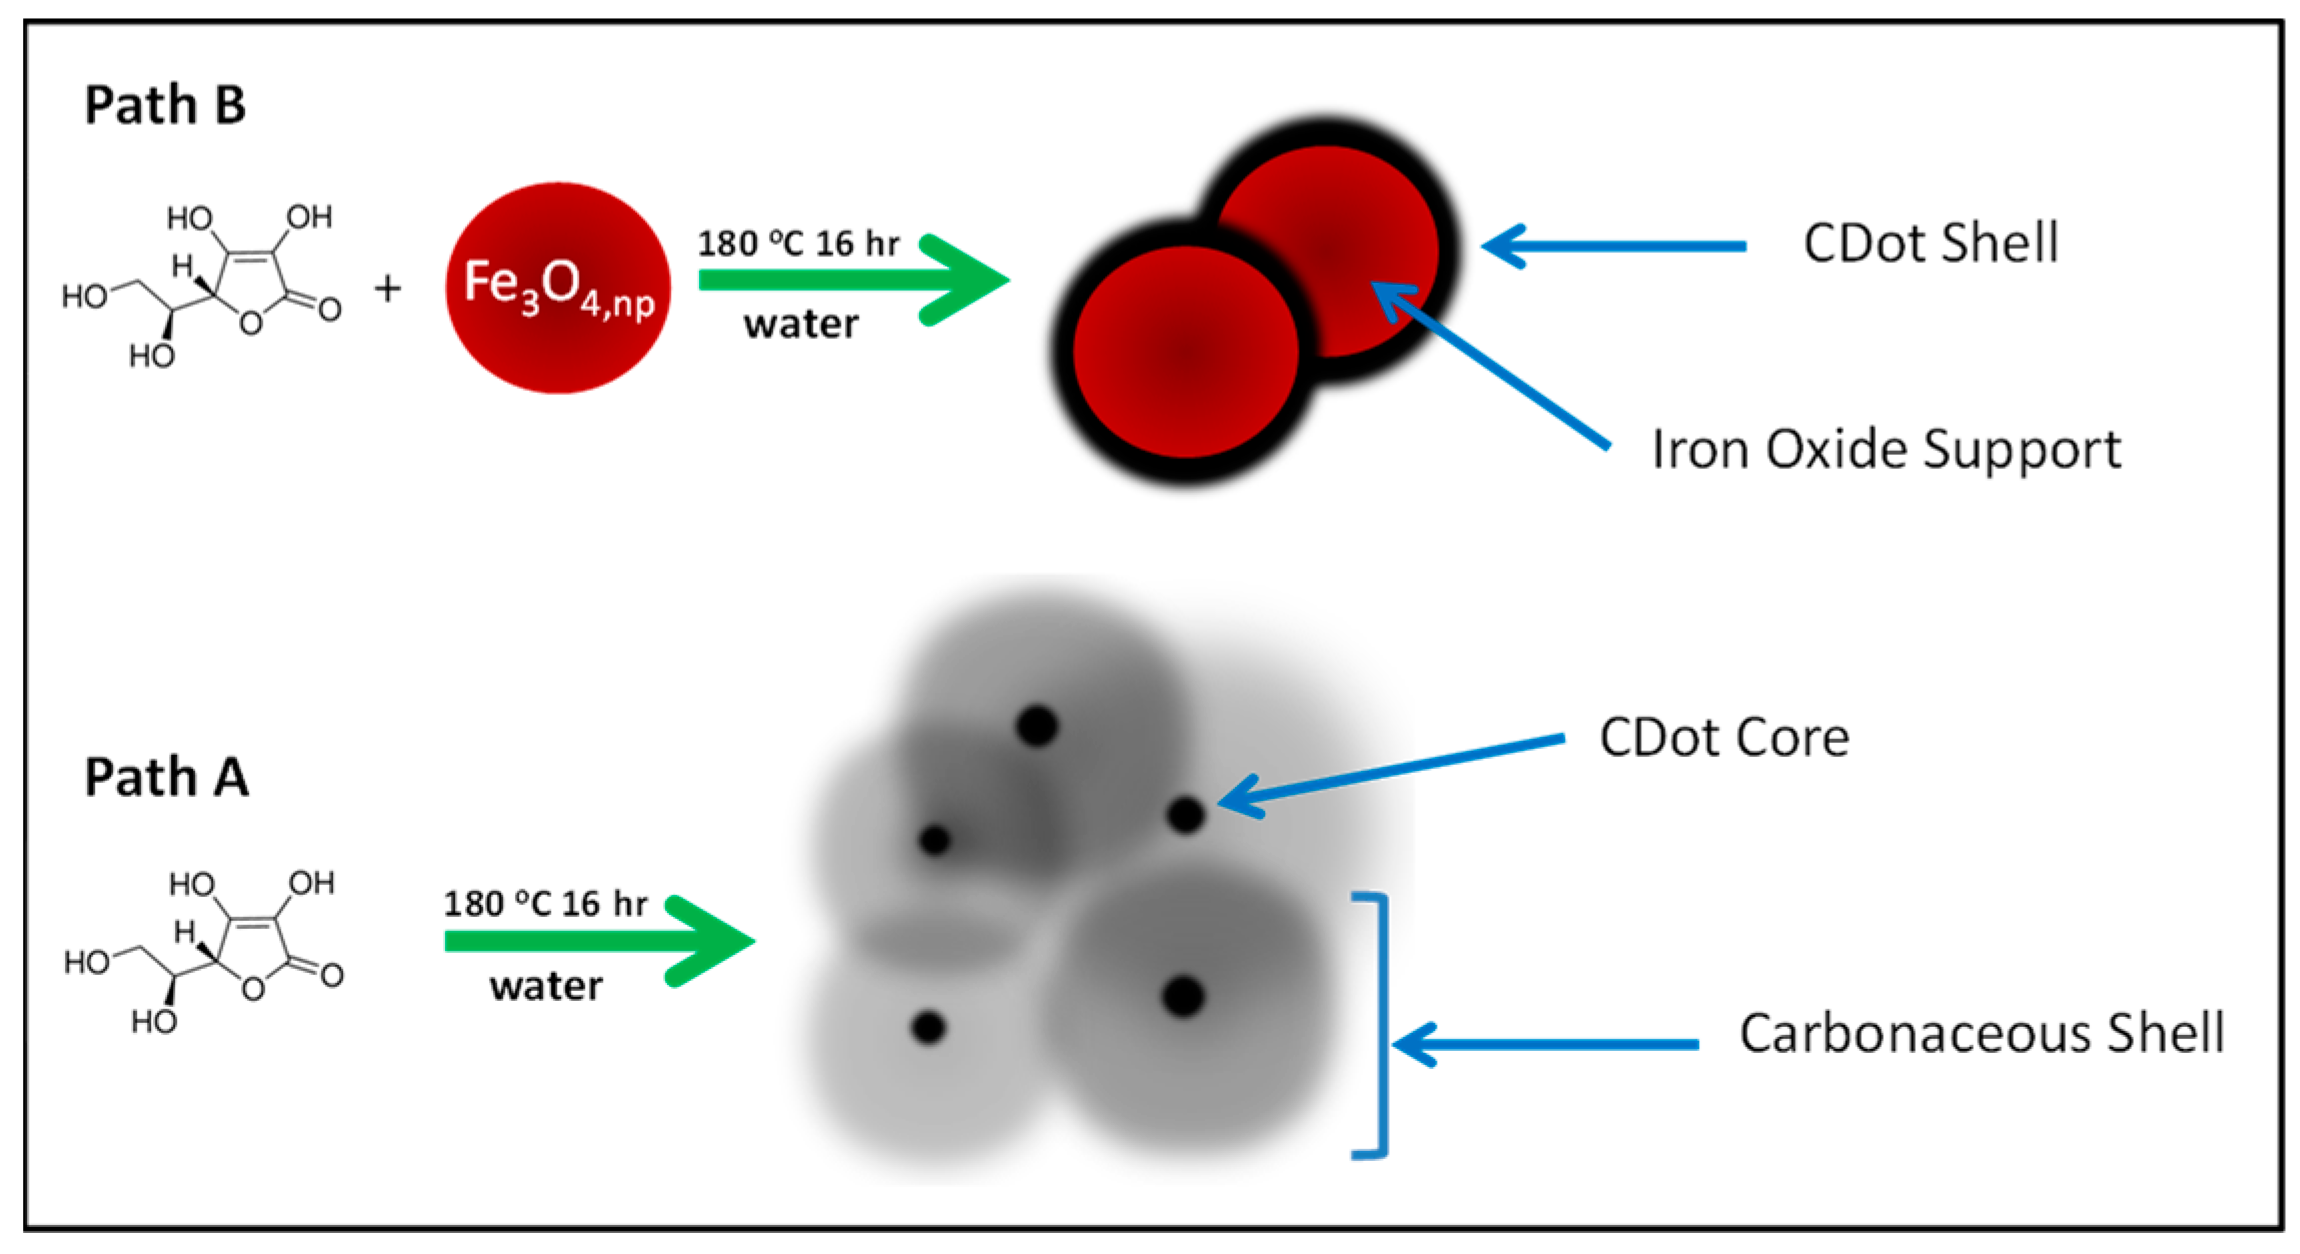
Scheme 1. Reaction scheme for the synthesis of CDot and CDot–magnetite nanoparticles along with a cartoon representation of the potential structures. (Path A) suggests the formation of small, emissive CDots within a larger carbon structure. (Path B) indicates CDot’s synthesis onto the surface of the magnetite substrate.
Crystals 14 00520 sch001
Figure 1. Characterization data for the CDot and CDot–magnetite samples obtained using UV–vis absorption and fluorescence spectroscopies. Fluorescence spectra were recorded for CDot ((I), λex 360–420), and CDot–magnetite ((II), λex 360–440) samples. The excitation wavelengths for the recorded spectra are blue—360, red—380, green—400, pink—420, and dark green—440 nm.
Crystals 14 00520 g001
Figure 2. AFM images for CDot (A,B) and CDot–magnetite (D,E) obtained at two separate concentrations. The short white bars indicate a cross-section analysis; the results for the CDots are shown in (C) and those for CDot–magnetite are shown in (F). CDots measure at FWHM as ~90, 65, and 65 nm for sections 1, 2, and 3, respectively. CDot–magnetite measured at FWHM at 70, 70, and 55 for sections 1, 2, and 3, respectively. Also shown is the AFM image of the commercial magnetite (G), and an image scan for the blank Si wafer (H) with a scaled height that is comparable to the lowest CDots.
Crystals 14 00520 g002
Figure 3. Characterization data for the CDot and CDot–magnetite samples obtained using FTIR spectroscopy. FTIR spectra are for CDot (I) and CDot–magnetite (II) samples. Significant features are labeled for reference.
Crystals 14 00520 g003
Figure 4. DSC/TGA data. (a) DCS/TGA data obtained for the CDot (top), CDot–magnetite (middle), and CDot–magnetite–dialysis (bottom) samples. The y axis labels represent all three plots. The temperatures listed represent the maximum temperature for each plot. (b) Expanded view of the DSC/TGA data obtained for the CDot–magnetite sample shown in (a). The gray dashed vertical line indicates the point at which the temperature reverses direction; the arrows indicate the regions that are impacted by the reversed temperature.
Crystals 14 00520 g004
Figure 5. XRD spectra obtained for the CDot–magnetite sample (green) and the post-DSC material (red). Standard pattern A is for magnetite (Fe3O4), and standard pattern B is for hematite (Fe2O3). The image inset is of the crucible following a DSC analysis of the CDot–magnetite sample and represents the red spectrum.
Crystals 14 00520 g005
Figure 6. DSC/TGA data. (a) DCS/TGA data for CDot sample (top, repeated for reference) compared to mixtures of CDot and magnetite (middle) and ascorbic acid and magnetite (bottom). The y axis labels represent all three plots. The listed temperatures correspond to the maximum of the observed features. (b) Expanded view of the DSC/TGA data obtained for the ascorbic acid and magnetite mixed sample shown in (a). The dashed gray line indicates the point at which the temperature reversed direction. The inset image shows the state of the post-DCS ascorbic acid and magnetite mix sample inside the crucible.
Crystals 14 00520 g006
Disclaimer/Publisher’s Note: The statements, opinions and data contained in all publications are solely those of the individual author(s) and contributor(s) and not of MDPI and/or the editor(s). MDPI and/or the editor(s) disclaim responsibility for any injury to people or property resulting from any ideas, methods, instructions or products referred to in the content.