Article

Effect of Ultrasonic Shot Peening on Microstructure and Corrosion Properties of GTA-Welded 304L Stainless Steel

1
Department of Materials Science and Engineering, Andong National University, 1375 Gyeongdong-ro, Andong 36729, Republic of Korea
2
Materials Research Centre for Energy and Clean Technology, Andong National University, 1375 Gyeongdong-ro, Andong 36729, Republic of Korea
*
Author to whom correspondence should be addressed.
Crystals 2024, 14(6), 531; https://doi.org/10.3390/cryst14060531
Submission received: 8 May 2024 / Revised: 28 May 2024 / Accepted: 30 May 2024 / Published: 4 June 2024
(This article belongs to the Special Issue Plastic Deformation and Welding on Metallic Materials)

Abstract

:
Austenitic stainless steels used in structural applications suffer from stress corrosion cracking due to residual stresses during welding. Much research is being conducted to prevent the stress corrosion cracking of austenitic steels by inducing compressive residual stresses. One method is ultrasonic shot peening (USP), which is used to apply compressive stress by modifying the mechanical properties of the material’s surface. In this study, 304L stainless steel was butt-welded by gas tungsten arc welding (GTAW) and subsequently subjected to compressive residual stress to a depth of 1 mm from the surface by a USP treatment. The influence of USP on microstructural changes in the base metal, the HAZ and weldment, and the corrosion properties was analyzed. A microstructural analysis was conducted using SEM-EDS, XRD, and EBSD methods alongside residual stress measurements. The surface and cross-sectional corrosion behavior was evaluated and analyzed using a potentiodynamic polarization test, electrochemical impedance spectroscopy (EIS) measurements, a double-loop electrochemical potentiokinetic reactivation (DL-EPR) test, and an ASTM A262 Pr. C test. The surface was deformed and roughened by the USP. The deformed areas formed crevices, and the inside of the crevices contained some cracks. The crevices and internal cracks caused pitting, which reduced the resistance of the passivation film. The cross-section was subjected to compressive residual stress to a depth of 1 mm from the surface, and the outermost area of the cross-section had fine grain refinement, forming a solid passivation film that improved the corrosion resistance.

1. Introduction

Austenitic stainless steel has excellent corrosion resistance, heat resistance, and mechanical properties (strength and toughness) and a good weldability, so it is widely used in nuclear power plants, agriculture, boiler heat exchangers, households, and the petrochemical, automotive, and other industries. When austenitic stainless steels are used as structural materials, they are joined by welding, and intergranular corrosion or stress corrosion cracking may occur in the heat-affected zone near the weld. Stress corrosion cracking is a failure that occurs occasionally in austenitic stainless steels and is dependent on three factors: the corrosive environment, the tensile stress, and the material in which the corrosion occurs [1,2].
Residual stresses are distributed in the welded joints of stainless steel due to the steel’s low thermal conductivity and high coefficient of linear expansion, and near heat sources, the residual stresses are sufficient to cause stress corrosion cracking. Many techniques have been utilized to prevent stress corrosion cracking, including microstructure modifications, alloy design, the removal of corrosive agents, and compressive stress induction [3,4]. The induction of compressive residual stresses can effectively prevent stress corrosion cracking and slow crack growth in austenitic steels; it has been widely studied, with shot peening (SP) [5,6], laser shock peening (LSP) [7,8], water jet peening (WJP) [9], ultrasonic shot peening [10,11,12], and ultrasonic nanocrystalline surface modification (UNSM) [4,13] being the most used methods.
We recently analyzed and reported the effects of laser shock peening (LSP) on the microstructure [14] and corrosion properties [15] of 304L stainless steel. The main findings are summarized below: LSP resulted in surface roughness and grain refinement in the outermost areas, and an increased dislocation density inside the weld [14].
The LSP-induced corrosion properties were characterized by the grain refinement, which increased the grain boundary in the peening areas; the sensitization; and the intergranular corrosion rate [14,15]. The cross-section of the LSP-treated steel was characterized by the improved passive film resistance due to the delay in the initiation and propagation of cracks and pits under the influence of compressive residual stress and grain refinement [14,15]. LSP is known to improve the fatigue life and reduce stress corrosion cracking, but the process is expensive, it has a low productivity, and its operation requires installation and environmental constraints [11]. On the other hand, peening with ultrasonic waves offers advantages such as a high productivity, a low cost, mobility due to the lightweight components, multiple positions, and a cleaner working environment [11].
USP is a technology that involves applying compressive stress to the surface of a material by modifying its mechanical properties [16]. The USP method uses ultrasonic waves to move and impact a ball (metal, glass, ceramic, etc.) at a very high speed against the surface of the material, causing plastic deformation and changing the tensile stress acting on the surface of the material to compressive stress. USP can extend the fatigue lifespan, depending on the material properties and types of the projectiles [17]. Studies have shown that ultrasonic peening improves the metallurgical and mechanical properties of the material, which can increase the fatigue strength and extend the fatigue life of steel structures [12,16,18,19].
It has been reported that the severe plastic deformation of austenitic stainless steels by USP forms a nanocrystalline layer on the surface, reduces the passive current density, and increases the corrosion resistance due to grain refinement and the volume fraction of modified induced martensite [20]. Previous studies have shown that USP technology also provides a high resistance to stress corrosion cracking (SCC) [21,22]. Research on ultrasonic shot peening has been conducted by applying compressive residual stresses of up to 450 μm from the surface, which increases the high dislocation density due to slippage and results in grain refinement [23,24]. In the case of Al alloys, the USP treatment has been reported to reduce the grain size in the surface layer, resulting in an increase in the grain boundary area and a decrease in the number of atomic hydrogens trapped per unit length of the grain boundary. The fine-grained layer increased the hydrogen embrittlement resistance of the alloy [25].
The components used in nuclear power plants are often fabricated by welding, but the residual stresses in the welds are not always removed by a post-weld heat treatment (PWHT). Residual stresses can cause SCC, and recent studies have been conducted to increase the SCC resistance by inducing compressive residual stresses using a USP treatment [14,15]. However, these studies did not evaluate the microstructure and corrosion properties from applying compressive residual stresses to a depth of 1 mm from the surface. In this study, GTAW butt welds were made on 304L stainless steel used for nuclear power plant components. The surface of the base metal and the weld were USP-treated to induce compressive residual stresses at distances greater than 1 mm from the surface, and the effects on the microstructural changes and corrosion properties were studied.

2. Experimental Methods
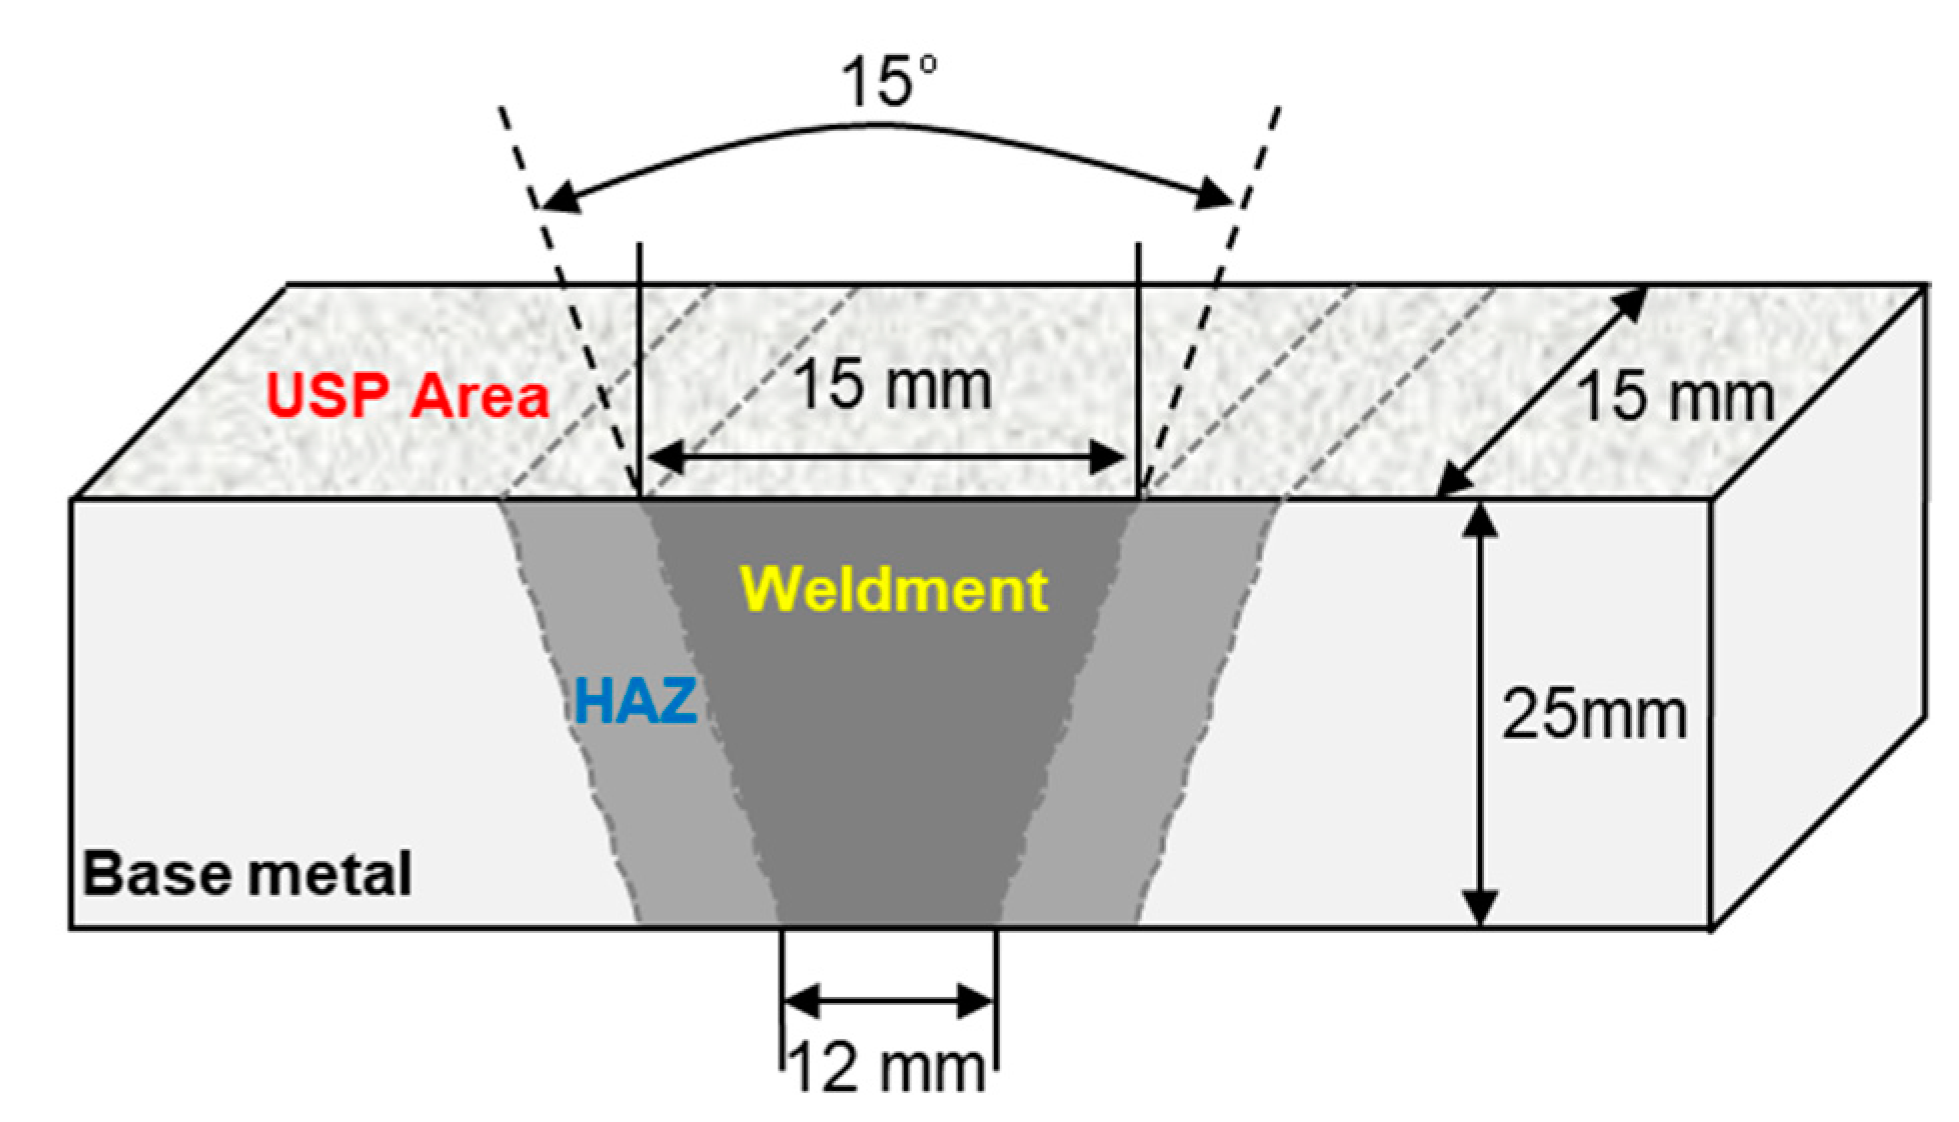
2.1. Specimen

Commercial 304L stainless steel (designated as 304LB) was used as the main material in this study [14]. The joining process of specimens was executed using the GTAW technique, labelling the welded specimens as 304LW [14]. Table 1 shows the detailed chemical composition of the base material and the ER308L filler metal used in this study. The thickness of the base material was 25 mm and the groove angle was 15° for the welding process. The parameters applied in the welding process are detailed in Table 2. Many variables were considered in this study, and a summary of the specimens, including the heat-affected zone (HAZ), is presented in Table 3. Figure 1 is a schematic diagram of the base metal, HAZ, and the weld components for visual reference.

2.2. Ultrasonic Shot Peening (USP) Treatment

The USP process utilized technology from SONATS in France [26]. The peening conditions were performed at a frequency of 20 kHz, a media diameter of 4 mm, an amplitude of 70 μm, a peening time of 3 min, and a coverage rate >100%. Figure 2 shows the USP schematic diagram [16,27] and Table 4 provides the detailed peening conditions. USP is a method of peening surfaces by transmitting ultrasonic vibrations to the media. The specimen was set up with the area to be peened facing downwards and impacted on the surface of the medium in the chamber to produce a shot-peened specimen.

2.3. Microscopic Observations

To observe their microstructure, the specimens were polished using #2000 SiC paper and 3 µm diamond paste. They were etched using an electrolytic etcher (AXIOTECH 100 HD, ZEISS, Oberkochen, Germany) in a 10% oxalic acid solution and the microstructure was observed. A 3D microscope (VK-X3000, Keyence, Itasca, IL, USA) was used to analyze the surface of the peened specimens. To thoroughly analyze the effect of peening, cross-sections of the specimens were machined on an IM 4000 (Hitachi, Tokyo, Japan) ion milling machine and analyzed by electron backscattered diffraction (EBSD, Oxford Instruments, Bognor Regis, UK) using a field-emission scanning electron microscope (FE-SEM, MIRA3 XMH, Tescan, Brno, Czech Republic). The step size for the EBSD analysis was 0.3 μm [14].

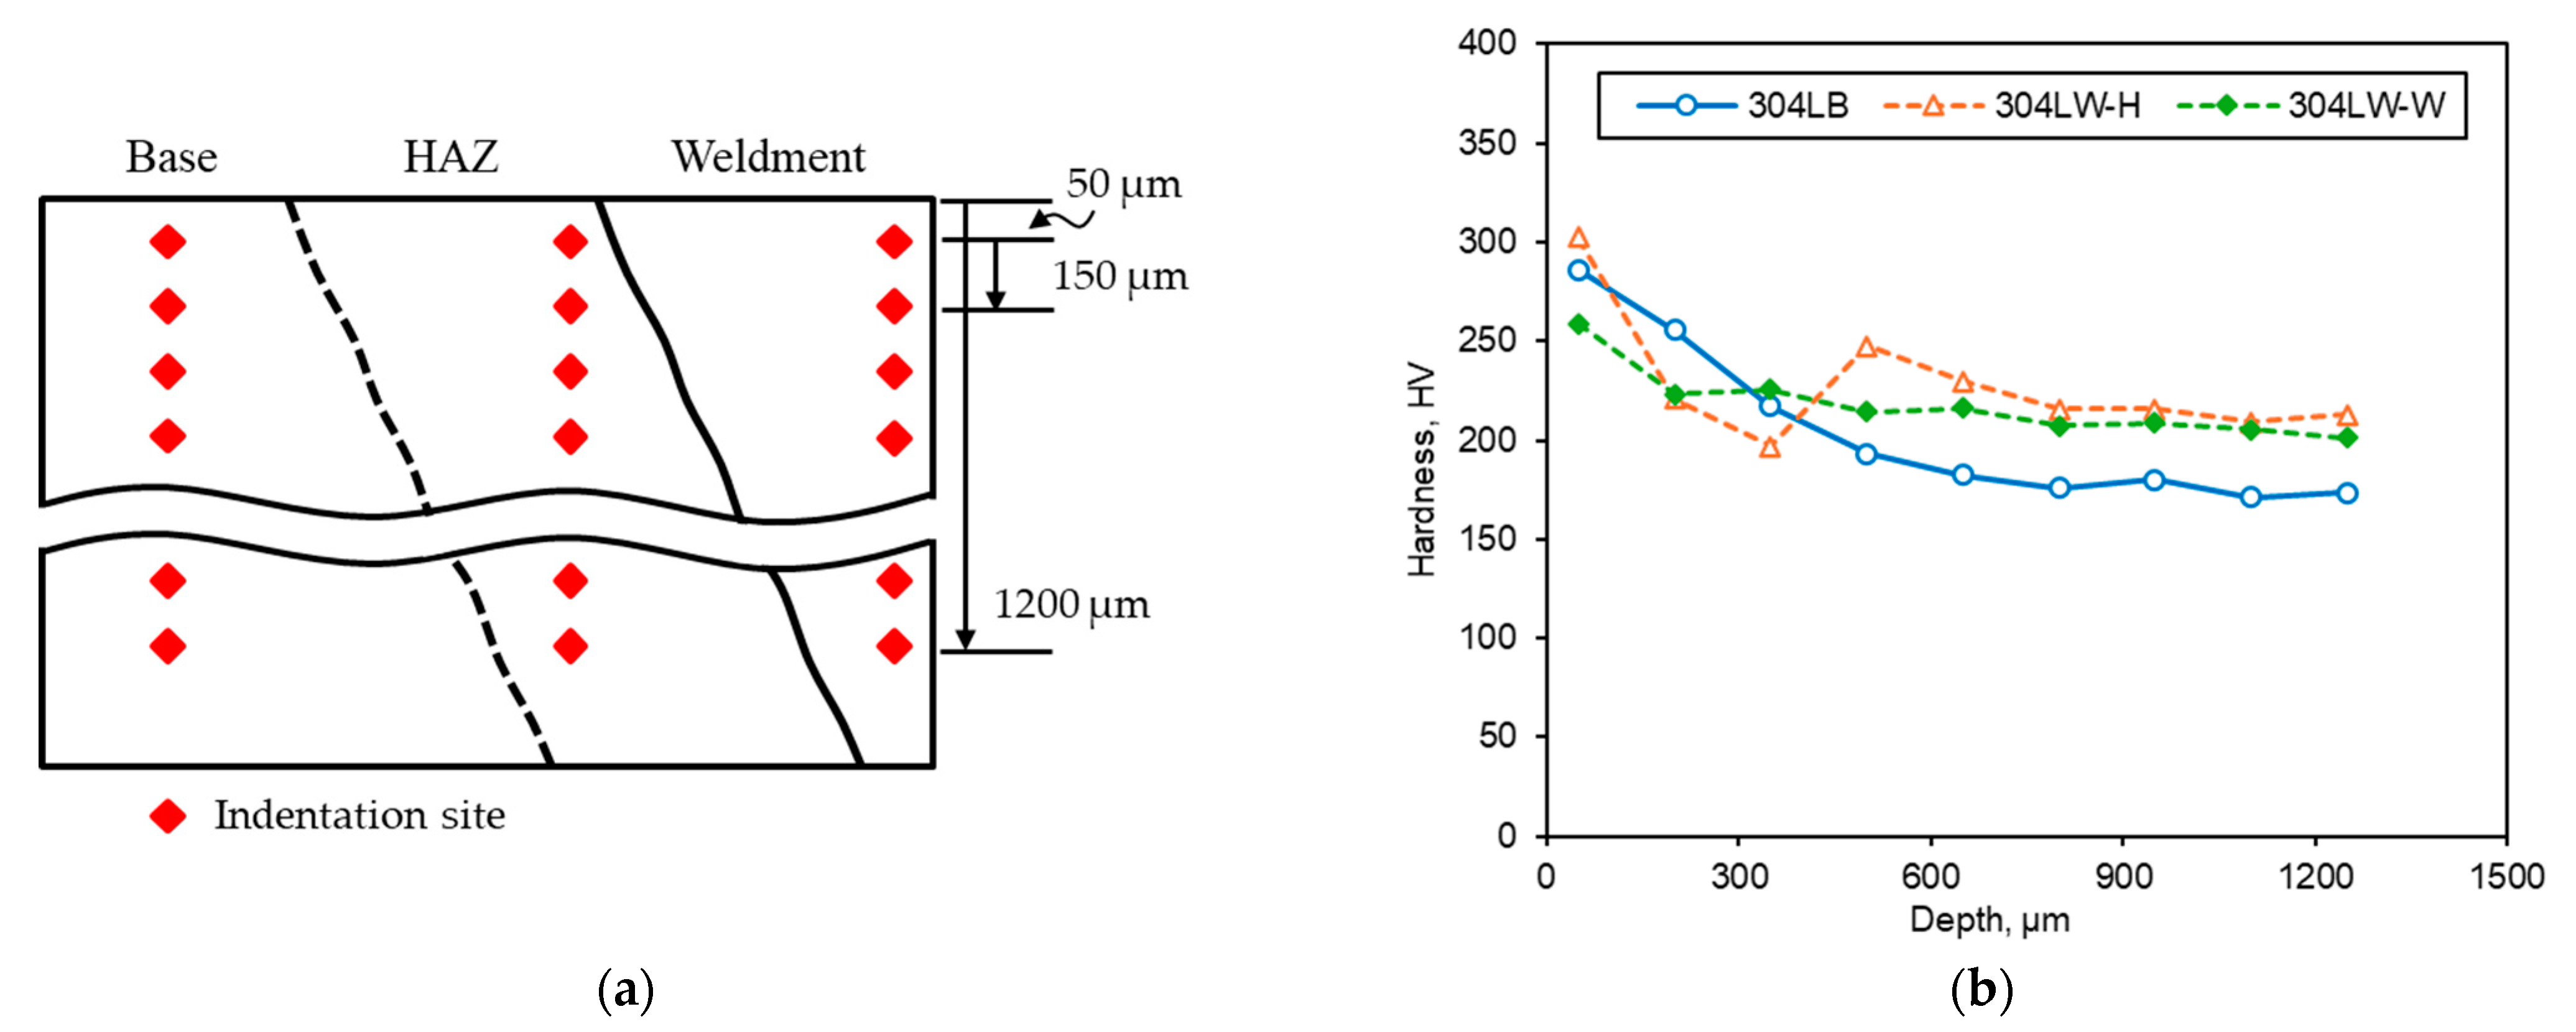
2.4. Hardness Measurement

The hardness was measured using a Vickers hardness tester (Mitutoyo, HV-100, Tokyo, Japan). The specimens were polished using SiC paper up to #2000 and then 3 μm of diamond paste was applied to achieve a mirror-like surface finish. The applied load for the hardness measurement was set to 1 kg and the hardness was measured sequentially from 50 μm below the outermost surface of the specimen at 150 μm intervals. A total of nine measurements were made at a maximum depth of 1250 μm.

2.5. Corrosion Tests

All the specimens used for the electrochemical tests were electrically connected and fixed with epoxy resin. A potentiostat (Interface 1000, Gamry Instruments, Warminster, PA, USA) was used for electrochemical measurements. The exposed specimen area was 0.09 cm2. To evaluate the corrosion properties, a potentiodynamic polarization test and an EIS test were performed in a 1% NaCl solution (de-aerated at a rate of 200 mL N2/min for 30 min) at 30 °C. The potentiodynamic polarization test [28] was performed at a scan rate of 0.33 mV/s and a potential of 100 mV below the corrosion potential, while the EIS test [29] was performed at the corrosion potential with a frequency range of 0.01 to 10,000 Hz. To detect the susceptibility to intergranular attack, DL-EPR [30] and ASTM A262 Pr.C tests [31] were conducted. The test specimen was aged at 675 °C for 1 h [15]. The DL-EPR test was performed using a mixed solution (de-aerated at a rate of 200 mL N2/min for 30 min.) of 0.5 M H2SO4 and 0.01 M KSCN at 30 °C, based on the ASTM G108 standard [30], while the modified ASTM A262 Pr. C test was performed by immersion in 65% nitric acid (HNO3) at the boiling point [31].

2.6. Residual Stress Measurement

The surface residual stresses were obtained using the hole-drilling method (RS-200 Assembly, VMM, Raleigh, NC, USA). A strain gauge (CEA-06-062UL-12, VMM, Raleigh, NC, USA) was attached to the specimen and holes were made using a drilling device. The residual stresses released during the drilling were then measured.

3. Results and Discussion

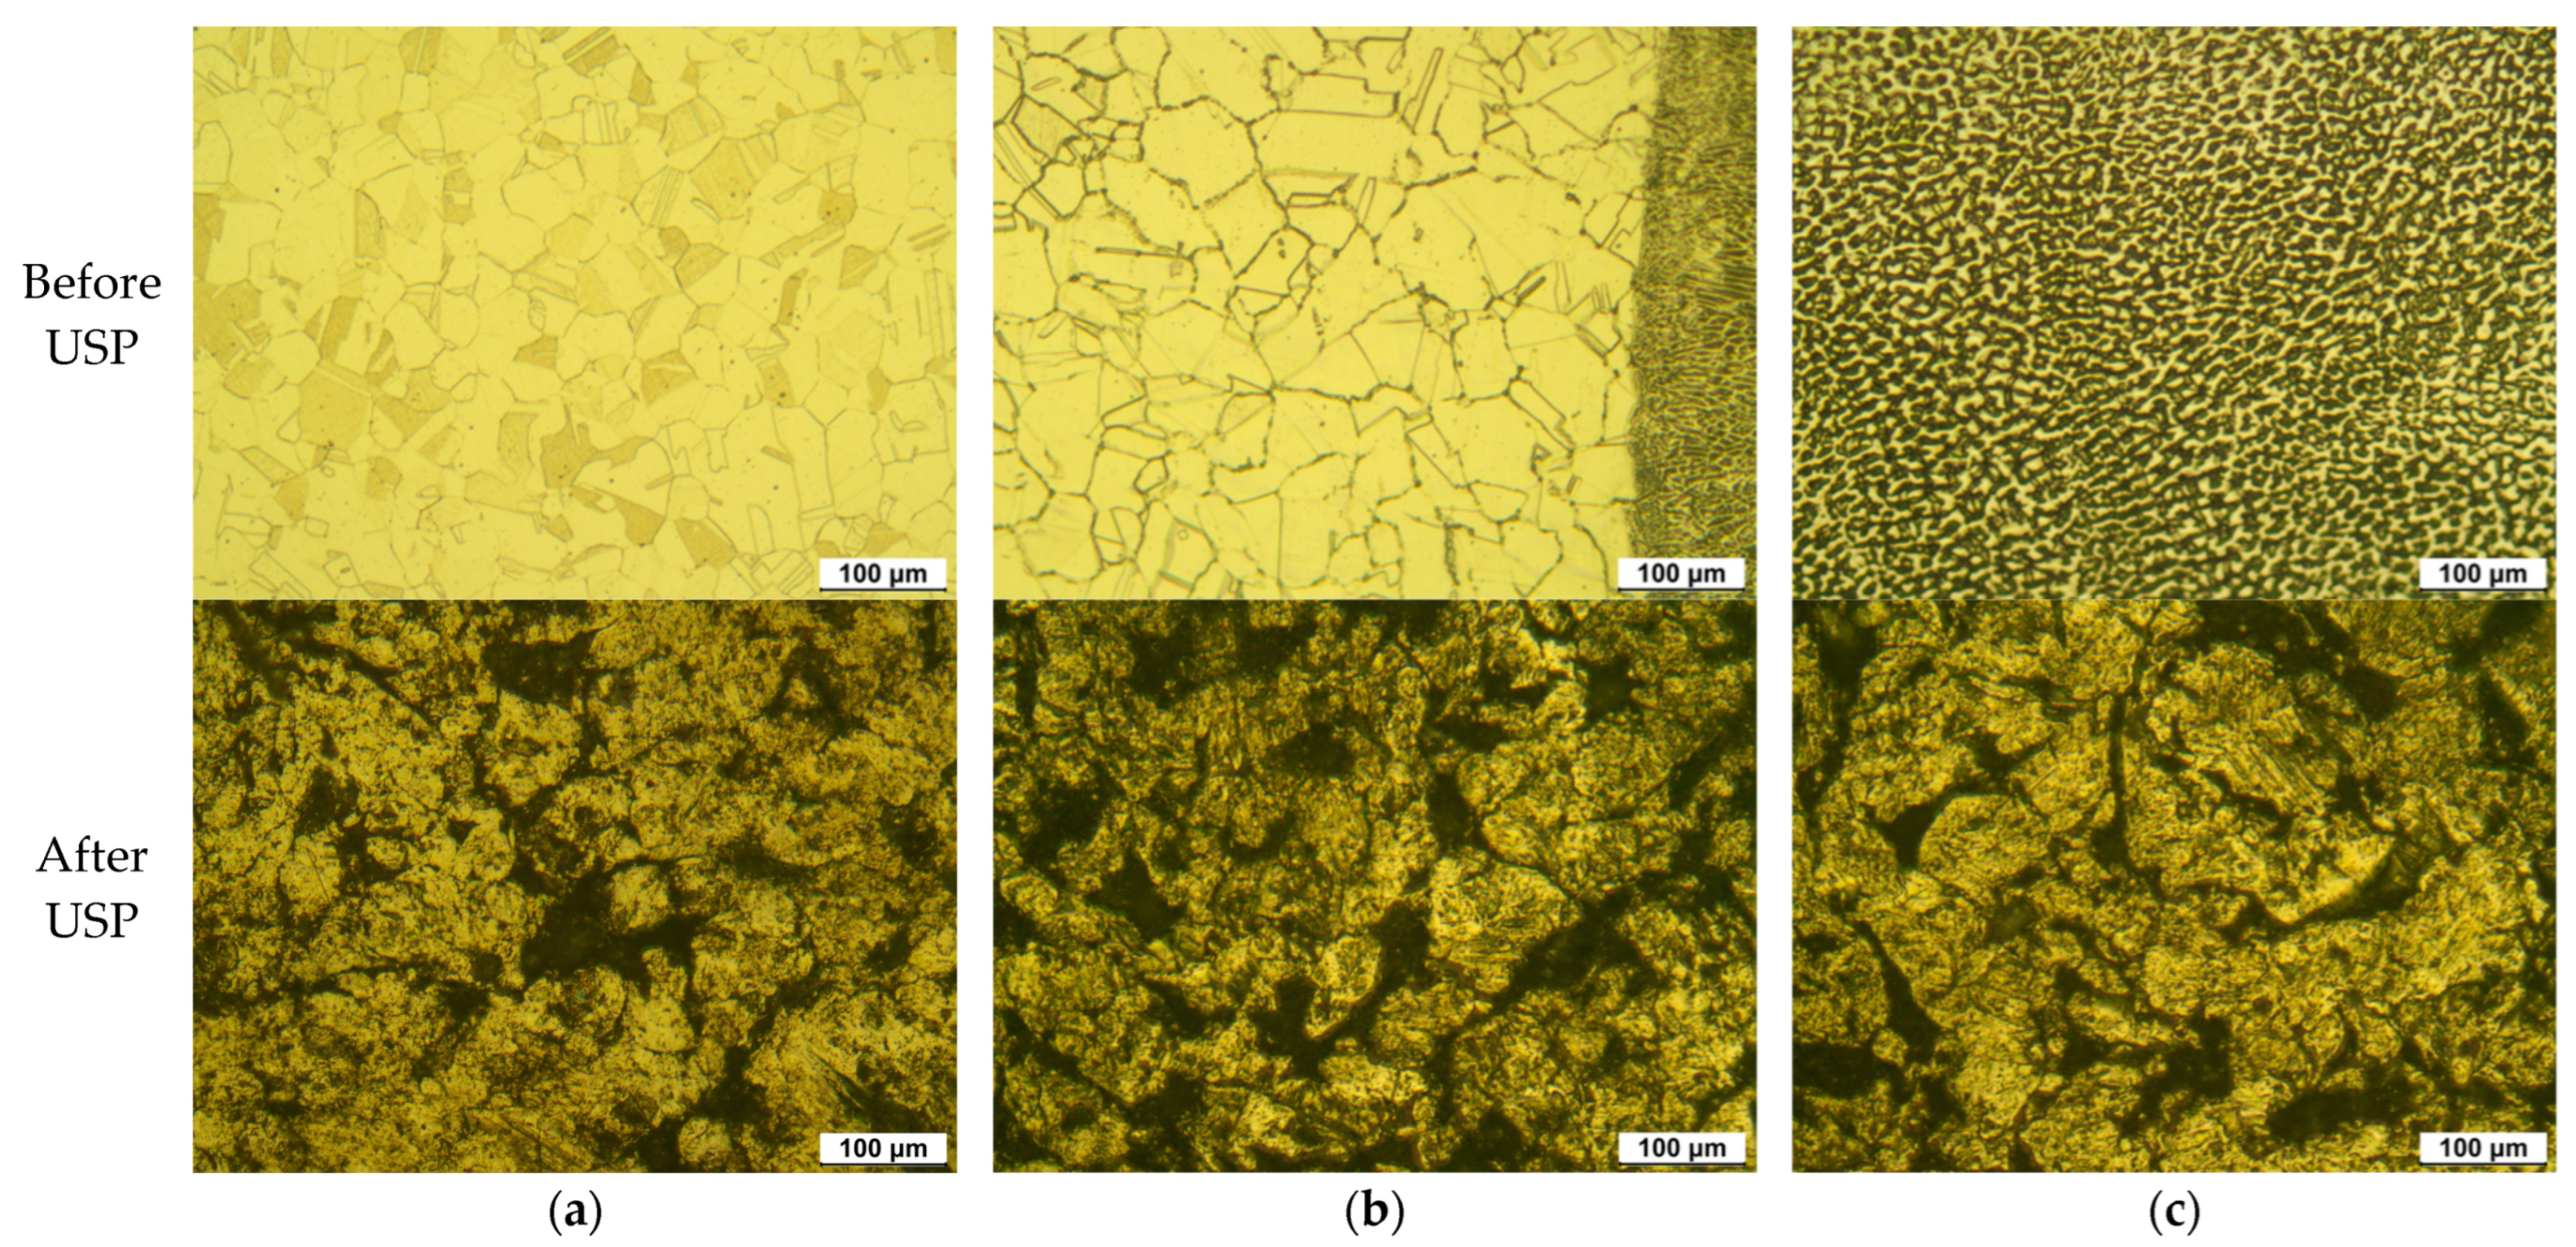
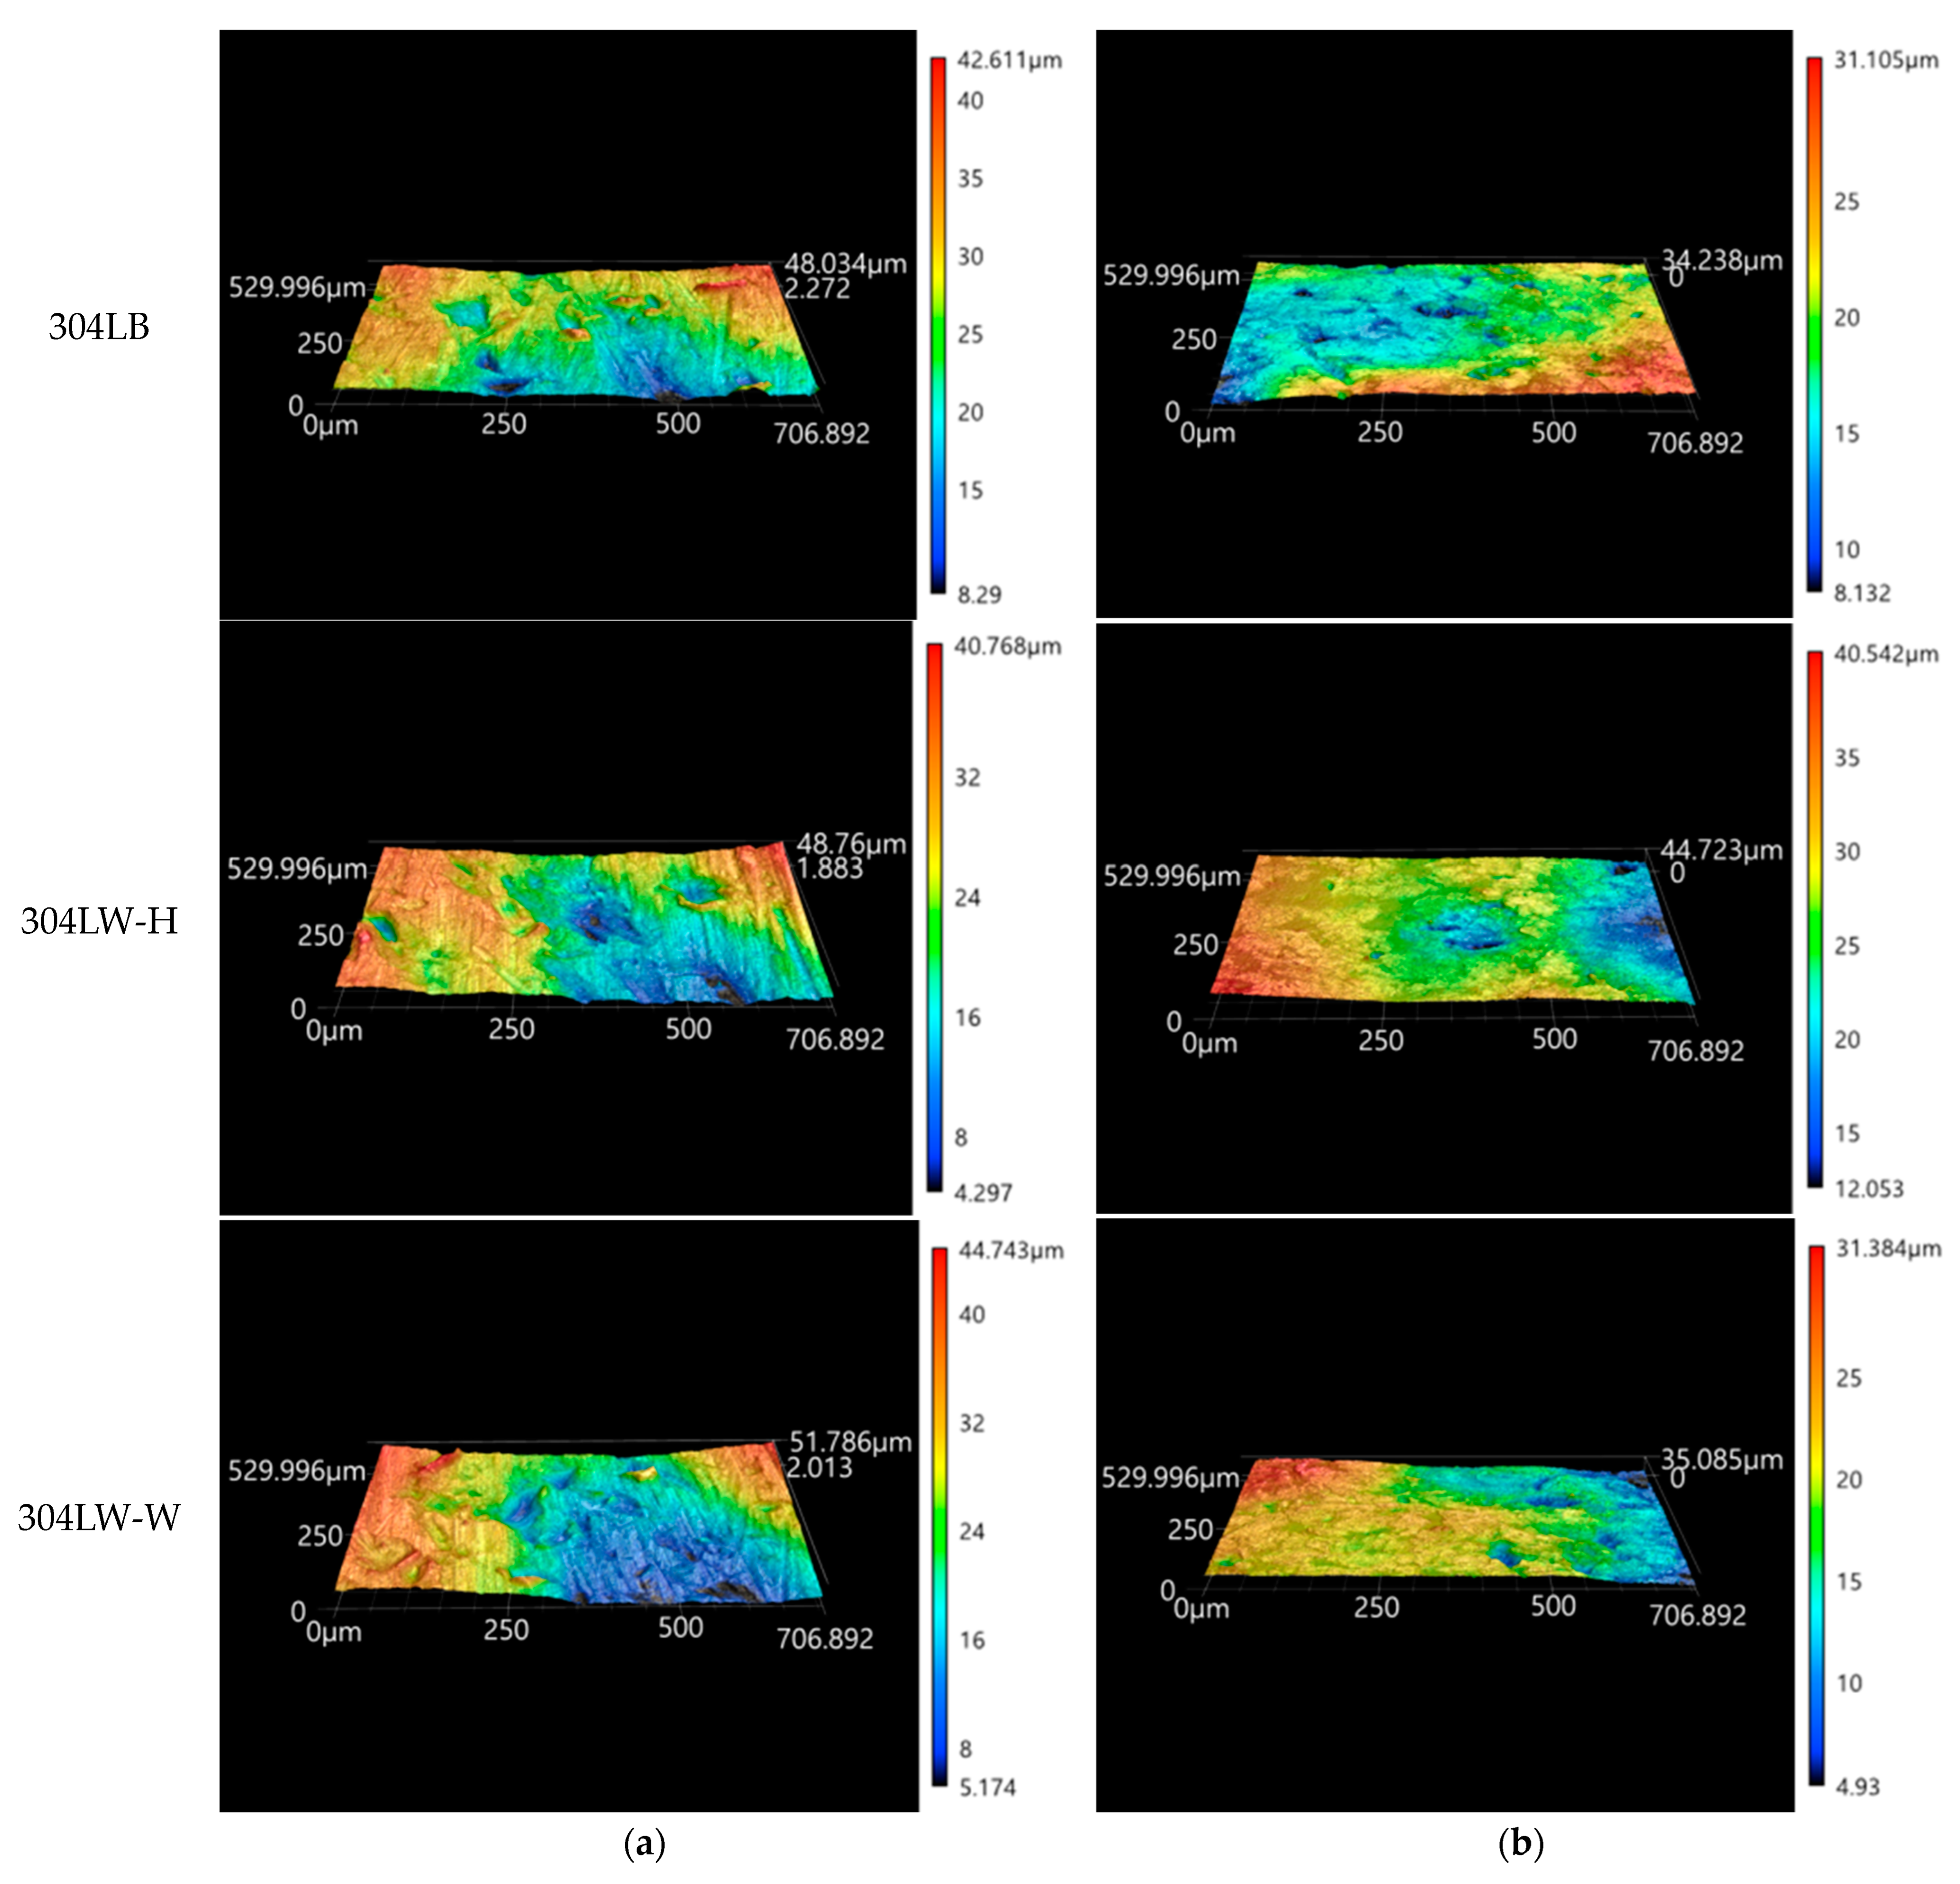
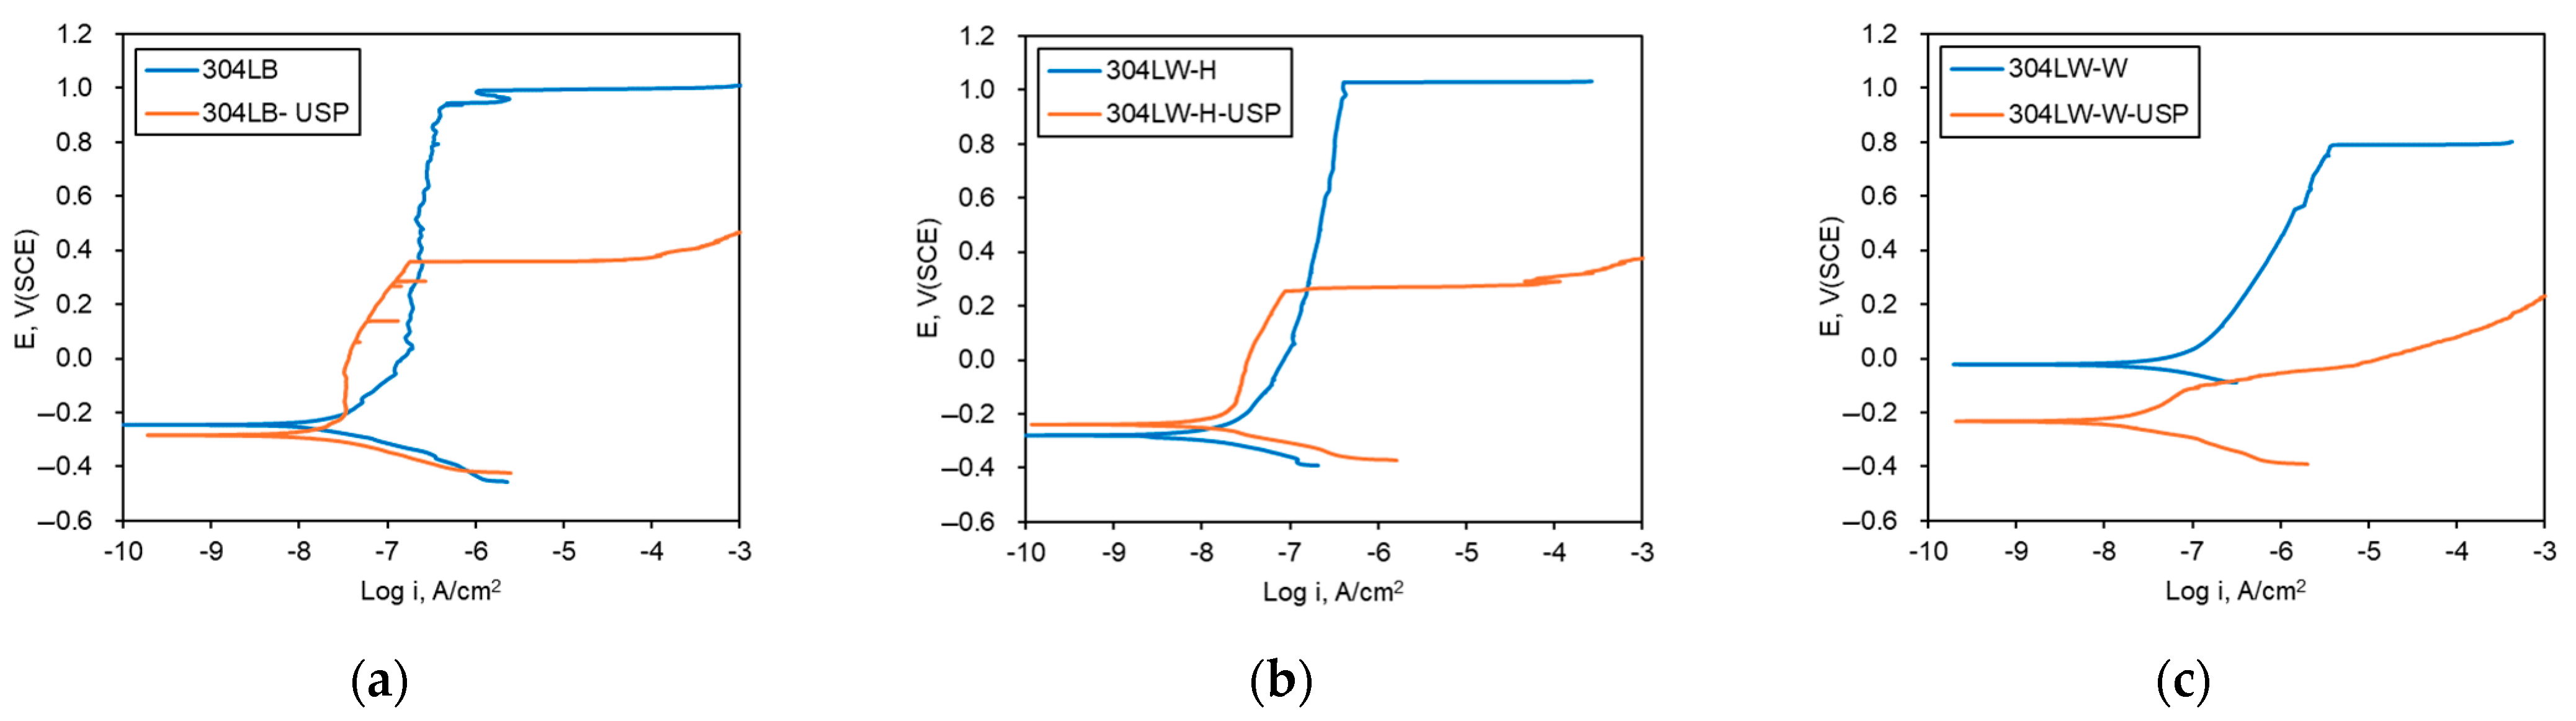
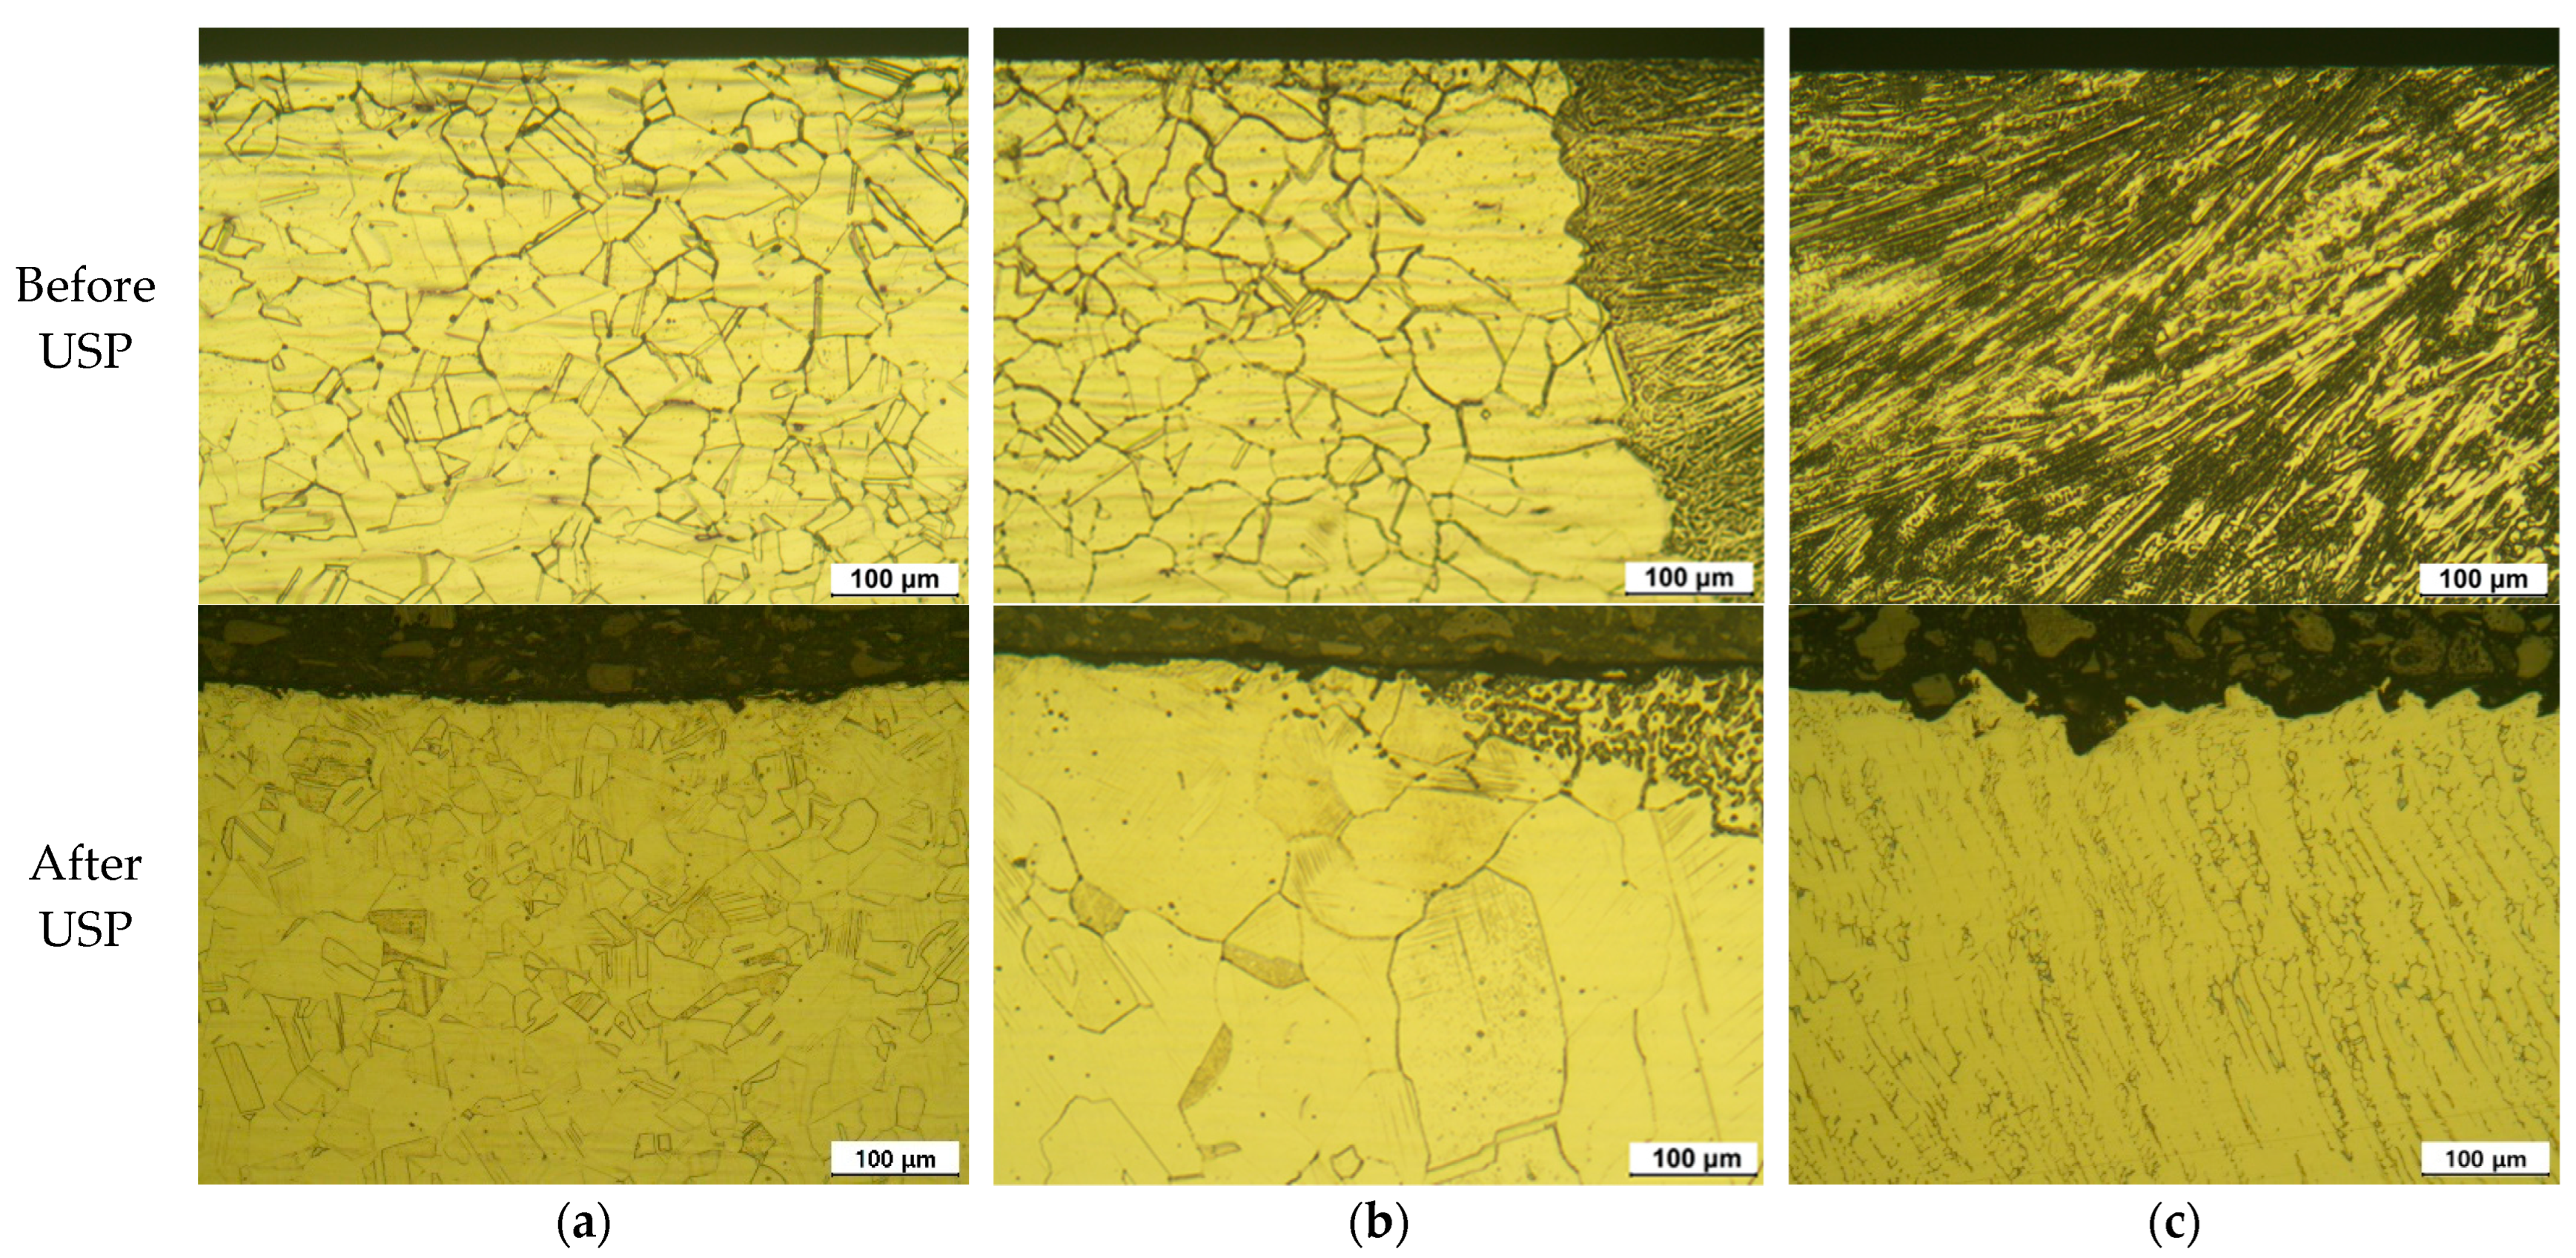
3.1. Effect of USP on the Microstructure and Corrosion of the Surface of 304L Stainless Steel

Figure 3 shows the residual stress measurement results of the base metal and weldment (HAZ and weldment) of 304L stainless steel after USP by the hole-drilling method, as described in the literature [15]. After USP, compressive residual stresses were generated in the transverse X-axis and longitudinal Y-axis of the base metal and welds (HAZ and weldment) up to a depth of 1 mm from the surface. These results show that a USP treatment is a feasible peening technique for reactor internal components [21]. The compressive residual stresses in the base metal and weldment decreased with the depth from the surface, but occurred down to the 1 mm area. The magnitude of the compressive residual stresses in the base metal and weldment caused by the USP treatment decreased with depth from the surface, but these compressive residual stresses were present to depths greater than 1 mm. On the other hand, the contour of the compressive residual stress in the HAZ was a little different from those of the base metal and weldment. This may be attributed to the microstructural changes caused by welding and USP [15,21], as discussed below.
Figure 4 shows the surface microstructure of 304L stainless steel after USP. Figure 4a shows the austenitic microstructure of the 304L base metal, and some roughness caused by deformation occurred on the surface after ultrasonic peening. Figure 4b shows the HAZ microstructure of the 304L weld. It was observed that the grain size of the HAZ was increased by welding, and the roughness due to surface deformation increased after ultrasonic peening. Figure 4c shows the dual phase of the weld due to the precipitation of delta ferrite during GTAW welding, and the surface after ultrasonic peening showed increased roughness due to deformation. After ultrasonic peening, the base metal and weldment (HAZ and weldment) became rough due to surface deformation, and the HAZ and weldment showed an increased roughness [14].
Figure 5 shows the surface of the 304L stainless steel observed under a 3D microscope after the USP treatment. The roughness is the arithmetic mean value of the surface roughness value, measured as the average absolute deviation from the mean line based on the surface profile. Figure 5a shows the specimen before peening, in which all the areas show a surface with some scratches resulting from the machining. The analysis of the 3D model showed that the roughness was 4.96 μm for 304LB, 5.70 μm for 304LW-H, and 4.45 μm for 304LW-W. Figure 5b shows the surface with the deformation and shape differences. Regardless of the area, a slightly uneven surface was observed in the 3D model after USP. The analysis of the 3D model showed that the roughness was 3.39 μm for 304LB-USP, 3.44 μm for 304LW-H-USP, and 3.79 μm for 304LW-W-USP. After peening, mechanical deformation was clearly visible on the surface, and the roughness increased in the order of the base material, HAZ, and the weldment [14,32].
Figure 6 shows the SEM analysis of the surface of the 304L stainless steel after the USP treatment. Figure 6a shows the surface of the base metal after peening, with visible crevices in the areas deformed by the mechanical wave (arrows in the SEM image). Figure 6b depicts the surface of the HAZ after the peening treatment, with increased deformed areas and crevices. Figure 6c reveals the weld surface after peening, which shows that the wave-deformed area had a rough shape and the occurrence of crevices increased. After peening, the welds (HAZ and weld) showed increased surface deformation and an increased number of crevices, and the crevices contained cracks, which were considered to affect the development of pits. The surface also exhibited a mechanically overlapped shape, as craters are created by ball impacts and peaks and valleys are created by repeated impacts [32]. These shapes act as crevices and show characteristics similar to LSP and UNSM [14].
Figure 7 shows the microstructural characteristics of the 304L stainless steel analyzed by XRD. Figure 7a shows 304LB, which mainly consisted of the austenite (γ) phase (α-ferrite: ca. 3.1%). The 304LB-USP showed an austenitic (γ) phase, and the surface modification by USP resulted in a change in which martensite (α’) was observed (α + α’: ca. 8.4%) [20,22]. According to Mordyuk et al., the formation of α’ is observed first in the surface layer and then in deeper layers, and the ratio of this phenomenon is expected to be less than 10% [20]. The weldment in Figure 7b consisted mainly of the austenite (γ) phase and about 10.4% of the ferrite (α) phase. The 304LW-USP also showed the α’formation (α + α’: about 15.3%) due to surface deformation, which was observed along with α inside the weldment [20,22].
Figure 8 shows the polarization curves (de-aerated 1% NaCl at 30 °C) of the 304L stainless steel surface after USP, showing the polarization characteristics of (a) the base metal, (b) the heat-affected zone, and (c) the welded zone. As shown in Figure 8a, the transpassive potential of the 304L base metal was 935 mV (SCE), while the pitting potential of the 304LB-USP was 356 mV (SCE), indicating a significant reduction in the pitting potential after peening. The passive current density measured at 0 mV (SCE) was lower for 304LB-USP, and the difference was not significant. Figure 8b presents the polarization curve for the heat-affected zone, which shows that the transpassive potential of 304LW-H was equal to 1030 mV (SCE), while the pitting potential of the 304LW-H-USP after USP was 254 mV (SCE). This indicates a significant decrease in the pitting potential after peening. The passive current density measured at 0 mV (SCE) was slightly lower for the 304LW-H-USP, but there was no significant difference. Figure 8c shows the polarization results for the weldment. The pitting potential of 304LW-W was 789 mV (SCE), while the pitting potential of 304LW-W-USP was significantly reduced to −115 mV (SCE) after peening. The passive current density measured at 0 mV (SCE) was approximately 200 mV (SCE) lower for the 304LW-W-USP. The surface of the 304L stainless steel had reduced polarization properties as a result of the USP treatment. As shown in Figure 6, crevices were formed on the surface in the areas deformed by peening. There were cracks inside the crevice, which were considered to be the cause of the pitting corrosion [33].
The quantitative values of the polarization behavior are shown in Table 5. Table 5 shows the corrosion potential, the pitting potential, the transpassive potential, and the corrosion current density of the surface of 304L stainless steel.
Figure 9 shows the EIS measurement results for the base metal and the weldment surfaces of 304L stainless steel after USP. The polarization resistance (Rp) and solution resistance (Rs) were calculated using the equivalent circuit of the Randles model [29]. The passive film resistivity of the base metal surface after peening was 473.7 kΩ for 304LB and 139.6 kΩ for 304LB-USP, and the resistance of the passive film was reduced by the USP treatment. After peening, the Rp on the weldment surface was 717.0 kΩ for 304LW-W and 210.2 kΩ for 304LW-W-USP, which showed that the USP treatment reduced the resistance of the passive film. The EIS measurement results for the base metal and weldment surface showed similar trends to the polarization test results. The resistivity of the passive film was reduced by the USP treatment. The USP treatment deformed the surface and created crevices, including cracks. This was considered to reduce the resistance of the passive film. Table 6 shows the fitting parameters obtained from the Nyquist plot (Figure 9a) on the surface of the 304L stainless steel. A CPE is often used instead of an ideal double-layer capacitor to account for the non-ideal capacitance of an actively corroding electrode, and its impedance is given by the following: ZCPE = (Y)−1()n, where Y is the admittance (S cm−2 sn), ω is the angular frequency (rad s−1),  j is the imaginary number,  j2 = (−1), and n is a dimensionless fraction exponent (−1 < n < +1) [34,35]. Table 6 includes the fitting results with an average relative error for each parameter < 10.00% and a χ2 of 0.001–0.05.

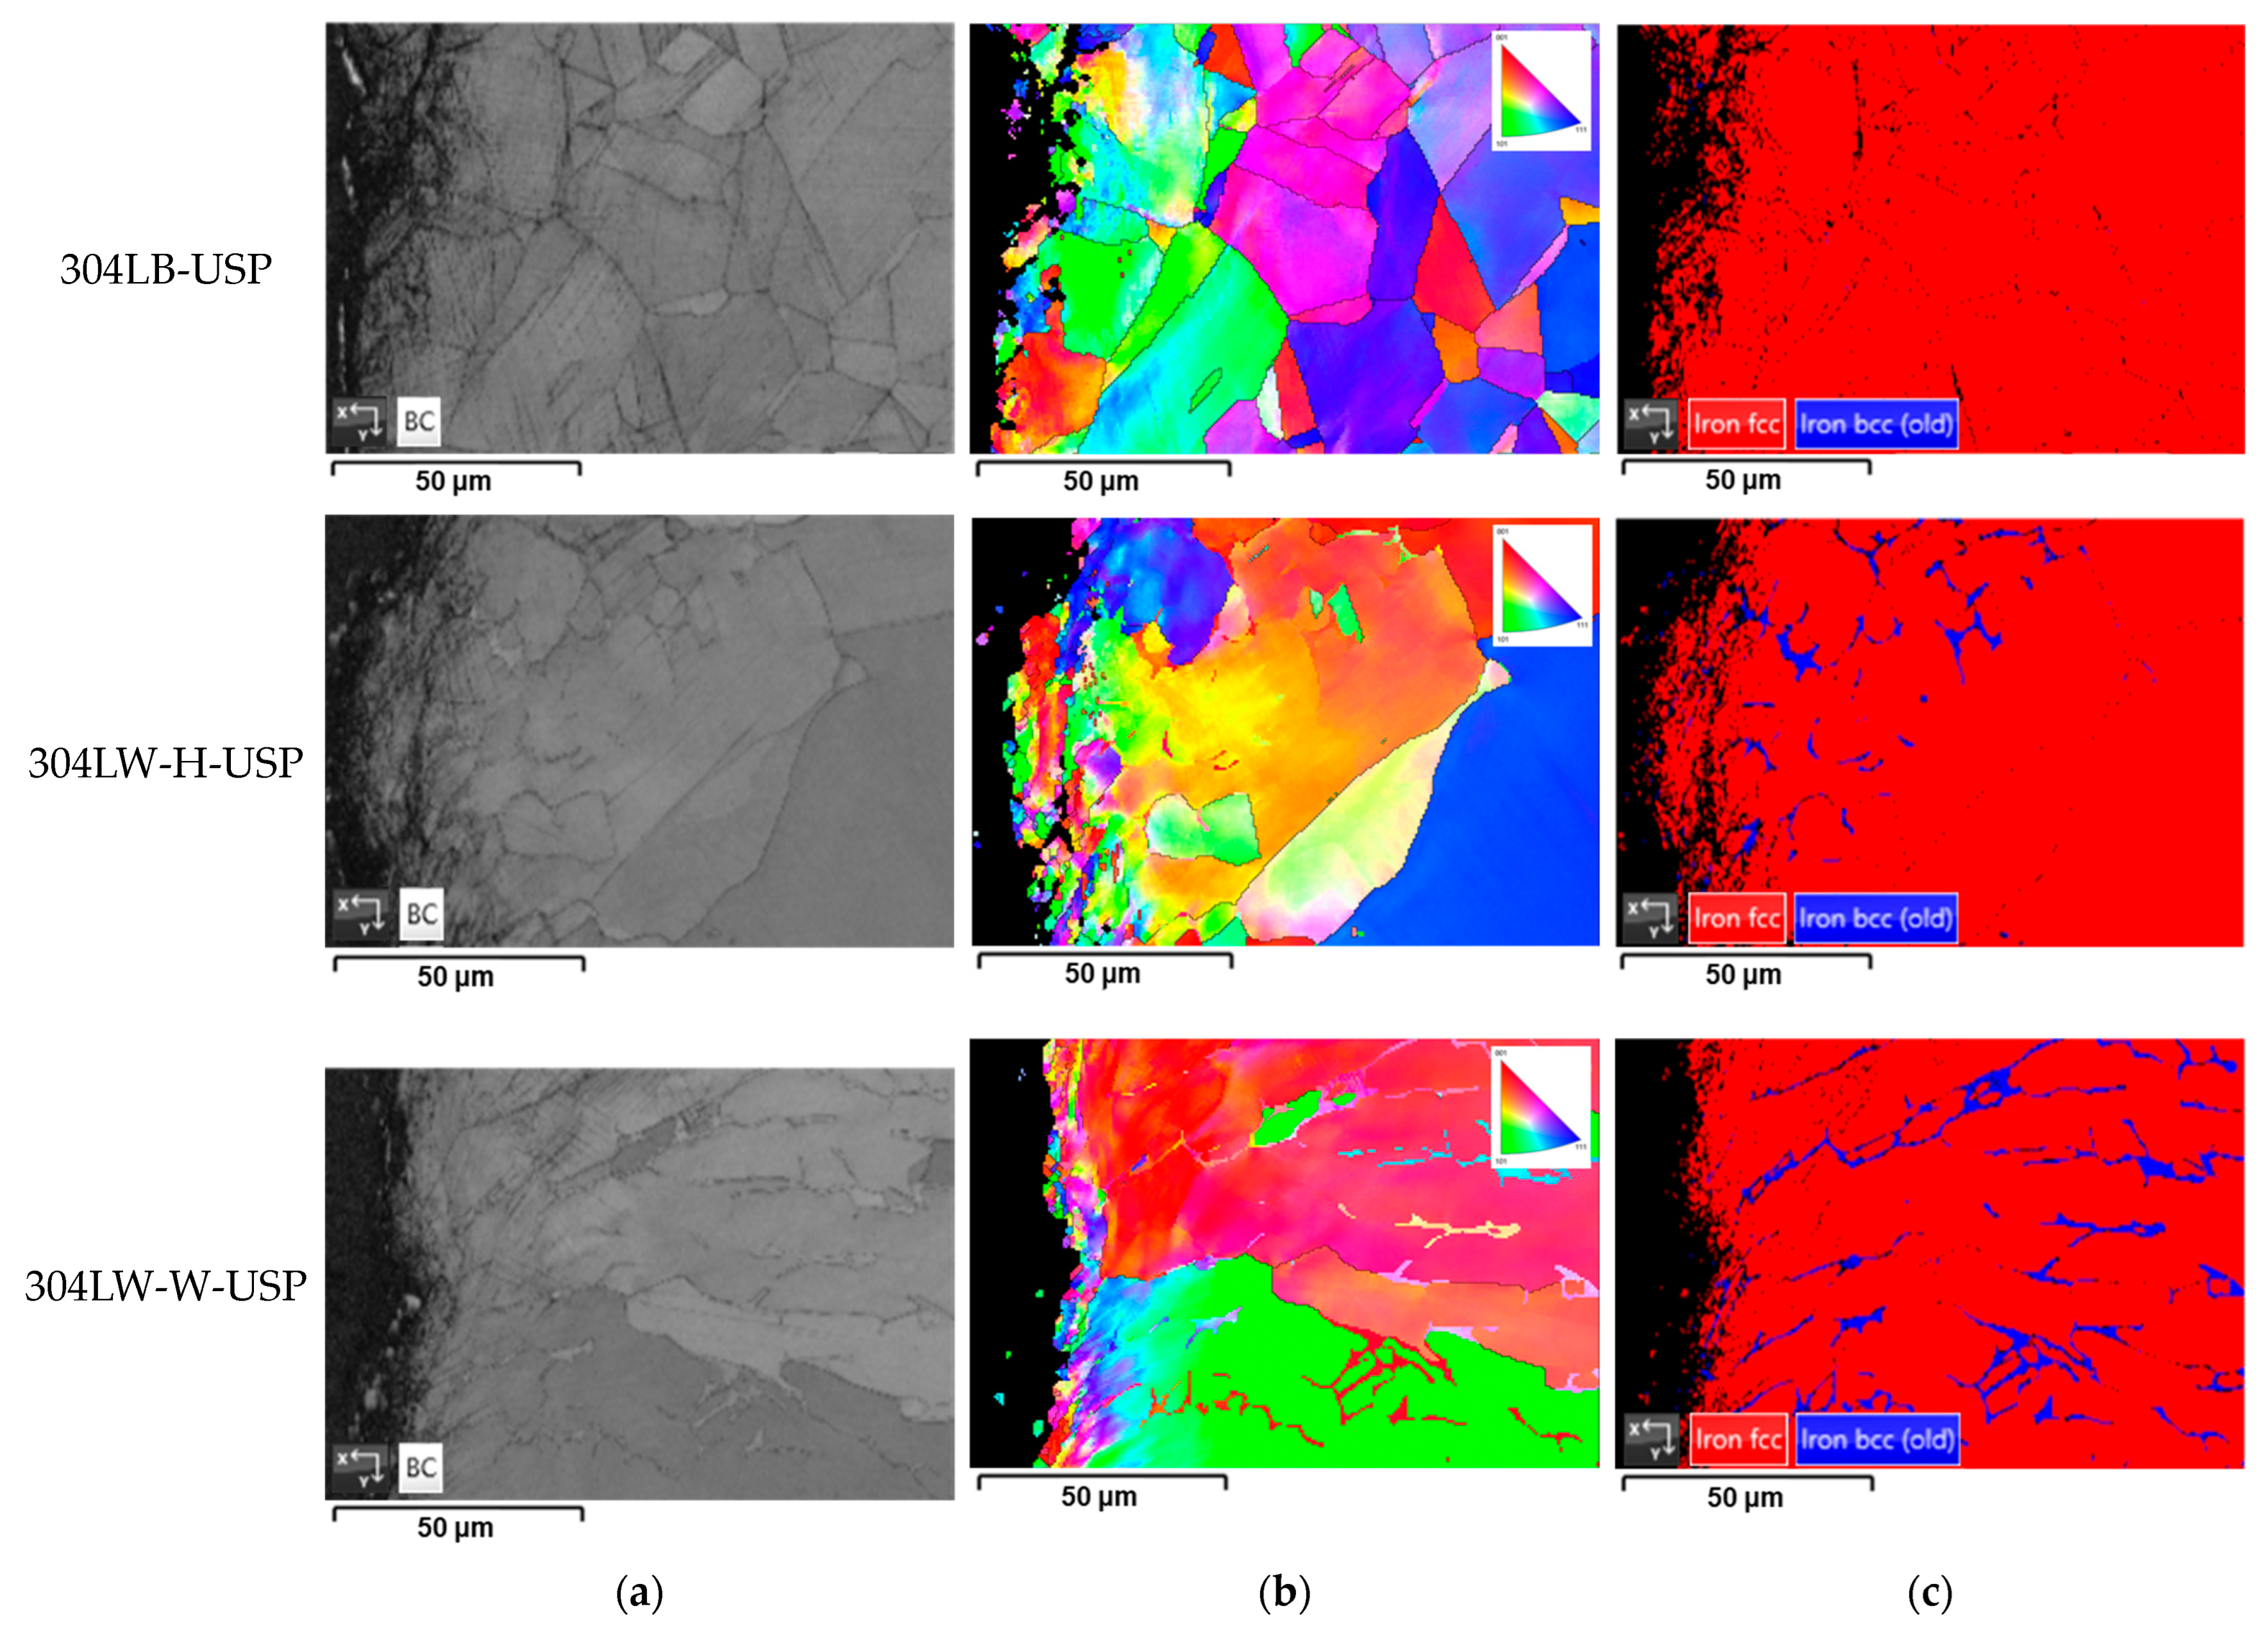
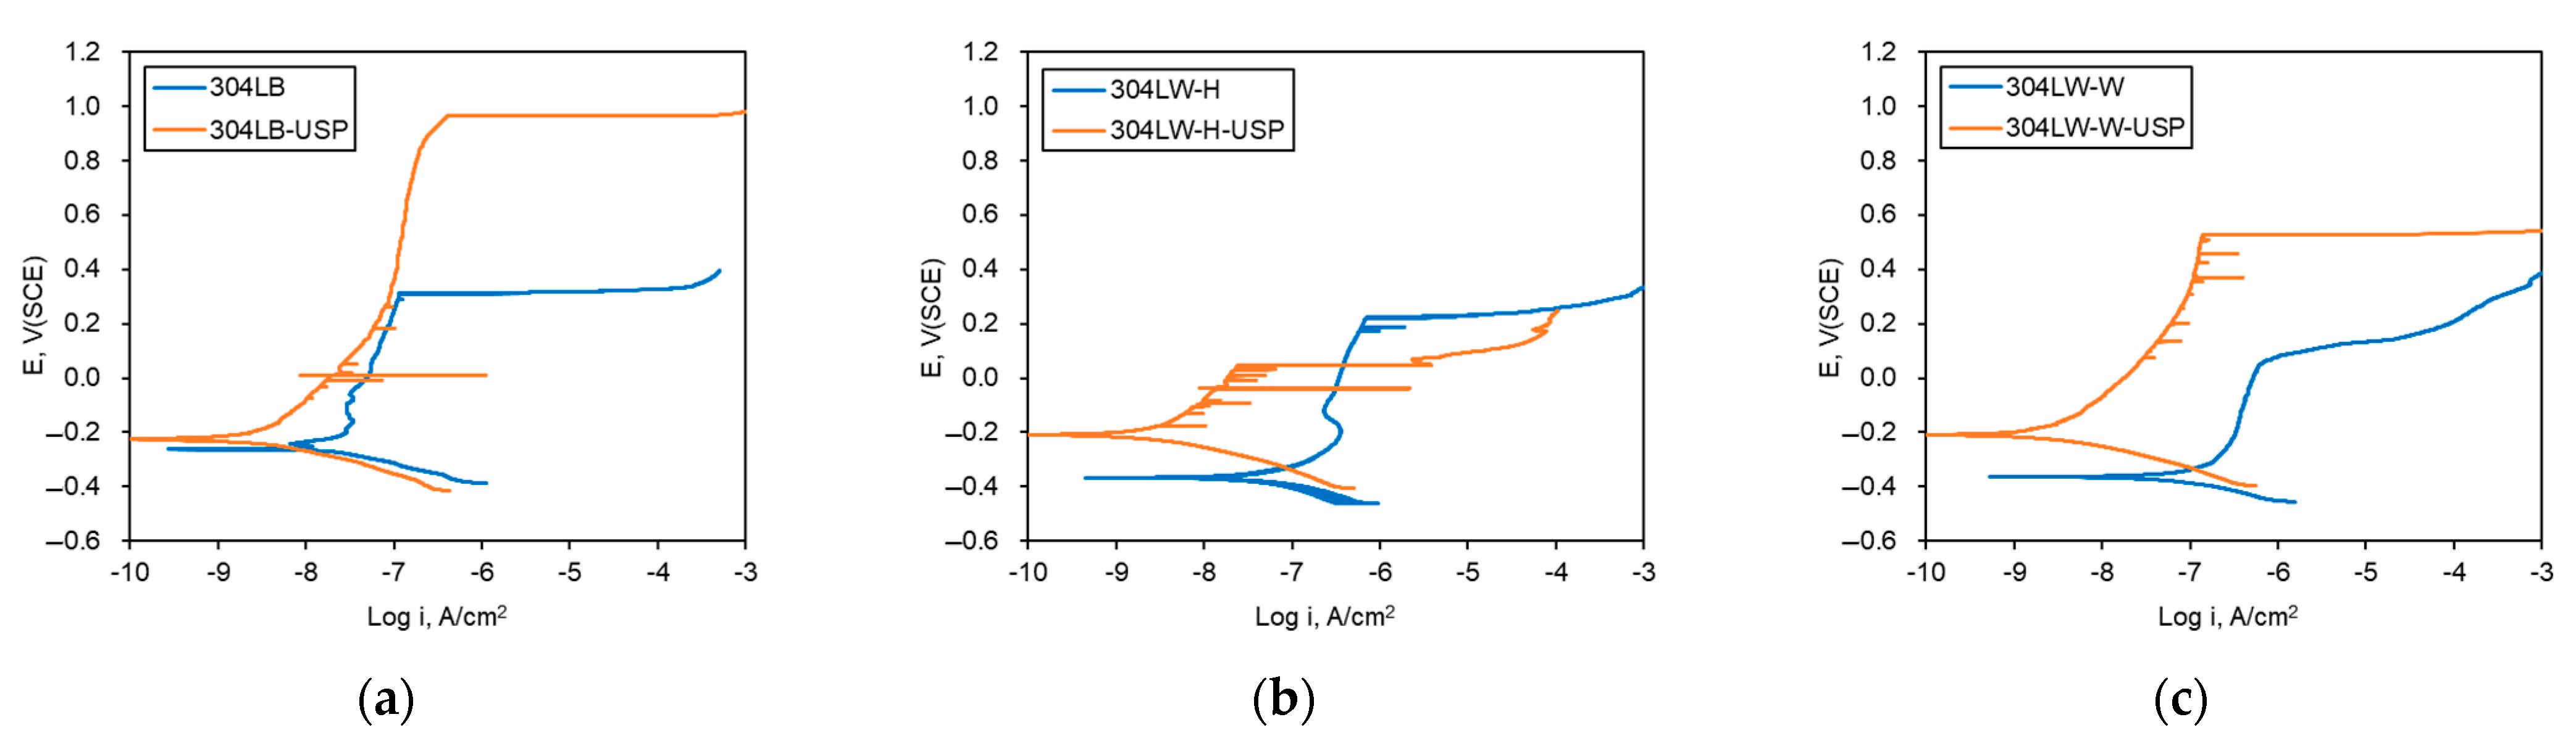
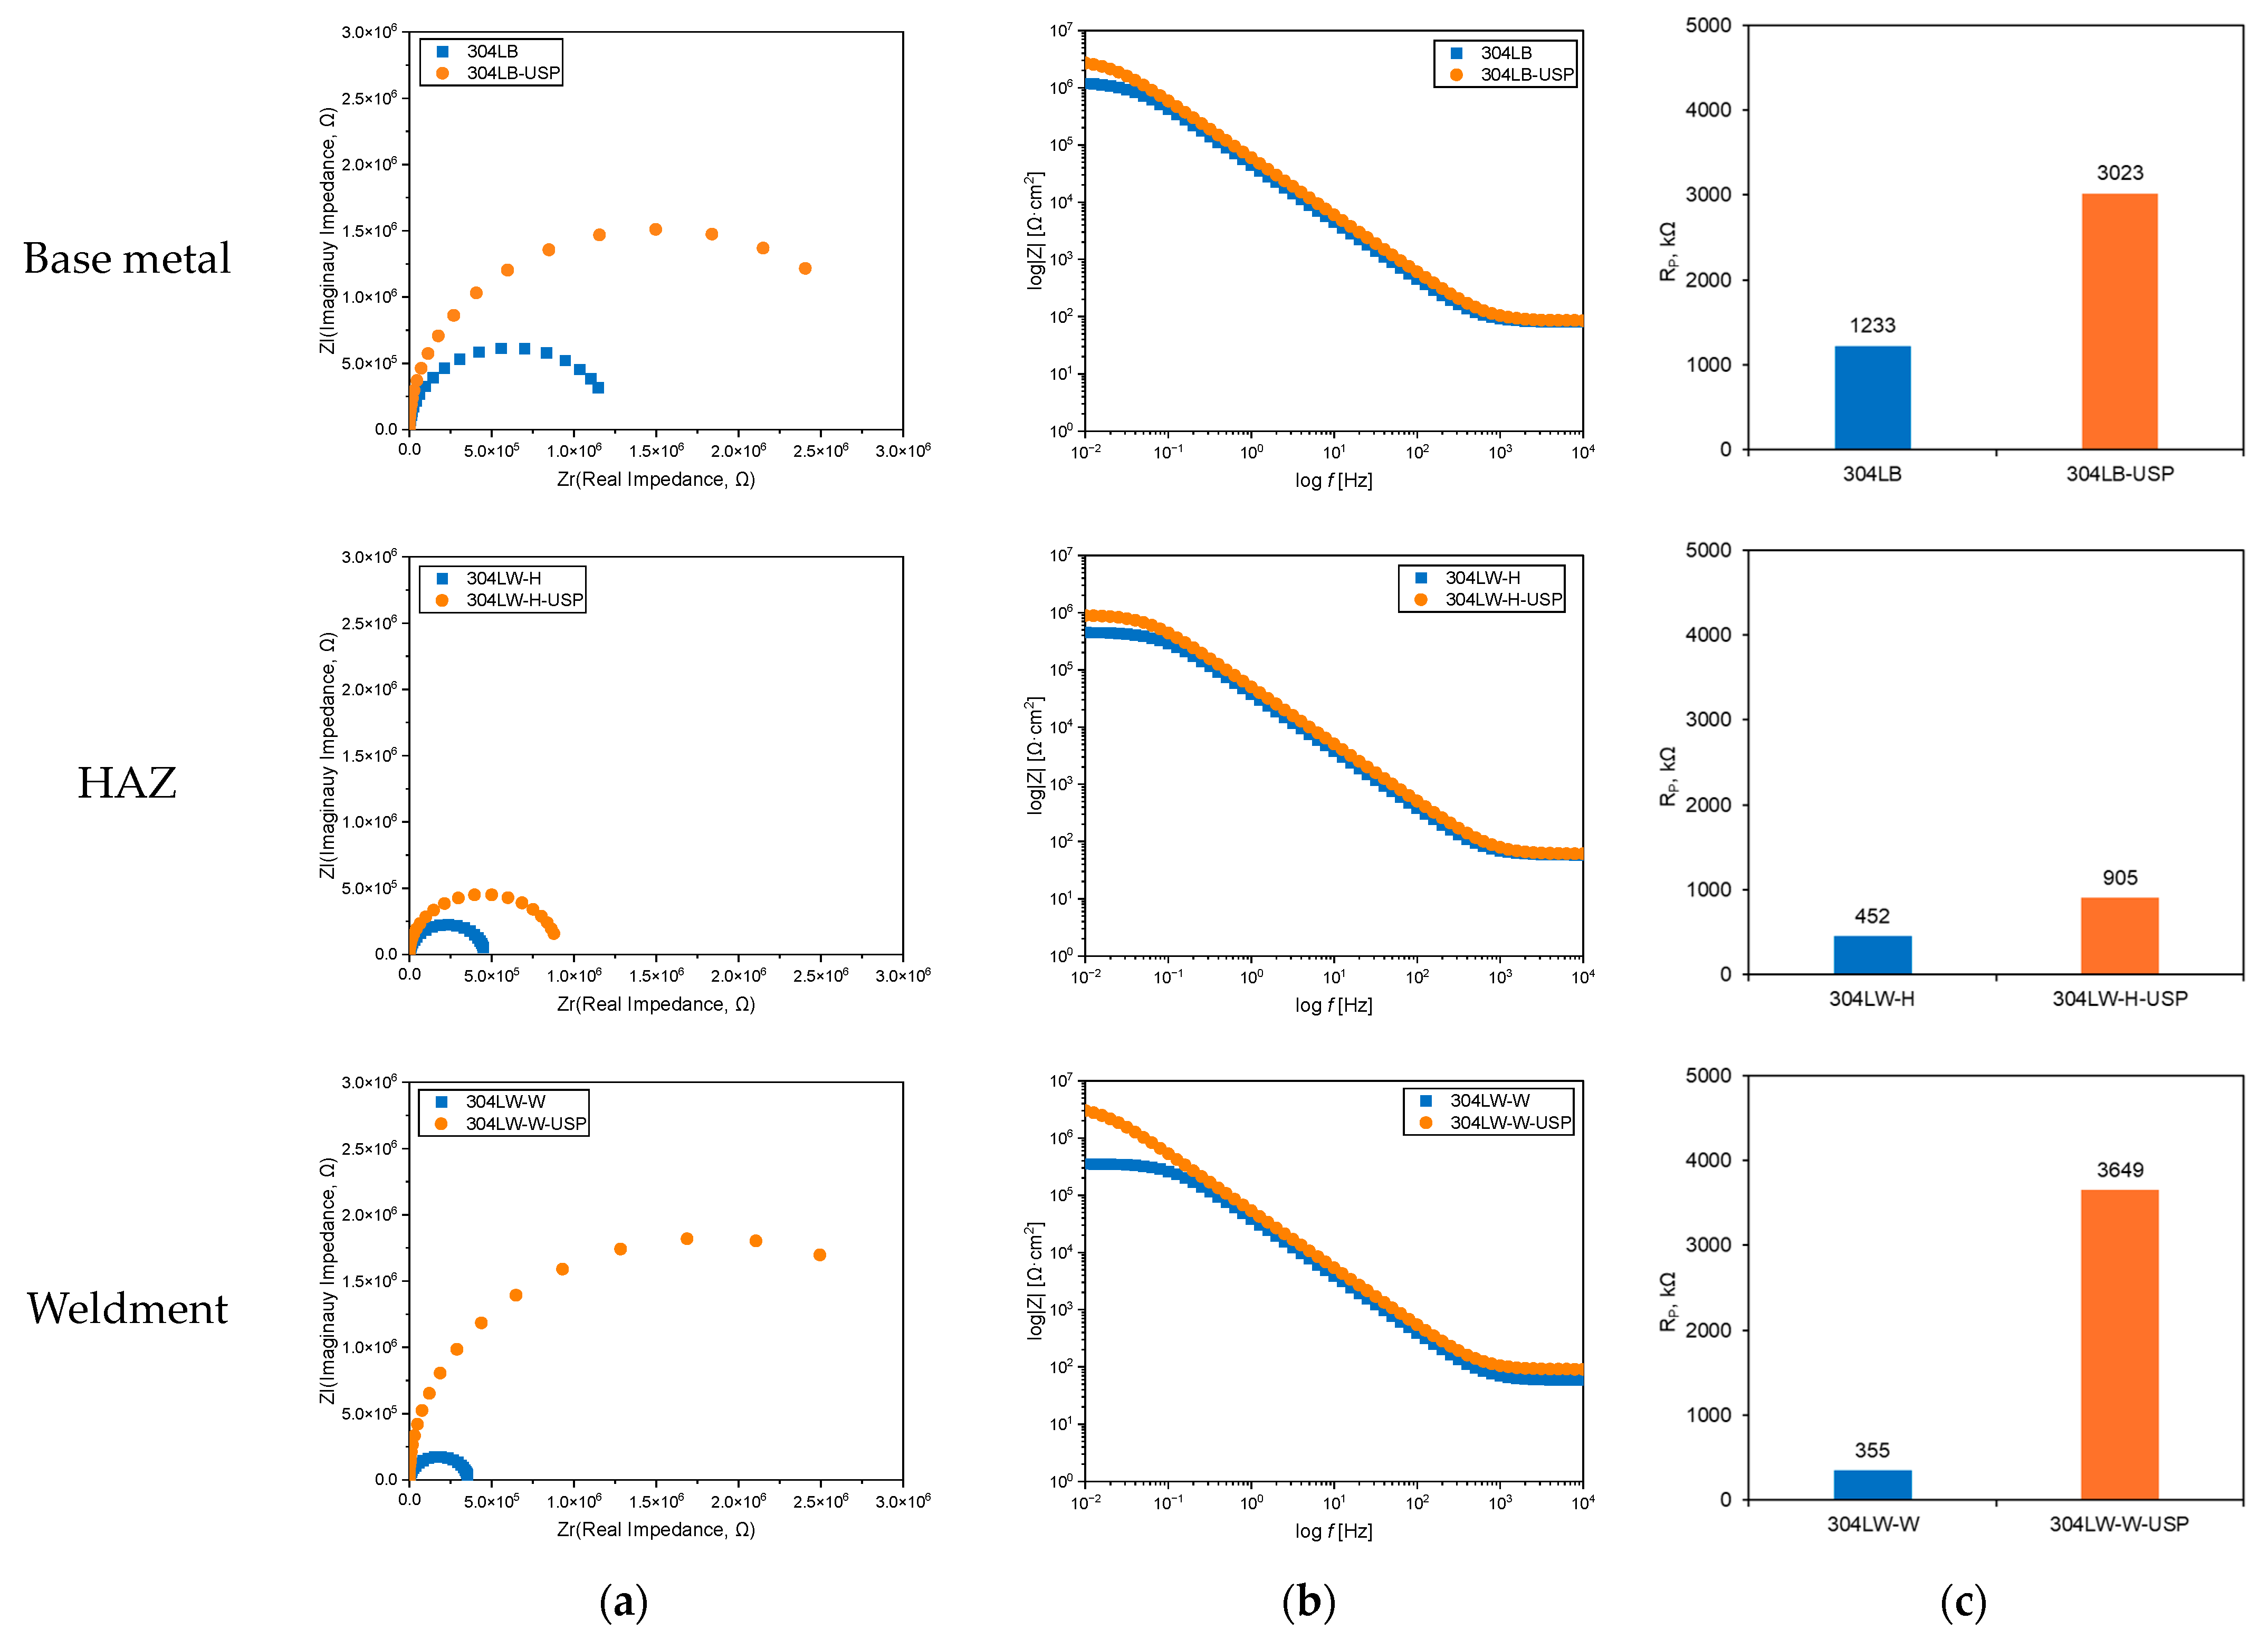
3.2. Effect of USP on the Microstructure and Corrosion of the Cross-Section of 304L Stainless Steel

Figure 10 shows the optical microstructure of a cross-section of the 304L stainless steel after USP. Figure 10a presents the austenite structure as a microstructure of the cross-section of the base material. The surface of the outermost areas was flat before peening, but after peening, the surface became slightly rough. Grain refinement was found in the outermost areas of the cross-section. Figure 10b shows the microstructure of the HAZ and weldment. The grain size of HAZ increased due to welding and the surface was rough after peening. Figure 10c shows the dendritic phase of the weldment, and the dual phase of austenite and delta ferrite was observed due to the ferrite–austenite solidification mode. The content and morphology of the delta ferrite depended on the composition of the alloying elements and the welding conditions (current, voltage, welding speed), and hot cracking was effectively prevented when the content was about 5–15% [36]. The surface was roughened as a result of peening, and delta ferrite dendrites were formed due to the solidification mode of the weldment [14]. In summary, ultrasonic shot peening increased the surface roughness and refined the grain size in the outermost areas [37]. The effect of welding caused the grains to grow. These characteristics are the same as the results that can be obtained with LSP processing [14]. Yin et al. reported that the grains in the outermost angular region were micronized by peening to form nanoscale grains [16]. They also reported that the nanoparticles on the peened surface were formed in the size range of 20 nm to 200 nm, and the size of the nanoparticles did not change significantly with the peening time, but the nanocrystalline thickness increased significantly. Microstructural refinement is effective up to a region of 200 μm from the surface [16,20,23,37], and in this study, microstructural refinement was achieved up to a region of 50 μm.
Figure 11 shows the EBSD results for the 304L base metal after USP. Figure 11a is the band contrast, which shows grain refinement and micro-defects with changes in the brightness. Figure 11b presents the inverse pole figure (IPF) colors, which show the orientation, microstructure, and deformation of the crystals. Figure 11c shows the phase colors that enable the observation of microstructural phase boundaries and crystalline zones. Figure 11a shows that the grains in the outermost areas were finely refined as a result of peening. In Figure 11b, the depth of the grain refinement in the outermost area and the mechanically modified shape can be observed. In Figure 11c, the boundary between the microstructure phase and the crystalline phase can be observed, and there is a dual phase in the weldment. It can be observed that the dual phase contained about 6.4% to 7.2% α (blue area) in the austenite phase, which is the optimal α ratio for hot crack prevention. [36]. Reference [14] shows that no refinement nor deformation of the grain was observed in the outermost areas of the base metal and welds before peening. However, deformation was observed in the interior of the weld, which was reported to be related to the tensile stresses caused by welding [15]. In this study, grain refinement and deformation occurred in the outermost area of the cross-section after peening [37]. The welds (HAZ and weldment) had increased hardness values due to increased grain refinement and deformation [14].
Figure 12 shows the Micro Vickers hardness measurement results on a cross-section of 304L stainless steel after USP. Figure 12a shows a hardness measurement diagram with nine measurements at 150 µm intervals from 50 µm under the surface. In Figure 12b, curve 304LB shows the hardness measurement result for the cross-section of the base material after USP. The hardness in the outermost areas was about 300 HV and decreased with depth. The hardness of the outermost areas was about 300 HV and decreased with depth. The 1000 μm area, which corresponded to the maximum USP depth, had a hardness value similar to that of the base metal. The 304LW-H (HAZ) curve presents the hardness measurement results of the cross-section of HAZ after USP, and the outermost hardness value was about 310 HV. The hardness value rapidly dropped to 200 HV at a depth of 300 μm, then increased to 250 HV at a depth of 500 μm, and then dropped again. The hardness of 304LW-H was measured at approximately 50 μm intervals along the melting line; however, due to the difference in the measurement position, the hardness value decreased in the grain growth areas and increased in the areas of grain refinement. Curve 304LW-W is the result of measuring the hardness of the weld cross-section after peening. The outermost hardness value of the weldment was approximately 250 HV, and the hardness value decreased slightly with increasing depth. The area at a depth of about 800 μm showed a hardness value similar to that of the base material. After peening, the hardness value of each part increased by approximately 67.4% for the base material, 53.6% for HAZ, and 28.5% for the weldment [14,23]. Regardless of the region, the hardness value decreased with depth from the surface and the compressive residual stresses also decreased. It is believed that these results are correlated with grain refinement and the interatomic distance by USP [12,14,21,23].
Figure 13 shows the polarization curves (de-aerated 1% NaCl at 30 °C) of the cross-section of the base metal and weld areas of the 304L stainless steel after USP. Figure 13a shows the cross-sectional polarization curve of the base metal; the pitting potential of the 304L base metal was 310 mV (SCE) and the pitting potential of 304LB-USP after USP was 950 mV (SCE), which is a significant increase in the pitting potential after USP. Figure 13b depicts the polarization curves of the cross-section of the 304L HAZ section. Before peening, the pitting potential of 304LW-H was 217 mV (SCE) and that of 304LW-H-USP was 46 mV (SCE); the pitting potential decreased after peening. The passive current density measured at 0 mV (SCE) was lower for 304LW-H-USP. Figure 13c reveals the polarization curves of the cross-section of the 304L weldment. Before peening, the pitting potential of 304LW-W was 65 mV (SCE), while after peening, the pitting potential of 304LW-W-USP increased to 528 mV (SCE). The passive current density measured at 0 mV (SCE) was lower for 304LW-W-USP. After the USP treatment, the cross-section of the base metal and the weldment showed an increase in the pitting potential, while the HAZ decreased slightly. The HAZ and weldment showed slightly reduced corrosion current densities [38]. USP induced compressive residual stresses in the cross-section and reduced the interatomic distances. This is considered to have increased the polarization properties because the passive film was strengthened by diffusion after the corrosion reaction. On the other hand, HAZ reduced the carbon segregation in the sensitized area, but it is believed that the chromium carbides were removed by mechanical defects under the influence of peening, and the mechanical defects caused pitting corrosion, which reduced the polarization properties [4,15,39].
The quantitative values of the polarization behavior are shown in Table 7. Table 7 shows the corrosion potential, the pitting potential, the transpassive potential, and the corrosion current density of the cross-section of the 304L stainless steel.
Figure 14 shows the EIS measurements at the corrosion potential for the cross-section of the base metal and the weldment of the 304L stainless steel after USP. The Rp after peening was 1233 kΩ for 304LB and 3023 kΩ for 304LB-USP, which depicts that the resistance of the passive film increased from the peening treatment. The Rp of 304LW-H was 452 kΩ and that of 304LW-H-USP was 905 kΩ, which reveals a slightly increased resistance of the passive film as a result of the peening treatment. The Rp of 304LW-W was 355 kΩ and that of 304LW-W-USP was 3649 kΩ, which indicates the greatest increase in the passive film resistance after peening treatment. After USP treatment, the cross-section of the 304L stainless steel showed an increase in the passive film resistance in the EIS tests; the HAZ area showed the smallest increase in passive film resistance; and the weldment showed the largest increase in passive film resistance [15]. Table 8 shows the fitting parameters obtained from the Nyquist plot (Figure 14a) on the cross-section of 304L stainless steel. Table 8 includes the fitting results with an average relative error for each parameter < 10.00% and a χ2 of 0.001–0.013.
Figure 15 shows the results of the DL-EPR experiment on a cross-section of 304L stainless steel after the USP treatment. The sensitization level was compared by quantitatively measuring the degree of sensitization (DOS) value with the DL-EPR test method, and the DOS value was classified as less than 0.01, between 0.01 and 0.05, or greater than 0.05 as the standard of the sensitization levels [40]. The DOS value of the peened surface of the base material increased and was measured to be 0.00003 for 304LB and 0.01300 for 304LB-USP. In the HAZ area, the DOS values were 0.00095 for 304LW-H and 0.01100 for 304LW-H-USP, indicating an increase in sensitivity after peening. The DOS values of the weldment after peening were 0.00104 for 304LW-W and 0.01200 for 304LW-W-USP, which shows that the DOS value increased with peening. The test results showed that the DOS value increased with the USP treatment, regardless of the weld area. In other words, the DOS value is believed to have increased due to the USP treatment, which resulted in grain refinement in the outermost areas of the cross-section, increased grain boundary areas, and surface inhomogeneity [15,38].
Figure 16 shows the corrosion rate measurement results of the modified ASTM A262 Pr.C test on 304L stainless steel after USP. The average corrosion rate was 0.12 mm/y for 304LB and 0.29 mm/y for 304LB-USP, indicating an increase in the corrosion rate after peening. The 304LW was the result of the corrosion rate measurement of the area, including the weld and the base metal. The average corrosion rate was 0.20 mm/y for 304LW and 0.19 mm/y for 304LW-USP, which was a slight decrease. The 304LW had a higher corrosion rate than the 304LB due to carbon segregation at the grain boundaries before peening. After peening, the sensitized areas of 304LW improved the intergranular corrosion resistance by reducing carbon segregation, the influence of compressive residual stresses, and grain boundary refinement [4].
Based on the above results, a model of the microstructure and corrosion properties of welded 304L stainless steel by USP is proposed. Figure 17 shows the proposed model for inducing microstructure changes and surface modifications to the 304L stainless steel after welding and USP. As shown in Figure 17a, the grain growth in the HAZ area due to welding and the weldment showed a dendritic microstructure α: purple arrows in Figure 7a,b. In Figure 17b, after the USP treatment, the grain was refined by mechanical deformation in an area approximately 1 mm deep from the surface. The surface was roughened by USP and crevices were created when deformation occurred (red arrows). The deformed crevices contained some cracks that caused pitting and promoted corrosion. In the outermost areas close to the surface, compressive residual stresses were generated, which resulted in grain refinement and the consolidation of the passivation film. As a result, the pitting properties improved [14,32,35].

4. Conclusions

In this study, the effect of a USP treatment on the microstructure and corrosion properties of 304L stainless steel and its welds was investigated. The surface morphology, microstructure, and corrosion properties of the base metal and welds, when applied with a compressive residual stress of more than 1 mm from the surface of the stainless steel by a USP treatment, were as follows.
(1)
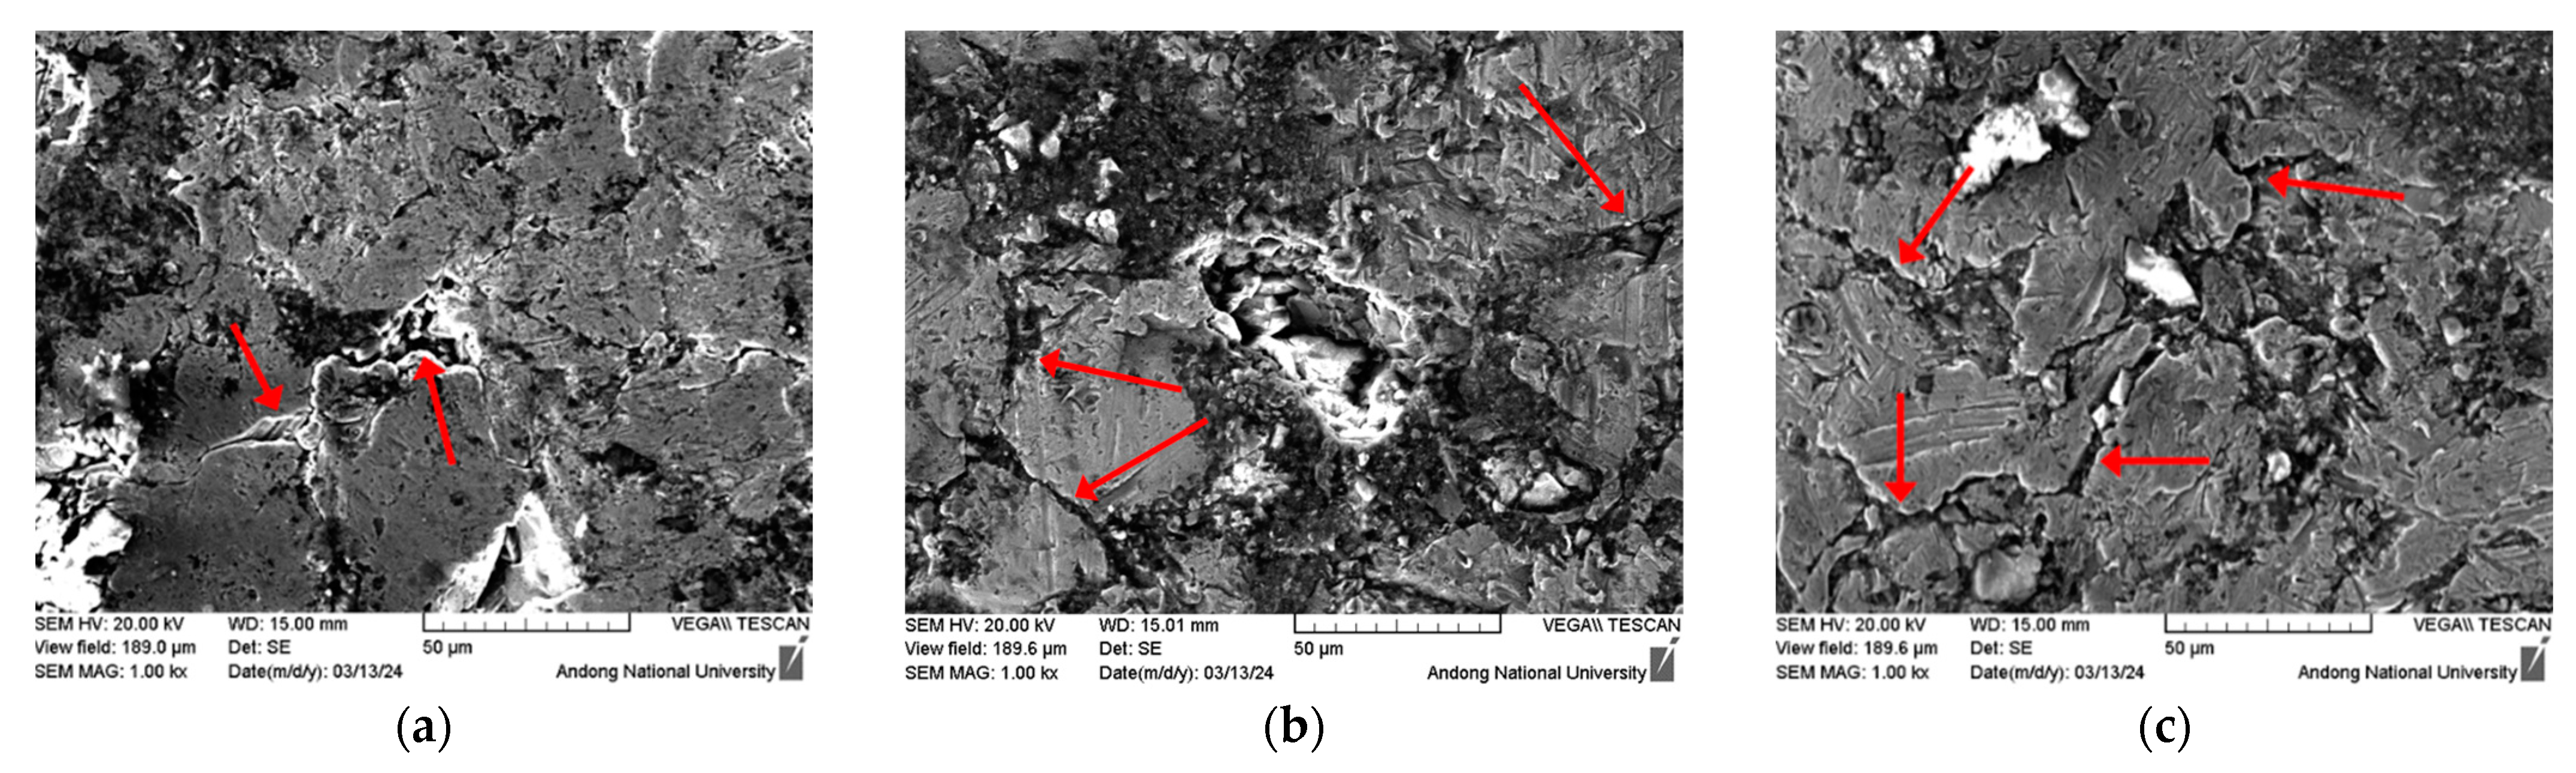
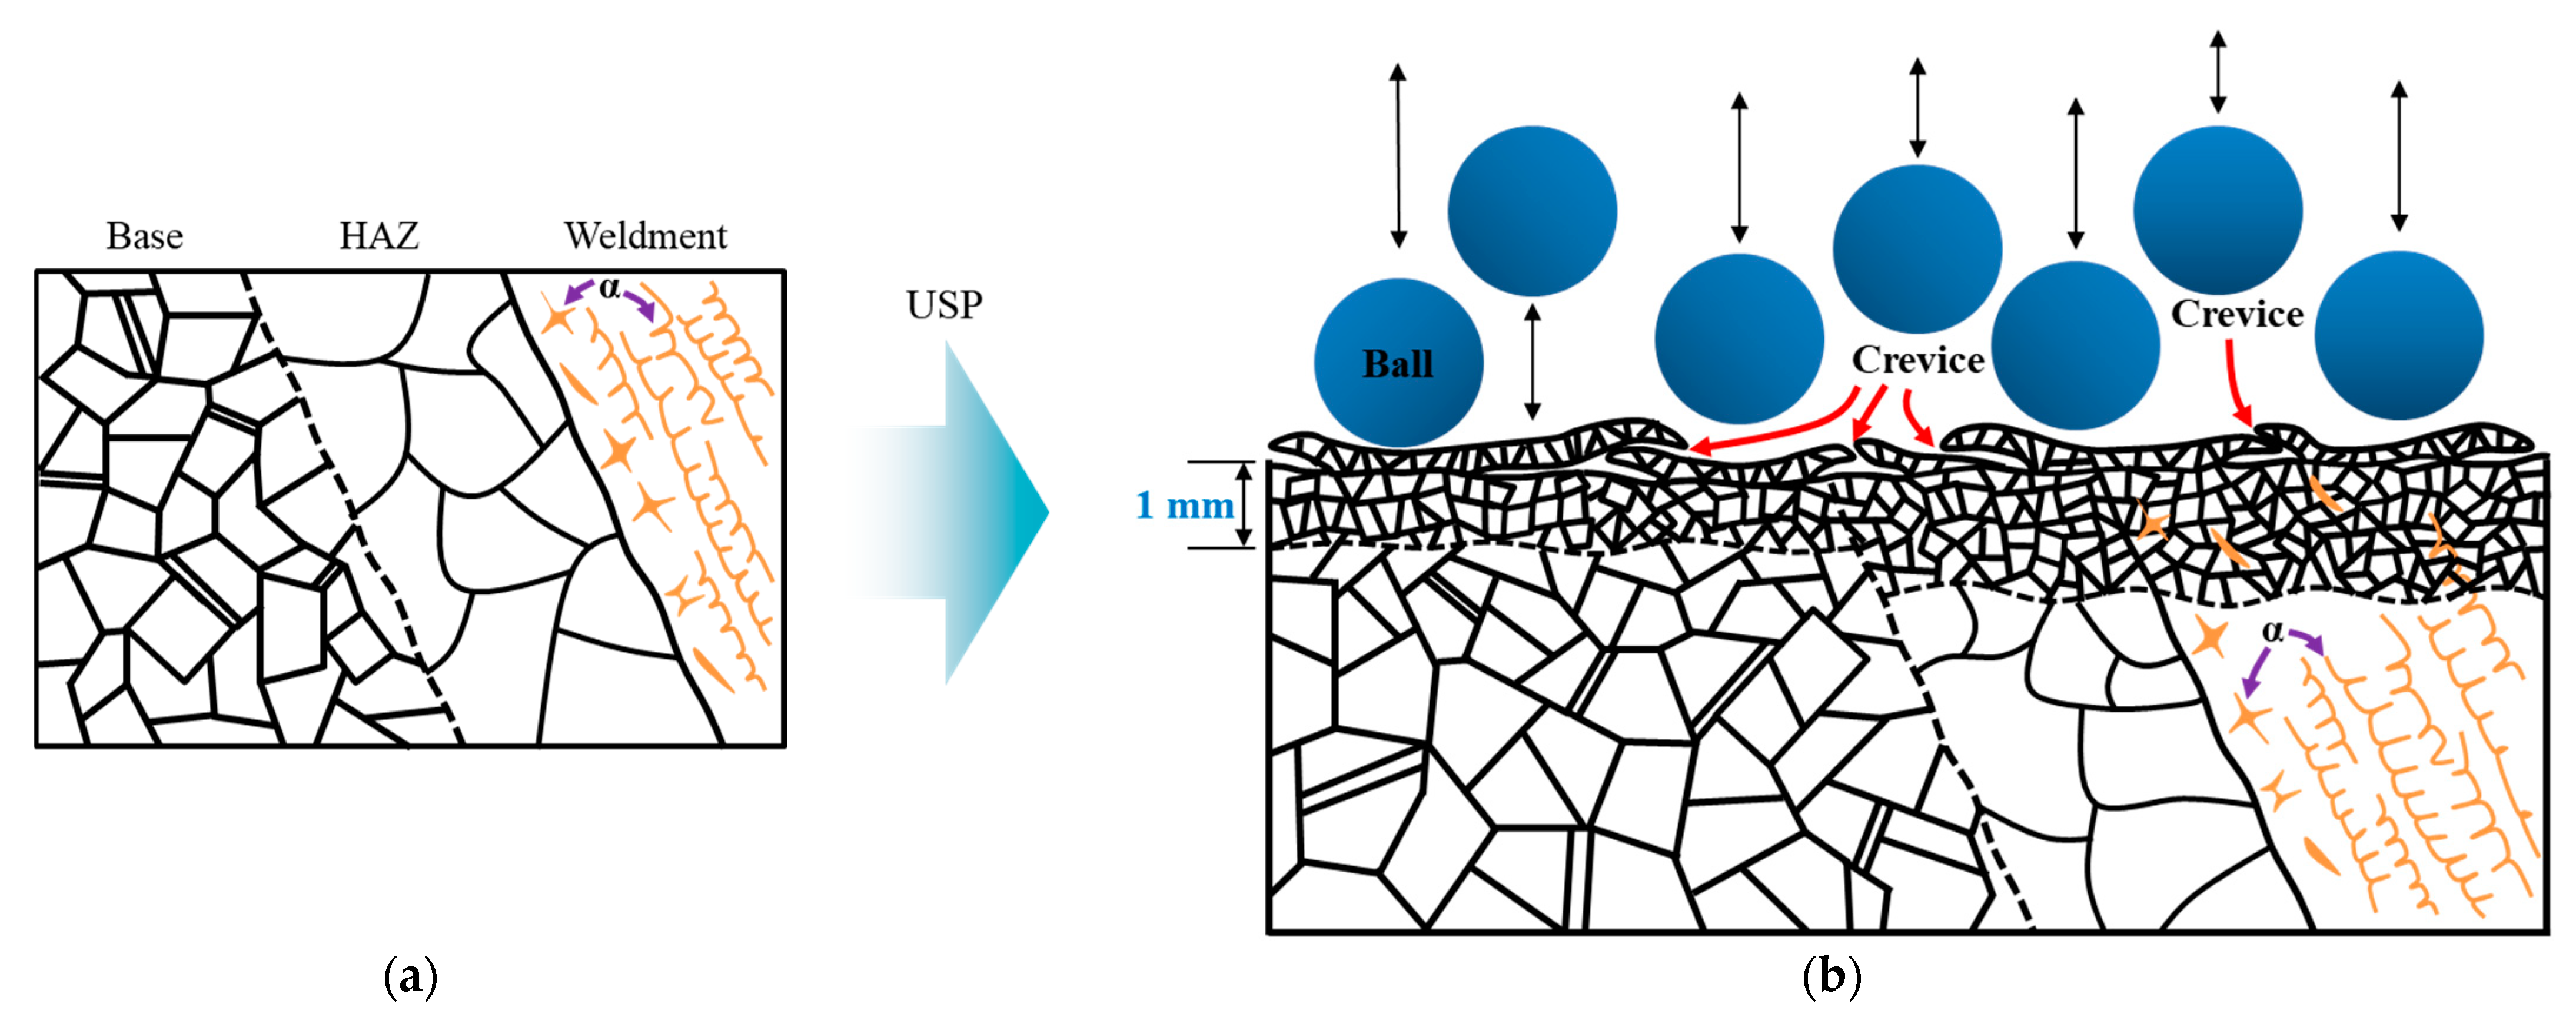
The surface was deformed and roughened due to ultrasonic shot peening. The welds (HAZ and weldment) were more deformed and rougher than the base material. The deformed areas of the surface formed crevices and the interior of the crevices contained some cracks. The crevices in the deformed areas reduced the pitting potential and decreased the resistance of the passive film by approximately 70%. Therefore, after the USP treatment, the surface had reduced corrosion properties.
(2)
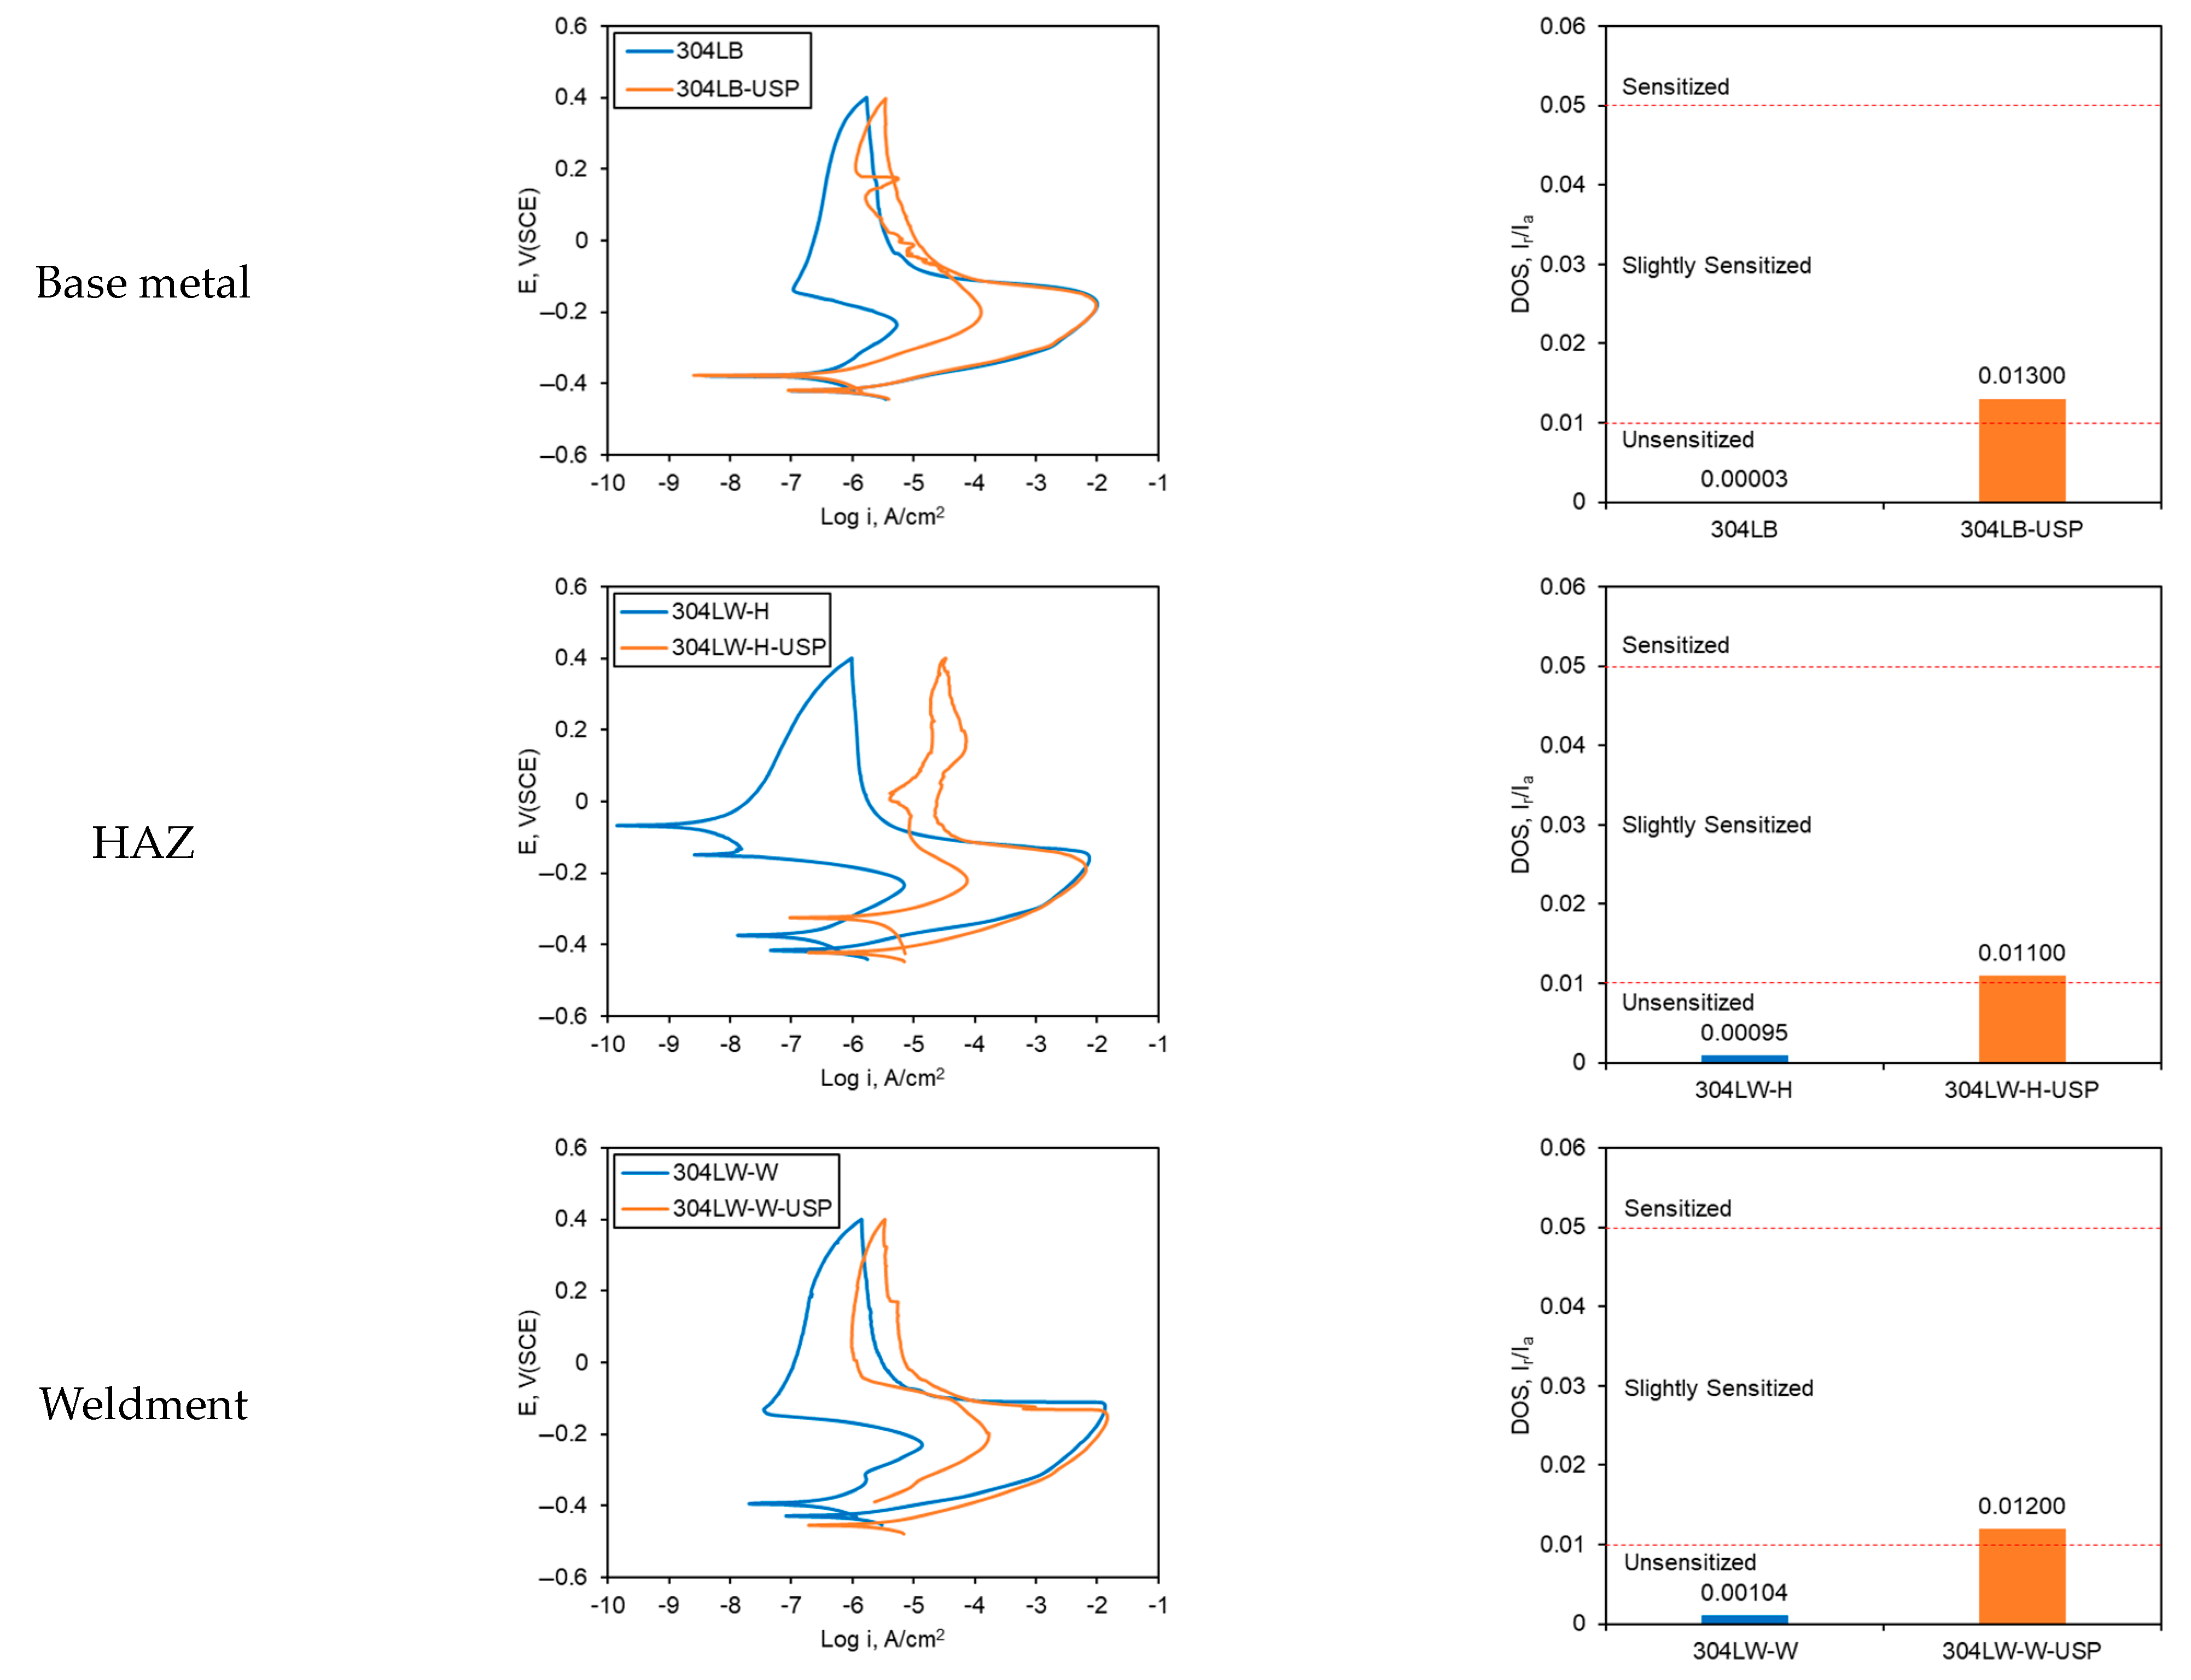
After the USP treatment, the cross-section was subjected to grain refinement and deformation in the outermost areas. The weldment (HAZ and weldment) had approximately 30% deeper grain refinement zones and more deformation than the base metal, which further increased the hardness value. The outermost cross-sectional areas after peening increased the pitting potential and the resistance of the passive film from two to up to nine times because of the effect of compressive residual stress and grain refinement, which improved the corrosion properties. On the other hand, grain refinement increased the degree of sensitization due to the increase in the grain boundary areas.

Author Contributions

Conceptualization, H.C. and Y.-R.Y.; methodology, H.C.; validation, H.C. and Y.-R.Y.; formal analysis, Y.-S.K.; investigation, H.C.; resources, Y.-R.Y.; data curation, H.C. and Y.-R.Y.; writing—original draft preparation, H.C. and Y.-R.Y.; writing—review and editing, Y.-S.K.; visualization, H.C.; supervision, Y.-S.K.; project administration, Y.-R.Y. and Y.-S.K.; funding acquisition, Y.-S.K. All authors have read and agreed to the published version of the manuscript.

Funding

This research was supported by a grant from the 2023–2024 research funds of Andong National University.

Data Availability Statement

The data are contained within the article.

Conflicts of Interest

The authors declare no conflicts of interest.

References

  1. Larry, J. Welding and Metal Fabrication, 3rd ed.; Delmar Cengage Learning: New York, NY, USA, 2012; pp. 1–15. [Google Scholar]
  2. Farnsworth, S.R. Welding for Dummies, 3rd ed.; Wiley Publishing: New York, NY, USA, 2010; pp. 7–53. [Google Scholar]
  3. Lee, J.H.; Kim, K.T.; Pyoun, Y.S.; Kim, Y.S. Intergranular Corrosion Mechanism of Slightly Sensitized and UNSM-treated 316L Stainless Steel. Corros. Sci. Technol. 2016, 15, 226–236. [Google Scholar] [CrossRef]
  4. Lee, J.H.; Kim, Y.S. Intergranular Corrosion of 316L Stainless Steel by Aging and UNSM (Ultrasonic Nano-crystal Surface Modification) Treatment. Corros. Sci. Technol. 2015, 14, 313–324. [Google Scholar] [CrossRef]
  5. Tsai, W.T.; Chang, C.S.; Lee, J.T. Effects of Shot Peening on Corrosion and Stress Corrosion Cracking Behaviors of Sensitized Alloy 600 in Thiosulfate Solution. Corros. Sci. 1994, 50, 98–105. [Google Scholar] [CrossRef]
  6. Wang, T.; Yu, J.; Dong, B. Surface Nano Crystallization Induced by Shot Peening and its Effect on Corrosion Resistance of 1Cr18Ni9Ti Stainless Steel. Surf. Coat. Technol. 2006, 200, 4777–4781. [Google Scholar] [CrossRef]
  7. Kim, J.H.; Lee, W.R.; Kim, T.G.; Cheong, S.K. Micro-shockwave Measurement and Evaluation of Laser Shock Peening. Trans. Korean Soc. Mech. Eng. B 2011, 35, 1041–1046. [Google Scholar] [CrossRef]
  8. Lu, J.Z.; Qi, H.; Luo, K.Y.; Luo, M.; Cheng, X.N. Corrosion Behaviour of AISI 304 Stainless Steel Subjected to Massive Laser Shock Peening Impacts with Different Pulse Energies. Corros. Sci. 2014, 80, 53–59. [Google Scholar] [CrossRef]
  9. Jiang, W.; Luo, Y.; Wang, H.; Wang, B.Y. Effect of Impact Pressure on Reducing the Weld Residual Stress by Water Jet Peening in Repair Weld to 304 Stainless Steel-Clad Plate. J. Press. Vessel Technol. 2015, 137, 031401. [Google Scholar] [CrossRef]
  10. Amini, S.; Kariman, S.A.; Teimouri, R. The Effects of Ultrasonic Peening on Chemical Corrosion Behavior of Aluminum 7075. Int. J. Adv. Manuf. Technol. 2017, 91, 1091–1102. [Google Scholar] [CrossRef]
  11. Malaki, M.; Ding, H. A Review of Ultrasonic Peening Treatment. Mater. Desing 2015, 87, 1072–1086. [Google Scholar] [CrossRef]
  12. Manchoul, S.; Sghaier, R.B.; Seddik, R.; Fathallah, R. Comparison Between Conventional Shot Peening and Ultrasonic Shot Peening. Mech. Ind. 2018, 19, 603. [Google Scholar] [CrossRef]
  13. Ma, C.; Andani, M.T.; Qin, H.; Moghaddam, N.S.; Ibrahim, H.; Jahadakbar, A.; Amerinatanzi, A.; Ren, Z.; Zhang, H.; Doll, G.L.; et al. Improving Surface Finish and Wear Resistance of Additive Manufactured Nickel-Titanium by Ultrasonic Nano-Crystal Surface Modification. J. Mater. Process. Technol. 2017, 249, 433–440. [Google Scholar] [CrossRef]
  14. Yoo, Y.R.; Kim, J.S.; Kim, Y.S. Effect of Laser Peening on Microstructural Changes in GTA-welded 304L Stainless Steel. Materials 2022, 15, 3947. [Google Scholar] [CrossRef]
  15. Yoo, Y.R.; Choi, S.H.; Kim, Y.S. Effect of Laser Peening on the Corrosion Properties of 304L Stainless Steel. Materials 2023, 16, 804. [Google Scholar] [CrossRef]
  16. Yin, F.; Rakita, M.; Hu, S.; Han, Q. Overview of Ultrasonic Shot Peening. Surf. Eng. 2017, 33, 651–666. [Google Scholar] [CrossRef]
  17. EPRI Report. Available online: https://www.epri.com/research/products/000000003002023423 (accessed on 8 January 2024).
  18. Zhang, W.; Lu, J.; Luo, K. Residual Stress Distribution and Microstructure at a Laser Spot of AISI 304 Stainless Steel Subjected to Different Laser Shock Peening Impacts. Metals 2016, 6, 6. [Google Scholar] [CrossRef]
  19. Prabhakaran, S.; Kalainathan, S. Compound Technology of Manufacturing and Multiple Laser Peening on Microstructure and Fatigue Life of Dual-phase Spring Steel. Mater. Sci. Eng. A 2016, 674, 634–645. [Google Scholar] [CrossRef]
  20. Mordyuk, B.N.; Prokopenko, G.I.; Vasylyev, M.A.; Iefimov, M.O. Effect of Structure Evolution Induced by Ultrasonic Peening on the Corrosion Behavior of AISI-321 Stainless Steel. Mater. Sci. Eng. A 2007, 458, 253–261. [Google Scholar] [CrossRef]
  21. Kawano, S.; Kawagishi, A.; Suezono, N.; Ueno, K.; Okuda, K.; Obata, M.; Kameyama, I.; Watanabe, Y. Development of Ultrasonic Shot Peening Technique for Reactor Components to Improve Structural Integrity Against Stress Corrosion Cracking. In Proceedings of the 17th International Conference on Nuclear Engineering, Brussels, Belgium, 12–16 July 2009. [Google Scholar]
  22. Kang, C.Y.; Chen, T.C.; Tasy, L.W. Effect of Micro-Shot Peening on the Stress Corrosion Cracking of Austenitic Stainless Steel Welds. Metals 2023, 13, 69. [Google Scholar] [CrossRef]
  23. Li, K.; Spartacus, G.; Dong, J.; Cao, P.; Shin, K. Effect of Ultrasonic Shot Peening on Microstructure and Properties of 301SS. Mater. Manuf. Process. 2017, 32, 1851–1855. [Google Scholar] [CrossRef]
  24. Kumagai, M.; Curd, M.E.; Soyama, H.; Ungár, T.; Ribárik, G.; Withers, P.J. Depth-Profiling of Residual Stress and Microstructure for Austenitic Stainless Steel Surface Treated by Cavitation, Shot and Laser Peening. Mater. Sci. Eng. A 2021, 813, 141037. [Google Scholar] [CrossRef]
  25. Safyari, M.; Moshtaghi, M. Role of Ultrasonic Shot Peening Environment Hydrogen Embrittlement Behavior of 7075-T6 Alloy. Hydrogen 2021, 2, 377–385. [Google Scholar] [CrossRef]
  26. SONATS. Available online: https://sonats-et.com/en/ (accessed on 4 January 2024).
  27. Zhang, Q.; Duan, B.; Zhang, Z.; Wang, J.; Si, C. Effect of Ultrasonic Shot Peening on Microstructure Evolution and Corrosion Resistance of Selective Laser Melted Ti-6Al-4V Alloy. J. Mater. Res. Technol. 2011, 11, 1090–1099. [Google Scholar] [CrossRef]
  28. ASTM.G5-2004; Standard Reference Test Method for Making Potentiostatic and Potentiodynamic Anodic Polarization Measure ments. ASTM International: West Conshohocken, PA, USA, 2004.
  29. ASTMG3-2004; Standard Practice for Conventions Applicable to Electrochemical Measurements in Corrosion Testing. ASTM International: West Conshohocken, PA, USA, 2004.
  30. ASTM.G108-2004; Standard Test Method for Electrochemical Reactivation (EPR) for Detecting Sensitization of AISI Type 304 and 304L Stainless Steels. ASTM International: West Conshohocken, PA, USA, 2004.
  31. ASTM.A262-2002; Standard Practices for Detecting Susceptibility to Intergranular Attack in Austenitic Stainless Steels. ASTM International: West Conshohocken, PA, USA, 2002.
  32. Arifvianto, B.; Suyitno; Mahardika, M.; Dewo, P.; Iswanto, P.T.; Salin, U.A. Effect of Surface Mechanical Attrition Treatment (SMAT) on Microhardness, Surface Roughness and Wettability of AISI 316L. Mater. Chem. Phys. 2011, 125, 418–426. [Google Scholar] [CrossRef]
  33. Balusamy, T.; Narayanan, T.S.N.S.; Ravichandran, K.; Lee, M.H.; Nishimura, T. Surface Nanocrystallization of EN8 Steel: Correlation of Change in Material Characteristics with Corrosion Behavior. J. Electrochem. Soc. 2015, 162, C285–C293. [Google Scholar] [CrossRef]
  34. Fajardo, S.; Llorente, I.; Jimenez, J.A.; Bastidas, J.M.; Bastidas, D.M. Effect of Mn additions on the corrosion behaviour of TWIP Fe-Mn-Al-Si austenitic steel in chloride solution. Corros. Sci. 2019, 154, 246–253. [Google Scholar] [CrossRef]
  35. Fajardo, S.; Bastidas, D.M.; Criado, M.; Bastidas, J.M. Electrochemical study on the corrosion behavior of a new low-nickel stainless steel in carbonated alkaline solution in the presence of chlorides. Electrochim. Acta 2014, 129, 160–170. [Google Scholar] [CrossRef]
  36. Park, S.K.; Lee, H.J.; Lee, J.H. Effects of Thermal Aging Induced Microstructure Evolution on Mechanical and Corrosion Properties of Delta-Ferrite in Austenitic Stainless Steel Weld. Korean J. Met. Mater. 2018, 56, 296–303. [Google Scholar] [CrossRef]
  37. Liu, G.; Lu, J.; Lu, K. Surface Nanocrystallization of 316L Stainless Steel Induced by Ultrasonic Shot Peening. Mater. Sci. Eng. A 2000, 286, 91–95. [Google Scholar] [CrossRef]
  38. Ralston, K.D.; Birbilis, N. Effect of Grain Size on Corrosion: A Review. J. Sci. Eng. 2010, 66, 7. [Google Scholar] [CrossRef]
  39. Kim, K.T.; Lee, J.H.; Kim, Y.S. Effect of Ultrasonic Nano-crystal Surface Modification (UNSM) on the Passivation Behavior of Aged 316L Stainless Steel. Materials 2017, 10, 713. [Google Scholar] [CrossRef]
  40. ISO 12732-2006; Electrochemical Potentiokinetic Reactivation Measurement Using the Double Loop Method. ISO: Geneva, Switzerland, 2006.
Figure 1. Schematic diagram of base metal, HAZ, and welded metal specimens.
Crystals 14 00531 g001
Figure 2. Schematic diagram of the ultrasonic shot-peening process.
Crystals 14 00531 g002
Figure 3. Residual stress in welds of 304L stainless steel after USP; (a) X-axis and (b) Y-axis.
Crystals 14 00531 g003
Figure 4. Optical microstructure of 304L stainless steel surface after USP (OM, ×200, 10% oxalic acid); (a) 304LB (base metal), (b) 304LW-H (HAZ), and (c) 304LW-W (weldment).
Crystals 14 00531 g004
Figure 5. Surface contour of 304L stainless steel before and after USP; (a) before USP and (b) after USP.
Crystals 14 00531 g005
Figure 6. SEM images of the surface of 304L stainless steel after USP (SEM, ×1000): (a) 304LB-USP, (b) 304LW-H-USP, and (c) 304LW-W-USP.
Crystals 14 00531 g006
Figure 7. X-ray diffraction patterns of 304L stainless steel after USP: (a) base metal and (b) weldment.
Crystals 14 00531 g007
Figure 8. Effect of USP on the surface polarization behavior of 304L stainless steel in de-aerated 1% NaCl at 30 °C and a scan rate of 0.33 mV/s: (a) 304LB (base metal), (b) 304LW-H (HAZ), and (c) 304LW-W (weldment).
Crystals 14 00531 g008
Figure 9. Effect of USP on the EIS of the 304L stainless steel surface in de-aerated 1% NaCl at 30 °C; (a) Nyquist plot, (b) Bode plot, and (c) polarization resistance.
Crystals 14 00531 g009
Figure 10. Optical microstructure of cross-section of 304L after USP (OM, ×200, 10% oxalic acid): (a) 304LB (base metal), (b) 304LW-H (HAZ), and (c) 304LW-W (weldment).
Crystals 14 00531 g010
Figure 11. EBSD results of 304L cross-section after ultrasonic shot peening (EBSD: step size of 0.16 μm, depth of ~150 μm): (a) band contrast, (b) IPF coloring, and (c) phase coloring.
Crystals 14 00531 g011
Figure 12. The hardness of the cross-section of 304L stainless steel after USP: (a) schematic diagram of hardness measurements and (b) results of hardness.
Crystals 14 00531 g012
Figure 13. Effect of USP on the polarization behavior of a cross-section of 304L stainless steel in de-aerated 1% NaCl at 30 °C at the scan rate of 0.33 mV/s: (a) 304LB, (b) 304LW-H, and (c) 304LW-W.
Crystals 14 00531 g013
Figure 14. Effect of USP on the EIS of the cross-section of 304L stainless steel in de-aerated 1% NaCl at 30 °C: (a) Nyquist plot, (b) Bode plot, and (c) polarization resistance.
Crystals 14 00531 g014
Figure 15. Effect of USP on the DOS of a cross-section of 304L stainless steel in the DL-EPR test [40].
Crystals 14 00531 g015
Figure 16. Effect of USP on the intergranular corrosion of 304L stainless steel by ASTM A262 practice C method [31].
Crystals 14 00531 g016
Figure 17. Proposed model for the variability in the microstructure and surface deformation of the 304L stainless steel by (a) welding and (b) ultrasonic shot peening.
Crystals 14 00531 g017
Table 1. Chemical composition of 304L stainless steel and filler metal (wt %).
-CCrNiMnSiCuMoCoPNSCb + TaFe
304L-0.0218.69.61.650.47--0.030.0220.070.03-Bal.
ER308LSpec.≤0.0319.5–22.09.0–11.01.0–2.50.30–0.65≤0.75≤0.75-≤0.03-≤0.03-Bal.
analysis0.01519.819.841.6910.3510.1150.0460.0300.0240.0410.030.008Bal.
Table 2. Welding conditions of the experimental specimen [11].
Welding ProcessCurrent (A)Voltage (V)Speed (cm/min)Shield Gas (%)Groove Angle (°)Welding
Electrode
GTAW245~25014~159~10Ar. 99.915ER308L
(Dia. 0.9 mm wire)
Table 3. Designation of the experimental specimen.
AlloyNon-PeenedUltrasonic Shot Peened
304LBase metal304LB304LB-USP
HAZ area304LW-H304LW-H-USP
Weldment304LW-W304LW-W-USP
Table 4. Ultrasonic shot-peening processing conditions.
Specimen
Type
ManufacturerMediaFrequency
(kHz)
Bead
Material
Medium
Diameter
(mm)
Bead
Weight
(g)
Amplitude
(µm)
Peening
Duration
(Min.)
Coverage Rate
Base metal and welded specimenSONATS
Stress Voyager
Air20304L425.5703>100%
Table 5. The corrosion factors of the surface of 304L stainless steel obtained from Tafel extrapolation.
SurfaceBase MetalHAZWeldment
304LB304LB-USP304LW-H304LW-H-USP304LW-W304LW-W-USP
* ER, mV (SCE)−248−285−278−241−20−231
** iR, nA/cm215.712.010.114.635.811.7
*** EP, **** Etr mV (SCE)9353561030254789−115
* ER: corrosion potential, ** iR: corrosion current density, *** EP: pitting potential, **** Etr: transpassive potential.
Table 6. Fitting parameters of the surface of the 304L stainless steel using EIS data.
SurfaceRs, Ωcm2Rp, kΩcm2Y, μScm−2snnError, %χ2
Base metal304LB31.68473.710.840.9155<10.00.0180
304LB-USP55.87139.636.920.7688<10.00.0525
Welds304LW52.667177.630.9016<10.00.0098
304LW-USP70.88210.238.000.7727<10.00.0496
Table 7. The corrosion factors of the cross-section of the 304L stainless steel obtained from Tafel extrapolation.
Cross-SectionBase MetalHAZWeldment
304LB304LB-USP304LW-H304LW-H-USP304LW-W304LW-W-USP
* ER, mV (SCE)−232−225−367−208−364−209
** iR, nA/cm210.81.842.81.961.71.5
*** EP, **** Etr mV (SCE)3109502174665528
* ER: corrosion potential, ** iR: corrosion current density, *** EP: pitting potential, **** Etr: transpassive potential.
Table 8. Fitting parameters of the cross-section of 304L stainless steel using EIS data.
Cross-SectionRs, Ωcm2Rp, kΩcm2Y, μScm−2snnError, %χ2
Base metal304LB80.8912334.4530.8860<10.00.0117
304LB-USP85.3730233.1920.9102<10.00.0127
HAZ304LW-H58.25452.25.4620.9131<10.00.0039
304LW-H-USP60.87905.84.1000.8943<10.00.0098
Weldment304LW-W58.75355.15.3970.9134<10.00.0050
304LW-W-USP90.9536493.4830.9120<10.00.0062
Disclaimer/Publisher’s Note: The statements, opinions and data contained in all publications are solely those of the individual author(s) and contributor(s) and not of MDPI and/or the editor(s). MDPI and/or the editor(s) disclaim responsibility for any injury to people or property resulting from any ideas, methods, instructions or products referred to in the content.

