Article

Indentation Behavior Assessment of As-Built, Solution, and Artificial Aged Heat-Treated Selective Laser Melting Specimens of AlSi10Mg

1
Department of Mechanical Engineering, NED University of Engineering & Technology, Karachi 75270, Pakistan
2
Mechanical and Industrial Engineering Department, College of Engineering, Imam Mohammad Ibn Saud Islamic University, Riyadh 11432, Saudi Arabia
3
Department of Metallurgical Engineering, NED University of Engineering & Technology, Karachi 75270, Pakistan
4
School of Metallurgy Engineering, Xi’an University of Architecture and Technology, Xi’an 710075, China
*
Author to whom correspondence should be addressed.
Crystals 2024, 14(7), 610; https://doi.org/10.3390/cryst14070610
Submission received: 8 May 2024 / Revised: 20 June 2024 / Accepted: 28 June 2024 / Published: 30 June 2024

Abstract

:
This study was conducted to determine the indentation behavior of thin AlSi10Mg specimens manufactured using Selective Laser Melting (SLM) in the as-built condition along with two post-treatments, namely solution heat treatment and artificial aging. Four different thicknesses of 1.0 mm, 1.5 mm, 2 mm, and 2.5 mm of SLM specimens, with the different post-treatments, underwent standardized Rockwell hardness tests using a spherical indenter to determine their hardness values and assess the impression using a stereo microscope and scanning electron microscope (SEM). The as-built specimens showed a trend of smaller indentation depths with increasing specimen thickness, and finally creased with 0.1547 mm depth at 2.5 mm. However, the post-treatments altered the behavior of the specimens to a certain degree, giving larger experimental indentation depths of 0.2204 mm, 0.1962 mm, and 0.1798 mm at 1.0 mm, 1.5 mm, and 2.5 mm thickness, respectively, after solution heat treatment. Artificial aging showed a general decrease in indentation depth with increasing specimen thickness in contrast to solution treatment, and resulted in depths of 0.1888 mm and 0.1596 mm at 1.0 mm and 2.5 mm thickness. Furthermore, a material numerical model was made using stress–strain data on ANSYS Workbench to develop a predictive model for the indentation behavior of the specimens in contrast to experimentation. Under multi-linear isotropic hardening, the Finite Element Analysis (FEA) simulation produced indentation geometry with an average accuracy of 95.4% for the artificial aging series.

1. Introduction

Additive manufacturing (AM) is a technique, unlike conventional manufacturing, where the material is deposited into layers and added to form the final piece. This layer-by-layer deposition is often achieved by the use of concentrated and targeted forms of lasers and electron beams, conventional arc sources, and through fused extrusion followed by any heating mechanism. This potential offered by AM makes it the right technique for rapid prototyping and quick fabrication of components for the maintenance of machines and special purposes such as aerospace, surgical tools, and orthopedics, not possible using subtractive manufacturing [1]. AM is an umbrella of several different techniques sharing the core principle and methodologies of deposition, where several factors such as materials used, the process needed to fabricate into a cohesive model, functionality, and the cost and time required to fabricate are important for the selection of an appropriate AM technique. However, the seven AM techniques are powder bed fusion (PBF), vat photo-polymerization, sheet lamination, binder jetting, material jetting, material extrusion, and directed energy deposition.
PBF is one of the techniques used in AM, where the material in its powdered form is fused using precise localized heating. This technique has seen its use in many different industries such as aerospace, medicine, biomedical, and armor [2]. When this precise localized heating is performed using a laser, the technique becomes a subset of PBF and is called Selective Laser Melting (SLM) [3]. In the SLM process, the laser power, hatch spacing/style, scanning speed, and layer thickness are adjusted to optimize the process and produce a model of desired mechanical properties and consistency [4]. SLM stands apart from most AM processes due to its ability to fine-tune the properties of the final model through adjustments made with the printing parameters as highlighted above. This also comes with added benefits such as being comparatively able to print complex parts with near-net-shape [5]. SLM is a very complicated process, as there is an interaction between a concentrated laser source and metal powder. The effects on the final product’s micro-structure, tensile strength, and fatigue properties have been studied within the context of powder conditions and SLM parameters such as scan speed, layer thickness, and scanning strategy among others [6]. Consecutively, it is also important to note where SLM might fall short, such as high machine cost, size restrictions, slower process, higher power usage, initial processing costs, tedious in process optimization, the possibility of creating rough surfaces, and even ultimately the development of anisotropic micro-structure in brittle and high-temperature materials [7].
Aluminum alloys, over the years, gained a bigger market share in several industries, specifically in automobile and aerospace, typically where more precision is required in manufacturing critical metallic parts. AlSi10Mg is a very versatile alloy of aluminum with great dynamic toughness, strength, and hardness. AlSi10Mg available in powder form is readily used in AM to make components with high corrosion resistance and mechanical strength [8]. There is a significant amount of literature on AlSi10Mg available based on its structure, porosity, and mechanical behavior, and a large portion of the literature is tied in with AlSi10Mg manufactured using SLM.
AlSi10Mg has been thoroughly investigated in multiple studies, such as the influence of the SLM process on the dynamic properties of AlSi10Mg [9], the quality control of AlSi10Mg specimens using metallography and CT scans [10], and in-depth evaluation of the micro-structure, fracture behavior, and high cycle fatigue of AlSi10Mg specimens produced using SLM [11,12]. In SLM, the laser power, scan speed, overlap rate, hatch spacing, and layer thickness are considered to be ideal in a study presented by Zhang et al. [13] using AlSi10Mg, produced specimens with much higher ultimate tensile strength (UTS) up to 364.0 MPa, yield strength up to 200 MPa, and elongation up to 12.04%, relatively with increasing thicknesses. These more resilient mechanical properties were the result of process optimization during SLM printing. The Vicker’s micro-hardness tests conducted showed a more scattered result, with a slight pattern on the specimens thicker than 2.44 mm, which shows larger and more identifiable variation. This lack of a verifiable trend in the study’s dataset makes it difficult to connect the behavior of micro-hardness with other mechanical properties such as the UTS and yield strength. Similarly, considering process parameters during the SLM process that play a major role in determining the mechanical properties of the final AlSi10Mg specimens, an investigation explored the manipulation of the process parameters to reduce the porosity of the AlSi10Mg parts and in turn increase the density. This study achieved a highest relative density of 99.8% at a scan speed of 500 mm/s, hatch space of 50 μm, and laser power of 100 W [14]. In a separate study by Majeed et al. [15] concerning the direct effect of the wall thickness of SLM-manufactured AlSi10Mg specimens on hardness, Vicker’s micro-hardness tests were conducted on specimens ranging from 0.5 mm to 5.0 mm in thickness. The study found that there is a significant correlation between hardness and wall thickness, as well as another variance, was observed as the indentations were moved away from the center of the test pieces. It was observed that the hardness of the thin-walled AlSi10Mg specimens increased with increasing thickness. The lowest hardness value was found to be 102.4 HV on the 1.0 mm-thick specimen, while the highest hardness value was found to be 137.3 HV on the 5.0 mm-thick specimen.
In the manufacturing of metal alloys, several industrial practices of post-treatment and/or heat treatment are practiced for specifically desired mechanical properties. AM consisting of metals often produces as-built parts with undesirable surface quality, mechanical behavior, and defects such as layer-by-layer deposition causing a ‘staircase’ effect, splatters, porosity due to inadequate fusing, and balling effects, all resulting in inconsistent surface morphology. Surface post-treatment includes polishing, machining, milling, electrochemical polishing, chemical polishing, bead blasting, sand blasting, laser polishing, and abrasive finishing among many other mechanical, electrical, chemical, and thermal techniques [16]. However, there are also certain types of mechanical post-treatment including cold working compression [17] and shot peening [18], where the surface of the metal component is struck to induce residual stresses that complement its mechanical properties to cause plastic deformation.
In addition to surface post-treatments as written above, other post-treatment methods augment the mechanical behavior by considering the relative density and micro-structure of metals primarily through thermal means. Annealing, quenching, hardening, and tempering are some heat treatment methods that alter the mechanical properties of the metal. Annealing in particular is performed to alter the micro-structure of the metal by subjecting the specimen to a temperature below the melting point [19]. This is performed to achieve increased ductility and a compromise in hardness by reducing internal stresses. There is ample literature available on different post-treatments of AlSi10Mg components, which had been fabricated using SLM. However, the main focus here are the post-treatments, where the specimens were executed and went through with, namely solution heat treatment (ST) and artificial aging (AA). A study found that the ST method at a temperature just below the eutectic temperature resulted in drastic changes to the micro-structure of both as-cast and SLM-manufactured AlSi10Mg, i.e., as-built (AB) SLM and as-cast AlSi10Mg was the hardest prior to post-heat treatment, and also found that silicon particles in heat-treated SLM AlSi10Mg were finer and more spherical as compared to the cast material [20]. This higher and good mechanical behavior in the AB condition of SLM is owing to rapid cooling and solidification in contrast to conventional casting and other techniques. The drive behind this exceptional behavior is the development of unusual micro-structure, which is only possible at the cooling rates of approximately 106 °C/s [21], several studies reported this outstanding mechanical behavior in the AB condition [13,22]. However, certain defects are also associated with obtaining this mechanical behavior at high cooling rates including porosity, poor surface roughness, crack formations, and thermal stresses, which further cause multiple geometrical defects [23].
To mitigate the above negative behavior and defects, ST and AA heat treatments are preferred and executed frequently as reported in the literature at the expense of a slight reduction in mechanical behavior. Apart from reporting the AB behavior of AlSi10Mg [13], the author of the manuscript also contributed a comprehensive comparison of ST and AA with the AB specimens [24] to relate the mechanical behavior at multiple thicknesses. The trend depicted a reduction in UTS and hardness more for ST and less for AA in contrast to AB SLM specimens while elongation showed a prominent improvement. Similarly, for the same specimen’s thickness range and SLM conditions, the author [25] drafted the effect and influence of heat treatment, i.e., ST and AA on relative density and porosity in comparison to AB AlSi10Mg. The results showed an increment in the relative density and a reduction in porosity with the increase in thickness for both heat-treated and as-built specimens. Apart from thin-walled specimens, Majeed et al. [26] also presented a blueprint of ST and AA execution on cubical-shaped AlSi10Mg specimens fabricated through SLM; the effect of heat treatment showed a similar response of improvement in relative density and reduction in porosity. The surface roughness as discussed previously, is also affected by ST and AA. A study from Majeed et al. [27] found that ST of AlSi10Mg specimens produced by SLM had reduced surface roughness by up to 17%. It can be observed that the effect of ST and AA on mechanical behavior in comparable to AB thin-walled SLM specimens further relating with relative density and porosity observations is somehow available. However, the influence of ST and AA on an indentation behavior assessment considering a range of thin-walled SLM specimens is not well explored.
The FEM is a numerical method used to solve complex engineering problems. At its core, this method involves deconstructing complex 2D or 3D geometric arrangements into smaller elements using a system of a mesh where each element, subject to boundary conditions, dictates partial differential equations depending on the nodes it has and the degree of freedom each node on the element has. A study was undertaken to determine the tensile and hardness properties of steel using a numerical solution on the Finite Element Model. The simulation consisted of testing out an energy-based spherical indentation (ESI) to determine several parameters in the FEA. The simulation was run using a spherical indenter, in 2D geometry, and the contact and meshing were defined using specific contact elements. The study, using the energy model, focused on the energy distortion theory, characterized by the von Mises stress/strain [28]. Another study was undertaken also using a 2D axisymmetric model with a rigid spherical indenter on elastoplastic composites to study the response in conjunction with Poisson’s ratio, Young’s Modulus, and strain hardening. The study derived a suitable predictive model for indentation response, particularly utilizing the elastoplastic properties of the material. It was found that the contact load and residual indentation depth were independent of the effective Elastic Modulus to yield strength ratio of the elastoplastic composites. The final proposed equations in the study predicted the Rockwell hardness of the elastoplastic composites close to experimental results [29]. Concerning numerical models to study the indentation response, there seems to be a lack of predictive models based on 3D assemblies that would account for radial deformation in the case of spherical indentation.
The existing research efforts show that there is a strong and consistent relationship between SLM process parameters, mechanical properties, and the post-heat treatments of AlSi10Mg, which was also considered a research gap for multiple studies reported in the last three years. The applications and versatility of AlSi10Mg formed through SLM are well understood along with several of its superior mechanical properties in the AB state. A significant theme of this study includes the effect post-treatments, ST and AA, have on the final components when executing indentation behavior assessment. It is important to note that indentation behavior on the SLM produced AlSi10Mg with varying thicknesses, 1.0 mm, 1.5 mm, 2.0 mm, and 2.5 mm, is not documented; however, this is also not consolidated and integrated with the post-treatment on the same specimens. It is therefore clear that there is a lack of understanding of indentation behavior concerning both component thickness and post-treatments. The indentation behavior is assessed both experimentally and simulated, which are directly compared geometrically in terms of indentation depths. In turn, the results are consolidated to gauge inaccuracies between the simulation and the experimental data.

2. Materials and Methods

This section provides the roadmap for the overall execution of work for this study, starting with the characteristics of AlSi10Mg powder and further printing of different thickness specimens with SLM. Two post-treatment methods were used, namely ST and AA. The specimens of AlSi10Mg with varying thickness and post-treatment, underwent hardness testing to study the indentation behavior. The AB and the post-treated, ST and AA, specimens were then used for the Rockwell tests while one specimen size of the same thicknesses.

2.1. Material Utilization

The gas-atomized AlSi10Mg powder was utilized in this study for the execution of experimentation and preparation of specimens from the SLM process. This powder was sourced from Powder Alloy Corporation (PAC) based in the USA. The average particle size of the powder is within 15 μm to 58 μm; however, prior to the fabrication of SLM specimens, the powder was dried in a vacuum furnace at 70 °C for approximately 4 h. For more detailed information regarding the chemical composition, powder size distribution, and shape morphology, readers can refer to the author’s previous publications [13,24,25], which provides more insight information about powder characteristics.

2.2. Specimen Preparation Using SLM

The SLM 280HL, SLM Solution, was utilized for the preparation of specimens of AlSi10Mg, which is equipped with two fiber lasers of a maximum capacity of 400 W power with a maximum scan speed of 10,000 mm/s along with the production of 80 µm in the diameter of the laser beam. The consideration of process parameters for the execution of experimentation is an important decision. For this work, the optimum process parameters are set in on the machines by focusing on the continued theme of mechanical and heat treatment behavior and relation from the SLM specimens integrating with the author’s initial studies [13,24]. The utilized process parameters are provided in Table 1.
Further, the specimens were manufactured with the above process parameters using SLM as a rectangular thin-walled shape. The specimens were printed in bulk, with discrete incremental thickness from 1.0 mm to 2.5 mm. Specimens with varying thicknesses considering 1.0 mm, 1.5 mm, 2.0 mm, and 2.5 mm were used for this study. These specimens were first segregated by the post-treatment process they went through, namely as-built (AB), solution heat treatment (ST), and artificial aging (AA). With these short terms, the pieces were labeled to be easily distinguished. For each different set of specimens for the same post-treatment, the specimens were taken of varying thickness (t). The thickness was measured after one side of the surface on each piece was polished using fine 800 to 1200 grit emery paper before standardized Rockwell hardness tests. Figure 1 shows the dimensions of the specimens, where (t) is the varying thickness of each specimens, and all the units shown are in mm. Table 2 shows the naming scheme used for each specimen, showing each different post-treatment and as-built specimen with specific two-letter coding for denotation. The four different thicknesses for each type of post-treatment and AB specimens as shown in Table 2, i.e., 1.0 mm, 1.5 mm, 2.0 mm, and 2.5 mm, which have been kept consistent.

2.3. The Heat Treatment Process

Following the printing of the specimen in different thicknesses, selected pieces underwent ST, AA, and some were left AB. The solution heat treatment process started with the specimens at room temperature (around 30 °C) and brought up to the temperature of 530 °C and 540 °C, by an increment of 13 °C/min, and held at that temperature in the furnace for 2 h. Immediately after the 2 h, the specimens were quenched in a tank of water at room temperature.
The process for AA starts off the same as in the ST process, where the specimens were brought up to temperature from 30 °C to 530 °C with increments of 13 °C/min as before and then held at that temperature in the furnace for 2 h before being immediately quenched in a tank of room temperature water. Furthermore, right after this process, the temperature of these specimens was raised again from 30 °C to 155 °C in a separate heating oven with increments of 7 °C/min. Upon reaching the target temperature of 155 °C, the specimens were held at that temperature for 12 h for AA. After that time had elapsed, the specimens were removed from the heating oven and left in the ambient air to gradually quench down to room temperature [24].

2.4. Hardness Indentation Testing and Data Gathering

To have a more standardized approach to test the indentation behavior of AlSi10Mg, a standardized hardness test for thin sheet metals from the Rockwell scale was chosen. As per the methodology prescribed in the ASTM manual “E18–20 Standard Test Methods for Rockwell Hardness of Metallic Materials”, the first step is to specify which Rockwell scale and indenter is to be used. For the metallic thin wall specimens, the ‘F’ scale with tungsten carbine ball (1.588 mm) indenter was used.
First, the indenter is brought down to contact with the test specimen at a preliminary test force F0, which is 10 kgf (98 N) on the ‘F’ scale, which is held for a specific dwell time until the scale is stable. This is followed by gradually increasing the test force to the total force F, which is 60 kgf (589 N) on the ‘F’ scale, which is held for a specific dwell time until the scale is stable. After the reading is stabilized on the scale, the additional test force is removed until the indenter is only exerting the initial preliminary test force, F0. The reading at this stage is then recorded, if using a standardized Rockwell hardness testing machine, the scale directly gives the hardness number [30]. For each test specimen, the indentation test was carried out twice under the same conditions. When using the F scale with a tungsten carbide ball of 1.588 mm diameter (1/16 in), the hardness number is denoted by “HRFW”. This value for ball indenters is calculated using Equation (1), where h is the depth of the indentation.
R o c k w e l l   H a r d n e s s   H R F W = 130 h 0.002
The same specimens were also used to study stress and elongation behaviors in a separate study. However, the stress–strain data from the experiments conducted on these specimens are utilized to derive the initial material properties for the FEA simulation. As the process of indentation in standardized hardness tests involves the non-linear, plastic deformation of the specimens, the behavior of the material after the elastic limit is particularly important for the numerical solution. Young’s Modulus, also known as the Modulus of Elasticity, is the gradient of the stress–strain curve up to the elastic proportionality limit. The data for calculating the Modulus of Elasticity are taken within the elastic region, which is characteristically defined right before the initial kink in the stress–strain data.
The “ASTM E8/E8M-22 Standard Test Methods for Tension Testing of Metallic Materials” gives us the engineering stress–strain graphs [31]. The engineering stress–strain assumes a constant cross-section area of the specimens even if it goes under isotropic elongation and necking. Equations (2) and (3) convert engineering stress and strain to true stress and strain,
σ t r u e = σ e n g i n e e r i n g × ( 1 + ε e n g i n e e r i n g )
ε t r u e = l n ( 1 + ε e n g i n e e r i n g )
where
  • σtrue = true stress, and
  • εtrue = true strain.
Using Equations (2) and (3), the true stress–strain can be calculated from the engineering values obtained from the standardized tensile testing. The resulting data give the plastic stress–strain behavior of the material.
To determine the depth of the indentation, we know the diameter of the indenter to be 1.588 mm, and the stereo microscope or SEM images gives the radius of the circular indent on the specimens. Through geometry, it is detectable that the sagitta is the height of an arc perpendicular from the midpoint of the arc’s chord to the arc itself. Hence, the depth of the indentation can be calculated as the sagitta of the chord induced by the indenter on the work piece, given by Equation (4).
s = r ( r 2 l 2 )
In Equation (4), sagitta ‘s’ is the depth ‘h’ of the indent, half of the chord length ‘l’ is the radius of the indent, and radius ‘r’ is the radius of the spherical indenter. Here, the sagitta ‘s’ is the indentation depth taken from the radius of the indentation ‘l’. Using this equation, the indentation depths were calculated from the radius of the indentation.

2.5. Finite Element Analysis Simulation

The geometry used for the simulation was designed on PTC Creo as a parametric model in the .step file format. Several factors are taken into consideration when designing the Finite Element Method Model, such as geometry, material model properties, boundary conditions, meshing, and mesh independence. The FEM model was used to provide a predictable model for the indentation behavior of the specimens as well as give a reliable Rockwell hardness number based on the indentation depth.
The material is added as a non-linear material in the ANSYS software package using the plastic stress and strain behavior from tensile testing. This particular set of properties is reliant on the results of the stress–strain curves derived from the other study involving tensile load tests. What is needed in particular is Young’s Modulus of the specimen, which is derived from the gradient where the stress–strain graph is still at its linear elastic proportionality. The Young’s Modulus was derived from the stress–strain graphs of the AB, ST, and AA specimens. The non-linear behavior of the material is added after calculating plastic stress and strain using Equations (2) and (3). This non-linear stress–strain behavior is added separately for each different thickness of the specimens.
The analysis was set to 4 sub-steps, each 1 s long, following the quasi-equilibrium condition, where energy is conserved at the end of each sub-step as per the static structural model. The contact between the indenter and the specimen is a non-linear contact and is set to be frictionless to negate energy losses by contact sliding. The movement of the indenter is fixed as a translation movement to the ground origin, using a remote displacement condition that restricts translation along the x and y-axis, and restricts rotation about the x, y, and z-axis, allowing only translation about the z-axis. The resultant force, while through non-linear contact due to the spherical structure of the indenter, is set to be normal to the top of the specimen. The force was added as per the standardized Scale F Rockwell test, with an initial load of 98 N followed by a gradual increase to 589 N, and then returned back to 98 N to simulate the exact conditions of the standardized Rockwell test. The force profile was divided with each separate sub-step, following the loading and unloading profile in the standardized Rockwell test.
The meshing method for the volume of the specimen was Cartesian. As the volume of the specimen is in cuboid shape, a Cartesian mesh is consistent with the geometry. Further iterations are made using the program when applying the solution convergence step on the meshing to achieve better grid/mesh independence in the final results. As the initial FEA results are very heavily reliant on the quality, sizing, shape, and methodology of the mesh used, mesh independence in the final results is achieved by applying system-controlled convergence on the z-directional deformation results. The convergence step is set to only allow maximum allowable change under 10% and reiterate the mesh refinement until this criterion is fulfilled.

3. Results and Discussion

3.1. Rockwell Hardness Test Results

The Rockwell hardness values, HRFW, were recorded for each specimen twice, and the average value was used for representation. After the indentations were made on each piece, they were photographed under a stereo microscope and the size of the indentations was measured. The stereo microscope images were taken for all the specimens to make more detailed observations about each deformation, which are shown in Figure 2, Figure 3 and Figure 4. Figure 2 shows the stereo microscope image of AA specimens; the diameter of the indents on the same specimen is close and there is not much deviation between the two tests on each piece. This ensures the repeatability of the tests through the Rockwell testing machine used. The thinnest specimen is AA-1 (Shown in Figure 2a), which increases to AA-4 (Figure 2d) being the thickest consecutively, and it can be observed that the smallest indent radius of 477.4 microns is on AA-4, which is 2.5 mm thick. Meanwhile, the largest indent radius of 514.0 microns is on AA-1, which is 1.0 mm thick. The AA-2 (1.5 mm) has the highest Rockwell hardness in the series based on the average and consistency of two relatively small indentation sizes.
Figure 3 shows the stereo microscope images of the ST specimens with the different sizes of the indentations. ST-1 (1.0 mm) has provided the indentation impression of 549.0 microns while ST-2 (1.5 mm) is of 522.6 microns radius as depicted in Figure 3a and Figure 3b, respectively. However, the ST-3 (2.0 mm) has the smallest indentation in the ST series with a radius of 483.9 microns, resulting in the highest Rockwell hardness values in the same series. ST-4 (2.5 mm) has shown indentations with an average value of 503.2 microns, which is larger than ST-3 but still relatively smaller than ST-1 and ST-2. From existing data on the relative densities [25], it can be seen that the relative density is significantly improved from 1.0 mm (ST-2) to 1.5 mm (ST-3), which has a direct effect on the size of the indentation, causing a rise in hardness from 56.75 to 61.50. The ST specimens in particular seem to deviate to form a coherent indentation depth trend with thickness ranging from 1.5 mm to 2.5 mm. However, this is also more pronounced in the ST specimens as this heat treatment cycle is known to induce greater ductility.
The indentations on the AB specimens are shown in Figure 4. AB-1 (1.0 mm) has both indentations of approximately the same size of 509.0 microns, while AB-2 (1.5 mm) has slightly smaller indentations of 477.4 microns and 503.2 microns. AB-3 (2.0 mm) produced smaller average indentations than AB-2, both being 479.0 microns. AB-4 (2.5 mm) has the smallest average indentation size of 471.0 microns in the series. The general trend considering average indentation sizes is that the size of indentation decreases with increasing specimen thickness with very few inconsistencies.
Table 3 tallies all the results from the Rockwell indentation tests along with the average radius of indent on each specimen. The AB specimens, unlike the post-treated specimens, show a consistent increase in average Rockwell hardness from 46.75 HRFW to 75.5 HRFW, and a subsequently decreasing average indentation size. This trend is not consistent with the AA specimens, where average hardness increases from AA-1 to AA-2 but stays virtually the same in AA-3 and AA-4, in the range of approximately 60 HRFW to 65 HRFW. The ST specimens show a consistently increasing trend in Rockwell hardness from ST-1 to ST-3 but show a decrease in the end with the thickest specimens of the series, i.e., ST-4.
Figure 5 shows the graphical trending of Rockwell hardness data from the experiments as given in Table 3. It can be observed that there is a slight but inconsistent trend of increasing hardness values with specimen thickness, with the trend for the AB specimens showing a very clear increasing trend. For comparison, the AB specimens have a higher hardness at the smallest and greatest thicknesses, i.e., 1.0 mm and 2.5 mm, which is followed by AA specimens. However, at 1.5 mm, the AA specimen had the highest hardness, and at 2.0 mm, the ST specimen had the highest hardness. Equation (4) was used to approximate the depth of indentation from the radius of indents. The trend of indentation depth is generally consistent for each of the three series, where increasing hardness values correspond with decreasing indentation depths. The indentation depth, right at the center of the spherical indentation is also measured from the FEA simulations for direct comparisons as provided in Section 3.3.

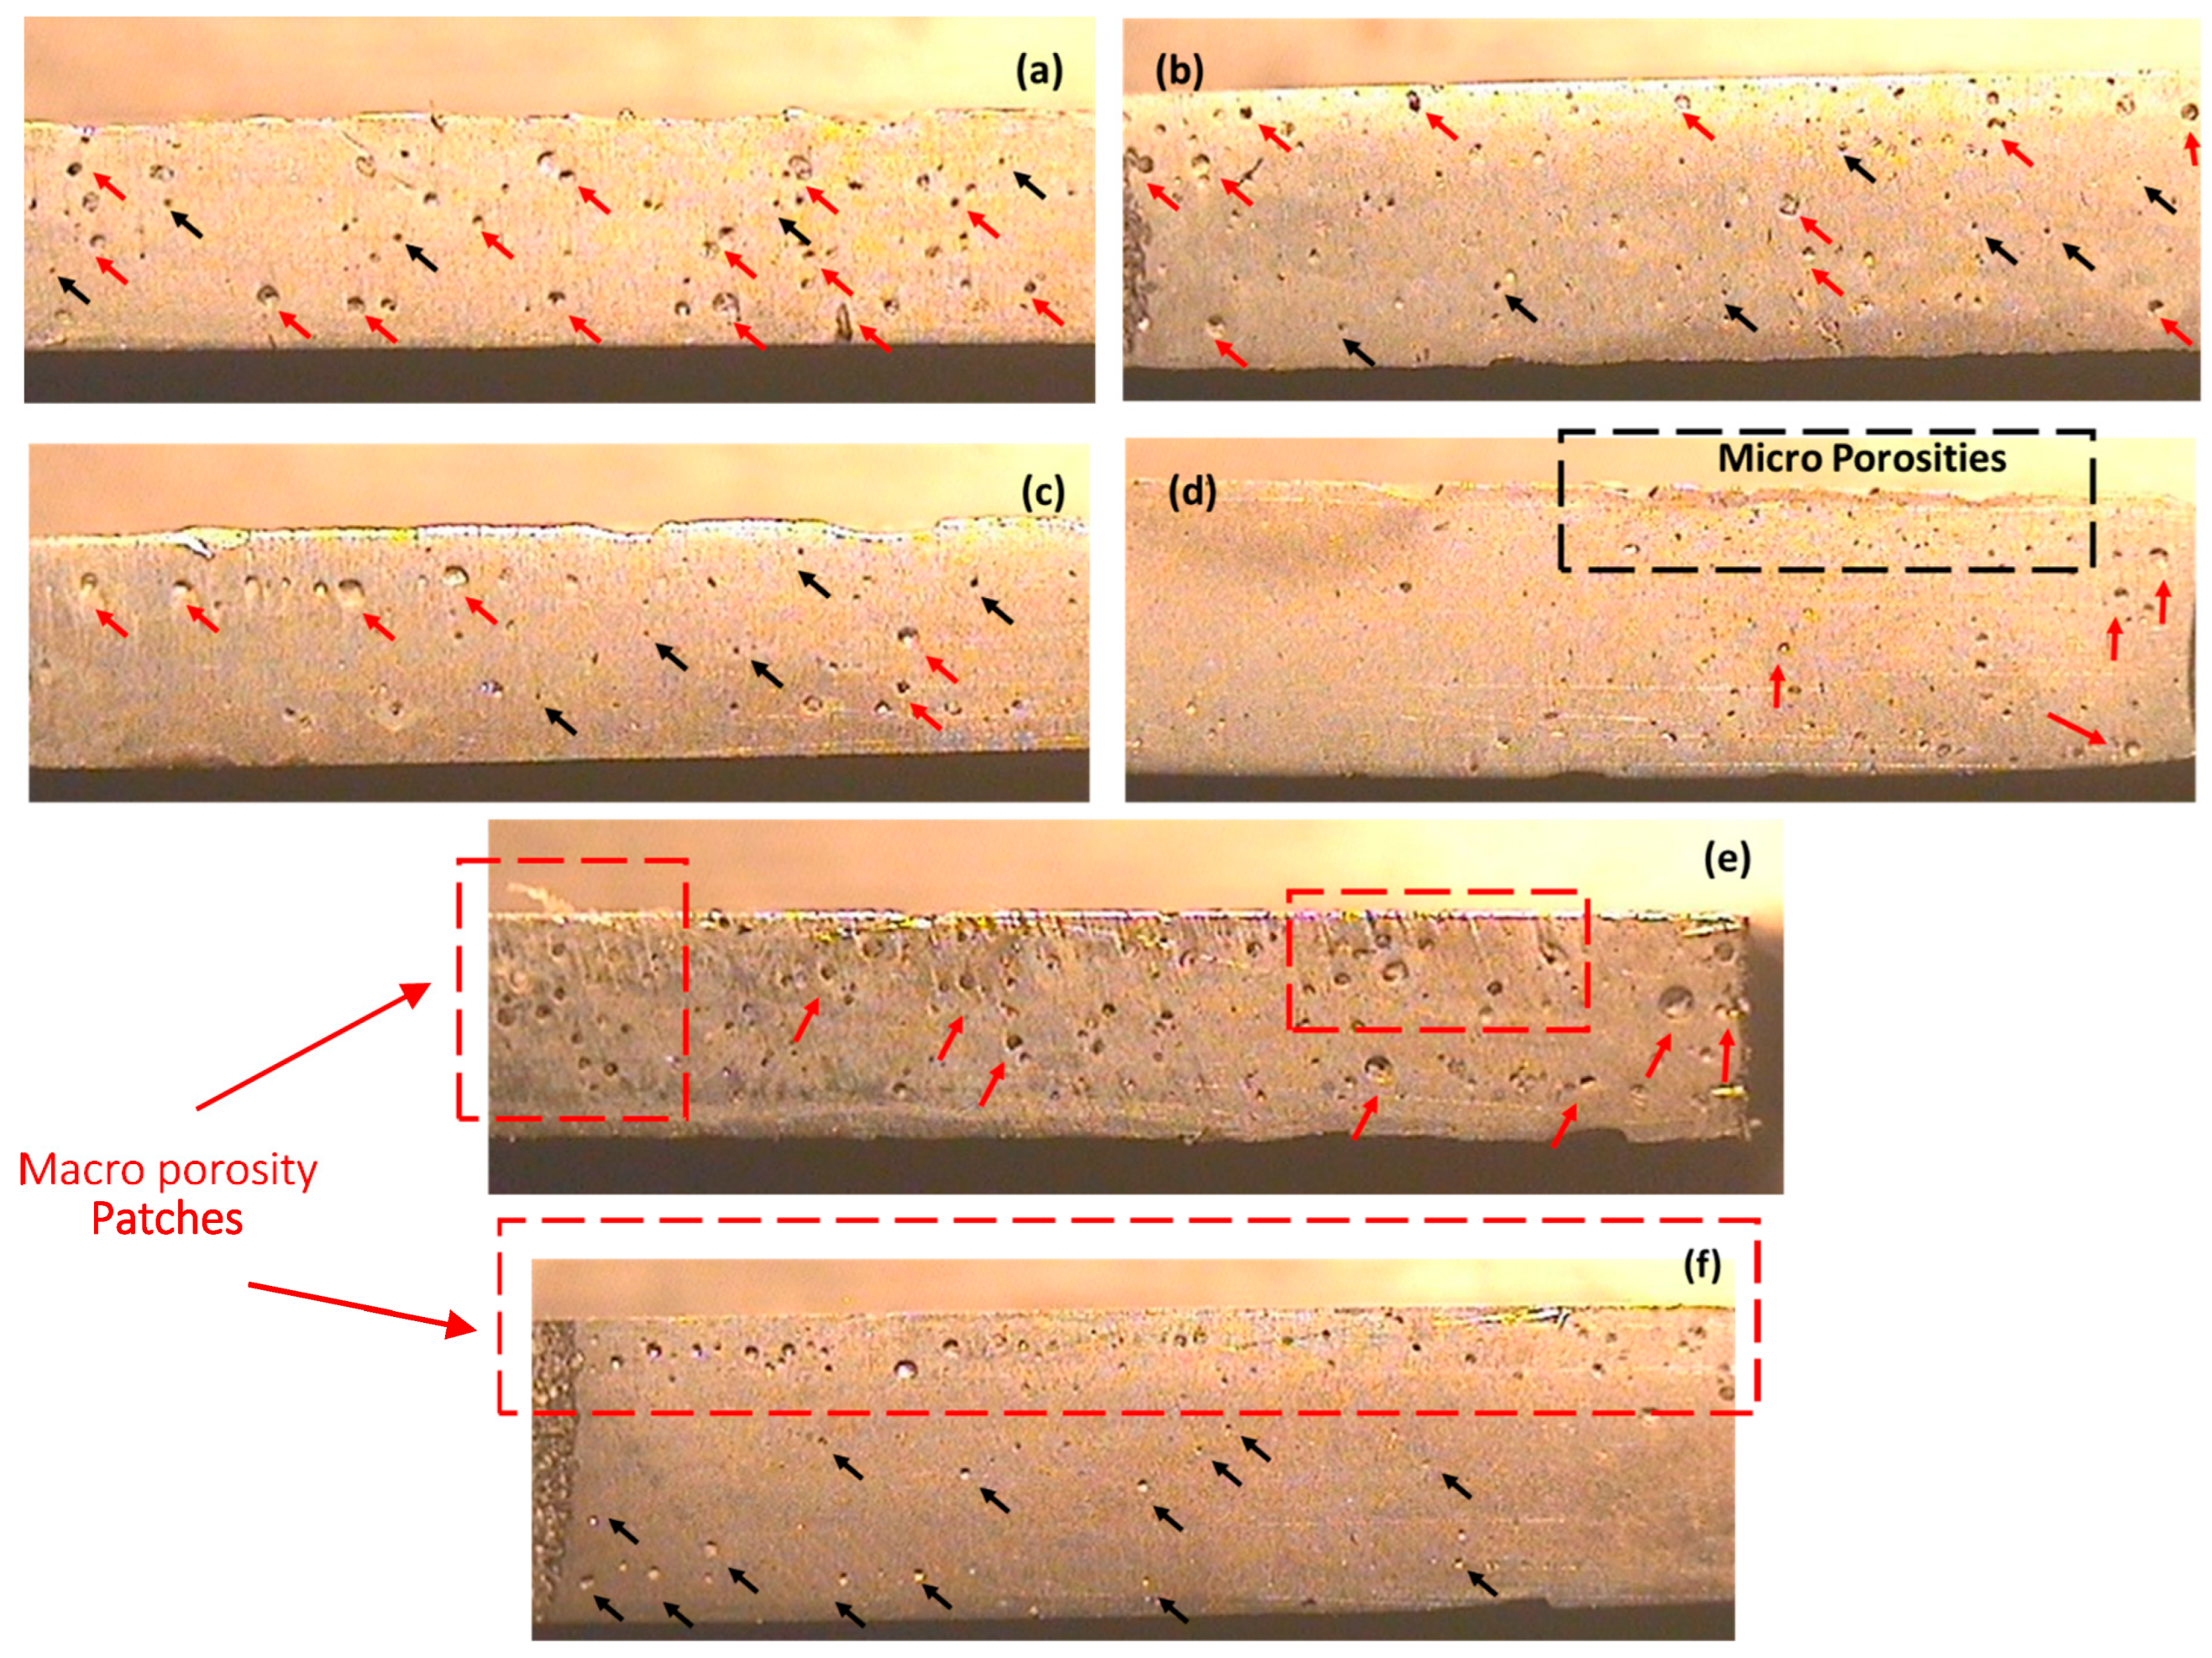
Effect of Developed Porosity on the Indentation Behavior

There is very little work available highlighting the combined effect of wall thickness and heat treatment on the indentation behavior assessment of AlSi10Mg fabricated with SLM concerning the developed porosity. Porosity is considered a key defect and is often easily detectable in the AB SLM components of AlSi10Mg. There is a strong relation of porosity with the mechanical and the indentation behavior assessment, as these properties are dependent on the densification with minimal porosity in structure. For this, the stereo microscope images of porosity at different thicknesses of specimens in the as-built and heat-treated conditions are presented in Figure 6a–f. The outcomes regarding the indentation assessment considering the radius and the depth of the indent are presented in Section 3.1, specifically highlighted in Table 3. Moreover, the assessment of indentation behavior depicts a noticeable relation with a decline in indentation depth causing any improvement in porosity against the variation in wall thickness and heat-treatment execution.
Therefore, the porosity and the density show the stability and strength of the developed additive product. So, the relative density (RD) is the term that directly correlates the available voids and the porosity in the AB, ST, and AA specimens at different thicknesses from 1.0 to 2.5 mm. For this, an experimental draft is required to provide the comprehensive assessment of RD at different thicknesses of specimens printed through SLM. Arfan and Muzamil et al. [25] presented a comprehensive blueprint demonstrating the evaluation of RD at different levels of thicknesses even up to 5 mm at the same parameters of SLM. Considering this, a relationship of RD, i.e., the available porosity, can be developed with the indention behavior against the printing of specimens from 1.0 mm to 2.5 mm in AB, and further with ST, and AA post-treatment conditions.
Figure 6 shows the microscopic images of AlSi10Mg specimens for a comparative purpose at two thicknesses, i.e., 1.5 mm and 2.5 mm, in the AA, ST, and AB conditions, where the occurrence of macro and microporosity are observed at various locations. Before conferring Figure 6a–d of AA and ST, the discussion starts with the microscopic images of AB condition specimens provided in Figure 6e,f. The micrograph of 1.5 mm wall thickness is shown in Figure 6e, where the largest sizes of macro porosity along with more in quantities (highlighted with red arrows) are available. In this AB condition of 1.5 mm, the size of porosity can range from 21.8 to 133.7 µm [25], whereas the two patches of macro porosity are also indicated in Figure 6e. Further, there is a clear indication of the reduction in porosity when thickness increases to 2.5 mm as shown in Figure 6f. The sizes of macro pores were also reduced (indicated with a patch of red color, Figure 6f) in contrast to the patches highlighted in Figure 6e and became concentrated at the edge of specimens. However, the signs of microporosity become palpable at the lower mid-region of the specimen indicated by black arrows in Figure 6f. Similarly, the microscopic images of ST SLM specimens, of 1.5 mm and 2.5 mm thickness, presented in Figure 6c,d provided a reduction in the sizes of porosity in comparison to AA. Here, in Figure 6c, some small to large macro pores are indicated with red arrows for 1.5 mm, while a significant reduction in pore sizes with the increase in thickness to 2.5 mm is depicted in Figure 6d. This behavior of the above improvement w.r.t increase in the thickness of SLM specimens is also reported in the draft of Zhang et al. [13], and graphically illustrated in the author’s recent study [32].
From Figure 6c,d, it can be observed that the ST has provided an equitable impact on the reduction in porosity and improved the RD of specimens from 93.42% to 95.93% as reported in [25] for 1.5 mm to 2.5 mm thickness. Apart from increasing the thickness, the behavior of densification also attains an improvement by employing the heat treatments, which causes a change in the internal grain structure and microstructure, and a reduction in porosity [33,34]. However, when AA is investigated and analyzed in Figure 6a,b, it is revealed that the macro pores were decreased in size and randomly oriented in contrast to AB. The porosity sizes for the 1.5 mm-thick specimen in the AA condition, provided in Figure 6a, probably reduced to 10.40 to 95.70 µm [25]. This would have happened cause of proper heat treatment, which made further fine bonding of the loose particles and good inter-layer bonding from the initial condition of SLM fabrication. It can be observed further from Figure 6b that there is a significant reduction in the porosity and size of macro pores when moving on to the thickness of 2.5 mm in AA. Here, the RD is progressively increased in AA from 94.11% to 95.11% for 1.5 mm and 2.5 mm specimens as reported in [25].
As highlighted in the above micrographs (Figure 6a–f) and the study of RD [25], apart from good RD at 1.0 mm-thick SLM specimen, the increasing RDs can be obtained and reported for 1.5 mm to 2.5 mm thickness of specimens on the AA, ST and AB conditions due to sufficient melting, fine and good bonding of particles and interlayers. This relation of RD [25] along with the reduction in porosity (Figure 6a–f) is in-line with the obtained results of indentation assessment, i.e., indentation depths, as reported in Table 3. The indentation depths for all three conditions, i.e., AA, ST, and AB, are generally reported to decrease with the increase in the wall thickness from 1.0 mm, 1.5 mm, 2.0 mm to 2.5 mm. The lowest values of indentation depths at their respective thicknesses are reported for the AB conditions because of good initial mechanical behavior offered by the SLM process, while the largest depths are reported in Table 3 for ST specimens. This behavior of ST specimens is the cause of the microstructural aspect, where the large globalized Si-Particles were formed at the loss of inter-connectivity of Si-network in the cellular structure [35]. This ultimately induces the ductility and softness in the α-matrix, which results in the higher indentation depths. However, ST-4 showed increased indentation depth in contrast to ST-3, which is not in harmony with the obtained trend, possibly because the network of Si-rich cell boundaries was completely broken, and even the coarser large Si particle density is quite low in the matrix [32].

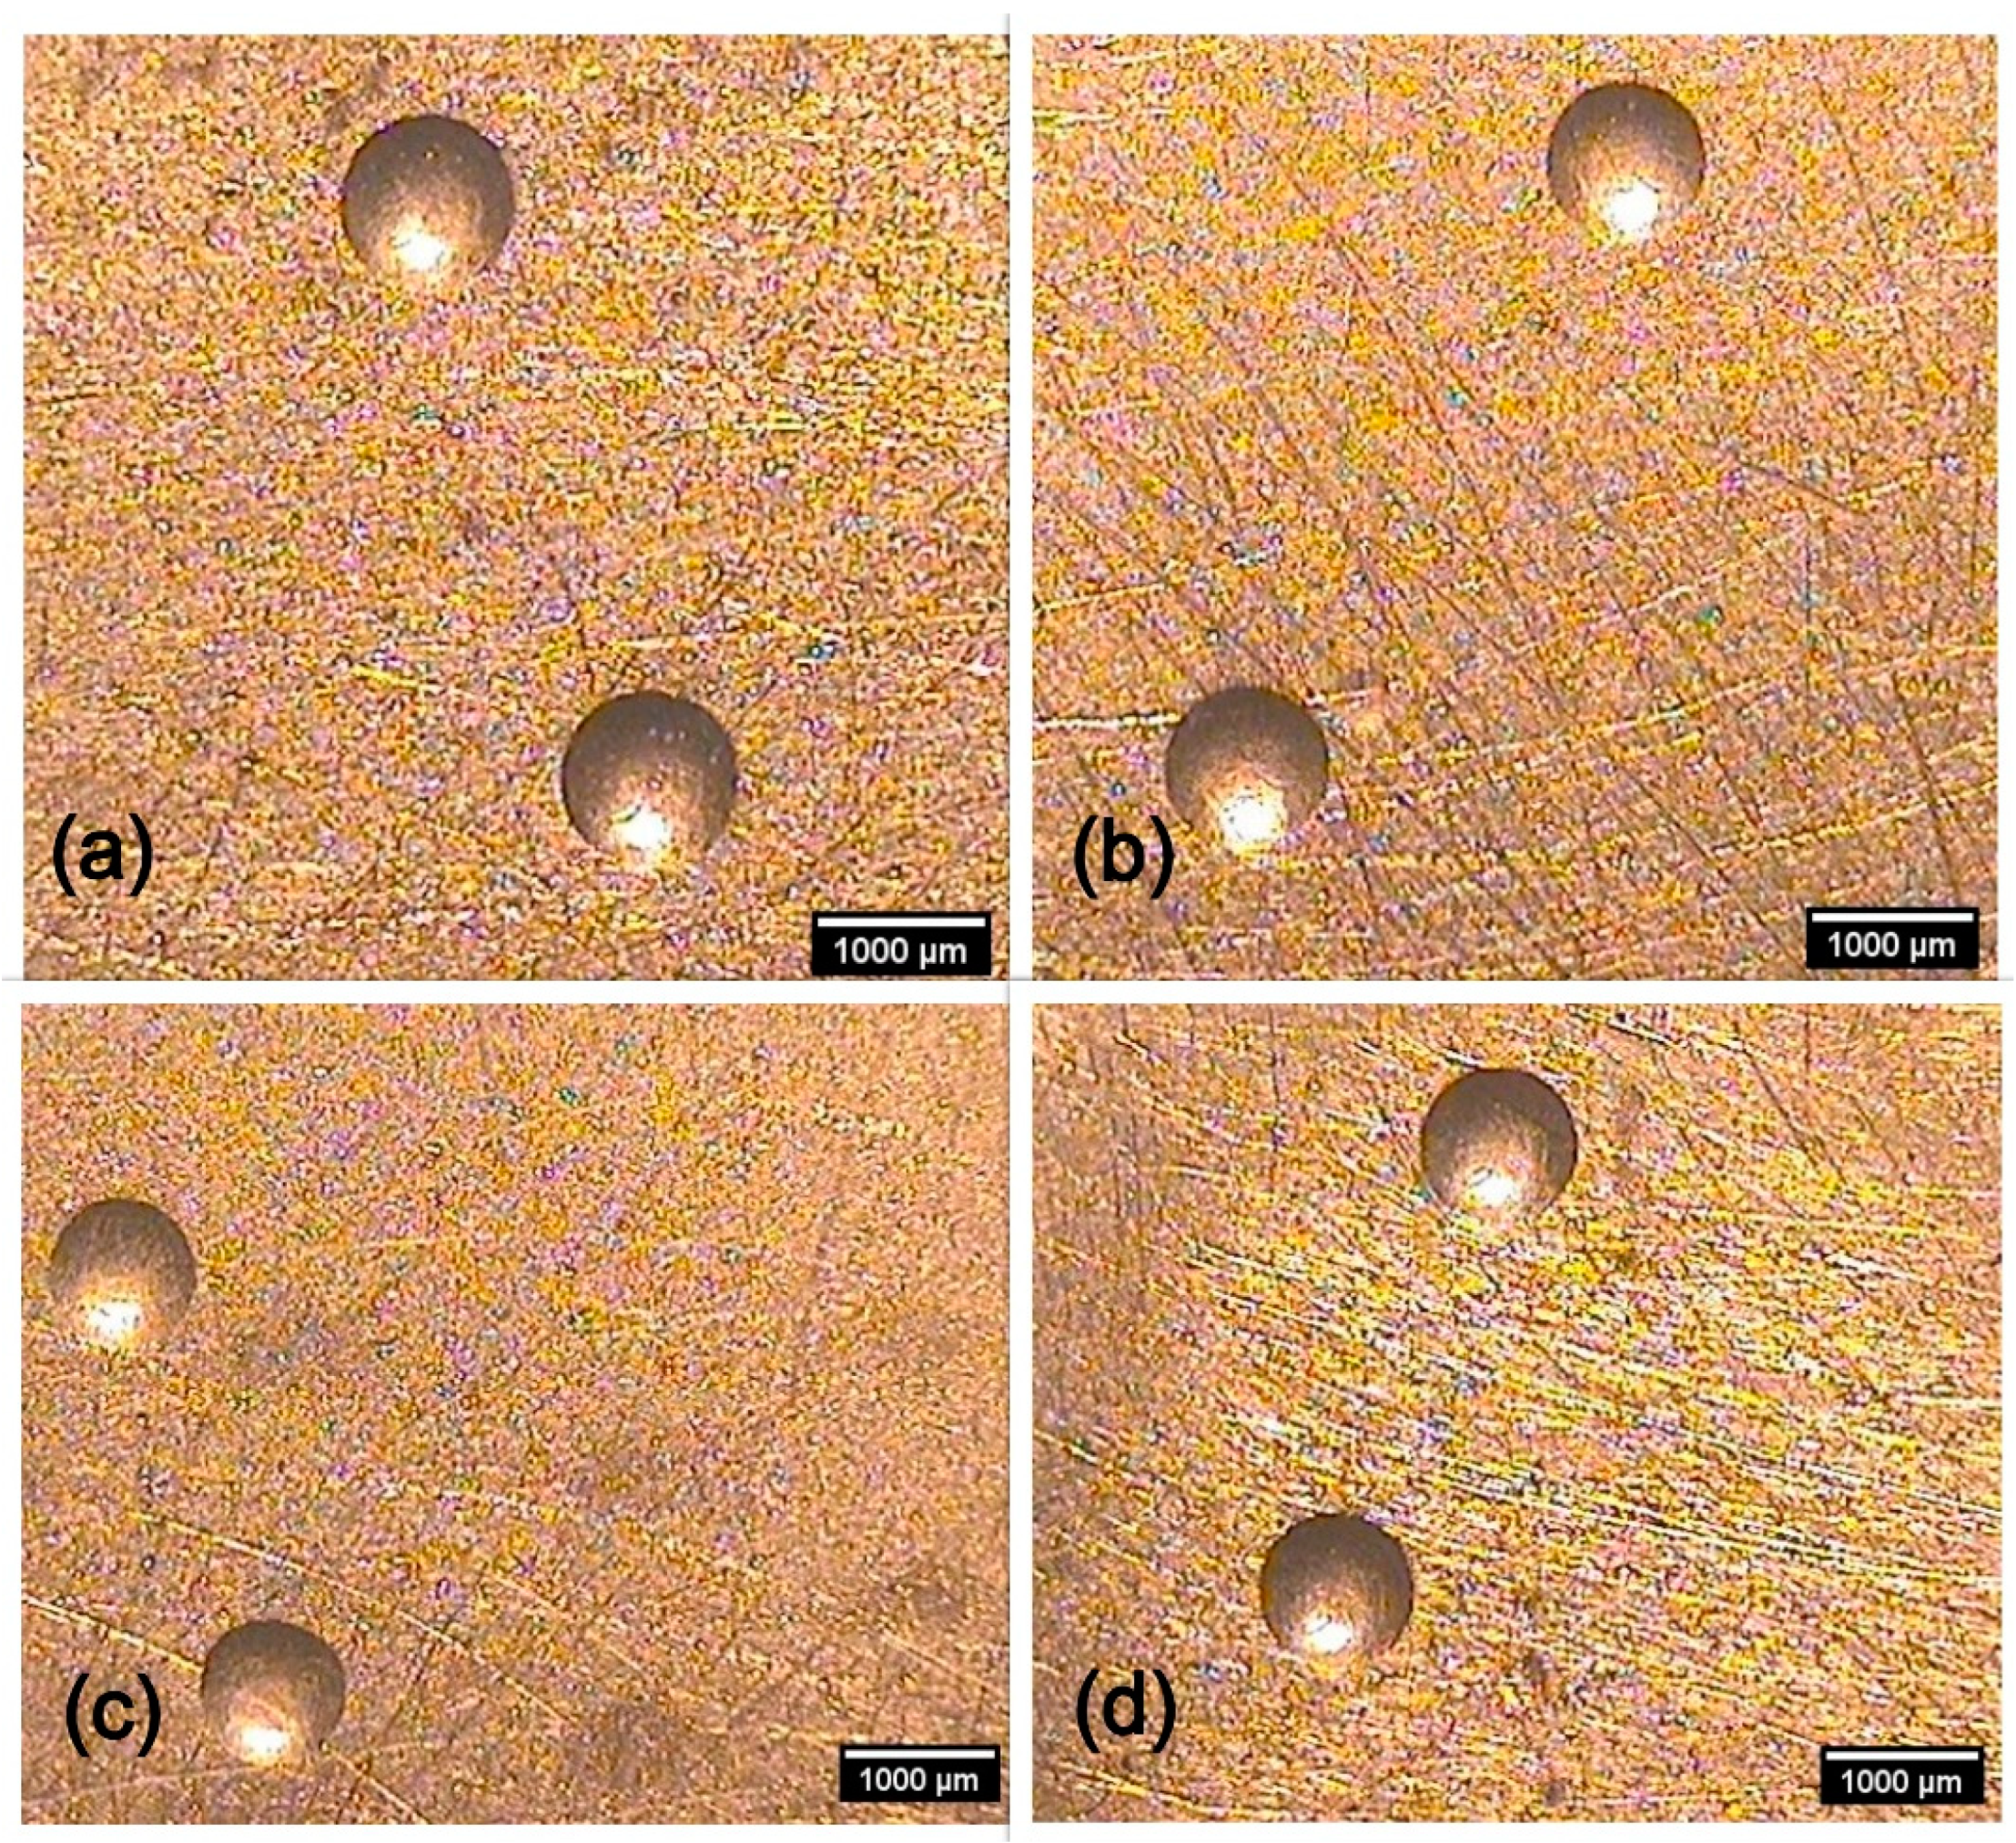
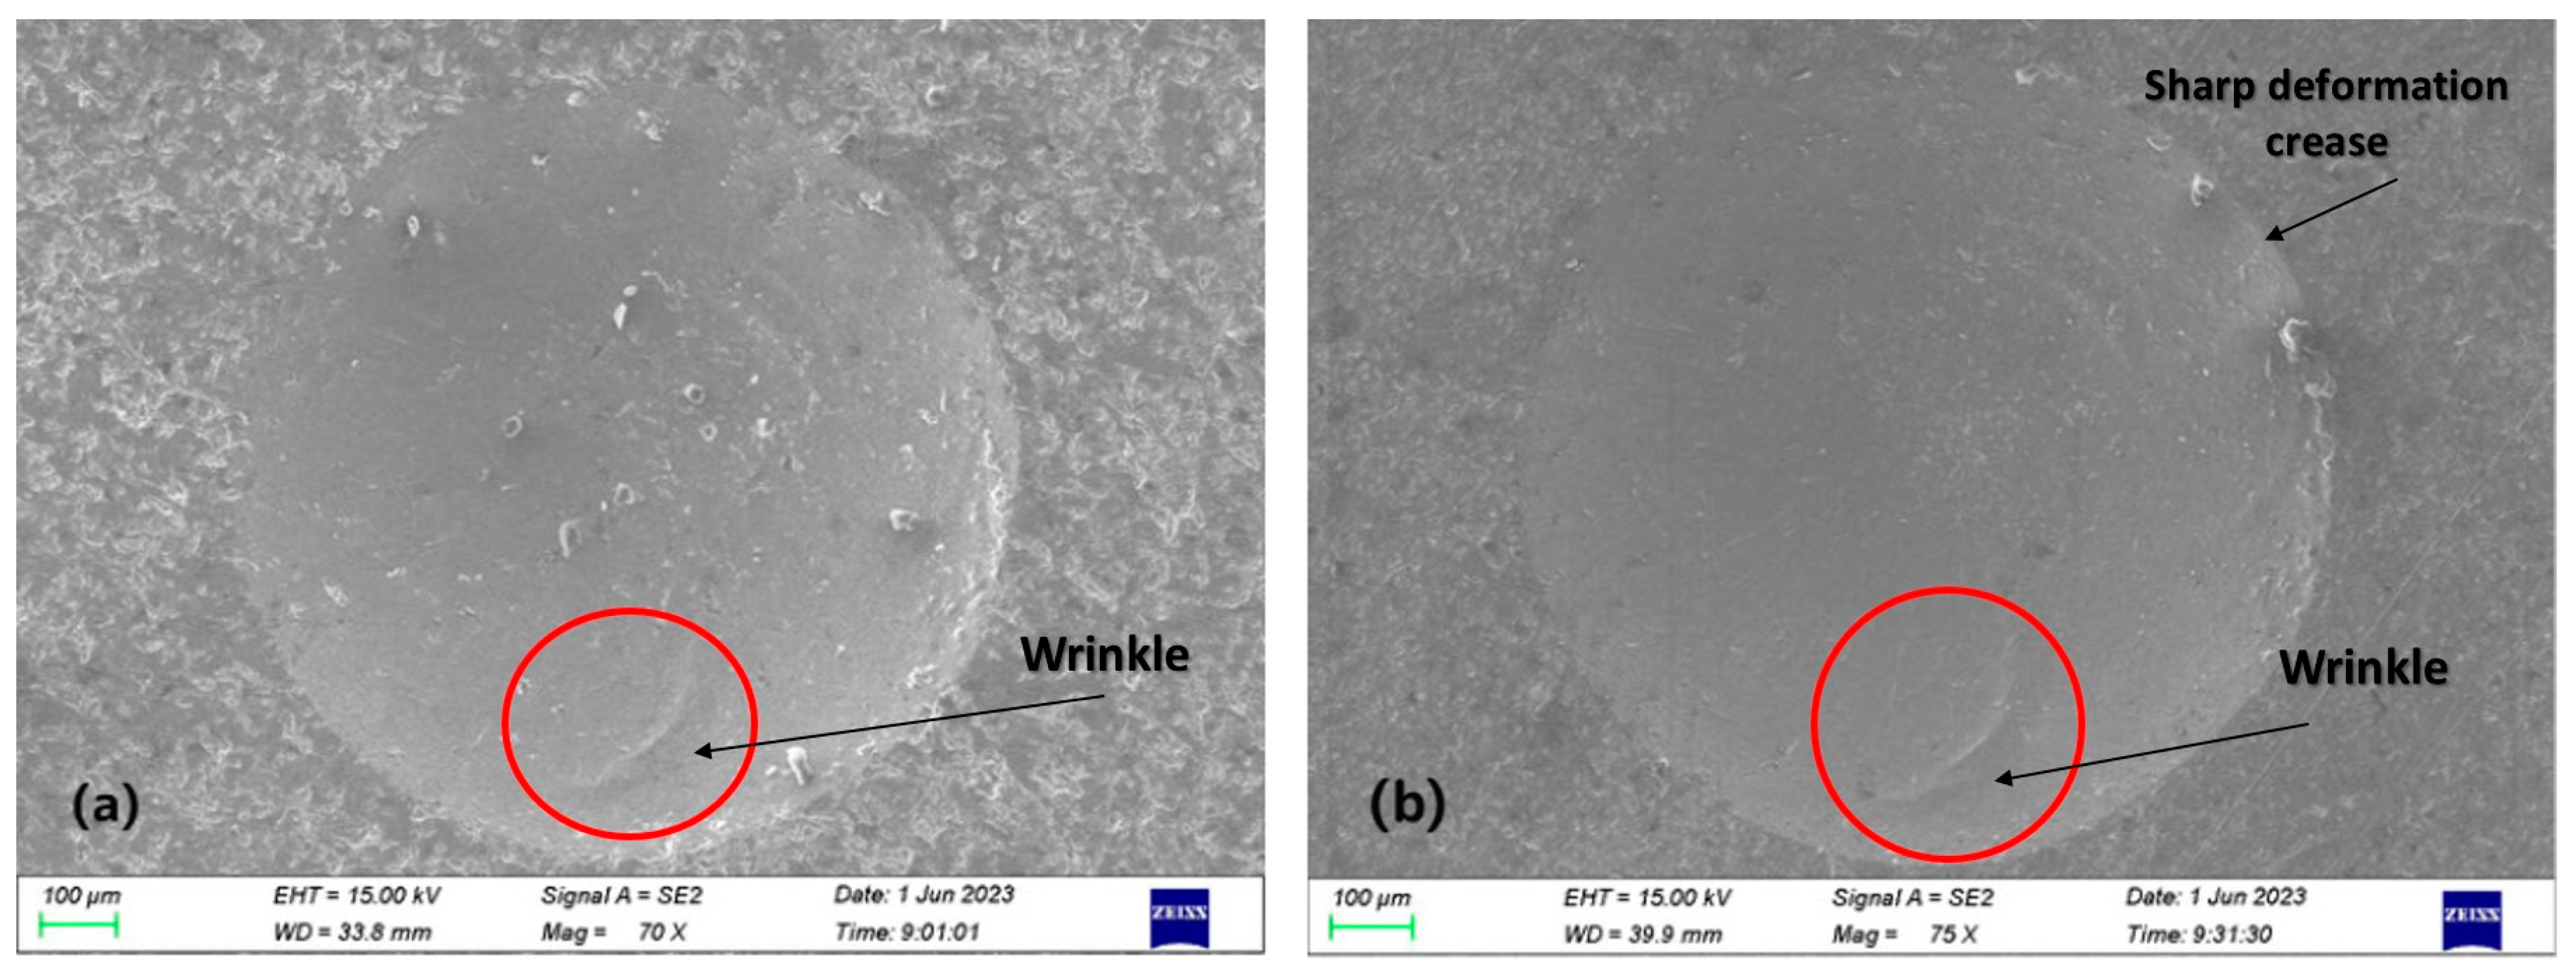
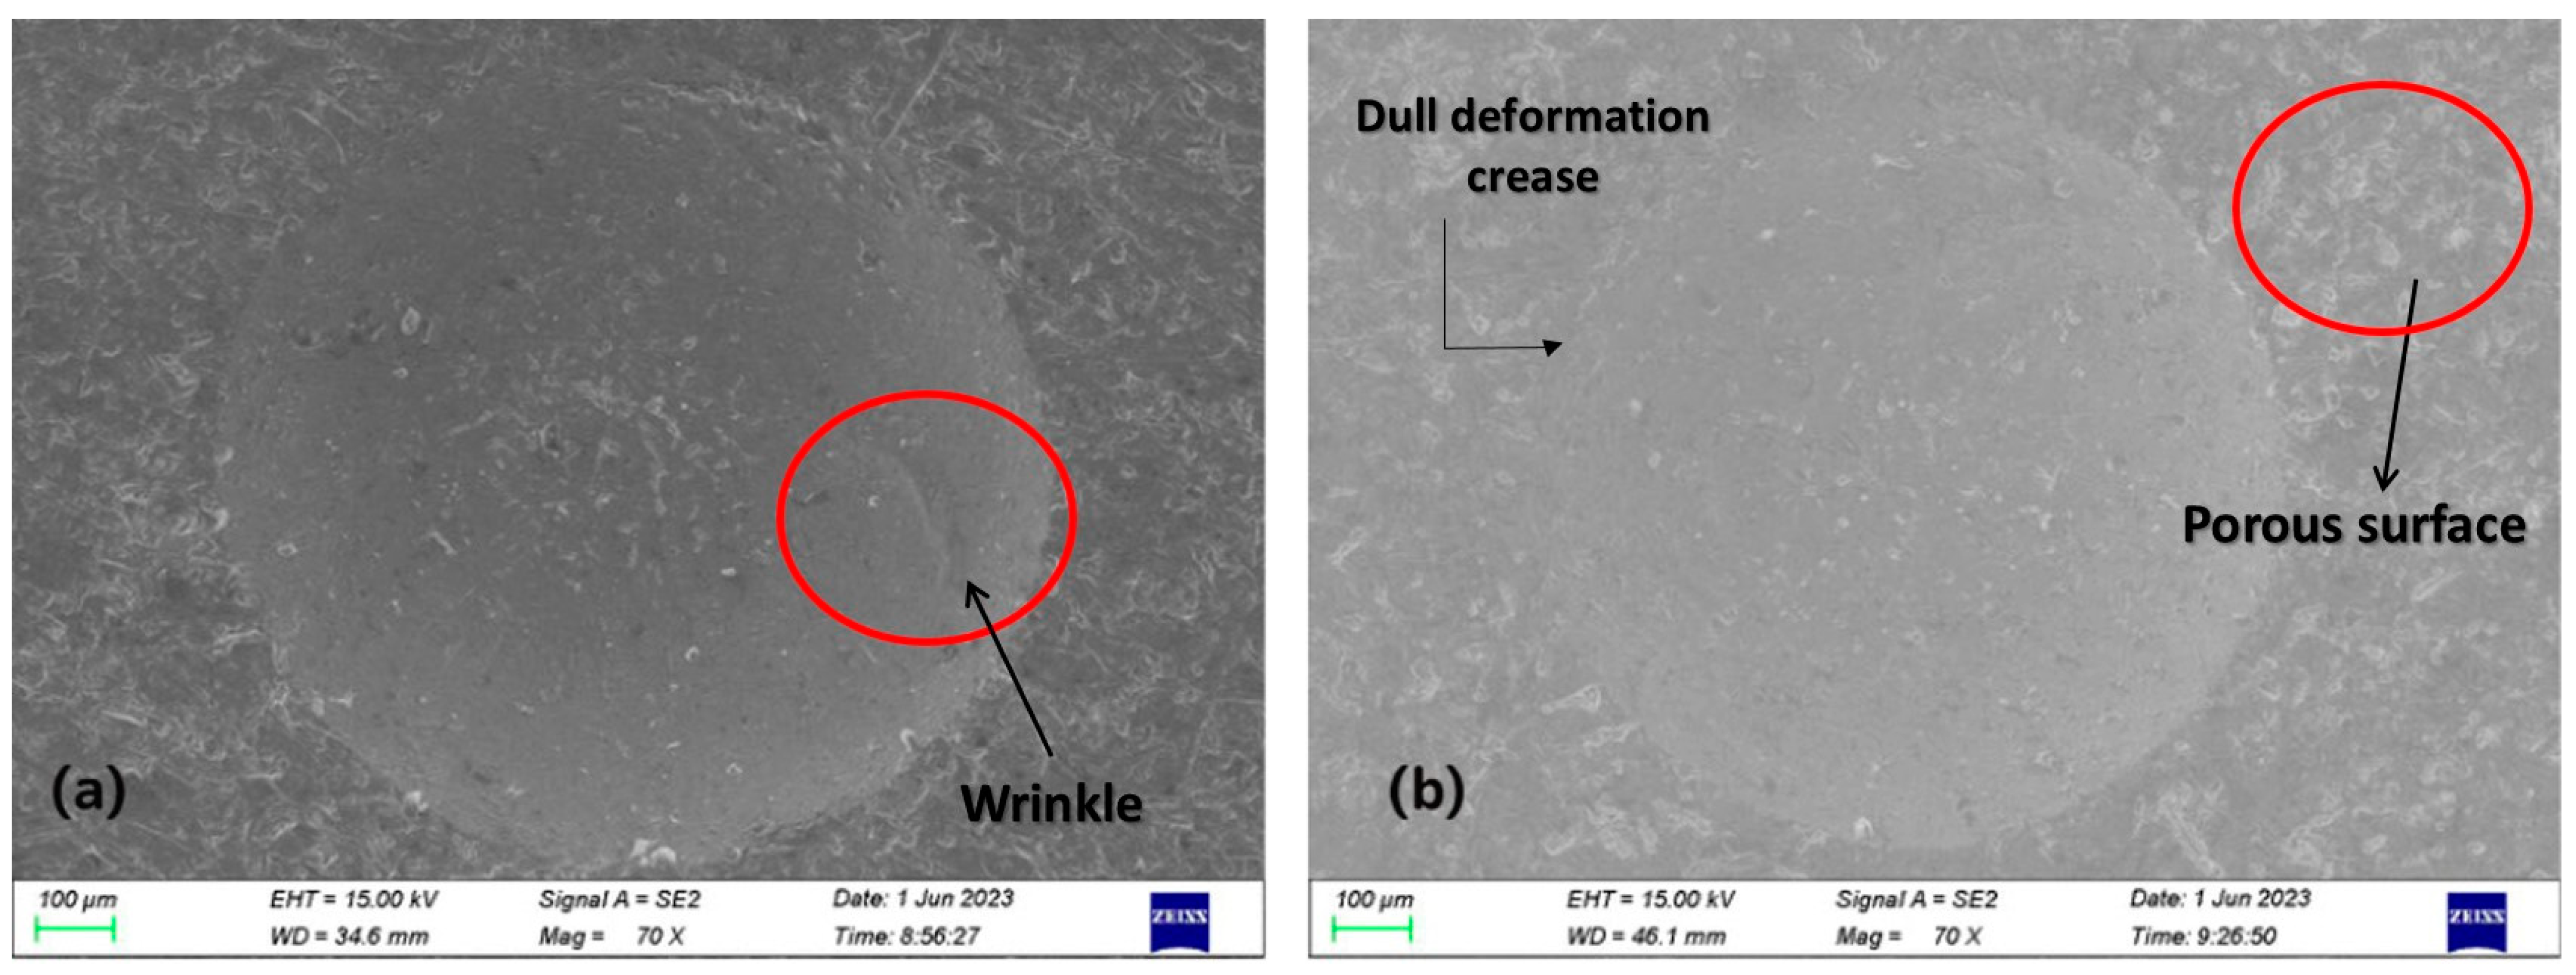
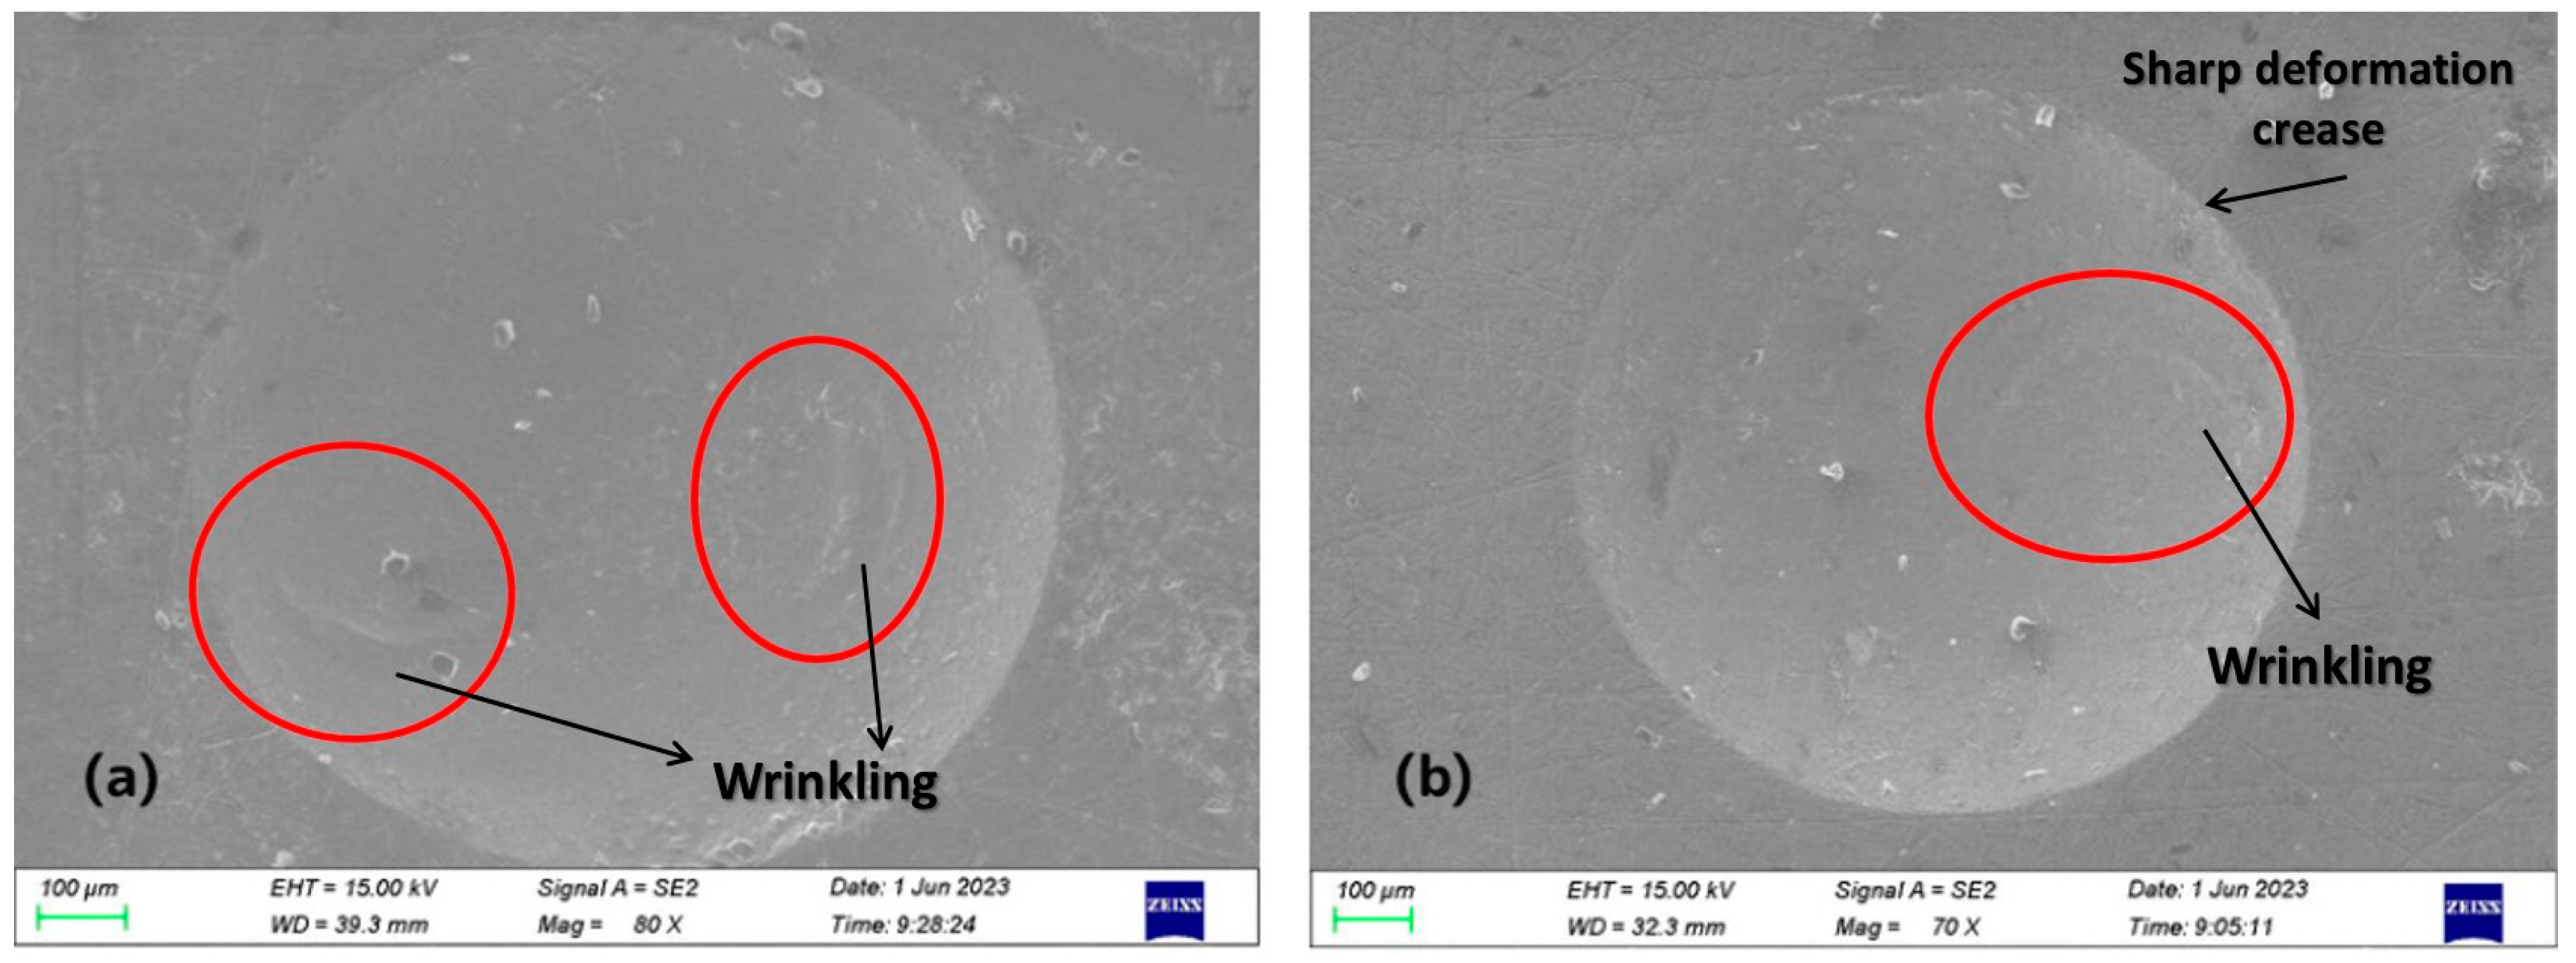
3.2. SEM Analysis of Indentation Images

SEM imaging of the indents was taken to closely examine the indentation on each specimen. Figure 7 shows the SEM images of AA-1 (Figure 7a) and AA-3 (Figure 7b), respectively. The 1.0 mm-thick AA-1 specimen (Figure 7a) has a maximum indentation depth of 0.1888 mm, while the 2.0 mm-thick specimen (Figure 7b) has a maximum indentation depth of 0.1732 mm. As the indentations are spherical, the point of maximum depth is at the center. The edges of the indent were found to be very finely defined in all the SEM images. The diameter of indentation on the 2.0 mm-thick specimen is smaller than the 1.0 mm-thick specimen of the same post-treatment. Both the surfaces of the indent display a similar pattern of ‘wrinkles’ at the center bottom of the images.
Figure 8 shows the SEM images of ST-1 (Figure 8a) and ST-3 (Figure 8b). The 1.0 mm-thick ST specimen (Figure 8a) has a maximum indentation depth of 0.2204 mm, which is not only the highest in the ST series but also the deepest indentation among all the other post-treatment specimens as well. The 2.0 mm-thick ST specimen (Figure 8b) has a maximum indentation depth of 0.1645 mm. Unlike the AA specimens, the ‘wrinkles’ on the surface of the indents are not as pronounced in the ST specimens. The higher depth of the ST specimens when compared to the AB and AA specimens, as well as more surface smoothness, is observed due to the increased ductility of the ST process.
In Figure 9, with the SEM images of AB-1 (Figure 9a) and AB-3 (Figure 9b), a similar wrinkled pattern is also observed. AB-1 has an indentation depth of 0.1846 mm, while AB-3 has an indentation depth of 0.1608 mm. The AB specimens also have the highest resistance to the indentation process as this series of as-built specimens have comparatively the lowest indentation depths. This directly indicates that both of the post-treatments increase the ductility and malleability of the alloy specimens, regardless of their thicknesses. It is also important to note that the AB specimens have a much smoother surface under the SEM as compared to the post-treated ones. It is visible that the ST and AA produce crater surfaces, which can be speculated to be persistent with microstructural changes during the solution treatment process, possibly a visual confirmation of grain growth.
Upon careful SEM examination of the indentation sites across the various heat-treated specimens, namely the ST, AA, and AB specimens, an intriguing deformation phenomenon becomes evident. Distinctive radial “wrinkles” are observed, with the curve of these wrinkles facing away from the center of the spherical indents. This radial orientation of wrinkles is seemingly present across all heat-treated conditions. However, these wrinkles are notably more pronounced on the AA and AB specimens, much less visible on the ST specimens. This commonality in the deformation behavior among different heat treatments signifies the robustness of this phenomenon and its likely connection to the underlying microstructure of the AlSi10Mg alloy. Interestingly, the edges of the indentations on all specimens, irrespective of heat treatment, exhibit a clear definition of a distinct plastic deformation zone surrounding the indentation. This contrasts with the more porous and irregular surface regions located outside the indentation site. Notably, the indentation process acts to smoothen the surface porosity, thus enhancing the overall surface integrity, a behavior consistently observed across different heat treatment conditions. The ‘patchwork’ style surface porosity is more apparent with the ST and AA specimens, indicating not only grain growth during the solution phase but also highlighting the mitigation of porosity within the indentation itself, suggesting that the material’s microstructure plays a significant role in accommodating the localized stress induced by the indenter [36]. The radius of the indent for the specimens AA-1, AA-3, ST-1, ST-3, AB-1, and AB-3, were taken from the results obtained in SEM images from Figure 7 to Figure 9. These results are shown in Table 3, as the measurements from the SEM imaging were more precise, while the remaining dimensions of specimens were captured from the stereo microscope.
Furthermore, a consistent decrease in indentation depths depth with increasing specimen thickness is observed for all three different types of specimens. This pattern is in line with the mechanical behavior predictions for thin materials, where reduction in geometry by smaller thickness makes the material more susceptible to deformation as stresses are increased. The formation of radial “wrinkles” and this thickness-dependent behavior creates an intriguing interplay between specimen geometry and localized deformation response. The presence of these features across various heat treatments underscores their significance in understanding the intricate interaction between processing, microstructure, and mechanical response.

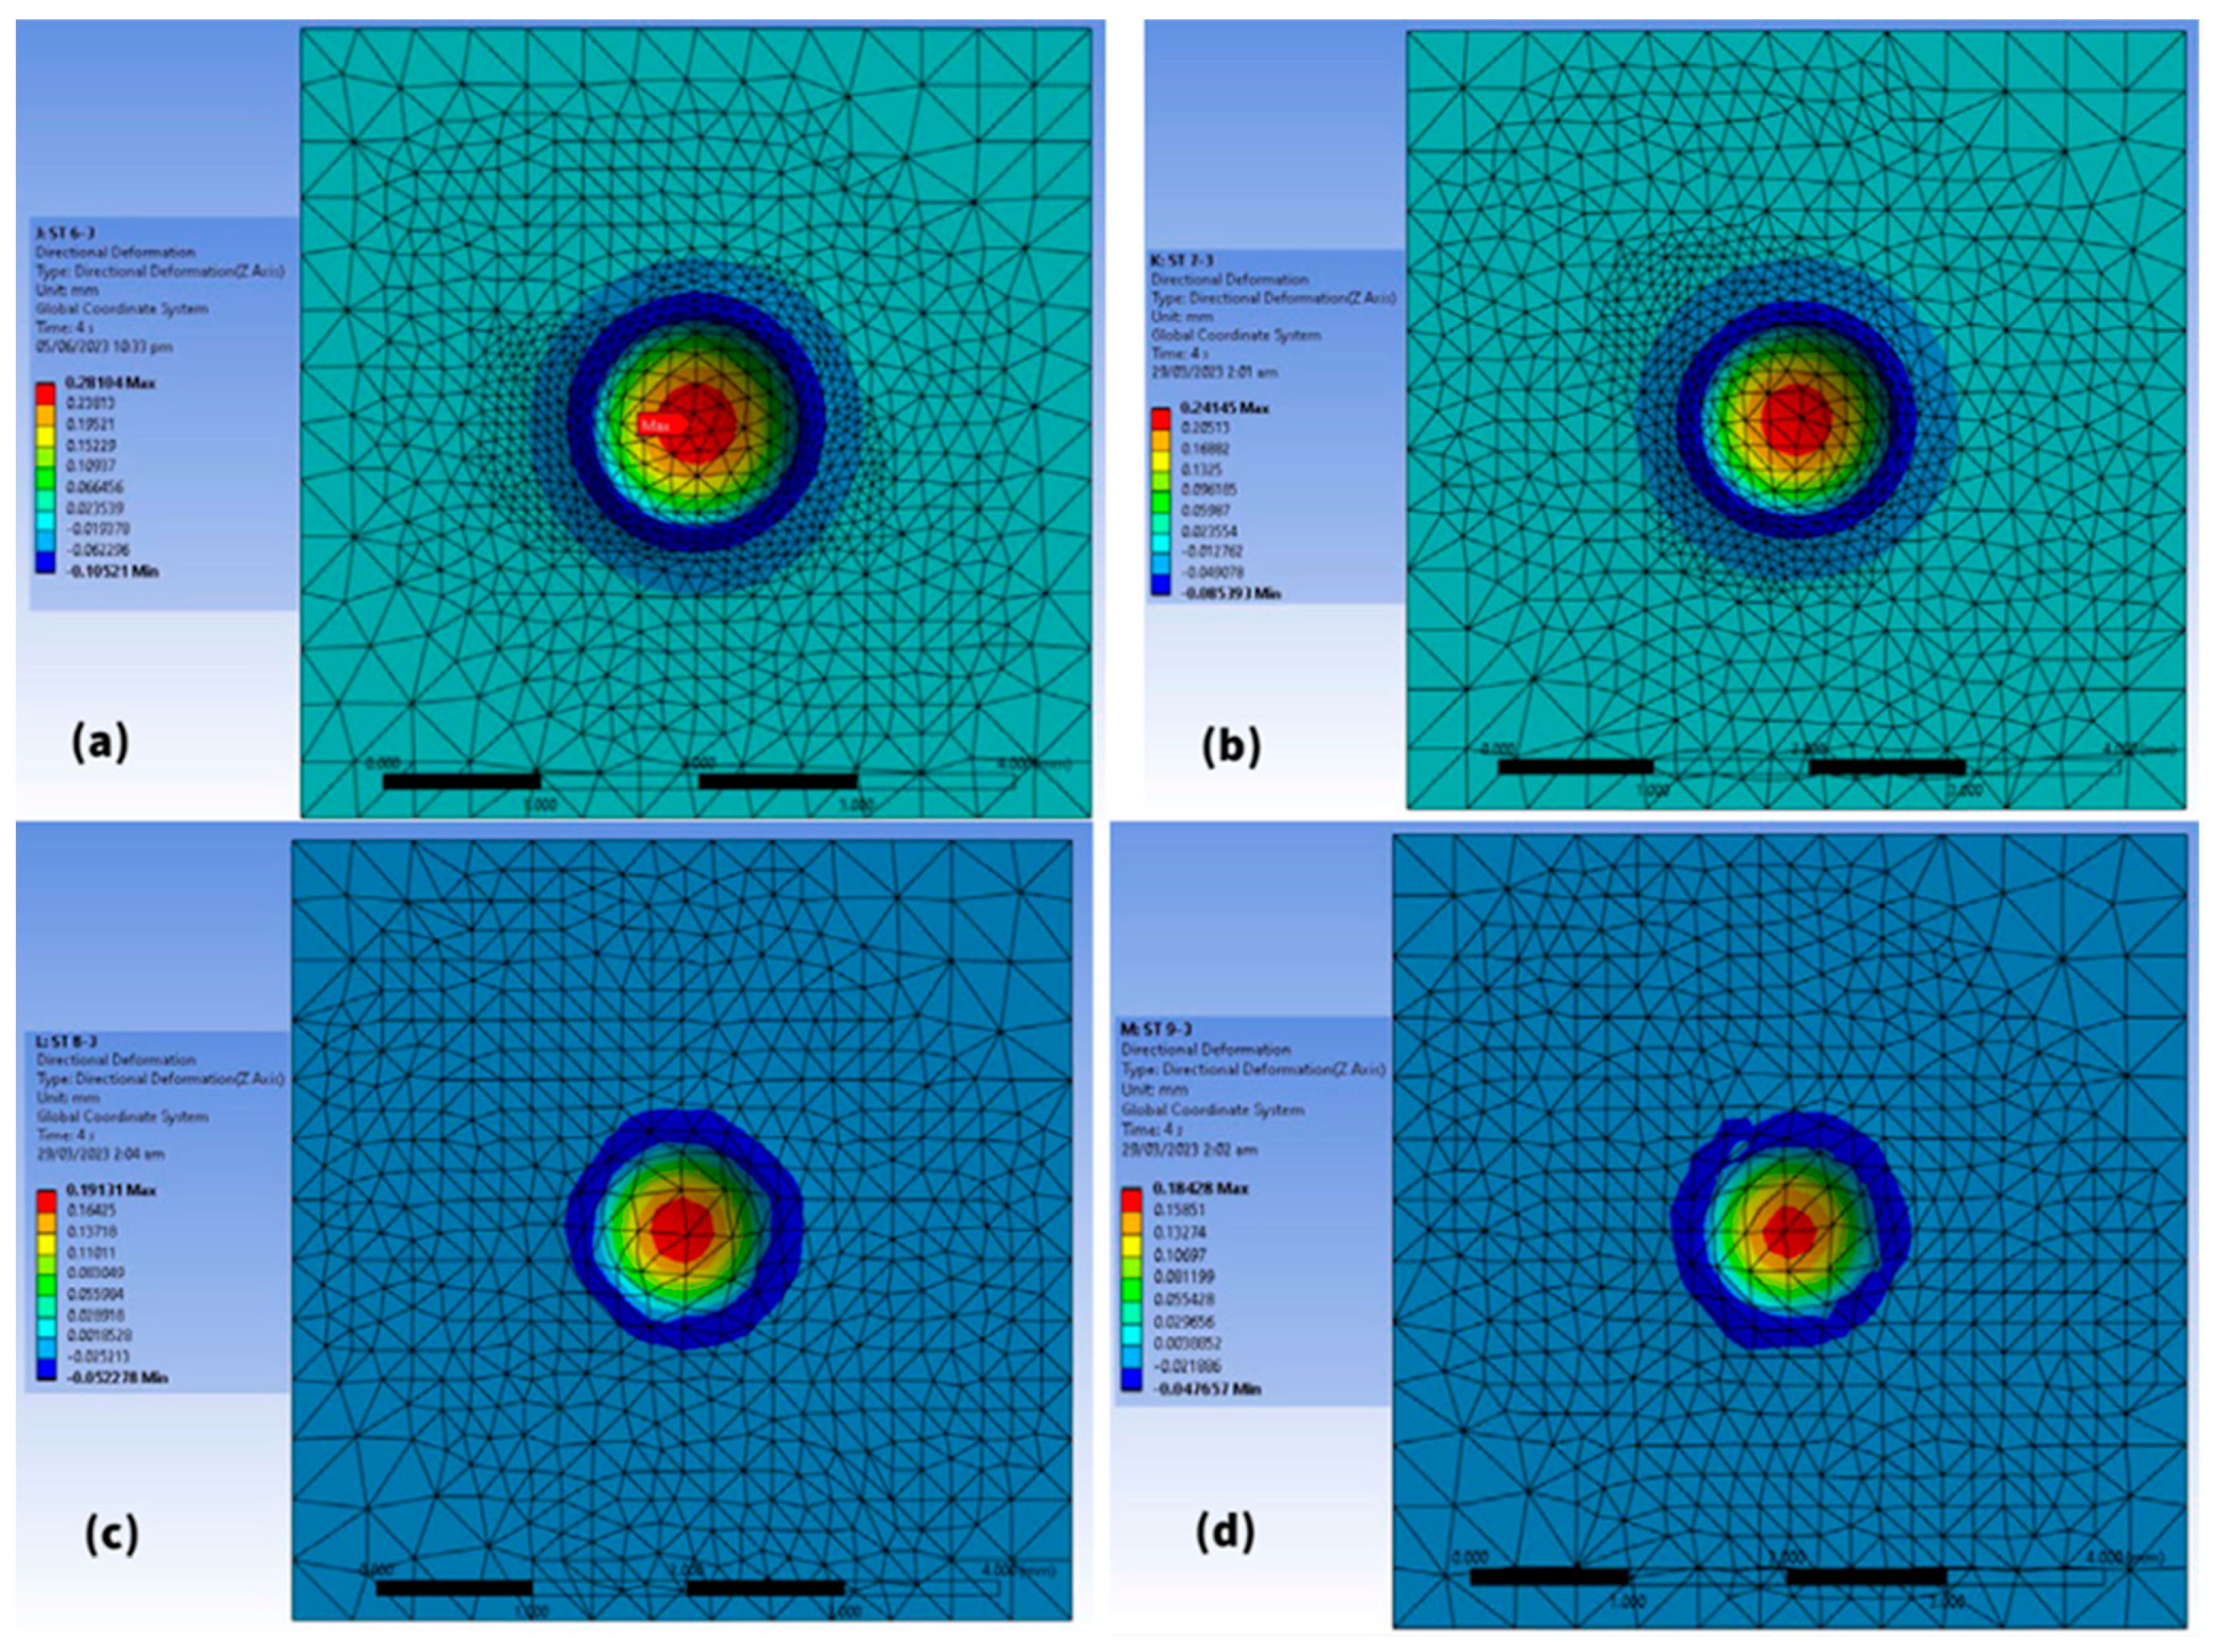
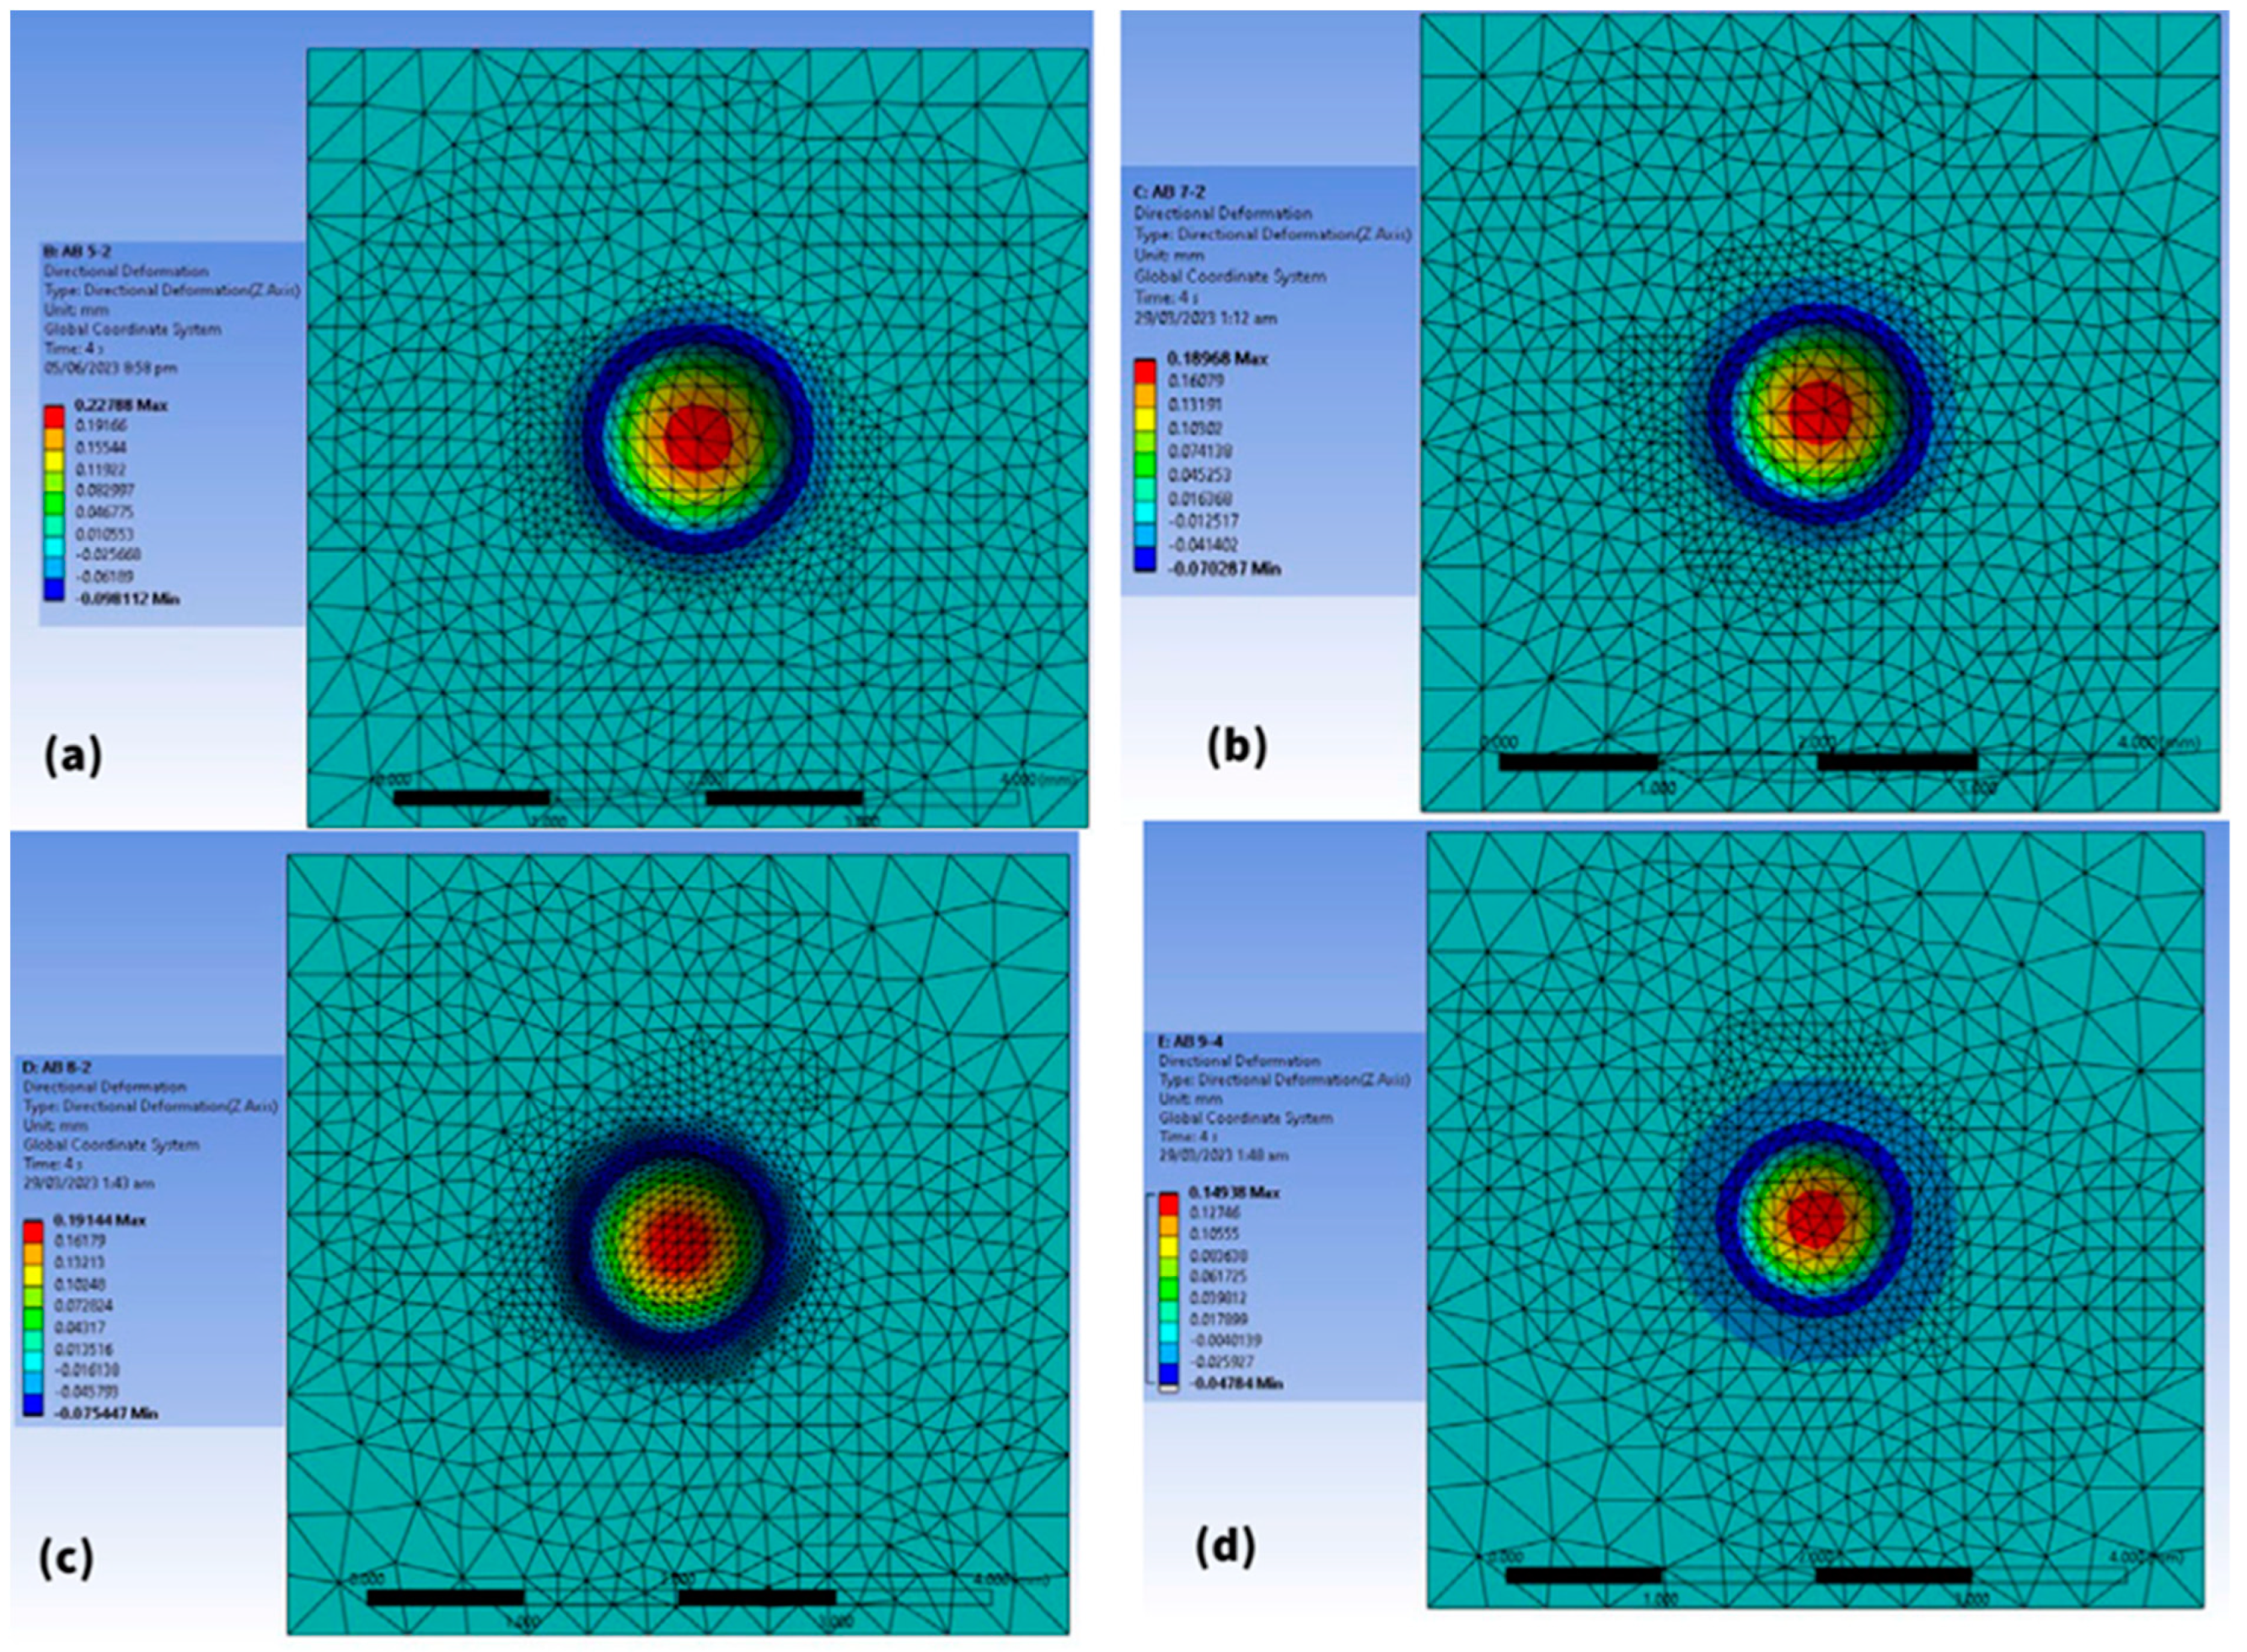
3.3. FEA Simulation Results

The solver was set to give several results from the simulation, but to gauge exactly the depth of indentation; the key result field was the directional deformation in the Z-direction [37,38]. This is the axis where the indenter was perpendicular to the work piece and applying standardized loading. Several simulations were run for each specimen, with different post-treatments and thicknesses. The convergence function was used to achieve mesh-independent results in all simulations, where the final maximum result of z-axis deformation deviated less than 10% with changes to the mesh. The z-axis is viewed normally in the figures, where a positive z-axis deformation is the maximum displacement into the surface of the specimens. The following figures in this section show the results as viewed normally in the z-axis direction showing the depth and the wireframe of the meshing in contours defined by the legend in each figure.
Figure 10a–d shows the simulation results for AA-1, AA-2, AA-3, and AA-4, respectively. The result shown is after the application of the convergence function, which was set to deviate no more than 10% after automatic mesh refinement between each solution iteration. With a total of three iterations and 4.9% change from initial results, AA-1 gives a maximum indentation depth of 0.1753 mm, shown in colored contours. AA-2 shows a maximum indentation depth of 0.1794 mm after three iterations and less than a 1.0% change from the previous mesh refinement result. AA-3 shows a maximum indentation depth of 0.1773 mm after three iterations and a 4.4% change in the results after further mesh refinement. After four iterations and a change of 4.3% from the previous result, AA-4 had a maximum indentation depth of 0.1664 mm. All the results show that the APDL solver increased the mesh refinement by increasing the elements and nodes around the indentation, where a larger density of nodes and element edges can be seen. This is also consistent with all the other eight simulations as well.
Figure 11a–d shows the simulation results for ST-1, ST-2, ST-3, and ST-4, respectively. After three iterations and a 6.4% change from the last result, ST-1 calculated a maximum indentation depth of 0.2810 mm. ST-2 has a maximum indentation depth of 0.2415 mm after three iterations and less than 1.0% difference from the previous iteration. ST-3 shows a maximum indentation depth of 0.1913 mm after two iterations and a 2.1% change in results and ST-4 calculated a maximum indentation depth of 0.1843 mm after two iterations and a 7.8% change in results. Where the automatic mesh refinement is similar to the AA simulations for ST-1 and ST-2, ST-3 and ST-4 show a more consistent mesh size and node density on the majority of the surface of the specimen.
Figure 12a–d shows the simulation results for AB-1, AB-2, AB-3, and AB-4. AB-1 calculated a maximum indentation depth of 0.2279 mm after three iterations and less than 1.0% change from the previous result after further mesh refinement. AB-2 shows a maximum indentation depth of 0.1897 mm after three iterations with a deviation within 1.0% from the previous result. AB-3 has a maximum indentation depth of 0.1914 mm after three iterations with almost no change from the result of the previous iteration. AB-3 also has the densest allocation of nodes and elements at the edges on the spherical indent showing a negative z-axis value of deformation as well, an effect that looks like ‘ridging’. AB-4 has a maximum indentation depth of 0.1494 mm after three iterations and a 2.3% change from the result of the previous iteration.
Figure 13, Figure 14 and Figure 15 show a comparative analysis of the indentation depths observed in experimental and simulation results. The artificially aged specimens, as seen in Figure 13, show the biggest difference between the simulated and the experimental results, where the specimen thickness is 1.5 mm. The simulated results show a more consistent trend where increasing thickness results in shallower indentation depth; however, with the experimental results, there is an irregularity with the indentation depth of the 1.5 mm specimen from the experimental result set. That is an 8.7% difference in the series, where the results for the 2.0 mm specimens are the closest with a 2.4% difference.
Figure 14 shows the trend for ST specimens, where for 1.0 mm, 1.5 mm, and 2.0 mm, the gradual decrease in indentation depth with an increase in specimen thickness is consistent for both the simulated and the experimental results. However, with the results for the 2.5 mm specimen, the indentation depth increased more than the previous thinner specimen to 0.1846 mm from 0.1798 mm, showing an irregularity in the trend. This 2.5 mm indentation is also the closest in simulation to the experimental results with a difference of just 2.5%, while the experimental and simulation results of the 1.0 mm specimen have a difference of 24.2%, which is the highest in the series and the entire dataset.
For the AB specimens shown in Figure 15, the experimental results show the most consistent trend as compared to both the post-heat treatment series. The simulated results follow a mixed trend based on the plastic properties, with the biggest difference being 21.0% for the 1.0 mm specimen, and the smallest difference being 3.5% for the 2.5 mm specimen.
Table 4 lists all the indentation depths from the experiments against the indentation depths obtained from the experimentation and FEA simulations. The AA series simulation results showed a very consistent trend with the experimental results. The AA simulation results are the closest out of all three specimen types to the experimentation indentation depths, with AA-3 having the nearest accurate depth with a difference of 2.4% from the experimental value, and AA-2 showing the least accurate depth with a difference of 8.7% from the experimental value. The average accuracy for the AA series simulation with the hardness test results was 95.4%.
The simulation results for the ST specimens series showed a consistent trend when compared to the experimental results. As the indentation depth tends to decrease with increasing specimen thickness, as was observed by the rest of the indentation tests, ST-4 instead had an increased indentation depth of 0.1798 mm when compared to ST-3 of 0.1645 mm. For the simulated indentation in ST specimens, the trend remains coherent between subsequent specimens thicknesses, as the indentation depth for ST-4 is less than for ST-3. However, in terms of accuracy, the simulation results for the smaller thicknesses deviate the most from the experimental values, with ST-1 having the highest difference of 24.2% from the experimental value, which is the highest difference between all simulation results. The most accurate value in the ST series is from the simulation of ST-4 with a difference of just 2.5%. It is noted that for 1.0, 1.5, and 2.0 mm thicknesses in the ST series, the difference between experimental values is 24.2%, 20.7%, and 15.1%. The average accuracy for the simulation of the ST series with the hardness indentation tests was calculated to be 84.4%. The differences can be attributed to localized porosity at the site of indentation in the hardness tests due to lower relative density, and the more pronounced ductility that results from solution heat treatment.
Simulation results for AB specimens show a more peculiar trend that is at odds with the one observed with the simulation for ST specimens. The indentation depth increases from 0.1897 mm at AB-2 to 0.1914 mm at AB-3, which is against the general trend observed in the experiments for the same series. Meanwhile, the trend has remained consistent with the experimental results. The deviation from the trend in AB-3 could be due to several factors that affect the simulation results, such as the plastic deformation model taken from the stress–strain values of specimens of the same thickness and post-treatment, and more importantly the variation in relative density across the different specimen thicknesses. The study shows that the 2.0 mm specimens (AB-3) have a much lower relative density than the 2.5 mm specimen (AB-4), and hence contain more localized porosity at the time of the tensile tests, resulting in more pronounced plastic deformation. AB-1 has the highest difference of 21.0% between the experiment results, and AB-4 has the lowest difference of 3.5% between the experiment results. It is consistently observed with all the simulations that the thickest specimens have had the lowest difference between experimental and simulation values, which is 4.2% for AA-4, 2.5% for ST-4, and 3.5% for AB-4. The average accuracy for the AB simulation was calculated to be 88.5% from the experimental results.

3.4. Comparison of Specimen’s Thickness, FEA Simulation, and Heat Treatment with Experimental Observations

The comparative analysis between the specimen’s thickness, heat treatment, experimental, and simulation results provides invaluable insight into the accuracy of capturing the indentation behavior of AA, ST, and AB AlSi10Mg specimens.

3.4.1. Effect of Specimen Thickness and Experimental Observations

It is widely observed through all three conditions including the heat-treatment sets that the indentation depths have shown a general decrease with increasing specimen thickness. While hardness tests are conducted to determine the physical properties of the material, this difference in hardness shows that indentation tests are also subject to the geometric properties of the test specimen itself, at least with thin specimens. This effect also translates into tensile testing, as the stress–strain graph results were used to create the material model on the FEA software package and the simulations produced similar trends with different thicknesses. Particularly noteworthy were observations from SEM images, which depicted distinct radial “wrinkles” near the center of indents, with their prominence more on the ST specimens.

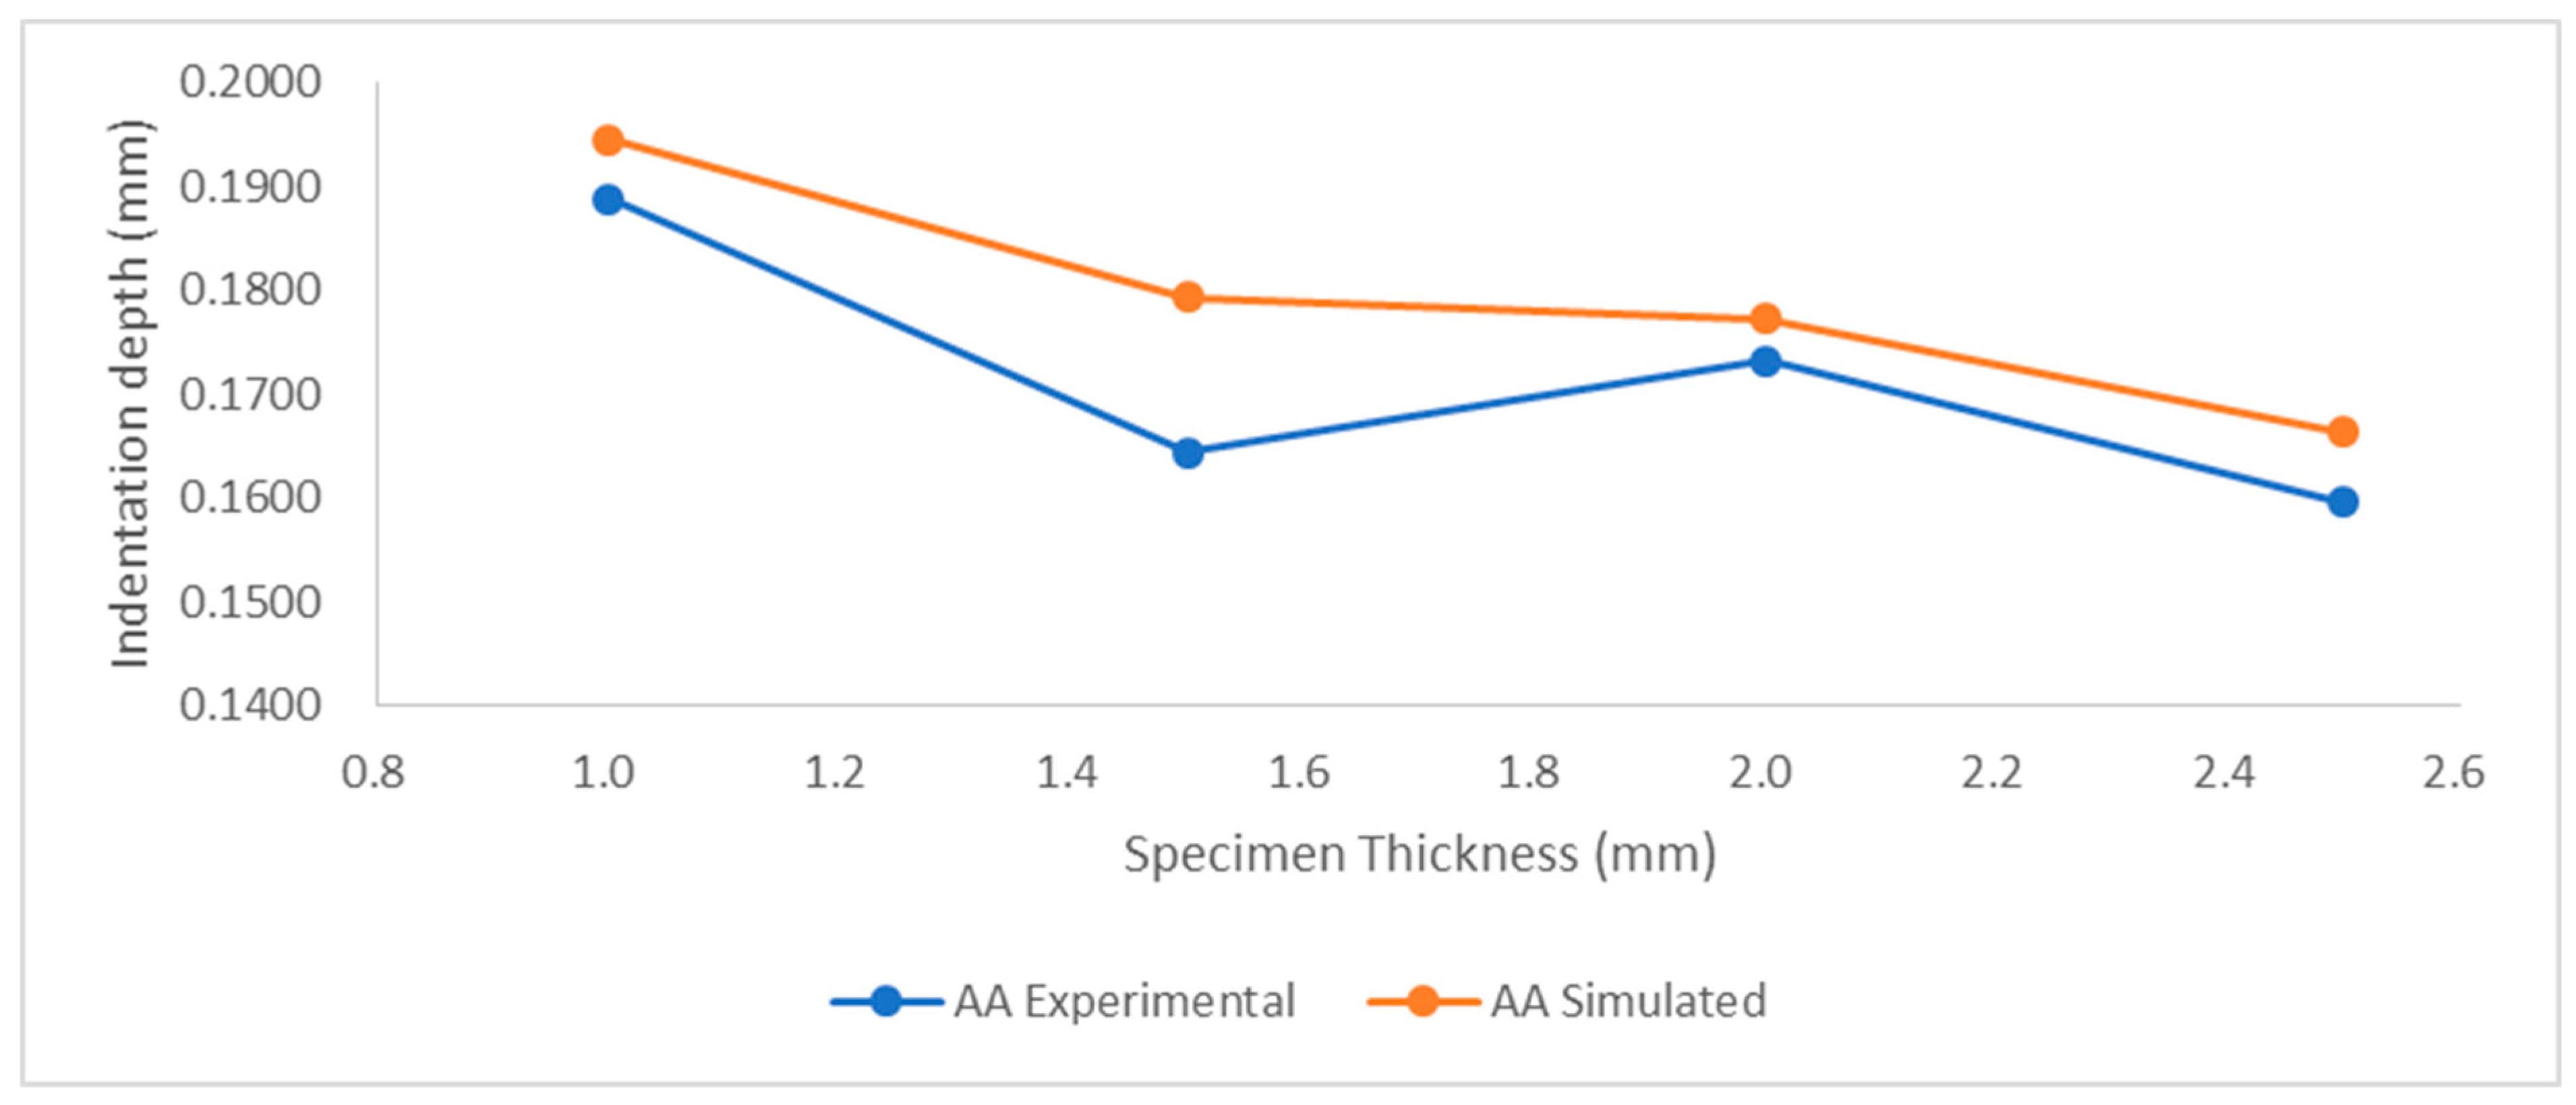
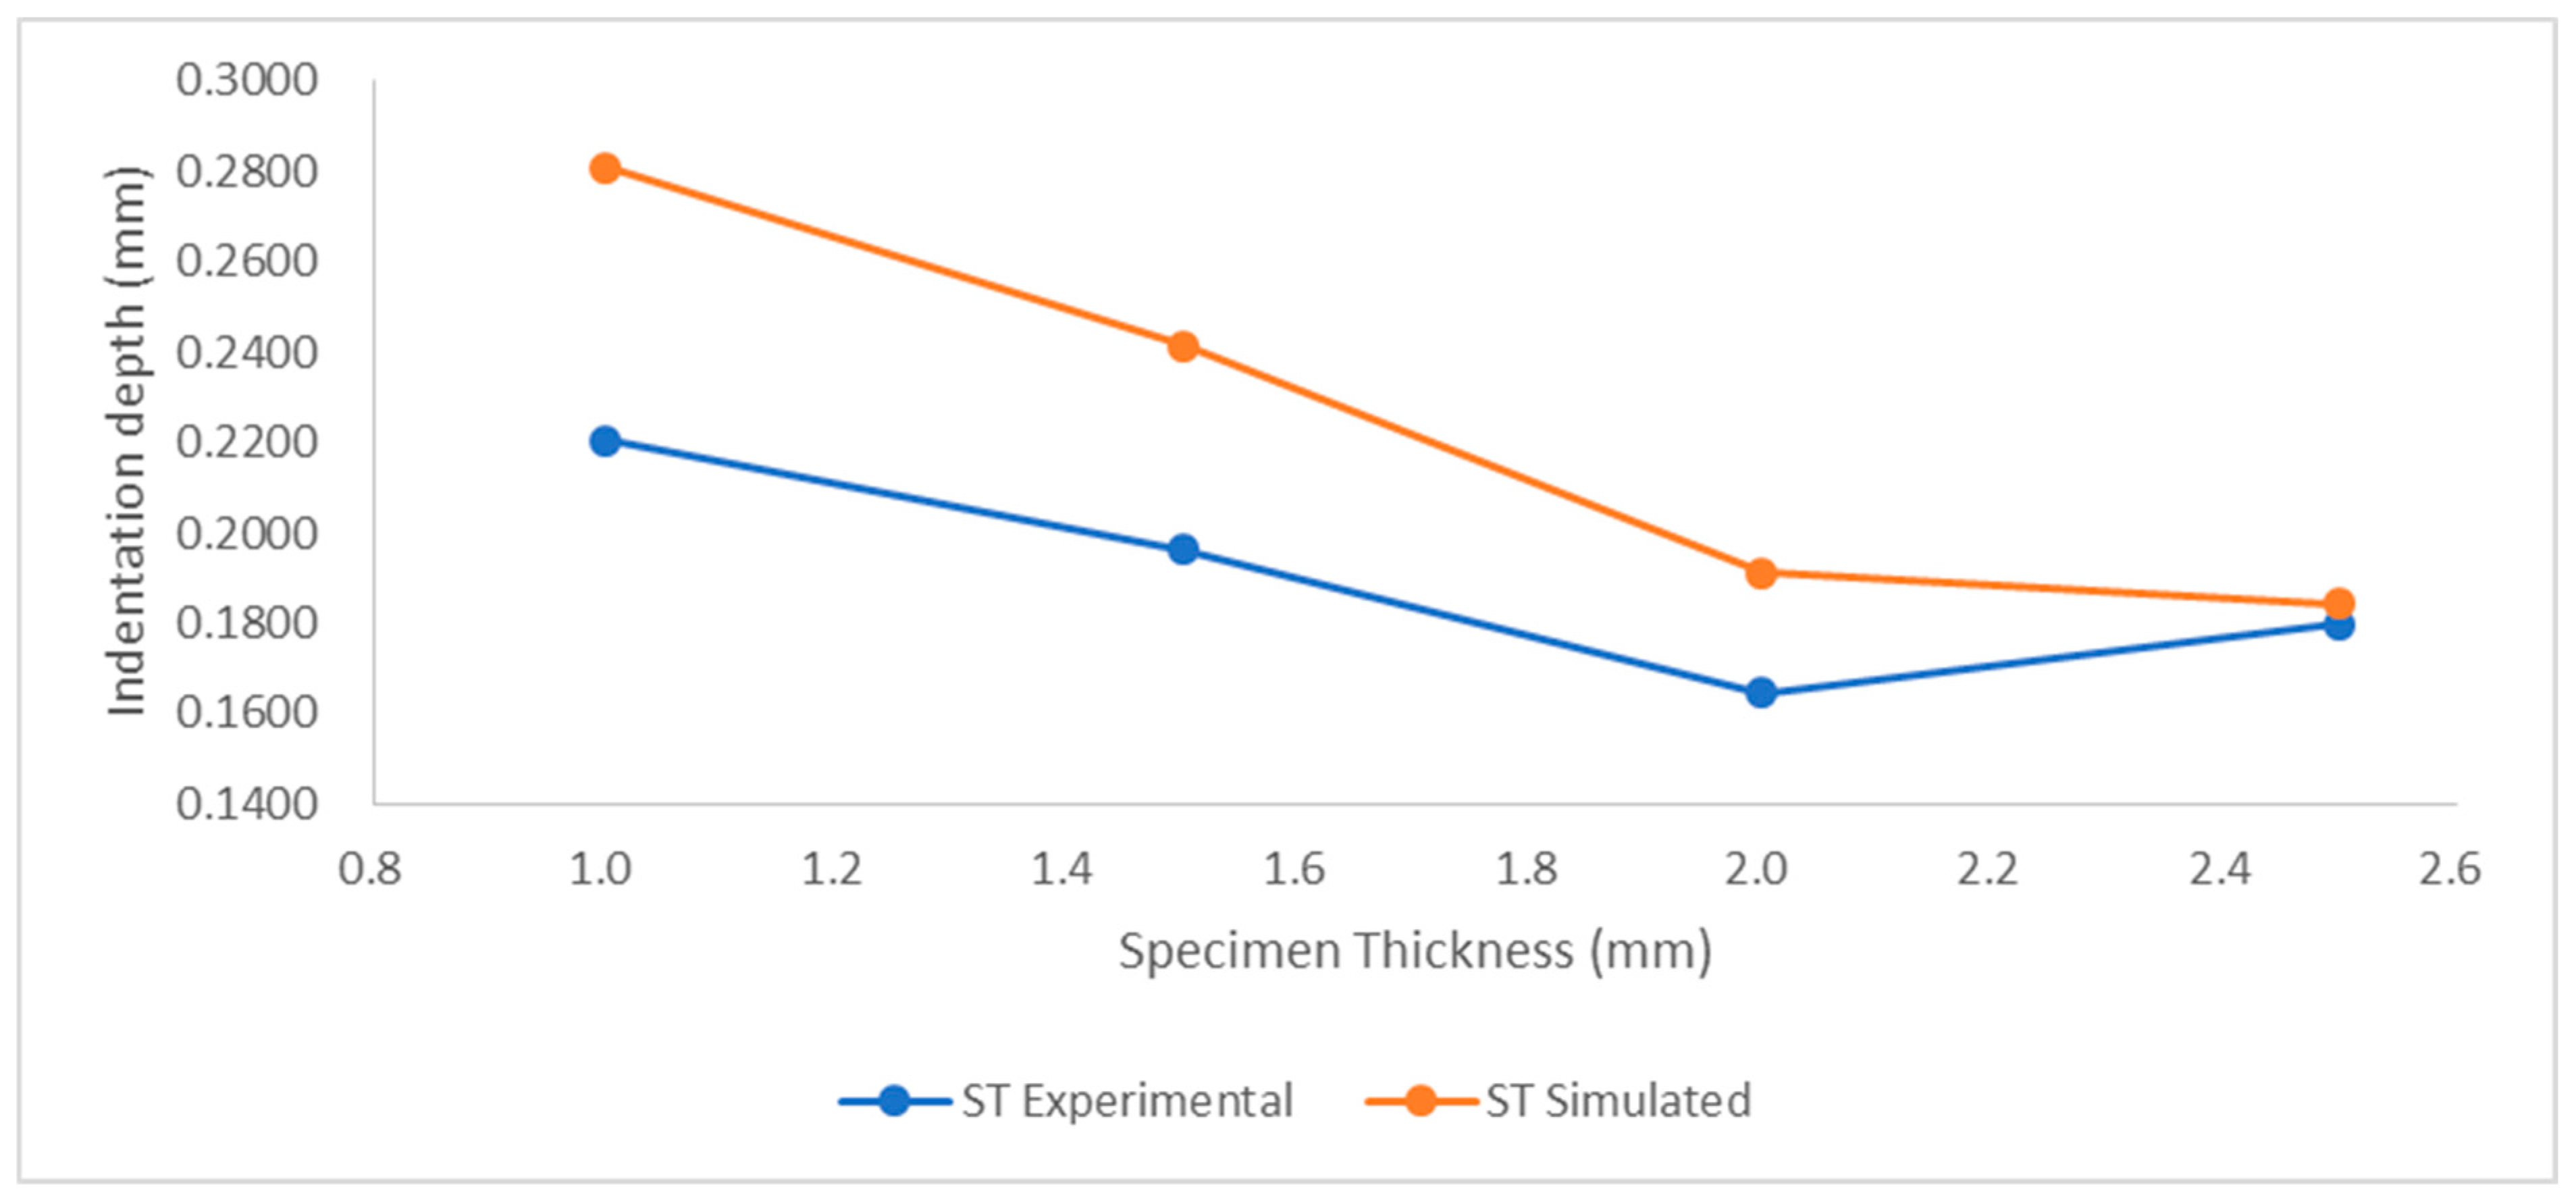
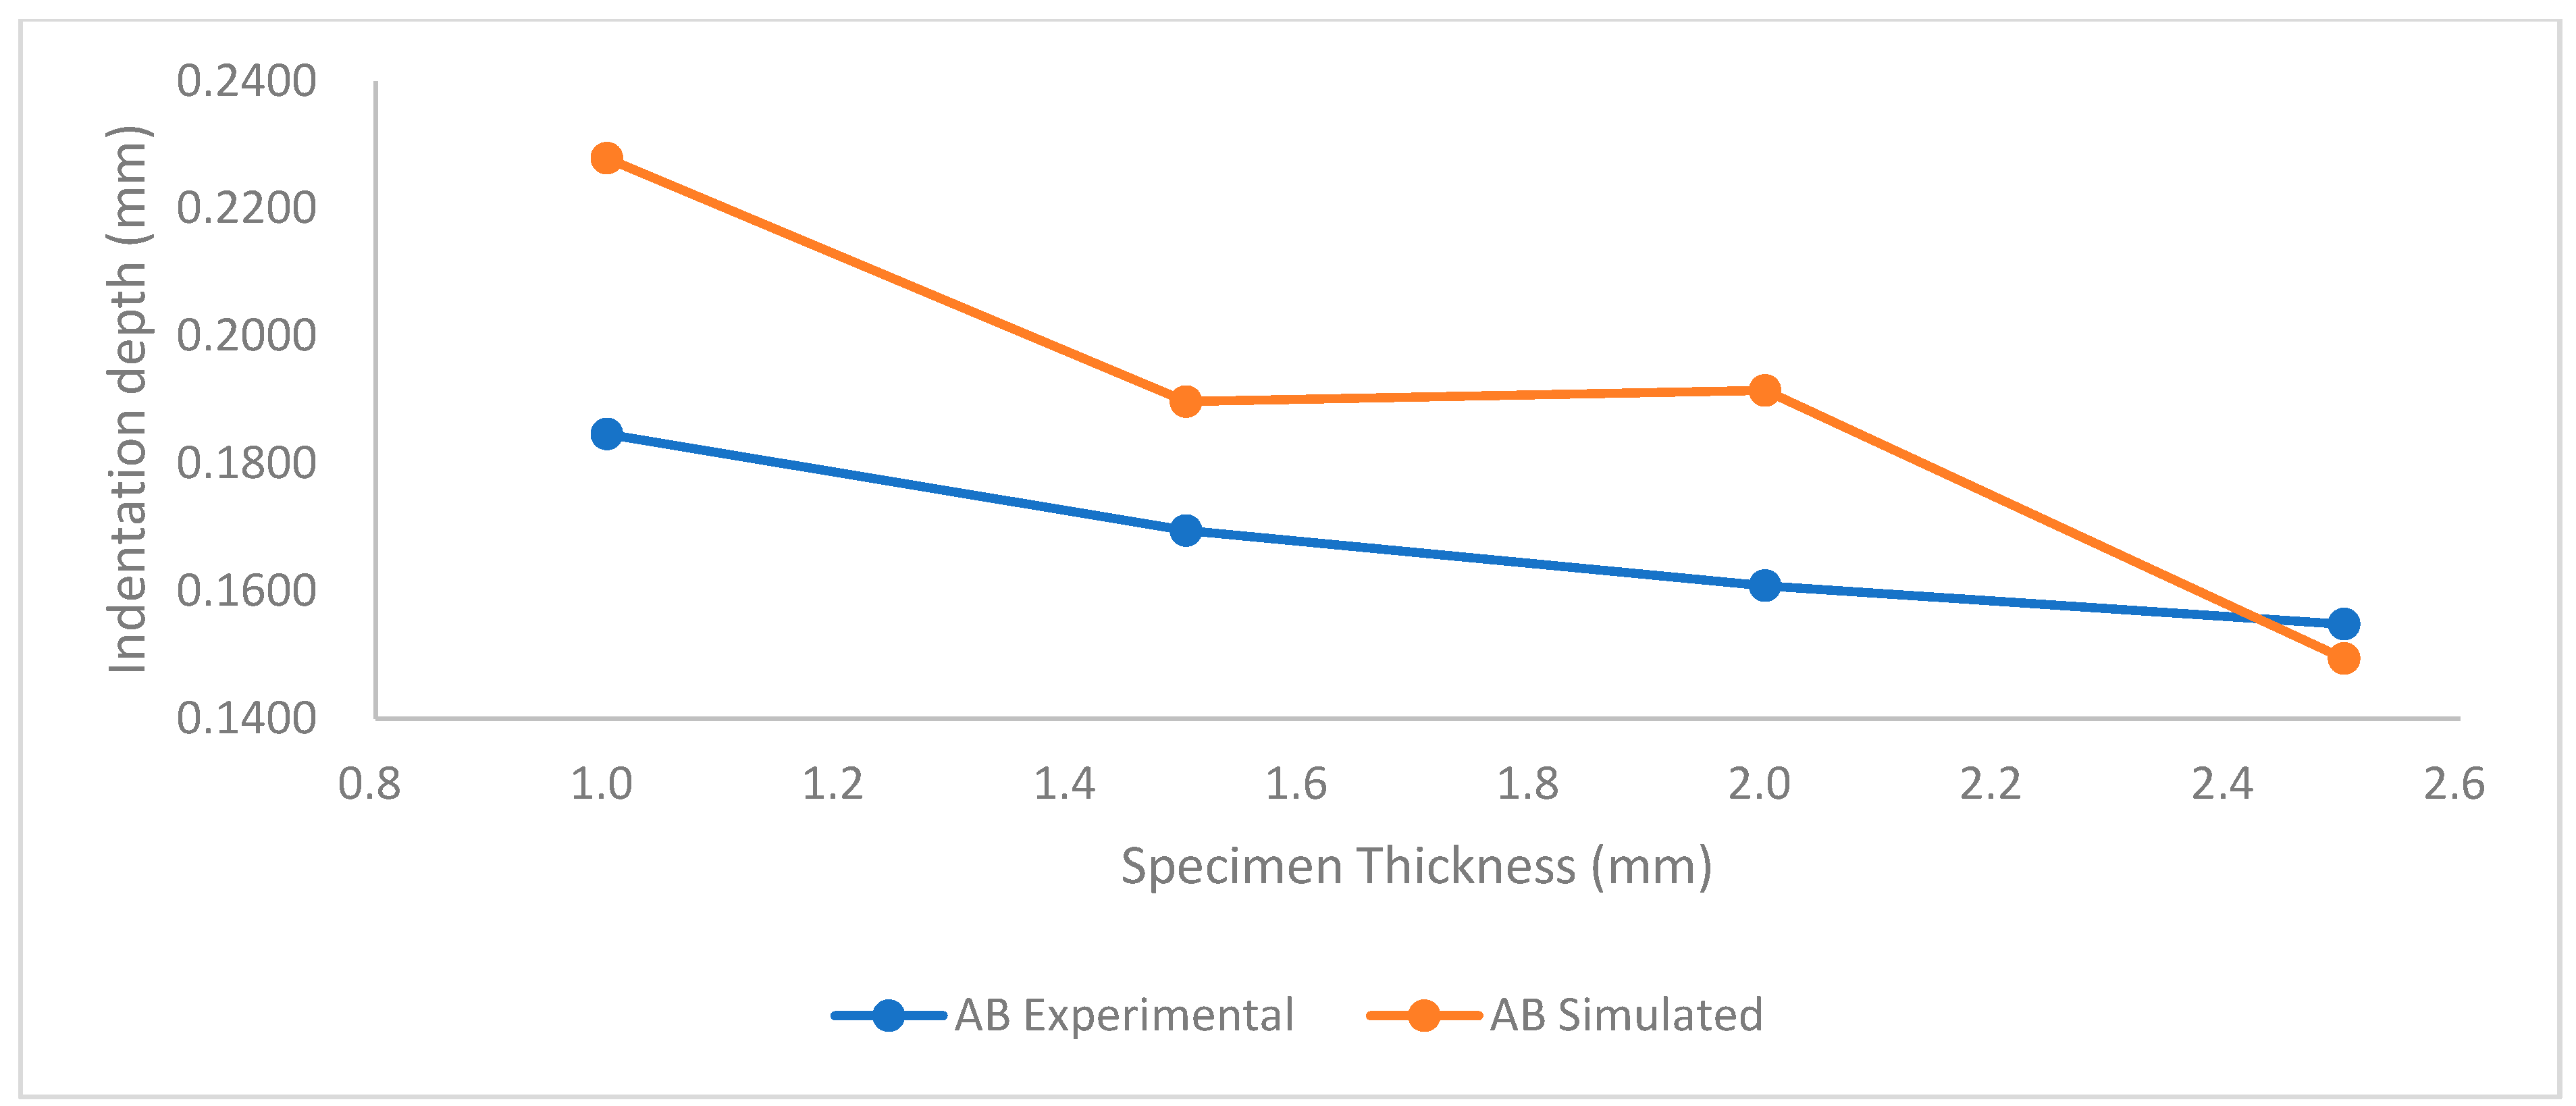
3.4.2. Simulation Results and Consolidation with Experimental Results

FEA simulations were employed to model the indentation behavior. The simulations generally mirrored the experimental trend, showcasing increased indentation depth with decreasing specimen thickness. However, some disparities were noted, especially in ST specimens, where the highest irregularity was observed in the 1.0 mm thickness. These discrepancies highlight the challenges in fully capturing the complexity of material behavior, necessitating a more refined simulation approach. For AA specimens, the simulation captured the trend, but irregularities were evident, particularly in the 1.5 mm thickness. In ST specimens, despite overall alignment, deviations were observed in the 2.5 mm thickness. The AB specimens exhibited more consistent trends in experiments than in simulations, suggesting the need for further calibration to accurately replicate material behavior. Overall, the simulations for AA specimens were within 95.43% of the experimental results, the simulations for ST specimens were within 84.39% of the experimental results, and the simulations for AB specimens were within 88.47% of the experimental results.

3.4.3. Effect of Different Heat Treatments

The examination of different heat treatments showcased distinct responses. The AA specimens exhibited consistent trends in both experiments and simulations, emphasizing the influence of heat treatment on material properties. The ST specimens demonstrated a generally predictable trend, though irregularities in the 2.5 mm thickness hinted at the nuanced effects of heat treatment. The AB specimens displayed more consistent behavior experimentally, suggesting the importance of accounting for initial material conditions in simulations. The SEM images showed distinct porous and ‘patchwork’ style surfaces of the heat-treated specimens, indicating that grain size and behavior greatly impacted the indentation behavior and not just surface quality. This contrasts with the SEM imaging of the AB specimens which showed a smoother surface.
This study significantly advances the understanding of the indentation behavior of AlSi10Mg alloys under various heat treatments and thickness conditions. The disparities between experimental and simulation results underscore the need for ongoing refinement in simulation methodologies, considering the intricate interplay between material properties and process conditions. The observed microstructural features, such as “wrinkles,” open avenues for further research into the microscale deformation mechanisms. In conclusion, this research contributes to the broader knowledge of AlSi10Mg alloys, offering valuable insights for industries relying on additive manufacturing processes. The combined experimental and numerical approach presented here provides a robust foundation for continued exploration and optimization in the realm of advanced materials and manufacturing processes.

4. Conclusions

This study aimed to comprehensively investigate the indentation behavior of AlSi10Mg specimens produced through SLM and subjected to different heat treatments as well as with different specimen thicknesses. The methodology of this study included experimental assessments, FEA simulations, and a detailed quantitative analysis between the two. This also factored in two different heat treatments, ST and AA, with a third set for AB specimens, and studying the variance in indentation behavior across different thicknesses. In conclusion, this study found that
[1].
The specimens in the AB conditions showed the highest Rockwell hardness value of 75.50 HRFW with the smallest average indentation depth of 0.1547 mm at 2.5 mm specimen thickness with an overall consistent trend. The AA specimens clustered around similar Rockwell hardness values with the smallest indent at 2.5 mm and the largest indent on 1.0 mm-thick specimens, while the ST specimens showed slightly inconsistent trends in hardness values that are due to the increased ductility, and depicted the lowest indentation depth in a 2.0 mm- instead of a 2.5 mm-thick specimen.
[2].
For the available four specimen thicknesses, hardness values for the AB, ST, and AA post-treatment of SLM AlSi10Mg varied—generally, increasing hardness was observed for increasing thickness. Vice versa, the indentation depths showed a general decrease with increasing specimen thickness, resulting in higher Rockwell hardness value trends.
[3].
The declination in the indentation depths could be caused by an improvement in the porosity behavior against the increase in the wall thickness of SLM printing and heat-treatment execution. The occurrence of micro and macro porosity in the AB, ST, and AA conditions indicated a reduction from 1.5 mm to 2.5 mm-thick specimens. In addition, the SEM images revealed the formation of wrinkled patterns more prominently on the indentation surfaces of AA and AB specimens.
[4].
The FEA simulation revealed the nearest accurate depth of indentation with a difference of 2.4% at 2.0 mm for AA, 2.5% at 2.5 mm for ST, and 3.5% for 2.5 mm-thick specimens for the AB condition. It is observed that the simulations for the thickest specimen showed the lowest difference in comparison to experimental values.
[5].
Simulation using FEA was found to be generally reliable based on the initial material data provided to the material library. Non-linear material behavior data are crucial to achieving more accurate simulation results, where AA specimens showed a highest accuracy of 95.43% with experimental results.

Author Contributions

Conceptualization, A.S.K., M.M. and M.A.; methodology, A.S.K., M.M., M.A. and N.A.; validation, A.S.K., M.M. and M.A.; writing—original draft preparation, A.S.K., M.M., M.A., R.K. and M.S.; writing—review and editing, A.S.K., M.M., M.A., N.A., A.K.S., M.S., J.Y. and J.D.; visualization, A.S.K., M.M. and M.A.; supervision, M.M. and M.A. All authors have read and agreed to the published version of the manuscript.

Funding

The work was supported and funded by the Deanship of Scientific Research at Imam Mohammad Ibn Saud Islamic University (IMSIU) (grant number IMSIU-RG23104).

Data Availability Statement

The original contributions presented in this study are included in this article.

Acknowledgments

Authors are thankful to the support and funding provided by the deanship of scientific research at Imam Mohammad Ibn Saud Islamic University (IMSIU).

Conflicts of Interest

The authors declare no conflict of interest.

References

  1. Nys, N.; König, M.; Neugebauer, P.; Jones, M.J.; Gruber-Woelfler, H. Additive Manufacturing as a Rapid Prototyping and Fabrication Tool for Laboratory Crystallizers—A Proof-of-Concept Study. Org. Process. Res. Dev. 2023, 27, 1455–1462. [Google Scholar] [CrossRef]
  2. Soundararajan, B.; Sofia, D.; Barletta, D.; Poletto, M. Review on modeling techniques for powder bed fusion processes based on physical principles. Addit. Manuf. 2021, 47, 102336. [Google Scholar] [CrossRef]
  3. Ahmadi, M.; Tabary, S.B.; Rahmatabadi, D.; Ebrahimi, M.; Abrinia, K.; Hashemi, R. Review of selective laser melting of magnesium alloys: Advantages, microstructure and mechanical characterizations, defects, challenges, and applications. J. Mater. Res. Technol. 2022, 19, 1537–1562. [Google Scholar] [CrossRef]
  4. Yap, C.Y.; Chua, C.K.; Dong, Z.L.; Liu, Z.H.; Zhang, D.Q.; Loh, L.E.; Sing, S.L. Review of selective laser melting: Materials and applications. Appl. Phys. Rev. 2015, 2, 041101. [Google Scholar] [CrossRef]
  5. Gokuldoss, P.K.; Kolla, S.; Eckert, J. Additive Manufacturing Processes: Selective Laser Melting, Electron Beam Melting and Binder Jetting—Selection Guidelines. Materials 2017, 10, 672. [Google Scholar] [CrossRef] [PubMed]
  6. Trevisan, F.; Calignano, F.; Lorusso, M.; Pakkanen, J.; Aversa, A.; Ambrosio, E.P.; Lombardi, M.; Fino, P.; Manfredi, D. On the Selective Laser Melting (SLM) of the AlSi10Mg Alloy: Process, Microstructure, and Mechanical Properties. Materials 2017, 10, 76. [Google Scholar] [CrossRef] [PubMed]
  7. Prashanth, K.G.; Scudino, S.; Eckert, J. Defining the tensile properties of Al-12Si parts produced by selective laser melting. Acta Mater. 2017, 126, 25–35. [Google Scholar] [CrossRef]
  8. Muthuswamy, P. Influence of powder characteristics on properties of parts manufactured by metal additive manufacturing. Lasers Manuf. Mater. Process. 2022, 9, 312–337. [Google Scholar] [CrossRef]
  9. Amir, B.; Samuha, S.; Sadot, O. Influence of Selective Laser Melting Machine Source on the Dynamic Properties of AlSi10Mg Alloy. Materials 2019, 12, 1143. [Google Scholar] [CrossRef]
  10. Romano, S.; Abel, A.; Gumpinger, J.; Brandão, A.; Beretta, S. Quality control of AlSi10Mg produced by SLM: Metallography versus CT scans for critical defect size assessment. Addit. Manuf. 2019, 28, 394–405. [Google Scholar] [CrossRef]
  11. Brandl, E.; Heckenberger, U.; Holzinger, V.; Buchbinder, D. Additive manufactured AlSi10Mg samples using Selective Laser Melting (SLM): Microstructure, high cycle fatigue, and fracture behavior. Mater. Des. 2012, 34, 159–169. [Google Scholar] [CrossRef]
  12. Muhammad, M.; Nezhadfar, P.D.; Thompson, S.; Saharan, A.; Phan, N.; Shamsaei, N. A comparative investigation on the micro-structure and mechanical properties of additively manufactured aluminum alloys. Int. J. Fatigue 2021, 146, 106165. [Google Scholar] [CrossRef]
  13. Zhang, Y.; Majeed, A.; Muzamil, M.; Lv, J.; Peng, T.; Patel, V. Investigation for macro mechanical behavior explicitly for thin-walled parts of AlSi10Mg alloy using selective laser melting technique. J. Manuf. Process. 2021, 66, 269–280. [Google Scholar] [CrossRef]
  14. Aboulkhair, N.T.; Everitt, N.M.; Ashcroft, I.; Tuck, C. Reducing porosity in AlSi10Mg parts processed by selective laser melting. Addit. Manuf. 2014, 1, 77–86. [Google Scholar] [CrossRef]
  15. Majeed, A.; Ahmed, A.; Liu, B.; Ren, S.; Yang, J. Influence of wall thickness on the hardness of AlSi10Mg alloy parts manufactured by selective laser melting. Procedia CIRP 2019, 81, 459–463. [Google Scholar] [CrossRef]
  16. Maleki, E.; Bagherifard, S.; Bandini, M.; Guagliano, M. Surface post-treatments for metal additive manufacturing: Progress, challenges, and opportunities. Addit. Manuf. 2020, 37, 101619. [Google Scholar] [CrossRef]
  17. Ahmad, A.S.; Wu, Y.; Gong, H.; Liu, L. Determination of the effect of cold working compression on residual stress reduction in quenched aluminum alloy 2219 block. SV-JME 2019, 65, 311–318. [Google Scholar] [CrossRef]
  18. Qin, Z.; Li, B.; Zhang, H.; Wilfried, T.Y.A.; Gao, T.; Xue, H. Effects of shot peening with different coverage on surface integrity and fatigue crack growth properties of 7B50-T7751 aluminum alloy. Eng. Fail. Anal. 2022, 133, 106010. [Google Scholar] [CrossRef]
  19. Laleh, M.; Sadeghi, E.; Revilla, R.I.; Chao, Q.; Haghdadi, N.; Hughes, A.E.; Xu, W.; De Graeve, I.; Qian, M.; Gibson, I.; et al. Heat treatment for metal additive manufacturing. Prog. Mater. Sci. 2023, 133, 101051. [Google Scholar] [CrossRef]
  20. Shakil, S.; Hadadzadeh, A.; Amirkhiz, B.S.; Pirgazi, H.; Mohammadi, M.; Haghshenas, M. Additive manufactured versus cast AlSi10Mg alloy: Microstructure and micromechanics. Results Mater. 2021, 10, 100178. [Google Scholar] [CrossRef]
  21. Prashanth, K.G.; Eckert, J. Formation of metastable cellular microstructures in selective laser melted alloys. J. Alloy. Compd. 2017, 707, 27–34. [Google Scholar] [CrossRef]
  22. Maconachie, T.; Leary, M.; Zhang, J.; Medvedev, A.; Sarker, A.; Ruan, D.; Lu, G.; Faruque, O.; Brandt, M. Effect of build orientation on the quasi-static and dynamic response of SLM AlSi10Mg. Mater. Sci. Eng. A 2020, 788, 139445. [Google Scholar] [CrossRef]
  23. Rubben, T.; Revilla, R.I.; De Graeve, I. Influence of heat treatments on the corrosion mechanism of additive manufactured AlSi10Mg. Corros. Sci. 2018, 147, 406–415. [Google Scholar] [CrossRef]
  24. Majeed, A.; Muzamil, M.; Khan, M.A.; Malik, E.H.; Huzaifa, M.; Lv, J.; Dar, N.U. Comprehensive Mechanical Behavior of Thin-Walled Additively-Manufactured Parts of AlSi10Mg by SLM in As-Built, Post-Solution, and Aging Treatment Conditions. JOM 2023, 75, 3067–3082. [Google Scholar] [CrossRef]
  25. Majeed, A.; Muzamil, M.; Lv, J.; Liu, B.; Ahmad, F. Heat treatment influences densification and porosity of AlSi10Mg alloy thin-walled parts manufactured by selective laser melting technique. J. Braz. Soc. Mech. Sci. Eng. 2019, 41, 267. [Google Scholar] [CrossRef]
  26. Majeed, A.; Zhang, Y.; Lv, J.; Peng, T.; Atta, Z.; Ahmed, A. Investigation of T4 and T6 heat treatment influences on relative density and porosity of AlSi10Mg alloy components manufactured by SLM. Comput. Ind. Eng. 2020, 139, 106194. [Google Scholar] [CrossRef]
  27. Majeed, A.; Ahmed, A.; Salam, A.; Sheikh, M.Z. Surface quality improvement by parameters analysis, optimization and heat treatment of AlSi10Mg parts manufactured by SLM additive manufacturing. Int. J. Light. Mater. Manuf. 2019, 2, 288–295. [Google Scholar] [CrossRef]
  28. Chen, H.; Cai, L.; Bao, C. A novel model for determining tensile properties and hardness of steels by spherical indentations. Strain 2020, 56, e12365. [Google Scholar] [CrossRef]
  29. Asiri, S.; Wagih, A.; Eltaher, M. Predictive model for spherical indentation on elastoplastic nanocomposites: Loading and unloading behavior. Ceram. Int. 2018, 45, 3088–3100. [Google Scholar] [CrossRef]
  30. American Society for Testing and Materials. Committee E-28 on Mechanical Testing. Standard Test Methods for Rockwell Hardness of Metallic Materials; ASTM: West Conshohocken, PA, USA, 2022. [Google Scholar]
  31. ASTM. Standard Test Methods for Tension Testing of Metallic Materials. Annual Book of ASTM Standards; ASTM: West Conshohocken, PA, USA, 2001; Volume 9. [Google Scholar]
  32. Akhtar, M.; Samiuddin, M.; Muzamil, M.; Siddiqui, M.A.; Khan, R.; Alsaleh, N.A.; Siddiqui, A.K.; Djuansjah, J.; Majeed, A. Mechanical Behavior of Selective Laser Melting (SLM) Parts with Varying Thicknesses in a Saline Environment under Different Exposure Times. Materials 2024, 17, 1959. [Google Scholar] [CrossRef]
  33. Wang, L.; Sun, J.; Yu, X.; Shi, Y.; Zhu, X.; Cheng, L.; Liang, H.; Yan, B.; Guo, L. Enhancement in mechanical properties of selectively laser-melted AlSi10Mg aluminum alloys by T6-like heat treatment. Mater. Sci. Eng. A 2018, 734, 299–310. [Google Scholar] [CrossRef]
  34. Majeed, A.; Zhang, Y.F.; Lv, J.X.; Peng, T.; Waqar, S.; Atta, Z. Study the effect of heat treatment on the relative density of SLM built parts of alsi10 mg alloy. In Proceedings of the 48th International Conference on Computers and Industrial Engineering, CIE 2018, Auckland, New Zealand, 2–5 December 2018. [Google Scholar]
  35. Strauß, L.; Lübbecke, S.; Löwisch, G. Optimizing the Solution Annealing of Additively Manufactured AlSi10Mg. HTM J. Heat Treat. Mater. 2023, 78, 300–316. [Google Scholar] [CrossRef]
  36. Li, Y.T.; Jiang, X.; Wang, X.T.; Leng, Y.X. Integration of hardness and toughness in (CuNiTiNbCr) Nx high entropy films through nitrogen-induced nanocomposite structure. Scr. Mater. 2024, 238, 115763. [Google Scholar] [CrossRef]
  37. Guo, Q.; Hou, H.; Pan, Y.; Pei, X.; Song, Z.; Liaw, P.K.; Zhao, Y. Hardening-softening of Al0.3CoCrFeNi high-entropy alloy under nanoindentation. Mater. Des. 2023, 231, 112050. [Google Scholar] [CrossRef]
  38. Clayton, J.; Lloyd, J.; Casem, D. Simulation and dimensional analysis of instrumented dynamic spherical indentation of ductile metals. Int. J. Mech. Sci. 2023, 251, 108333. [Google Scholar] [CrossRef]
Figure 1. AlSi10Mg specimen schematic used for indentation testing.
Crystals 14 00610 g001
Figure 2. Stereo microscope image of indentation on AA specimens. (a) AA-1, (b) AA-2, (c) AA-3, and (d) AA-4.
Crystals 14 00610 g002
Figure 3. Stereo microscope image of indentation on ST specimens. (a) ST-1, (b) ST-2, (c) ST-3, and (d) ST-4.
Crystals 14 00610 g003
Figure 4. Stereo microscope image of indentation on AB specimens. (a) AB-1, (b) AB-2, (c) AB-3, and (d) AB-4.
Crystals 14 00610 g004
Figure 5. Average Rockwell hardness values for each specimen and different post-treatments.
Crystals 14 00610 g005
Figure 6. Microscopic images of porosities of SLM specimens at two different thicknesses: (a) AA-2 at 1.5 mm; (b) AA-4 at 2.5 mm; (c) ST-2 at 1.5 mm; (d) ST-4 at 2.5 mm; (e) AB-2 at 1.5 mm; (f) AB-4 at 2.5 mm.
Crystals 14 00610 g006
Figure 7. SEM Images of indentation of artificial aged specimens: (a) AA-1 and (b) AA-3.
Crystals 14 00610 g007
Figure 8. SEM Images of indentation of solution treated specimens (a) ST-1, and (b) ST-3.
Crystals 14 00610 g008
Figure 9. SEM Images of indentation of as-built specimens: (a) AB-1, and (b) AB-3.
Crystals 14 00610 g009
Figure 10. Directional deformation in the z-axis for (a) AA-1, (b) AA-2, (c) AA-3, and (d) AA-4.
Crystals 14 00610 g010
Figure 11. Directional deformation in the z-axis for (a) ST-1, (b) ST-2, (c) ST-3, and (d) ST-4.
Crystals 14 00610 g011
Figure 12. Directional deformation in the z-axis for (a) AB-1, (b) AB-2, (c) AB-3, and (d) AB-4.
Crystals 14 00610 g012
Figure 13. Experimental vs. simulated results of artificially aged specimens (AA).
Crystals 14 00610 g013
Figure 14. Experimental vs. simulated results of solution heat-treated specimens (ST).
Crystals 14 00610 g014
Figure 15. Experimental vs. simulated results of as-built specimens (AB) specimens.
Crystals 14 00610 g015
Table 1. Process parameters that were used when the specimens were being made in the SLM machine [13,24].
Laser Power (W)Scan Speed (mm/s)Hatch Space (μm)Layer Thickness (μm)Beam Focus Diameter (µm)Scanning Strategy with Check-Board
32090080308067°
Table 2. The utilized scheme of AlSi10Mg specimens in the AB, AA, and ST conditions of varying thicknesses.
Sr. No.Specimen NumberPost-TreatmentThickness (t) (mm)
1AA-1AA1.0
2AA-2AA1.5
3AA-3AA2.0
4AA-4AA2.5
5ST-1ST1.0
6ST-2ST1.5
7ST-3ST2.0
8ST-4ST2.5
9AB-1AB1.0
10AB-2AB1.5
11AB-3AB2.0
12AB-4AB2.5
Table 3. Rockwell indentation test results and depth of each indentation against the AA, ST, AB conditions on varying thicknesses.
Sr. No.Specimen NumberThickness (mm)Rockwell Hardness (HRFW) 1Rockwell Hardness (HRFW) 2Average Hardness (HRFW)Avg. Radius of Indent (mm)Depth of
Indent (mm)
1AA-11.045.047.046.000.51400.1888
2AA-21.564.064.564.250.48390.1645
3AA-32.058.562.060.250.49500.1732
4AA-42.566.061.563.750.47740.1596
5ST-11.041.038.039.500.54900.2204
6ST-21.560.553.056.750.52260.1962
7ST-32.061.561.561.500.48390.1645
8ST-42.554.055.554.750.50320.1798
9AB-11.045.048.546.750.50900.1846
10AB-21.555.055.055.000.49030.1695
11AB-32.060.062.061.000.47900.1608
12AB-42.575.076.075.500.47100.1547
Table 4. Indentation depths between experimental and simulated results.
Sr. No.Specimen NumberThickness (mm)Depth of Indent Experimental (mm)Depth of Indent ANSYS (mm)
1AA-11.00.18880.1946
2AA-21.50.16450.1794
3AA-32.00.17320.1773
4AA-42.50.15960.1664
5ST-11.00.22040.2810
6ST-21.50.19620.2415
7ST-32.00.16450.1913
8ST-42.50.17980.1843
9AB-11.00.18460.2279
10AB-21.50.16950.1897
11AB-32.00.16080.1914
12AB-42.50.15470.1494
Disclaimer/Publisher’s Note: The statements, opinions and data contained in all publications are solely those of the individual author(s) and contributor(s) and not of MDPI and/or the editor(s). MDPI and/or the editor(s) disclaim responsibility for any injury to people or property resulting from any ideas, methods, instructions or products referred to in the content.

