Article

Structural, Vibrational Spectroscopic and Theoretical (DFT) Studies of 4-Chloro- and 5-Chloro-7-azaindole-3-carbaldehydes

1
Institute of Chemistry, Faculty of Science and Technology, Jan Dlugosz University in Czestochowa, Armii Krajowej 13/15, 42-200 Czestochowa, Poland
2
Faculty of Chemistry, Wroclaw University of Science and Technology, Wybrzeże Wyspiańskiego 27, 50-370 Wroclaw, Poland
*
Author to whom correspondence should be addressed.
Crystals 2024, 14(7), 631; https://doi.org/10.3390/cryst14070631
Submission received: 24 May 2024 / Revised: 3 July 2024 / Accepted: 6 July 2024 / Published: 9 July 2024
(This article belongs to the Section Organic Crystalline Materials)

Abstract

:
Molecular structures of 5-chloro-7-azaindole-3-carbaldehyde (5Cl7AICA) and 4-chloro-7-azaindole-3-carbaldehyde (4Cl7AICA) were investigated using infrared and Raman spectroscopy supported by density functional theory (DFT) calculations. Theoretical studies were carried out with three DFT methods, which include dispersion corrections: B3LYP-D3, PBE0-D3, and ωB97X-D. A single-crystal X-ray diffraction analysis was performed for 5Cl7AICA. The compound crystallizes in the monoclinic system, space group P21/c, with lattice parameters a = 3.82810(12) Å, b = 12.7330(3) Å, c = 15.9167(5) Å, and β = 94.539(3)°, with Z = 4. Within the crystal lattice, 5Cl7AICA molecules form dimers via dual and strong N1–H1⋅⋅⋅N7′ hydrogen bonds, accompanied by other intermolecular interactions. In the DFT calculations, two types of dimers of the investigated molecules were analyzed: dimer 1, which is present in the crystal structure of 5Cl7AICA, and dimer 2 displaying a 180° rotation of the aldehyde group compared to dimer 1. Computational results indicate that dimer 1 is more stable than dimer 2 for 5Cl7AICA, whereas dimer 2 is more stable than dimer 1 for 4Cl7AICA molecules. Furthermore, experimental and theoretical vibrational spectra were examined to elucidate the influence of internal rotation of the aldehyde group on spectroscopic properties.

Graphical Abstract

1. Introduction

7-Azaindole derivatives are versatile compounds with a wide range of biological activity, including antiviral (e.g., anti-HIV-1 and anti-influenza) and antimicrobial properties [1,2,3,4,5]. Known for their ability to interact with kinase hinge regions through hydrogen bonding, these compounds offer promising avenues for anticancer chemotherapy [6,7,8,9]. Additionally, their self-dimerization behavior serves as a model for understanding DNA base pairing mechanisms and mutations [10,11]. Furthermore, derivatives of 7-azaindole hold potential as candidates for blocking the SARS-CoV-2 S1-RBD-hACE2 interaction, offering a prospective strategy against future virus mutations [12]. Beyond their biological significance, 7-azaindole derivatives are employed in various applications, such as contrast agents in imaging [13], biosensors [14], and materials for OLEDs [15]. Overall, their multifaceted properties render them indispensable in both biomedical research and technological advancements.
7-Azaindole-3-carbaldehyde (7AICA) is a well-known precursor for the synthesis of natural products and drugs [16]. We reported earlier a comprehensive study of 7AICA involving single-crystal X-ray analysis, FT-IR and FT-Raman spectroscopy, as well as B3LYP/6–311++G(p,d) calculations [17]. Additionally, complexes of 7AICA with Pd(II), Pt(II), and Cu(II) ions have been synthesized and characterized. These compounds exhibit promising antiproliferative activities against various cancer cell lines, with notable cytotoxicity demonstrated by the trans-[MCl2(7AICA)2] complexes, where M = Pt(II) and Pd(II) [18,19].
In this study, we focus our attention on two chloro-substituted derivatives of 7AICA, 4-chloro-7-azaindole-3-carbaldehyde (4Cl7AICA) and 5-chloro-7-azaindole-3-carbaldehyde (5Cl7AICA). Chlorine, an integral component in various pharmaceuticals, holds particular significance in treatments targeting neurological, oncological, dermatological, genitourinary, and sex hormone-related conditions [20]. We aim to investigate the molecular structures and vibrational spectra of these compounds employing DFT (Density Functional Theory) methods. Furthermore, the single crystal structure of 5Cl7AICA will be determined. The results from these investigations can be used for further studies of metal ion complexes with the chloro-derivatives of 7AICA, which may also show biological activity.

2. Materials and Methods

2.1. Preparation of 5Cl7AICA Crystals

A single crystal of 5Cl7AICA was obtained through a slow evaporation of a methanol solution containing the commercial compound from Sigma-Aldrich, Burlington, MA, USA. The crystals of 5Cl7AICA were colorless. Unfortunately, despite the use of various solvents, our attempts to prepare a single crystal of 4Cl7AICA were unsuccessful.

2.2. X-ray Structure Determination

X-ray diffraction data for a single crystal of 5Cl7AICA were obtained using a four-circle diffractometer equipped with a CCD detector and employing an ω-scan technique (Δω = 1°). The data collection, reduction, and absorption corrections were performed using the CrysAlisPro software package (version 1.171.42.49) [21]. The structure was solved by direct methods using the SHELXS program and refined with the SHELXL-2019/3 program [22,23]. All non-hydrogen atoms were located in a difference Fourier map and treated anisotropically. All hydrogen atoms were also located in a ΔF map, and their coordinates and isotropic displacement parameters were refined freely. Finally, the crystal structure was refined using the NoSpherA2 [24] function in Olex2 [25,26] to achieve improved accuracy, especially in hydrogen atom positions. We used ORCA 5.0 [27] for scattering factors (METHOD: R2SCAN, BASIS SET: def2-TZVP). Crystal structures were visualized using the Ortep-3 and Mercury programs [28,29]. Details of the data collection parameters, crystallographic data, and final agreement parameters of 5Cl7AICA are provided in Table S1 in the Supplementary Material. CCDC 2269265 contains the supplementary crystallographic data.

2.3. Spectroscopic Measurements

Fourier transform mid-infrared (MIR) and far-infrared (FIR) spectra were measured using a Bruker VERTEX 70 V spectrometer (Bruker, Billerica, MA, USA) equipped with a diamond ATR accessory and air-cooled DTGS detector. The instrument was kept under vacuum, and the spectra were recorded at a resolution of 2 cm−1 with co-addition of 64 scans. The ATR spectra were processed using OPUS™ 7.5 software to convert them from reflectance to absorbance.
FT-Raman spectrum (in the range 3500–50 cm−1) was measured on a Bruker MultiRAM spectrometer (Bruker, Billerica, MA, USA) equipped with a liquid-nitrogen cooled germanium detector and a Nd:YAG laser (emitting radiation at a wavelength of 1064 nm). The spectra were recorded at a resolution of 4 cm−1 with co-addition of 256 scans.

2.4. Theoretical Methods

Computations were carried out using the Gaussian 16 program [30]. All calculations were performed at the density functional theory (DFT) level using the following methods with Grimme’s dispersion correction [31]: B3LYP-D3 (B3LYP, the hybrid functional that combines Becke’s three-parameter exchange functional with the Lee–Yang–Parr correlation functional) [32,33,34], PBE0-D3 (PBE0, also known as PBE1PBE, the one-parameter hybrid protocol containing modified PBE exchange and correlation functionals) [35,36,37], and ωB97X-D, a long-range corrected hybrid density functional with dispersion corrections [38]. The 6-31++G(d,p) basis set was employed for all calculations [39,40]. The starting structural parameters for calculations were derived directly from X-ray diffraction (XRD) analysis of 5Cl7AICA.
The harmonic frequencies, infrared intensities, and Raman scattering activities were computed for the optimized structures. The theoretical Raman intensities were calculated using the Chemcraft program [41]. The B3LYP-D3-calculated frequencies were scaled by 0.961 in the range ≥ 2000 cm−1, by 0.979 in the range from 2000 to 1000 cm−1, and left unscaled in the range < 1000 cm−1. The PBE0-D3-calculated frequencies were scaled by 0.951 in the range ≥ 2000 cm−1, by 0.970 in the range from 2000 to 1000 cm−1, and by 0.990 in the range < 1000 cm−1. The ωB97X-D-calculated frequencies were scaled using three scale factors: 0.948 for frequencies ≥ 2000 cm−1, 0.953 for frequencies in the range from 2000 to 1000 cm−1, and 0.970 for frequencies < 1000 cm−1, following the recommendations in Ref. [42]. Additionally, potential energy distributions (PEDs) were determined using the FCART program (version 7.0) [43] to aid in the assignment of the vibrational spectra. Furthermore, the Chemcraft program [41] was employed for the graphical visualization of the normal modes.

3. Results and Discussion

3.1. Crystal Structure of 5Cl7AICA

5Cl7AICA crystallizes in the monoclinic system, space group P21/c, with the dimensions a = 3.82810(12) Å, b = 12.7330(3) Å, c = 15.9167(5) Å, and β = 94.539(3)°, with Z = 4. Other crystallographic details are provided in Table S1 in the Supplementary Material. The atom labelling in the compound’s formula is depicted in Figure 1.
X-ray analysis reveals that the six-membered pyridine and five-membered pyrrole rings forming the skeleton of the 7-azaindole moiety are coplanar. For example, the torsion angle C3–C3A–C7A–N7 measures −179.98(8)°, and the N1–C2–C3–C3A torsion angle approaches zero (0.36(11)°). Moreover, the carbaldehyde group of 5Cl7AICA is nearly coplanar with the five-membered ring, as evidenced by the torsion angles O1–C8–C3–C3A and O1–C8–C3–C2 measuring 0.74(19)° and −179.18(14)°, respectively (Figure 1). Torsional angle Cl1–C5–C6–C3A measuring −179.86(13)° indicates that the chlorine atom lies on the molecular plane of 5Cl7AICA.
Selected bond lengths and bond angles in 5Cl7AICA are provided in Table S2 in the Supplementary Material. The chlorine atom at the fifth position does not significantly affect the bond lengths within the ring, in comparison to unsubstituted 7AICA [17]. The C5-Cl1 bond length, 1.7324(11) Å, in 5Cl7AICA is similar to those observed in other derivatives of 7-azaindole, ranging from 1.7217(17) Å to 1.745(5) Å [44,45,46]. Most bond angles in 5Cl7AICA closely resemble those in 7AICA, differing by less than 1°. Only two bond angles, C3A–C4–C5 and C4–C5–C6, exhibit slightly larger values in 5Cl7AICA compared to 7AICA [17], likely due to the presence of the chlorine atom at the fifth position.
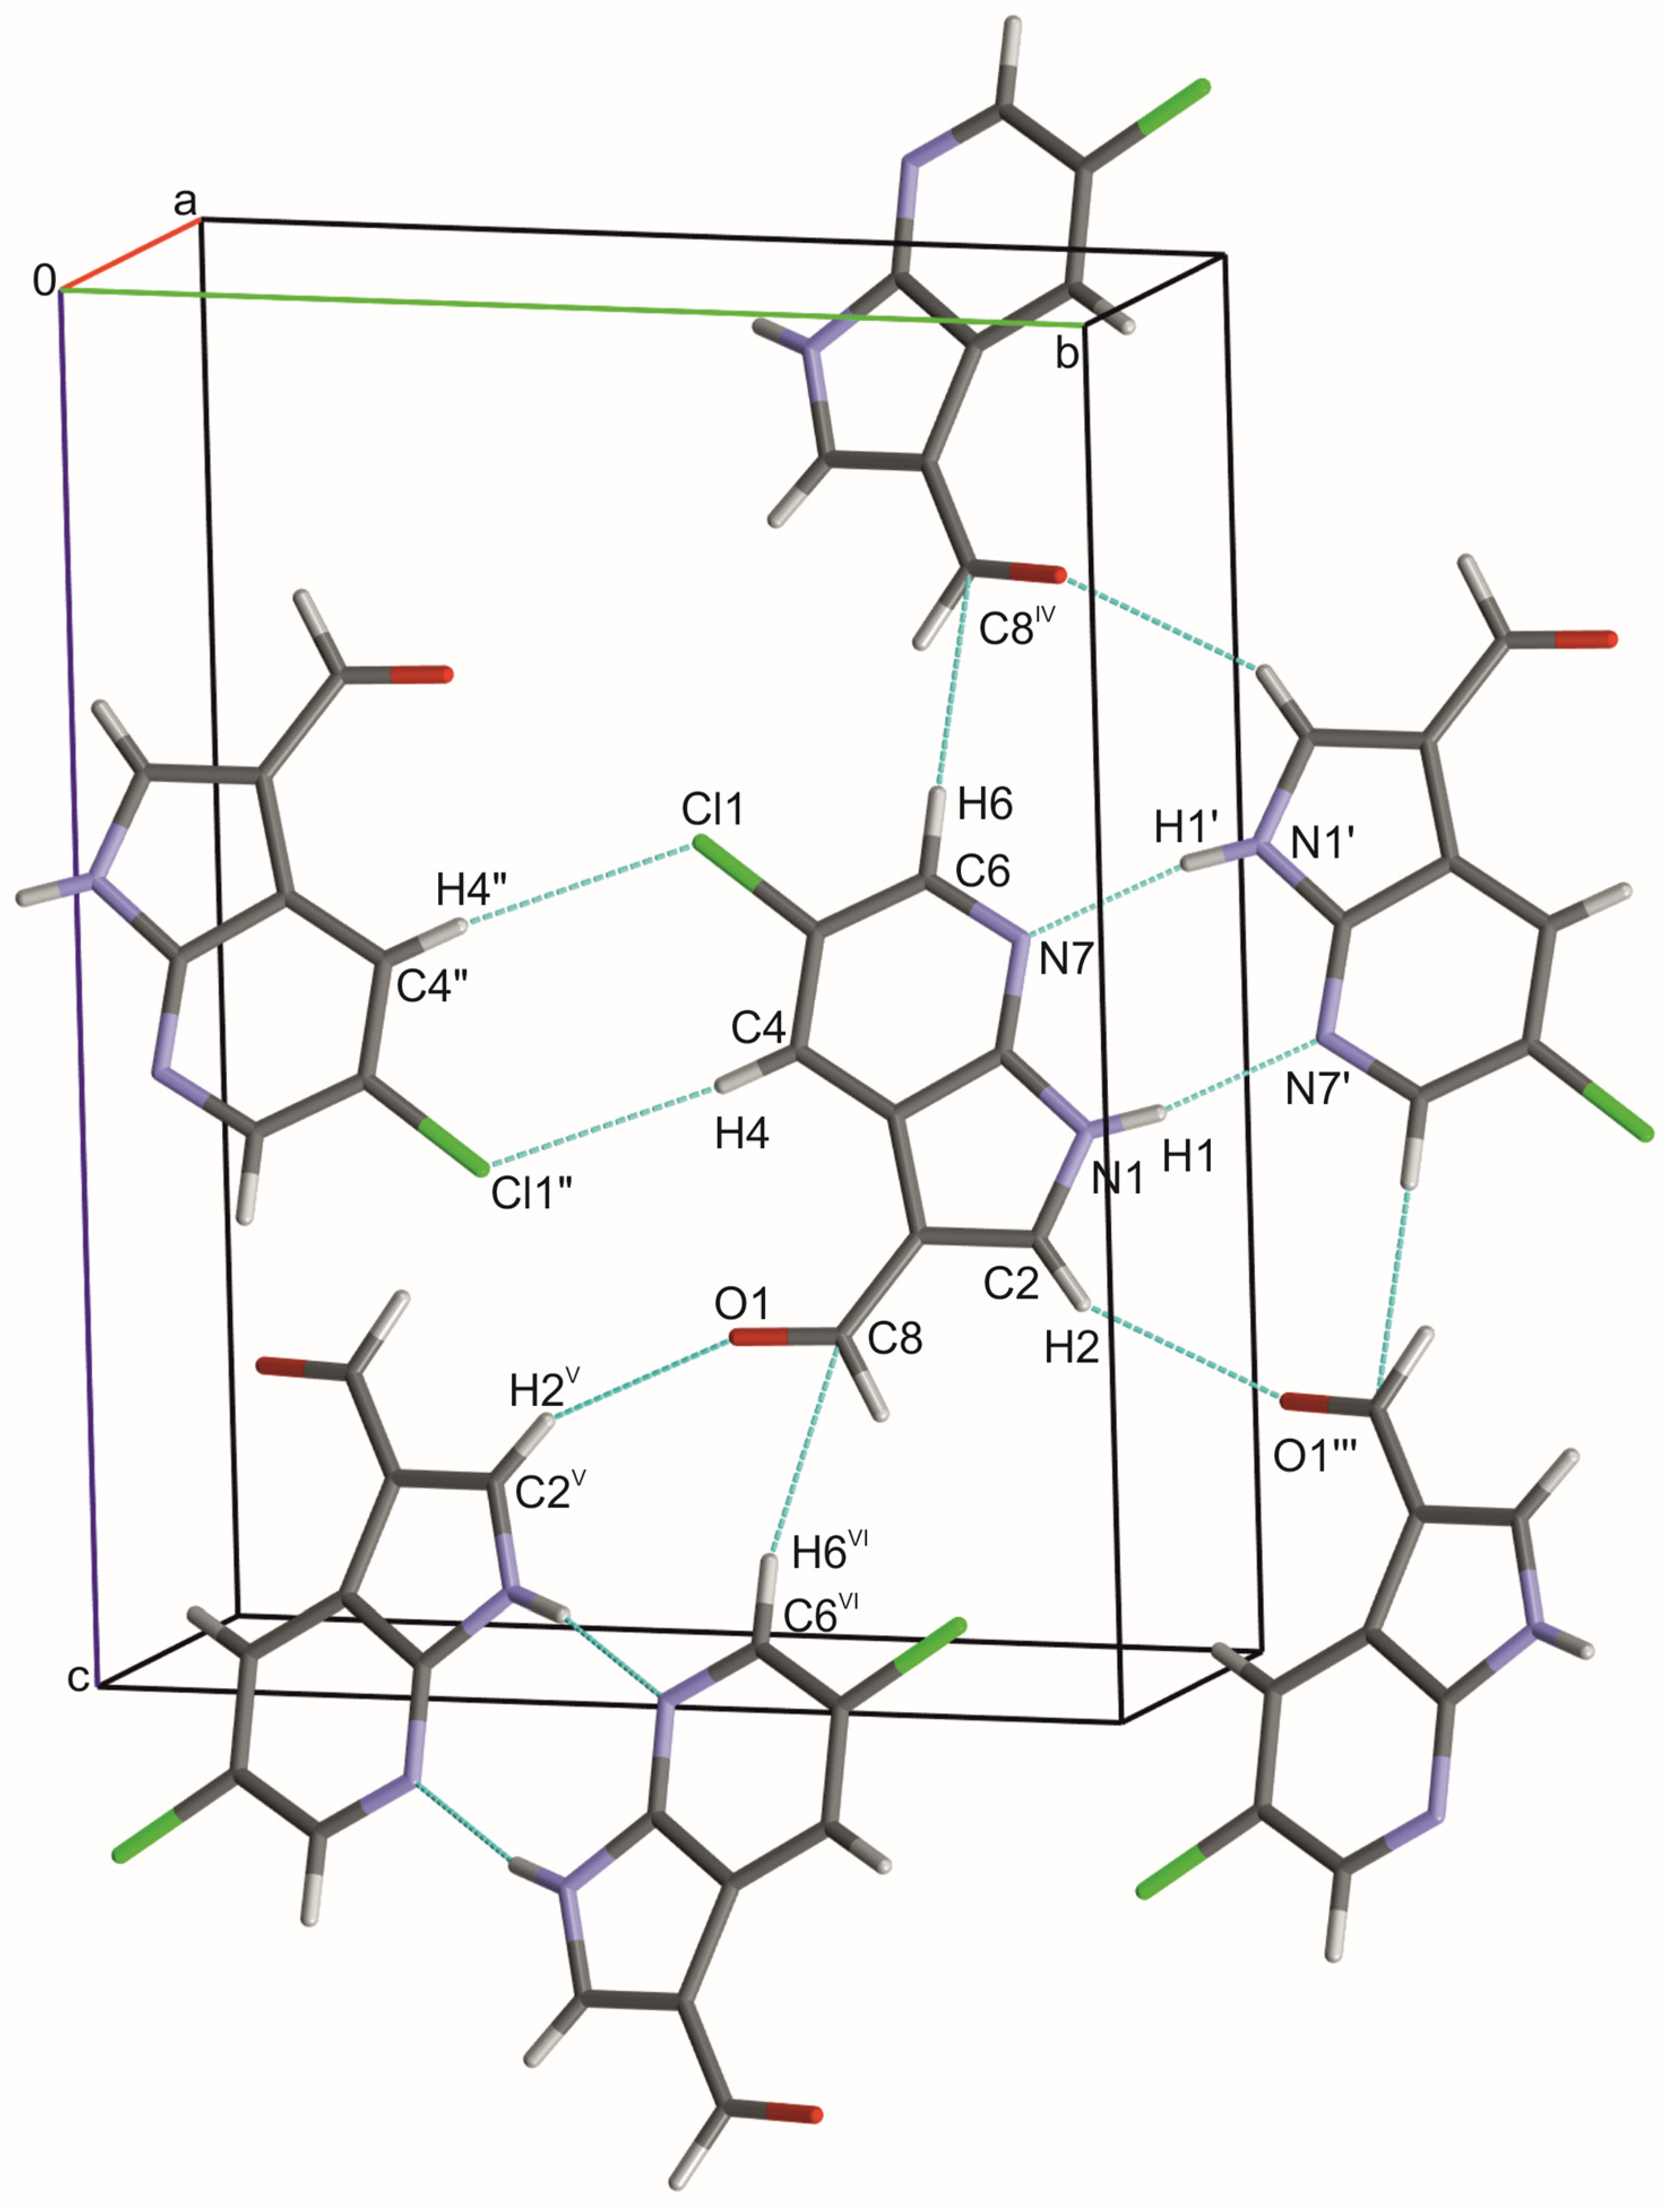
In the crystal structure, the 5Cl7AICA molecules form dimers linked by moderately strong, dual, and nearly linear N1–H1⋅⋅⋅N7 hydrogen bonds between the pyrrole and pyridine rings, as shown in Figure 2. Geometric parameters of these interactions are provided in Table 1.
Additionally, each dimer interacts with neighboring molecules through weak intermolecular hydrogen bonds C2–H2⋅⋅⋅O1. It’s worth noting that these two types of hydrogen bonds (N1–H1⋅⋅⋅N7 and C2–H2⋅⋅⋅O1) also occur in the crystal lattice of 7AICA [17]. However, in the crystal structure of 5Cl7AICA, two other weak interactions, C6–H6⋅⋅⋅C8 and C4–H4⋅⋅⋅Cl1, are present (as shown in Figure 2). These weak interactions meet the criteria for hydrogen bonds specified in the literature [47].
Figure 3a,b depicts the molecular Hirshfeld surfaces mapped with dnorm [48] for 5Cl7AICA. The prominent red spot near hydrogen atom H1 represents the donor involved in the dominant N1–H1⋅⋅⋅N7 hydrogen bond, while another significant red spot near nitrogen atom N7 signifies the acceptor atom in this hydrogen bond. Additionally, small red dots near hydrogen atom H6, oxygen atom O1, and chlorine atom Cl1 indicate the donors and acceptors of weak C6–H6⋅⋅⋅C8, C2–H2⋅⋅⋅O1, and C4–H4⋅⋅⋅Cl1 hydrogen bonds, with spot size and color reflecting the interaction strength. The presence of π⋅⋅⋅π interactions between the 7-azaindole rings is evidenced by the red and blue triangles on the shape index surface of 5Cl7AICA in Figure 3c. The distance between the Cg1 centroid of the six-membered ring and its symmetry-related counterpart is 2.83 Å in 5Cl7AICA, indicating a π⋅⋅⋅π interaction, as shown in Figure S1 and Table S3 of the Supplementary Material. According to the literature, a distance of approximately 3.8 Å is generally regarded as the upper limit for π⋅⋅⋅π interactions to be considered significant [49].

3.2. Structural Analysis of 5Cl7AICA and 4Cl7AICA Dimers Using DFT Methods

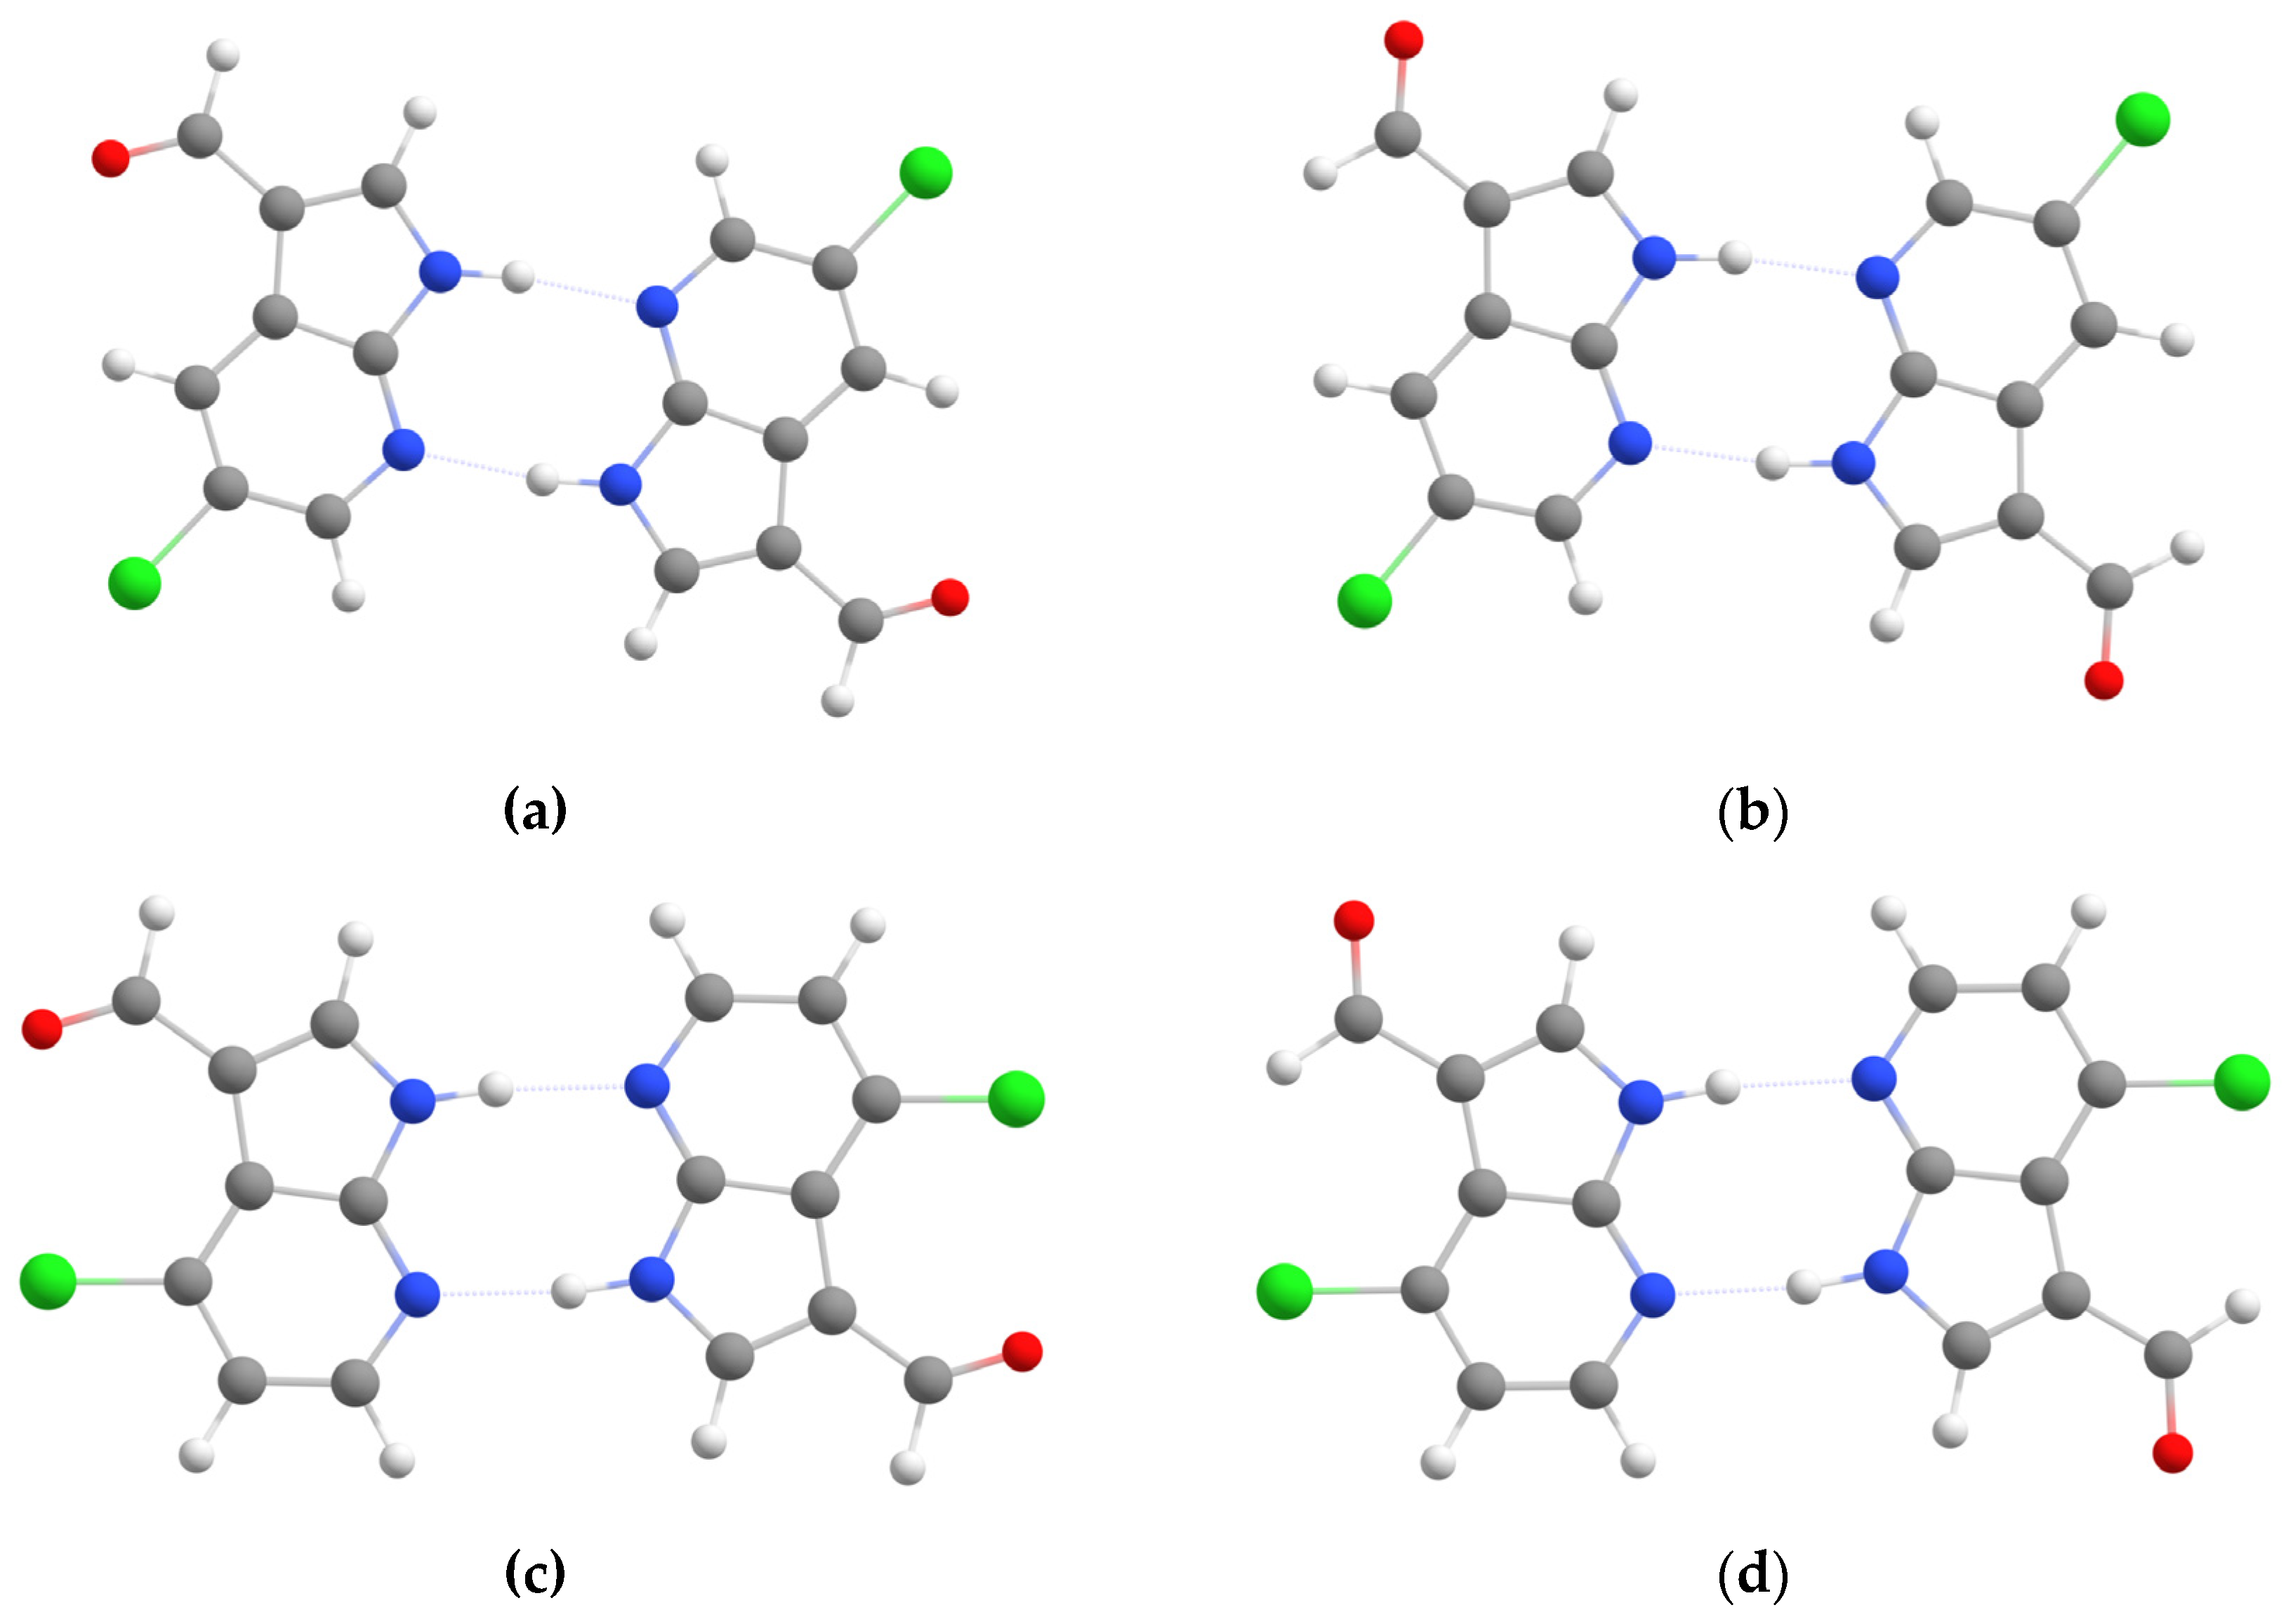
The optimized structures of different dimers of 5Cl7AICA and 4Cl7AICA are illustrated in Figure 4. Figure 4a,b show dimers 1 and 2 of 5Cl7AICA, respectively. Dimer 1 represents the arrangement observed in the crystal structure of 5Cl7AICA, while in dimer 2, the aldehyde group is rotated by 180° relative to dimer 1. Similar dimeric arrangements are depicted for 4Cl7AICA in Figure 4c,d. All optimized structures in Figure 4 display C2h symmetry.
Table S4 in the Supplementary Material presents the calculated electronic energies at minimum of the Potential Energy Surface (Emin.) and the electronic energies corrected by zero-point energy (ZPE) for the most stable dimers of 5Cl7AICA and 4Cl7AICA, along with the relative energy values (Δ). All three DFT methods consistently predicted the lowest energy values for dimer 1 of 5Cl7AICA. This theoretical result aligns well with experimental observations, as the trans arrangement of dimer 1 is observed in the crystal structure. The electronic energies for dimer 2 of 5Cl7AICA are higher by approximately 3.5 to 4.2 kcal/mol, depending on the DFT method used. Conversely, for 4Cl7AICA, the computed energies suggest that dimer 2 is more stable than dimer 1, with the latter having a higher energy by approximately 4.6 to 5.3 kcal/mol. In dimer 1 of 4Cl7AICA, the distance between the oxygen atom of the aldehyde group and the chlorine atom is approximately 3.12 Å, whereas in dimer 2, the distance between the chlorine atom and the hydrogen atom of the aldehyde group is about 2.78 Å. This indicates that a repulsion between the oxygen and chlorine atoms in dimer 1 of 4Cl7AICA is quite significant. On the other hand, the formation of dimer 2 is favored by the presence of a C–H⋅⋅⋅Cl intramolecular interaction, which may stabilize the structure of 4Cl7AICA. It is worth noting that in the crystal of 2-bromo-5-fluorobenzaldehyde, where the aldehyde group has a cis orientation (analogous to that in dimer 2 of 4Cl7AICA), the distance between the hydrogen atom of the aldehyde group and the neighboring bromine atom (H⋅⋅⋅Br) is 2.78 Å [50].
Table S2 in the Supplementary Material contains selected theoretical bond lengths and bond angles for dimer 1 of 5Cl7AICA. The average relative deviations (ARDs) between all experimental and theoretical bond lengths (including C–H and N–H bonds) are 0.36%, 0.33%, and 0.59% for the ωB97X-D, PBE0-D3, and B3LYP-D3 methods, respectively. For all bond angles, the ARD values are 0.47%, 0.50%, and 0.50% for the ωB97X-D, PBE0-D3, and B3LYP-D3 methods, respectively. Thus, both the PBE0-D3 and ωB97X-D methods exhibit better performance in predicting bond lengths, in comparison to B3LYP-D3, while all three DFT methods similarly reproduce bond angles for 5Cl7AICA. Selected theoretical bond lengths and bond angles for dimer 2 of 4Cl7AICA are presented in Table S5 in the Supplementary Material.
Table 1 compares the experimental geometric parameters of intermolecular N1–H1⋅⋅⋅N7′ hydrogen bond in the crystal of 5Cl7AICA with theoretical parameters calculated with three different functionals. As follows from this comparison, all three DFT methods predicted the identical value (172°) for the N1–H1⋅⋅⋅N7′ bond angle, which is in good agreement with the experiment (165.8(13)°). Regarding the N1⋅⋅⋅N7 distance, (2.8834(14) Å) all the employed DFT methods give very good results, the B3LYP-D3 functional overestimates this distance only by 0.015 Å, while the PBE0-D3 method underestimates it by 0.013 Å. Table S6 in the Supplementary Material presents the calculated geometric parameters for the N1–H1⋅⋅⋅N7 hydrogen bonds for dimer 2 of 4Cl7AICA. The computed N1⋅⋅⋅N7 distance varies from 2.904 Å for ωB97X-D to 2.863 Å for the PBE0-D3 method.

3.3. Effect of Internal Rotation of the Aldehyde Group on Vibrational Spectra of 5Cl7AICA and 4Cl7AICA

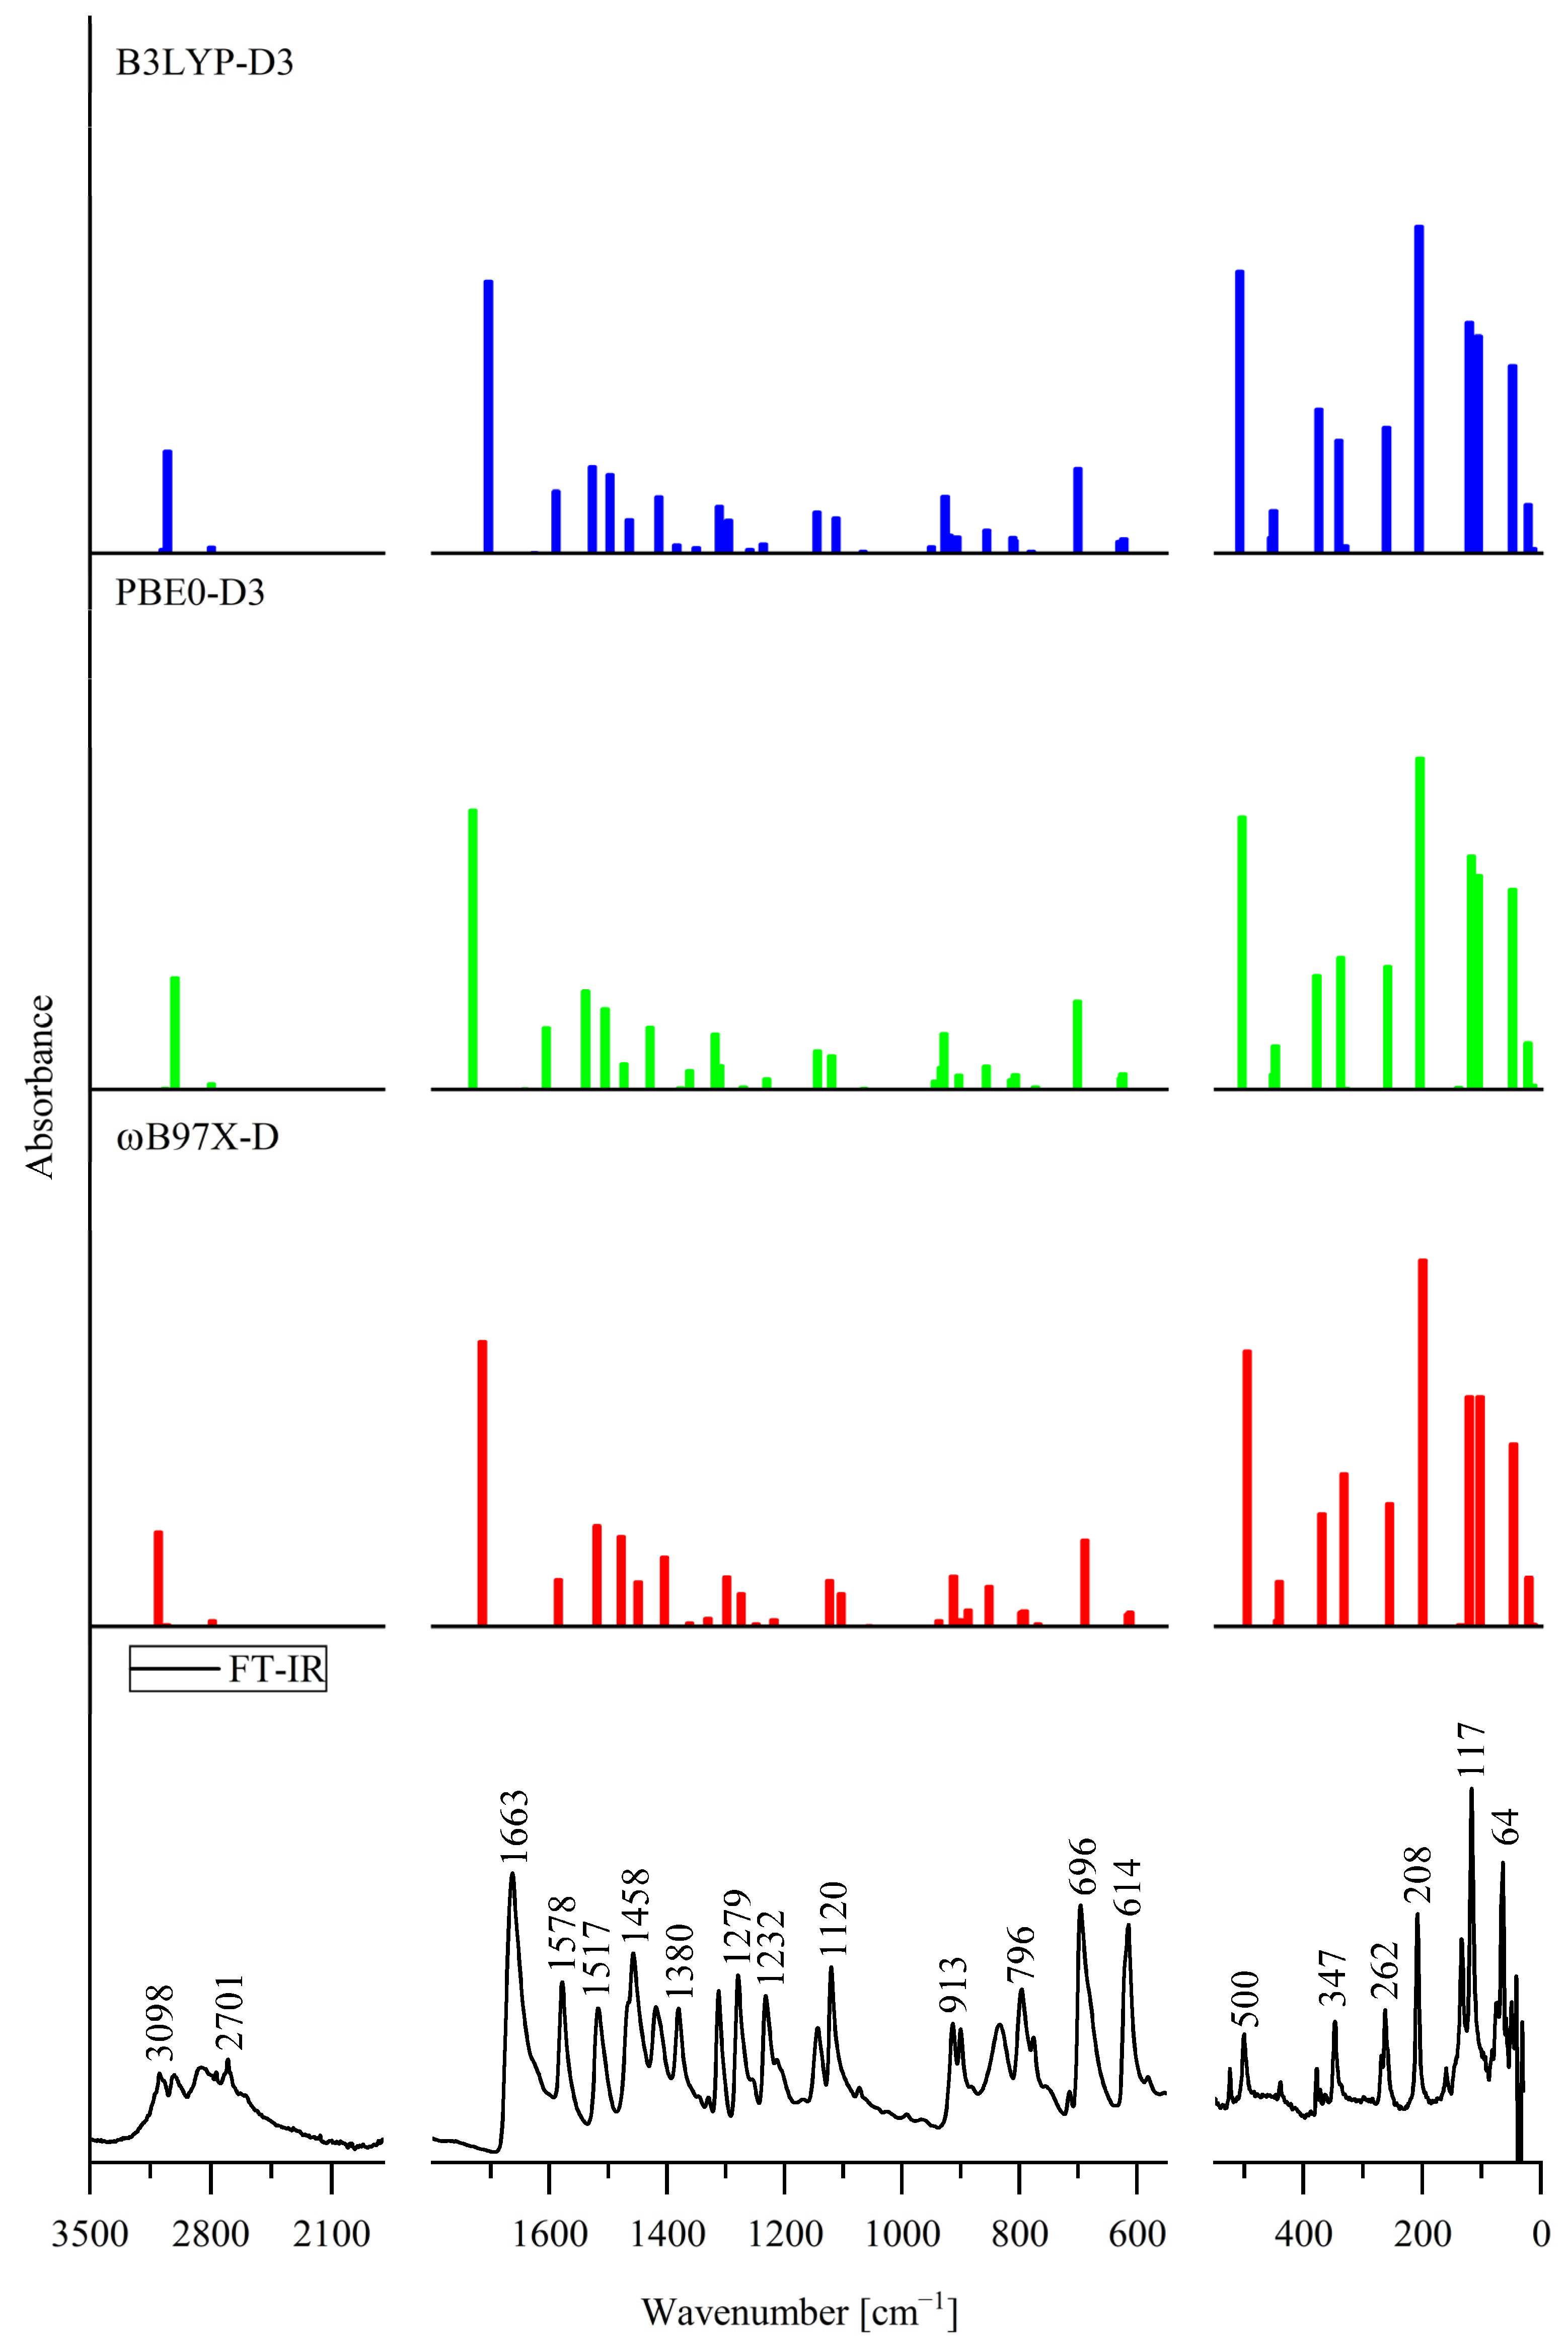
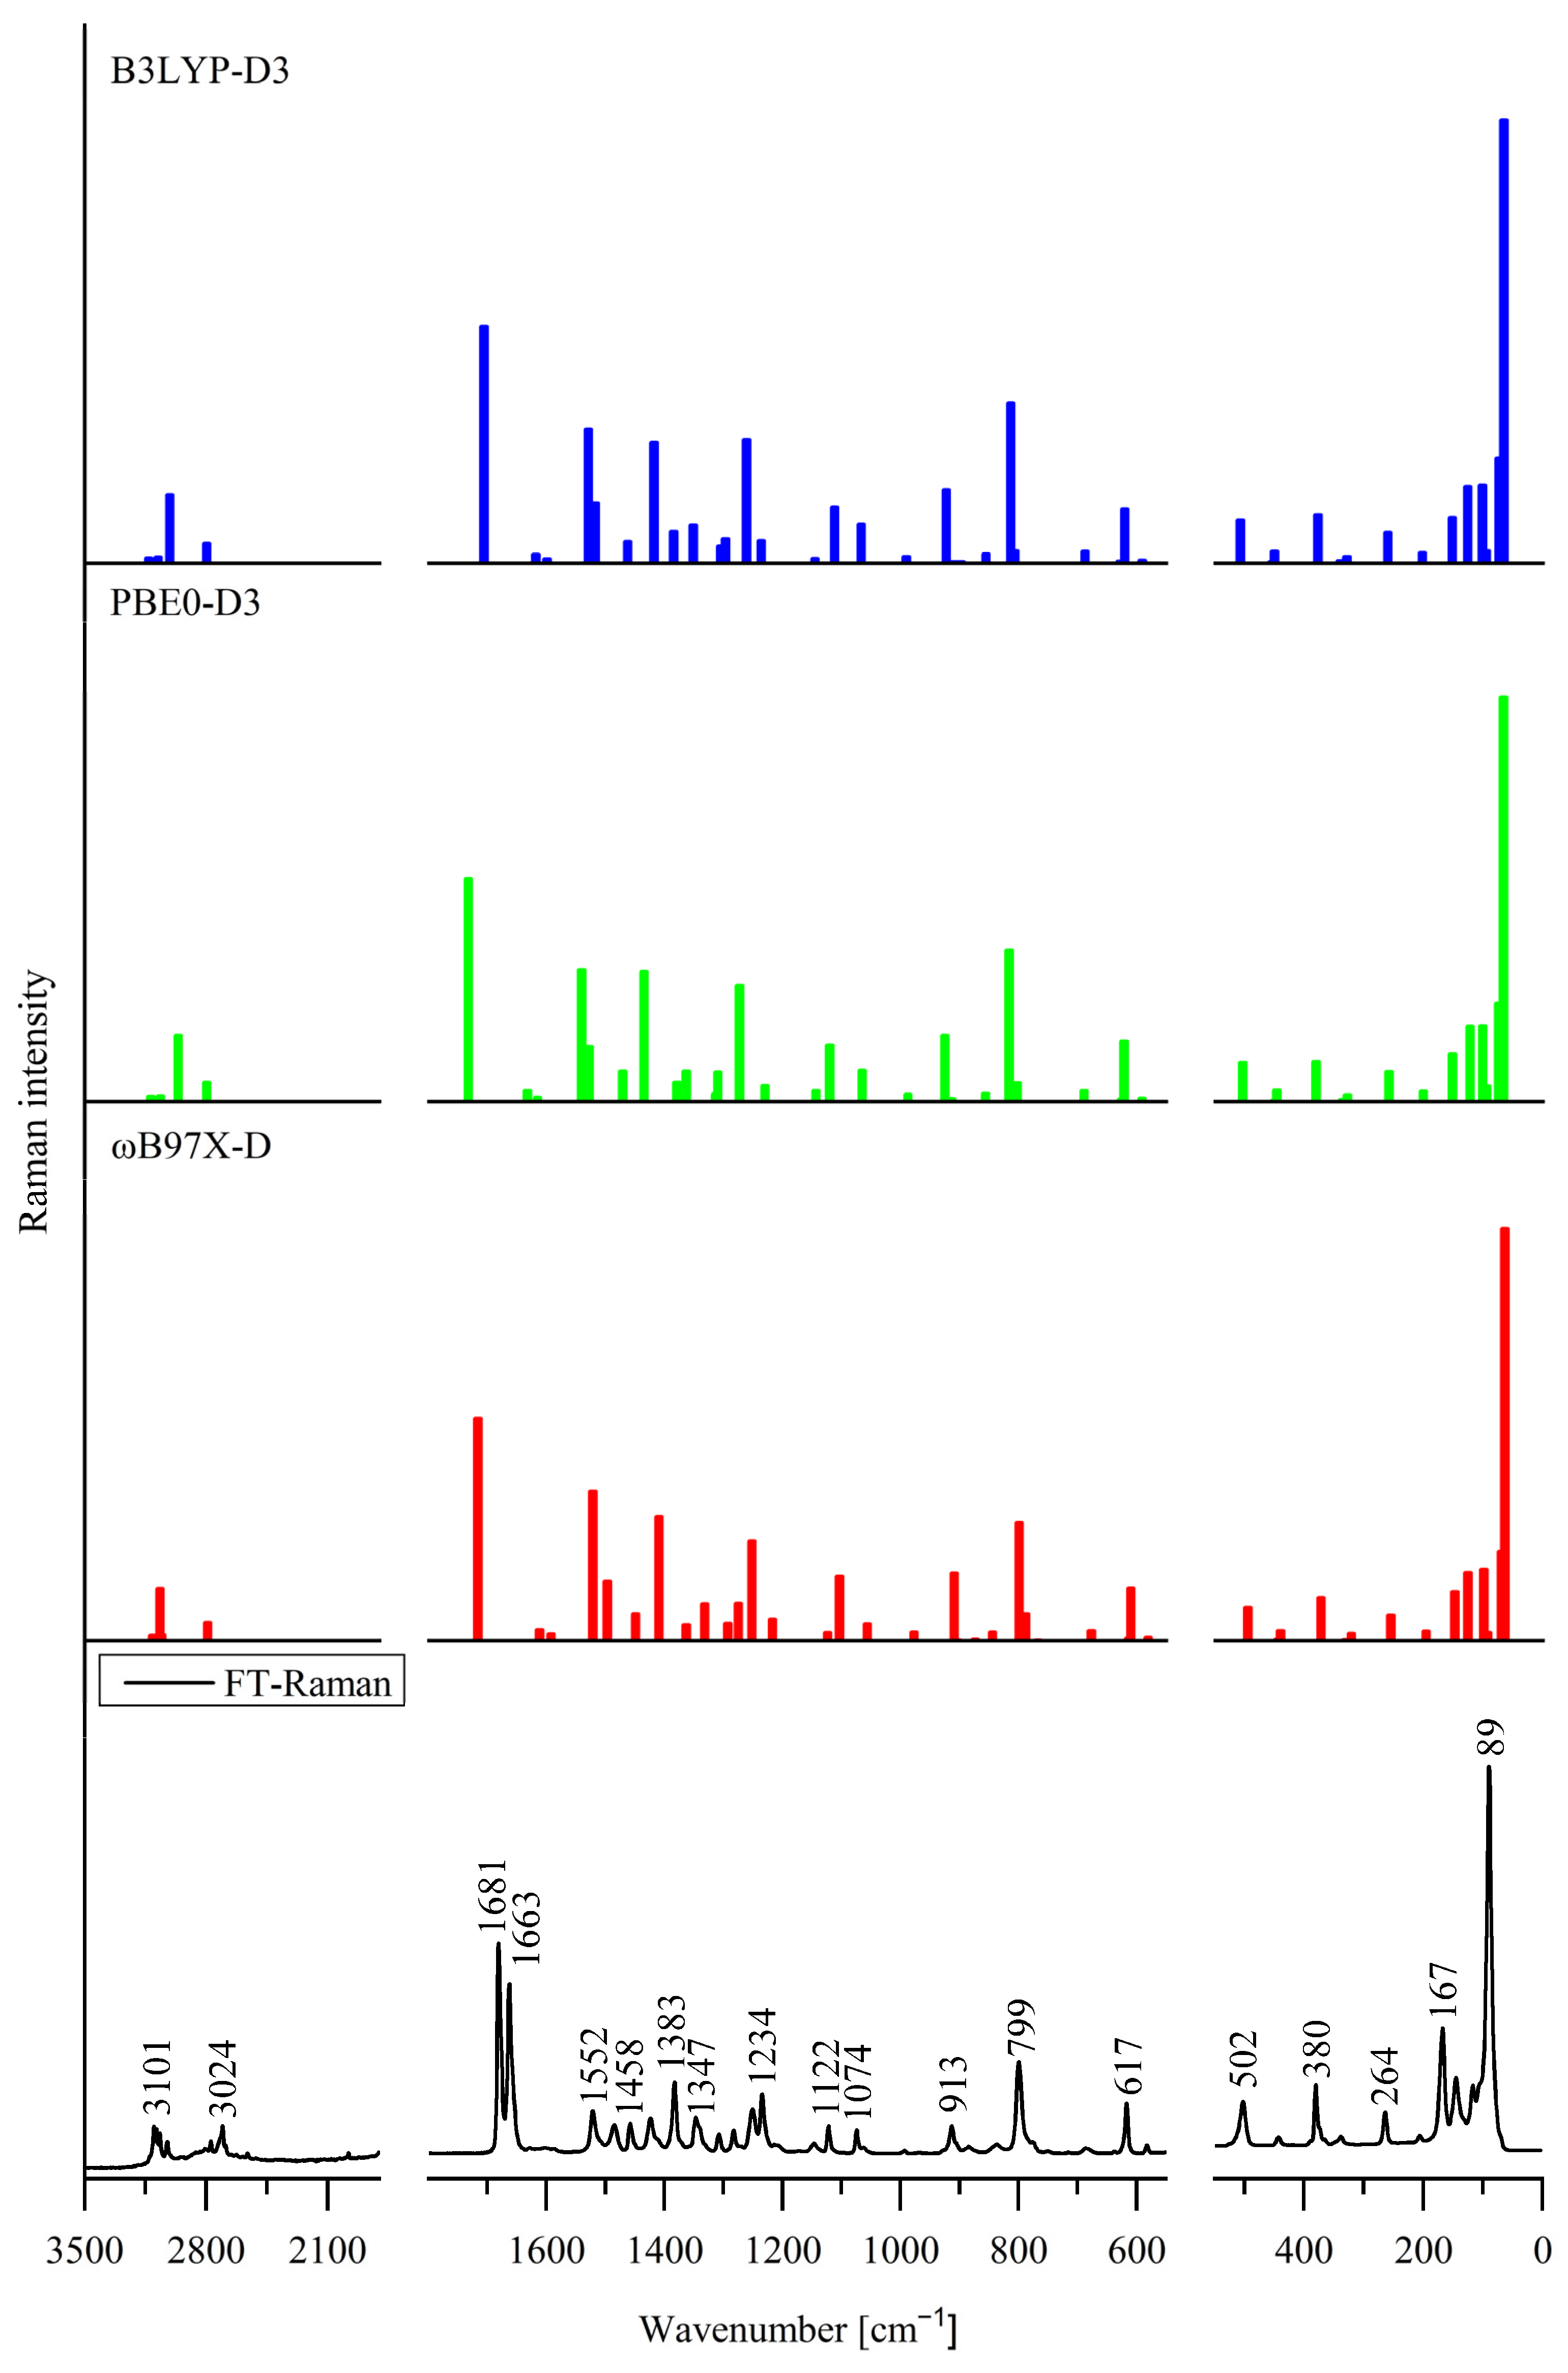
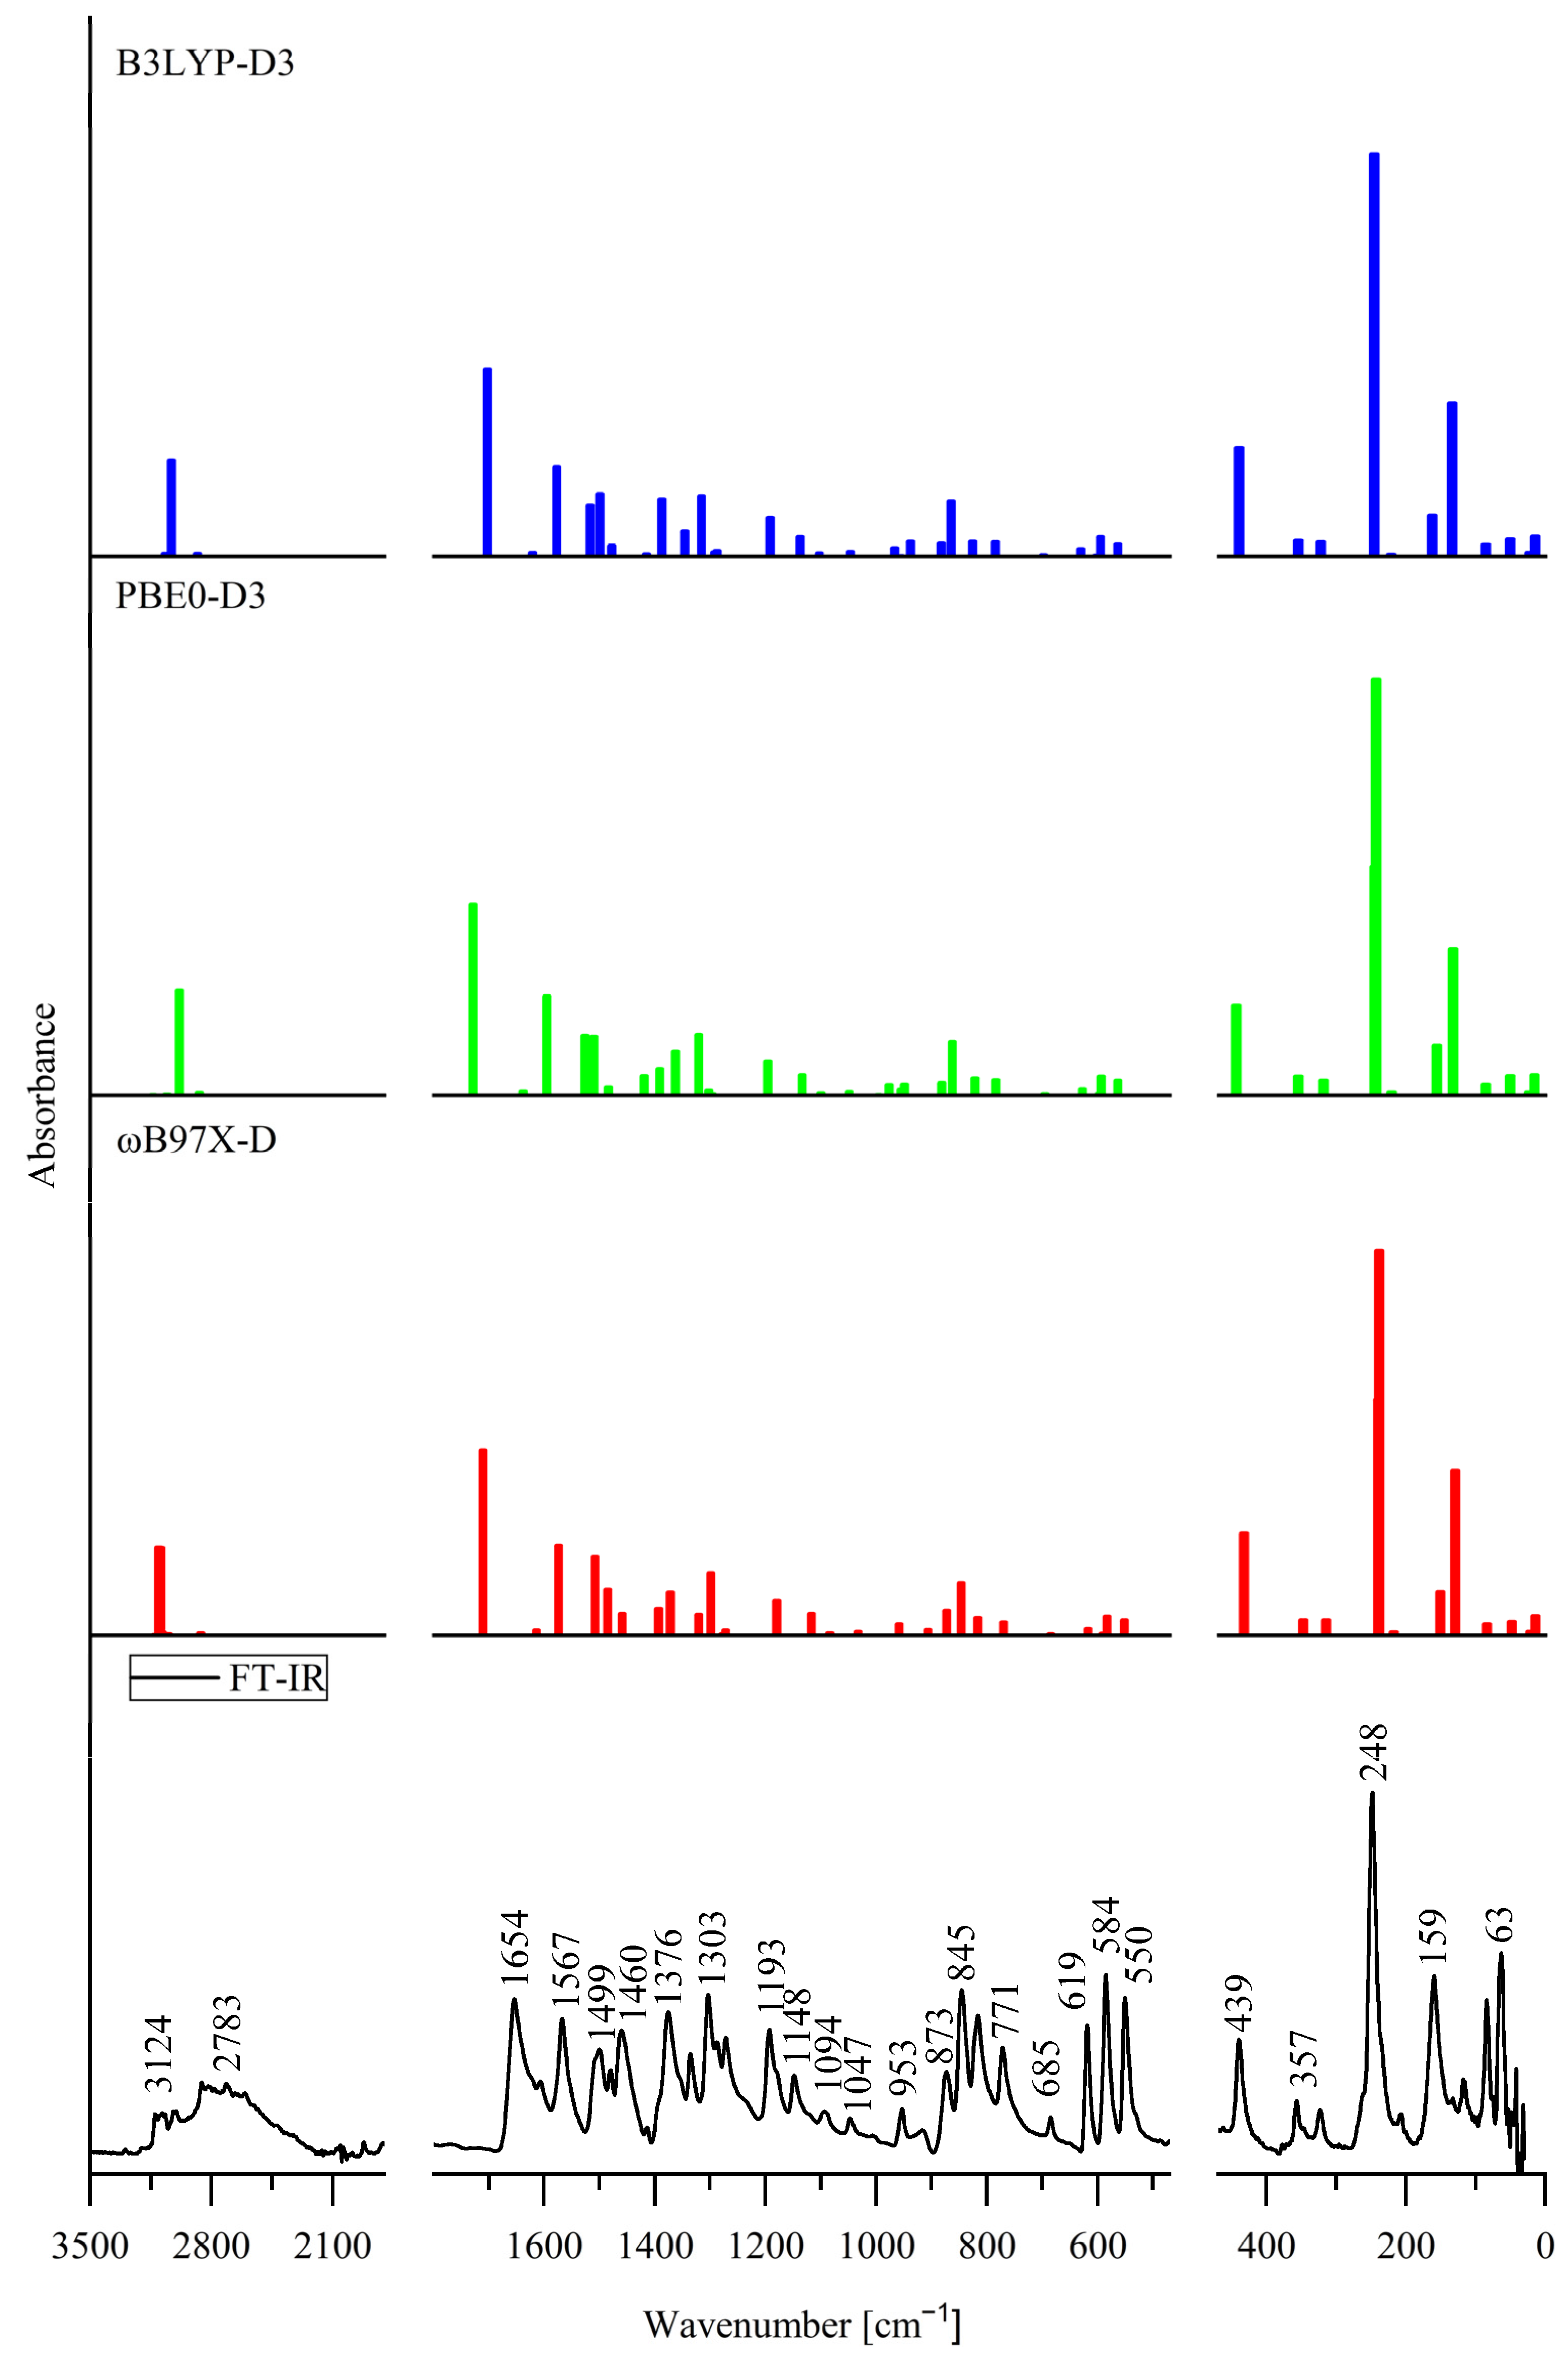
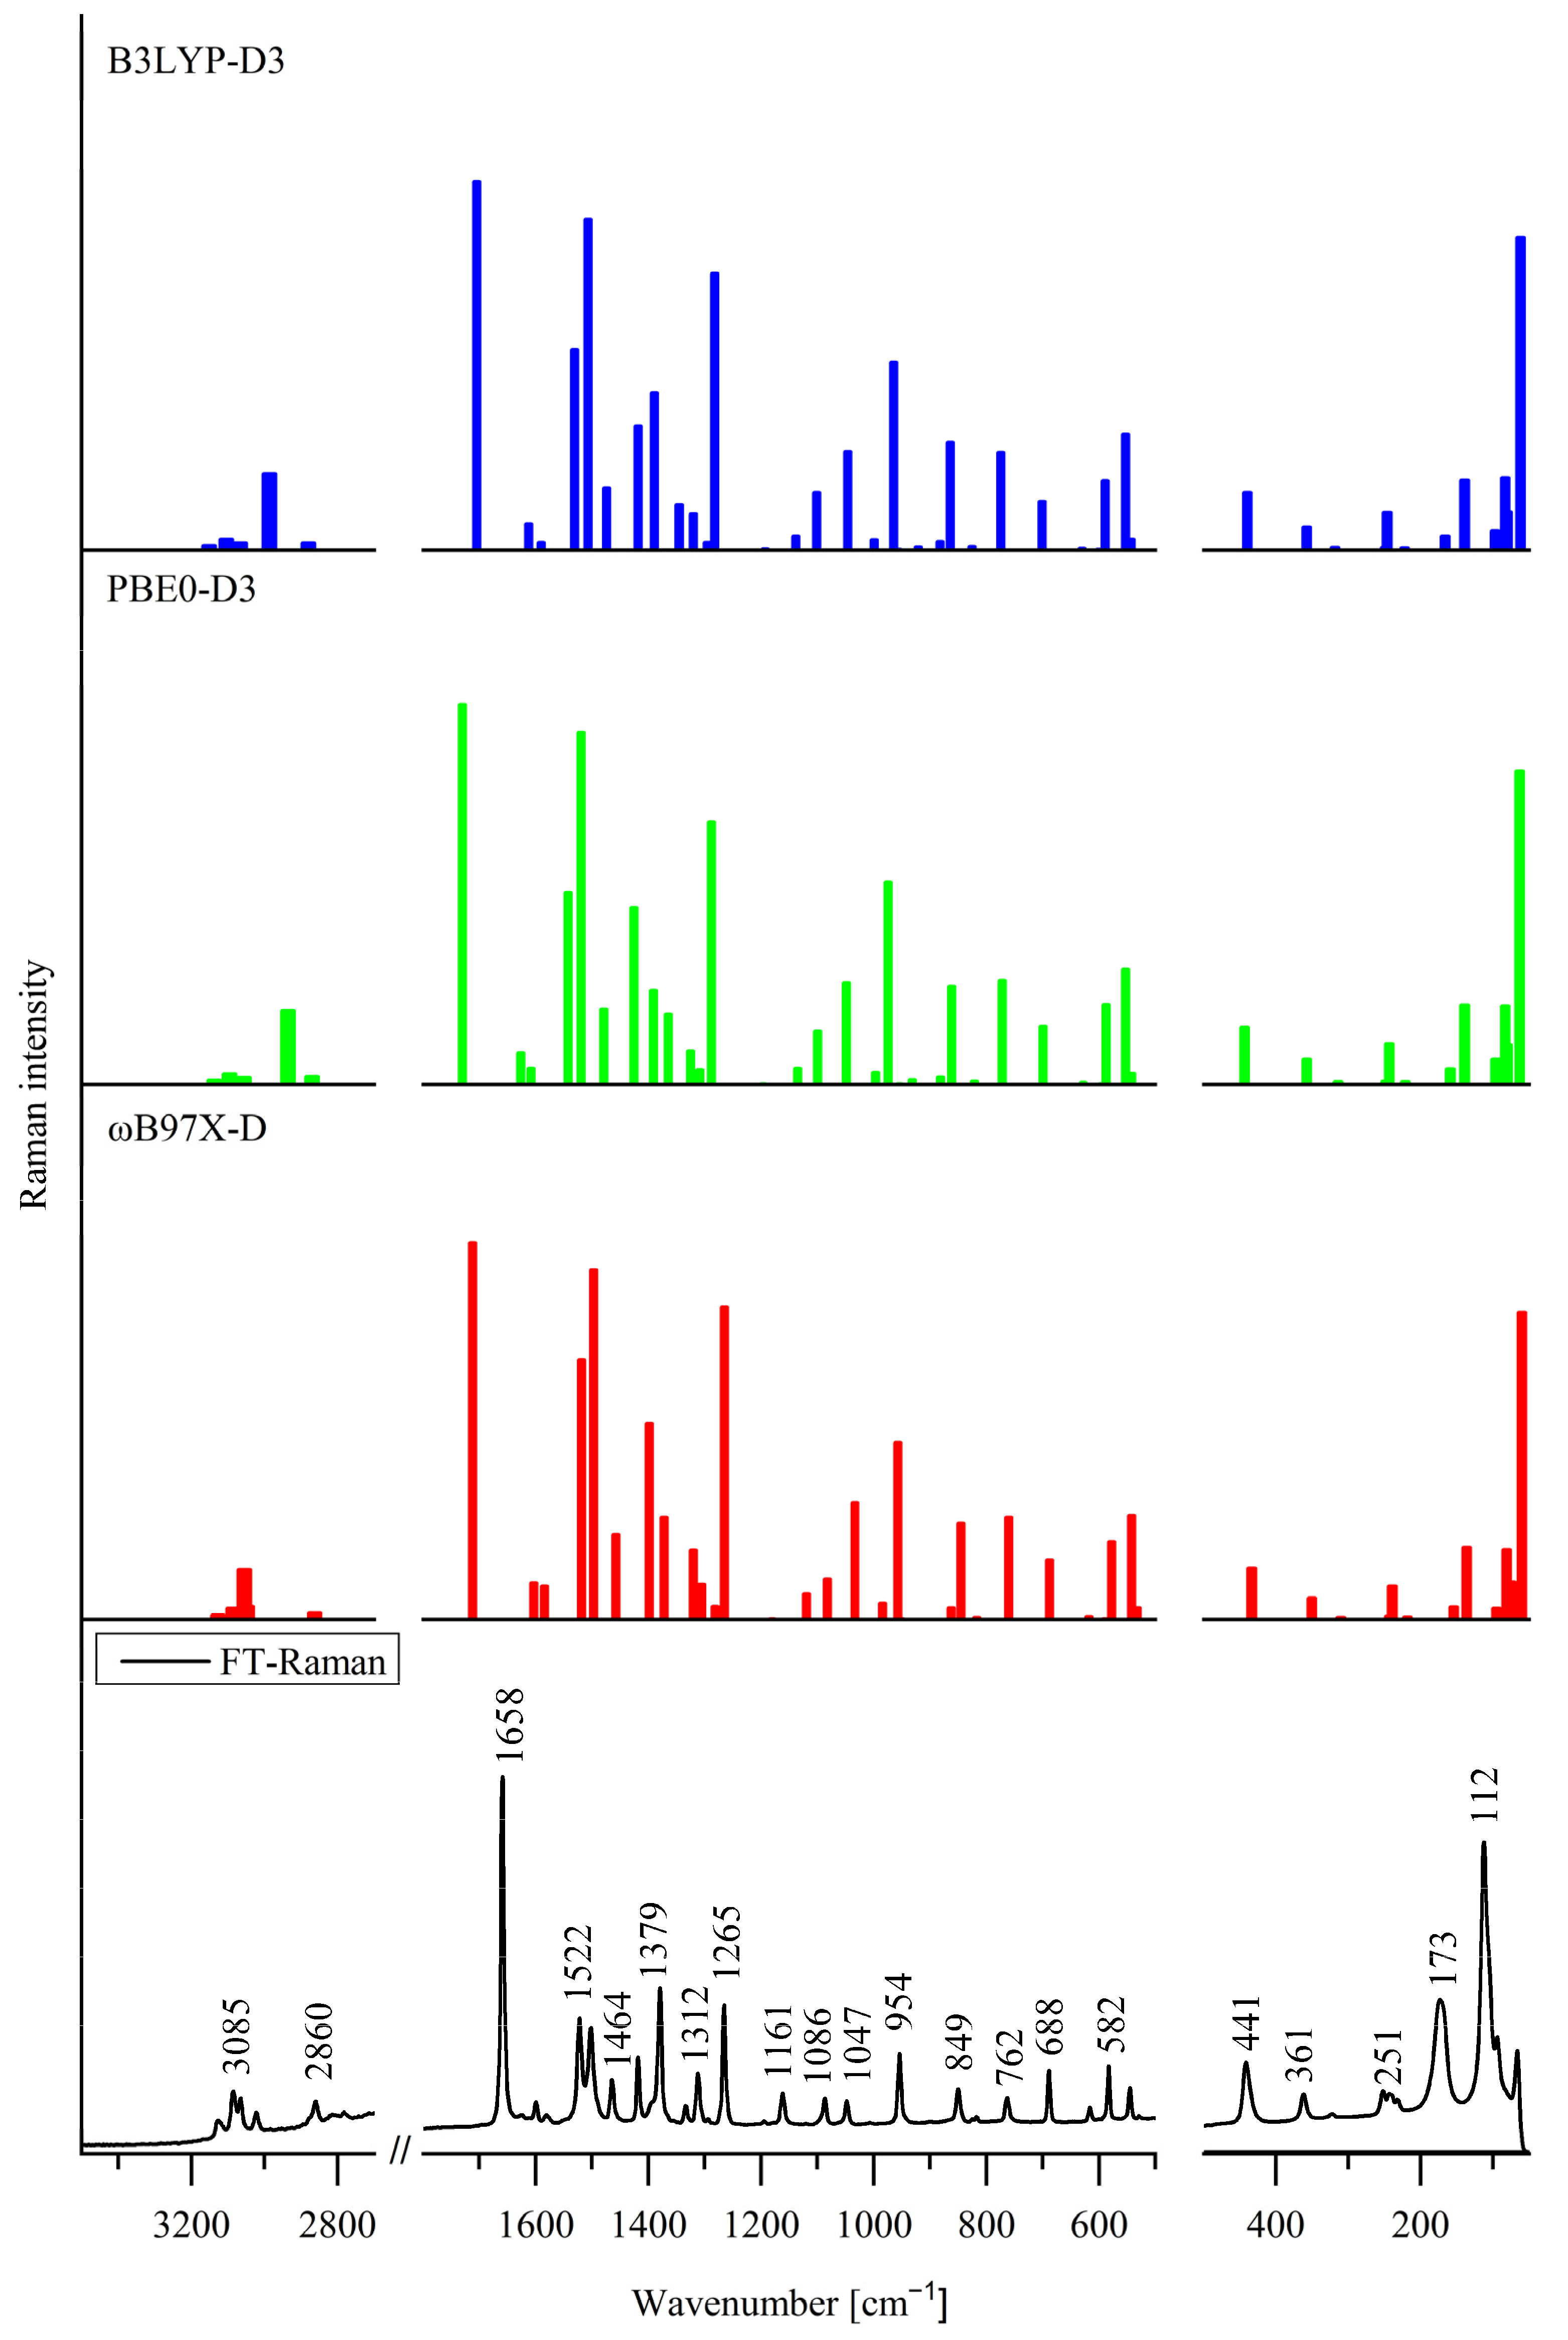
The experimental infrared (IR) and Raman spectra of 5Cl7AICA are presented in Figure 5 and Figure 6, respectively, along with the corresponding theoretical spectra calculated for dimer 1 of 5Cl7AICA. Similarly, Figure 7 and Figure 8 display the experimental IR and Raman spectra of 4Cl7AICA, as well as the corresponding theoretical spectra calculated for dimer 2 of 4Cl7AICA using three different density functional theory (DFT) methods. It is evident from Figure 5, Figure 6, Figure 7 and Figure 8 that the results obtained from the three different DFT calculations are consistent with each other.
All theoretical wavenumbers, IR intensities, Raman scattering activities, and band assignments for dimer 1 of 5Cl7AICA yielded by the ωB97XD method are compiled in Table S7 of the Supplementary Material. Likewise, Table S8 of the Supplementary Material includes all theoretical wavenumbers, IR intensities, Raman scattering activities, and band assignments for dimer 2 of 4Cl7AICA obtained from the ωB97XD calculations. Table S9 in the Supplementary Material presents the observed bands in the FT-IR and FT-Raman spectra of 5Cl7AICA and 4Cl7AICA, alongside their corresponding theoretical wavenumbers, for comparison.
Each dimer of 5Cl7AICA and 4Cl7AICA, illustrated in Figure 4, consists of 34 atoms and generates 96 normal modes. Since each dimer has C2h symmetry, 48 symmetric modes (33Ag and 15Bg) are Raman active, while 48 antisymmetric modes (32Bu and 16Au) are active in the IR spectrum. For brevity, in Table S9 in the Supplementary Material, the wavenumbers of the corresponding symmetric (g) and antisymmetric (u) vibrations, which have similar wavenumbers, are compiled in a single row. Each row begins with the vibration of (u) symmetry followed by (g) vibration. Only in the case of the last six intermolecular vibrations (through the N1–H1⋅⋅⋅N7′ hydrogen bond), each mode is left in a separate row. Detailed symmetry of each normal mode is provided in Tables S7 and S8 in the Supplementary Material.
Examination of the data from Table S9 in the Supplementary Material and Figure 5, Figure 6, Figure 7 and Figure 8 reveals notable differences between the spectra of 5Cl7AICA and 4Cl7AICA, where the aldehyde group adopts trans and cis orientations, respectively (see Figure 4). In the IR spectra of both compounds, a prominent and broad band with numerous substructures is seen from about 3300 to 2500 cm−1. Notably, 4Cl7AICA exhibits a more intricate pattern compared to 5Cl7AICA.
Dreyer’s investigation of the spectra of the 7-azaindole dimer revealed a similar broad IR band within the same wavenumber range [51]. Multiple Fermi resonances involving the antisymmetric ν(NH) stretching mode in the dimer explained the fine structure of this absorption band. Quartic vibrational force field calculations demonstrated that a multiple Fermi resonance model could satisfactorily elucidate the intricate line shape of this absorption band. Similar absorption bands were also observed in other studies on derivatives of 7-azaindole [52]. The IR bands for the N1-H stretching vibrations are predicted at 3104 cm−1 for dimer 1 of 5Cl7AICA and 3093 cm−1 for dimer 2 of 4Cl7AICA. Therefore, in the IR spectrum of 5Cl7AICA, the band at 3098 cm−1 can be assigned to these vibrations, confirming the formation of intermolecular N1–H1⋅⋅⋅N7′ bonds. In the case of 4Cl7AICA, the corresponding band is obscured by the C2H stretching vibrations.
The antisymmetric ν(N1H) stretching vibration has Bu symmetry; therefore, the combination tone must also have Bu symmetry to enter into Fermi resonance with the ν(N1H) fundamental transition. For both 5Cl7AICA and 4Cl7AICA, there are several possibilities of combinations involving the in-plane N–H bending vibrations. For example, combinations 1467 cm−1 (Bu) + 1604 cm−1 (Ag) = 3071 cm−1 (Bu) for 5Cl7AICA, and 1499 cm−1 (Bu) + 1599 cm−1 (Ag) = 3098 cm−1 (Bu) for 4Cl7AICA satisfy the conditions for Fermi resonance with the ν(N1H) fundamental vibration.
It is also known that the stretching mode of the formyl C8H group leads to the occurrence of doublets and multiplets due to FR in the regions 2900–2800 cm−1 and 2775–2695 cm−1 [53,54]. In the case of 5Cl7AICA, the predicted bands for the C8H stretching vibrations have lower wavenumbers (by about 70 cm−1) compared to 4Cl7AICA. These theoretical results are consistent with the experimental data.
The characteristic carbonyl stretching vibration typically exhibits strong signals in IR spectra, while its intensity tends to be notably weaker in Raman spectra. Nevertheless, the conjugation effect between the C=O group and the azaindole ring can influence both the frequency and the intensity of the C=O stretching vibration [55]. Theoretical calculations suggest that the C8=O1 stretching vibration should be observed as a prominent band in both the IR and Raman spectra of 5Cl7AICA and 4Cl7AICA. Consequently, the strong Raman and IR bands observed, respectively, at 1663 cm−1 and 1653 cm−1 for 5Cl7AICA, and at 1654 cm−1 and 1658 cm−1 for 4Cl7AICA, can be attributed to the ν(C8=O1) stretching modes. The experimental wavenumbers are lower by about 50 cm−1 in comparison to the theoretical calculations, and this effect confirms the presence of C–H∙∙∙O intermolecular interactions not only in the crystal of 5Cl7AICA but also in solid 4Cl7AICA.
It is worth noting that, in the Raman spectrum of 5Cl7AICA, an additional strong band is observed at 1681 cm−1, similar to that reported for 7AICA at 1678 cm−1 [17]. Both of these molecules in crystal consist of trans conformers (regarding the position of the CHO group with respect to the pyrrole ring). However, in the case of 4Cl7AICA (cis conformers), this additional strong band is not observed in the Raman spectrum. This suggests that Fermi resonance may lead to an additional splitting of the ν(C8=O1) carbonyl band in the spectra of trans conformers of 5Cl7AICA. An analogous Fermi resonance phenomenon within this range has been documented for other aldehydes [53,54,55,56].
As seen in Table S9 in the Supplementary Material, the observed bands in the range below 400 cm−1 show some differences between the two compounds. The potential energy distribution (PED) analysis also indicates that these bands have slightly different characteristics, except for the N1–H1⋅⋅⋅N7 hydrogen bridge vibrations. It is worth emphasizing that the calculated spectra for the type 1 dimer of 5Cl7AICA and the type 2 dimer of 4Cl7AICA show good agreement with the experimental spectra of these molecules. These results support the presence of two different conformers of 5Cl7AICA and 4Cl7AICA, in the solid state.
Detailed assignments of all observed bands in the vibrational spectra of the investigated chloro-7-azaindoles are collected in Table S9 in the Supplementary Material.

4. Conclusions

A single-crystal X-ray analysis of 5-chloro-7-azaindole-3-carbaldehyde (5Cl7AICA) has revealed that each pair of 5Cl7AICA molecules forms a dimer via dual and strong intermolecular N1–H1⋅⋅⋅N7′ hydrogen bonds, complemented by weak C2–H2⋅⋅⋅O1, C6–H6⋅⋅⋅C8, and C4–H4⋅⋅⋅Cl1 intermolecular interactions.
Theoretical studies using three different DFT methods (B3LYP-D3, PBE0-D3, and ωB97X-D) consistently indicate that, for 5Cl7AICA, dimer 1 exhibits a higher stability than dimer 2. It should be stressed that this result is in agreement with the experiment, because dimer 1 is present in the crystal structure of 5Cl7AICA. Conversely, computations for 4Cl7AICA suggest that dimer 2 displays greater stability than dimer 1. The two dimers differ by the relative orientation of the CHO group with respect to the pyrrole ring of the 7-azaindole moiety. In dimer 1 the C8=O1 and C3=C2 bonds are in trans conformation, while in dimer 2 the aldehyde group is rotated by 180°, which leads to a cis conformation.
The comparative analysis of the experimental vibrational spectra and theoretical DFT calculations has shown noteworthy differences between the two compounds, primarily attributed to the distinct orientation of the aldehyde group (trans conformation observed in 5Cl7AICA and cis conformation in 4Cl7AICA). Furthermore, the vibrational spectra of the investigated molecules confirmed the presence of intermolecular interactions in the solid state.
These findings significantly enhance our understanding of the structural features and vibrational spectra of this class of compounds.

Supplementary Materials

The following supporting information can be downloaded at: https://www.mdpi.com/article/10.3390/cryst14070631/s1, Table S1: Crystal data and structure refinement of 5Cl7AICA; Table S2: Selected experimental (X-ray) bond lengths [Å] and bond angles [°], observed in 5Cl7AICA, along with the corresponding theoretical parameters calculated for dimer 1 of 5Cl7AICA using three DFT methods with the 6-31++G(d,p) basis set; Figure S1: Distance between two stacked rings of 5Cl7AICA; Table S3: Geometry of π⋅⋅⋅π interactions in 5Cl7AICA. Table S4: The electronic energies and their relative values Δ [kcal/mol] for dimers 1 and 2 of 5Cl7AICA and 4Cl7AICA calculated with three DFT methods; Table S5: Theoretical bond lengths [Å] and bond angles [°] for dimer 2 of 4Cl7AICA calculated using three DFT methods with the 6-31++G(d,p) basis set; Table S6: Geometrical parameters for intermolecular N1–H1⋅⋅⋅N7 hydrogen bond (distances [Å] and angles [°]) calculated for dimer 2 of 4Cl7AICA using DFT methods and the 6-31++G(d,p) basis set; Table S7: Experimental bands (FT-IR, FT-Raman) of 5Cl7AICA and theoretical wavenumbers ( ν ˜ a, cm−1), infrared intensities (AIR, km·mol−1), and Raman scattering activities (SR, Å4·amu−1) calculated for dimer 1 of 5Cl7AICA using the ωB97X-D method and the 6-31++G(d,p) basis set with band assignments; Table S8: Experimental bands (FT-IR, FT-Raman) of 4Cl7AICA and theoretical wavenumbers ( ν ˜ a, cm−1), infrared intensities (AIR, km·mol−1), and Raman scattering activities (SR, Å4·amu−1) calculated for dimer 2 of 4Cl7AICA using the ωB97X-D method and the 6-31++G(d,p) basis set with band assignments. Table S9: Experimental bands in the FT-IR and FT-Raman spectra of 5Cl7AICA and 4Cl7AICA and the corresponding calculated wavenumbers ( ν ˜ a, cm−1) along with band assignments. Figure S2: Original FT-IR spectrum of 5Cl7AICA in the range from 4000 cm−1 to 400 cm−1; Figure S3: Original FT-IR spectrum of 5Cl7AICA in the range from 600 cm−1 to 50 cm−1; Figure S4: Original FT-Raman spectrum of 5Cl7AICA in the range from 3600 cm−1 to 50 cm−1; Figure S5. Original FT-IR spectrum of 4Cl7AICA in the range from 4000 cm−1 to 400 cm−1; Figure S6: Original FT-IR spectrum of 4Cl7AICA in the range from 600 cm−1 to 50 cm−1; Figure S7: Original FT-Raman spectrum of 4Cl7AICA in the range from 3600 cm−1 to 50 cm−1. Checkcif report of 5Cl7AICA. CCDC 2277023 contains the supplementary crystallographic data for 5Cl7AICA. These data can be obtained free of charge via https://www.ccdc.cam.ac.uk/structures/ or from the Cambridge Crystallographic Data center, 12 Union Road, Cambridge CB2 1EZ, UK: Fax (+44)-1223-336-033 or e-mail [email protected].

Author Contributions

Conceptualization, B.M.-O.; methodology, B.M.-O.; validation, B.M.-O.; formal analysis, B.M.-O.; investigation, W.M., J.B., M.M. and B.M.-O.; resources, B.M.-O.; data curation, B.M.-O.; writing—original draft preparation, B.M.-O.; writing—review and editing, B.M.-O.; visualization, W.M., J.B. and B.M.-O.; project administration, B.M.-O. All authors have read and agreed to the published version of the manuscript.

Funding

This research received no external funding.

Data Availability Statement

The original contributions presented in the study are included in the article or Supplementary Material, further inquiries can be directed to the corresponding author.

Acknowledgments

The calculations were carried out using resources provided by Wroclaw Centre for Networking and Supercomputing (http://wcss.pl).

Conflicts of Interest

The authors declare no conflicts of interest.

References

  1. Motati, D.R.; Amaradhi, R.; Ganesh, T. Azaindole therapeutic agents. Bioorg. Med. Chem. 2020, 28, 115830. [Google Scholar] [CrossRef]
  2. Urvashi; Senthil Kumar, J.B.; Das, P.; Tandon, V. Development of Azaindole-Based Frameworks as Potential Antiviral Agents and Their Future Perspectives. J. Med. Chem. 2022, 65, 6454–6495. [Google Scholar] [CrossRef] [PubMed]
  3. Abimbola Salubi, C.; Abbo, H.S.; Jahed, N.; Titinchi, S. Medicinal chemistry perspectives on the development of piperazine-containing HIV-1 inhibitors. Bioorg. Med. Chem. 2024, 99, 117605. [Google Scholar] [CrossRef] [PubMed]
  4. Wang, S.; Ying, Z.; Huang, Y.; Li, Y.; Hu, M.; Kang, K.; Wang, H.; Shao, J.; Wu, G.; Yu, Y.; et al. Synthesis and structure-activity optimization of 7-azaindoles containing aza-β-amino acids targeting the influenza PB2 subunit. Eur. J. Med. Chem. 2023, 250, 115185. [Google Scholar] [CrossRef] [PubMed]
  5. Reddi, B.; Kishor, C.; Jangam, A.; Bala, S.; Rajeswari, B.; Batchu, U.R.; Gundla, R.; Addlagatta, A. Regioselectivity in inhibition of peptide deformylase from Haemophilus influenzae by 4- vs 5-azaindole hydroxamic acid derivatives: Biochemical, struc-tural and antimicrobial studies. Bioorg. Chem. 2022, 128, 106095. [Google Scholar] [CrossRef] [PubMed]
  6. Fang, G.; Chen, H.; Cheng, Z.; Tang, Z.; Wan, Y. Azaindole derivatives as potential kinase inhibitors and their SARs elucidation. Eur. J. Med. Chem. 2023, 258, 115621. [Google Scholar] [CrossRef] [PubMed]
  7. Zhang, Q.; Gao, X.; Duan, X.; Liang, H.; Gao, M.; Dong, D.; Guo, C.; Huang, L. Design, synthesis and SAR of novel 7-azaindole derivatives as potential Erk5 kinase inhibitor with anticancer activity. Bioorg. Med. Chem. 2023, 95, 117503. [Google Scholar] [CrossRef] [PubMed]
  8. Sharma, N.; Chaudhary, A.; Sachdeva, M. An insight into the structure–activity relationship studies of anticancer medicinal attributes of 7-azaindole derivatives: A review. Future Med. Chem. 2023, 15, 24. [Google Scholar] [CrossRef] [PubMed]
  9. Gorecki, L.; Muthna, D.; Merdita, S.; Andrs, M.; Kucera, T.; Havelek, R.; Muckova, L.; Kobrlova, T.; Soukup, J.; Krupa, P.; et al. 7-Azaindole, 2,7-diazaindole, and 1H-pyrazole as core structures for novel anticancer agents with potential chemosensitizing properties. Eur. J. Med. Chem. 2022, 240, 114580. [Google Scholar] [CrossRef] [PubMed]
  10. Kwon, O.H.; Jang, D.J. Proton Transfer of Excited 7-Azaindole in Reverse-Micellar Methanol Nanopools:  Even Faster than in Bulk Methanol. J. Phys. Chem. B 2005, 109, 8049–8052. [Google Scholar] [CrossRef] [PubMed]
  11. Yamazaki, S. Concerted-asynchronous reaction path of the excited-state double proton transfer in the 7-azaindole homodimer and 6H-indolo[2,3-b]quinoline/7-azaindole heterodimer. Chem. Phys. 2018, 515, 768–778. [Google Scholar] [CrossRef]
  12. Wang, C.; He, F.; Sun, K.; Guo, K.; Lu, S.; Wu, T.; Gao, X.; Fang, M. Identification and characterization of 7-azaindole derivatives as inhibitors of the SARS-CoV-2 spike-hACE2 protein interaction. Int. J. Biol. Macromol. 2023, 244, 125182. [Google Scholar] [CrossRef] [PubMed]
  13. Ariza, M.; Kolb, H.C.; Moechars, D.; Rombouts, F.; Andrés, J.I. Tau Positron Emission Tomography (PET) Imaging: Past, Pre-sent, and Future. J. Med. Chem. 2015, 58, 4365–4382. [Google Scholar] [CrossRef] [PubMed]
  14. Shi, L.; Wang, Z.; Yang, G.; Yang, H. A Novel Electrochemical Sensor for the Determination of Aflatoxin B1 Based on Polymerized 4-Amino-7-azaindole-Nitrogen-Doped Graphene. Int. J. Electrochem. Sci. 2020, 15, 11092–11101. [Google Scholar] [CrossRef]
  15. Cardoza, S.; Das, P.; Tandon, V. Pd-Catalyzed Sequential Arylation of 7-Azaindoles: Aggregate-Induced Emission of Tetra-Aryl 7-Azaindoles. J. Org. Chem. 2019, 84, 14015–14029. [Google Scholar] [CrossRef] [PubMed]
  16. Li, B.; Yue, Z.Z.; Feng, J.M.; He, Q.; Miao, Z.H.; Yang, C.H. Design and synthesis of pyrido[3,2-α]carbazole derivatives and their analogues as potent antitumour agents. Eur. J. Med. Chem. 2013, 66, 531–539. [Google Scholar] [CrossRef] [PubMed]
  17. Morzyk-Ociepa, B.; Szmigiel, K.; Turowska-Tyrk, I.; Michalska, D. X-ray crystal structure, infrared, Raman and density functional studies of 7-azaindole-3-carboxaldehyde. J. Mol. Struct. 2017, 1128, 186–194. [Google Scholar] [CrossRef]
  18. Morzyk-Ociepa, B.; Szmigiel, K.; Turowska-Tyrk, I.; Malik-Gajewska, M.; Banach, J.; Wietrzyk, J. New mono- and dinuclear complexes of 7-azaindole-3-carboxaldehyde with palladium(II): Crystal structure, IR and Raman spectra, DFT calculations and in vitro antiproliferative activity. Polyhedron 2018, 153, 88–98. [Google Scholar] [CrossRef]
  19. Morzyk-Ociepa, B.; Szmigiel-Bakalarz, K.; Nentwig, M.; Oeckler, O.; Malik-Gajewska, M.; Turlej, E.; Wietrzyk, J.; Michalska, D. Platinum(II) and copper(II) complexes of 7-azaindole-3-carboxaldehyde: Crystal structures, IR and Raman spectra, DFT calcu-lations and in vitro antiproliferative activity of the platinum(II) complex. Inorg. Chim. Acta 2019, 490, 68–77. [Google Scholar] [CrossRef]
  20. Smith, B.R.; Eastman, C.M.; Njardarson, J.T. Beyond C, H, O, and N! Analysis of the Elemental Composition of U.S. FDA Approved Drug Architectures. J. Med. Chem. 2014, 57, 9764–9773. [Google Scholar] [CrossRef] [PubMed]
  21. Rigaku Oxford Diffraction. CrysAlis PRO; Rigaku Oxford Diffraction Ltd.: Oxfordshire, UK, 2015. [Google Scholar]
  22. Sheldrick, G.M. A short history of SHELX. Acta Cryst. 2008, A64, 112–122. [Google Scholar] [CrossRef]
  23. Sheldrick, G.M. Crystal Structure Refinement with SHELXL. Acta Cryst. 2015, C71, 3–8. [Google Scholar] [CrossRef]
  24. Kleemiss, F.; Dolomanov, O.V.; Bodensteiner, M.; Peyerimhoff, N.; Midgley, L.; Bourhis, L.J.; Genoni, A.; Malaspina, L.A.; Jayatilaka, D.; Spencer, J.L.; et al. Accurate crystal structures and chemical properties from NoSpherA2. Chem. Sci. 2021, 12, 1675–1692. [Google Scholar] [CrossRef] [PubMed]
  25. Dolomanov, O.V.; Bourhis, L.J.; Gildea, R.J.; Howard, J.A.K.; Puschmann, H. OLEX2: A complete structure solution, refinement and analysis program. J. Appl. Cryst. 2009, 42, 339–341. [Google Scholar] [CrossRef]
  26. Bourhis, L.J.; Dolomanov, O.V.; Gildea, R.J.; Howard, J.A.K.; Puschmann, H. The anatomy of a comprehensive constrained, restrained refinement program for the modern computing environment—Olex2 dissected. Acta Cryst. 2015, A71, 59–75. [Google Scholar] [CrossRef]
  27. Neese, F. Software update: The ORCA program system—Version 5.0. WIREs Comput. Mol. Sci. 2022, 12, e1606. [Google Scholar] [CrossRef]
  28. Farrugia, L.J. WinGX and ORTEP for Windows: An update. J. Appl. Cryst. 2012, 45, 849–854. [Google Scholar] [CrossRef]
  29. Macrae, C.F.; Sovago, I.; Cottrell, S.J.; Galek, P.T.A.; McCabe, P.; Pidcock, E.; Platings, M.; Shields, G.P.; Stevens, J.S.; Towler, M.; et al. Mercury 4.0: From visualization to analysis, design and prediction. J. Appl. Cryst. 2000, 53, 226–235. [Google Scholar] [CrossRef] [PubMed]
  30. Frisch, M.J.; Trucks, G.W.; Schlegel, H.B.; Scuseria, G.E.; Robb, M.A.; Cheeseman, J.R.; Scalmani, G.; Barone, V.; Petersson, G.A.; Nakatsuji, H.; et al. Gaussian 16, Revision C.01; Gaussian, Inc.: Wallingford, CT, USA, 2019. [Google Scholar]
  31. Grimme, S.; Antony, J.; Ehrlich, S.; Krieg, H. A consistent and accurate ab initio parametrization of density functional dispersion correction (DFT-D) for the 94 ele-ments H-Pu. J. Chem. Phys. 2010, 132, 154104. [Google Scholar] [CrossRef]
  32. Becke, A.D. Density-functional exchange-energy approximation with correct asymptotic behavior. Phys. Rev. A 1988, 38, 3098–3100. [Google Scholar] [CrossRef] [PubMed]
  33. Lee, C.; Yang, W.; Parr, R.G. Development of the Colle-Salvetti correlation-energy formula into a functional of the electron density. Phys. Rev. B 1988, 37, 785–789. [Google Scholar] [CrossRef] [PubMed]
  34. Stephens, P.J.; Devlin, F.J.; Chabalowski, C.F.; Frisch, M.J. Ab Initio Calculation of Vibrational Absorption and Circular Dichroism Spectra Using Density Functional Force Fields. J. Phys. Chem. 1994, 98, 11623–11627. [Google Scholar] [CrossRef]
  35. Perdew, J.P.; Burke, K.; Ernzerhof, M. Generalized Gradient Approximation Made Simple. Phys. Rev. Lett. 1996, 77, 3865–3868. [Google Scholar] [CrossRef] [PubMed]
  36. Ernzerhof, M.; Scuseria, G.E. Assessment of the Perdew–Burke–Ernzerhof exchange-correlation functional. J. Chem. Phys. 1999, 110, 5029–5036. [Google Scholar] [CrossRef]
  37. Adamo, C.; Barone, V. Toward Reliable Density Functional Methods without Adjustable Parameters: The PBE0 Model. J. Chem. Phys. 1999, 110, 6158. [Google Scholar] [CrossRef]
  38. Chai, J.D.; Head-Gordon, M. Long-range corrected hybrid density functionals with damped atom-atom dispersion corrections. Phys. Chem. Chem. Phys. 2008, 10, 6615–6620. [Google Scholar] [CrossRef]
  39. Frisch, M.J.; Pople, J.A.; Binkley, J.S. Self-consistent molecular orbital methods 25. Supplementary functions for Gaussian basis sets. J. Chem. Phys. 1984, 80, 3265–3269. [Google Scholar] [CrossRef]
  40. Krishnan, R.; Binkley, J.S.; Seeger, R.; Pople, J.A. Self-consistent molecular orbital methods. XX. A basis set for correlated wavefunctions. J. Chem. Phys. 1980, 72, 650–654. [Google Scholar] [CrossRef]
  41. Chemcraft. Graphical Software for Visualization of Quantum Chemistry Computations. Version 1.8, Build 682. Available online: https://www.chemcraftprog.com (accessed on 27 February 2024).
  42. Zapata Trujillo, J.C.; McKemmish, L.K. Model chemistry recommendations for scaled harmonic frequency calculations: A benchmark study. J. Phys. Chem. 2023, A127, 1715–1735. [Google Scholar] [CrossRef] [PubMed]
  43. Legler, C.R.; Brown, N.R.; Dunbar, R.A.; Harness, M.D.; Nguyen, K.; Oyewole, O.; Collier, W.B. Scaled Quantum Mechanical scale factors for vibrational calculations using alternate polarized and augmented basis sets with the B3LYP density functional calculation model. Spectrochim. Acta A 2015, 145, 15–24. [Google Scholar] [CrossRef] [PubMed]
  44. Morzyk-Ociepa, B.; Dysz, K.; Turowska-Tyrk, I.; Michalska, D. X-ray crystal structure, vibrational spectra and DFT calculations of 3-chloro-7-azaindole: A case of dual N–H⋯N hydrogen bonds in dimers. Spectrochim. Acta 2015, 136A, 405–415. [Google Scholar] [CrossRef]
  45. Hazra, D.K.; Mukherjee, A.K.; Helliwell, M.; Mukherjee, M. Topological features and electronic structure of 4-chloro-1H-pyrrolo[2{,}3-b]pyridine: Experimental charge density analysis and DFT studies. CrystEngComm 2012, 14, 993–1000. [Google Scholar] [CrossRef]
  46. Morzyk-Ociepa, B.; Dysz, K.; Turowska-Tyrk, I.; Michalska, D. Crystal structures, vibrational spectra and DFT calculations of five halogeno-derivatives of 7-azaindole (3Br7AI, 4Br7AI, 4Cl7AI, 3Br4Cl7AI and 5Br3Cl7AI): A comparative study. J. Mol. Struct. 2018, 1152, 386–398. [Google Scholar] [CrossRef]
  47. Desiraju, G.R.; Steiner, T. The Weak Hydrogen Bond in Structural Chemistry and Biology; Oxford University Press: Oxford, UK, 1999. [Google Scholar]
  48. Spackman, P.R.; Turner, M.J.; McKinnon, J.J.; Wolff, S.K.; Grimwood, D.J.; Jayatilaka, D.; Spackman, M.A. CrystalExplorer: A program for Hirshfeld surface analysis, visualization and quantitative analysis of molecular crystals. J. Appl. Cryst. 2021, 54, 1006–1011. [Google Scholar] [CrossRef] [PubMed]
  49. Janiak, C. A critical account on π–π stacking in metal complexes with aromatic nitrogen-containing ligands. J. Chem. Soc. Dalton Trans. 2000, 3885–3896. [Google Scholar] [CrossRef]
  50. Tureski, R.E.; Tanski, J.M. 2-bromo-5-fluorobenzaldehyd. Acta Cryst. 2013, E69, o1246. [Google Scholar] [CrossRef]
  51. Dreyer, J. Unraveling the structure of hydrogen bond stretching mode infrared absorption bands: An anharmonic density functional theory study on 7-azaindole dimers. J. Chem. Phys. 2007, 127, 054309. [Google Scholar] [CrossRef]
  52. Morzyk-Ociepa, B.; Dysz, K.; Turowska-Tyrk, I.; Michalska, D. Reinvestigation of the crystal structure, vibrational spectroscopic studies and DFT calculations of 5-bromo-7-azaindole with dual N–H···N hydrogen bonds in dimers. J. Mol. Struct. 2015, 1101, 91–100. [Google Scholar] [CrossRef]
  53. Hiremath, C.S.; Tonannavar, J. Vibrational assignments and effect of aldehyde rotation on substituents in some trisubstituted benzaldehydes. Spectrochim. Acta 2009, 73A, 388–397. [Google Scholar] [CrossRef] [PubMed]
  54. Hiremath, C.S.; Yenagi, J.; Tonannavar, J. FT-Raman and infrared spectra and vibrational assignments for 3-chloro-4-methoxybenzaldehyde, as supported by ab initio, hybrid density func-tional theory and normal coordinate calculations. Spectrochim. Acta 2007, 68A, 710–717. [Google Scholar] [CrossRef]
  55. Binoy, J.; Joe, I.H.; Jayakumar, V.S. Changes in the vibrational spectral modes by the nonbonded interactions in the NLO crystal vanillin. J. Raman Spectrosc. 2005, 36, 1091–1100. [Google Scholar] [CrossRef]
  56. Rogojerov, M.; Keresztury, G.; Jordanov, B. Vibrational spectra of partially oriented molecules having two conformers in nematic and isotropic solutions: Furfural and 2-chlorobenzaldehyde. Spectrochim. Acta 2005, 61A, 1661–1670. [Google Scholar] [CrossRef] [PubMed]
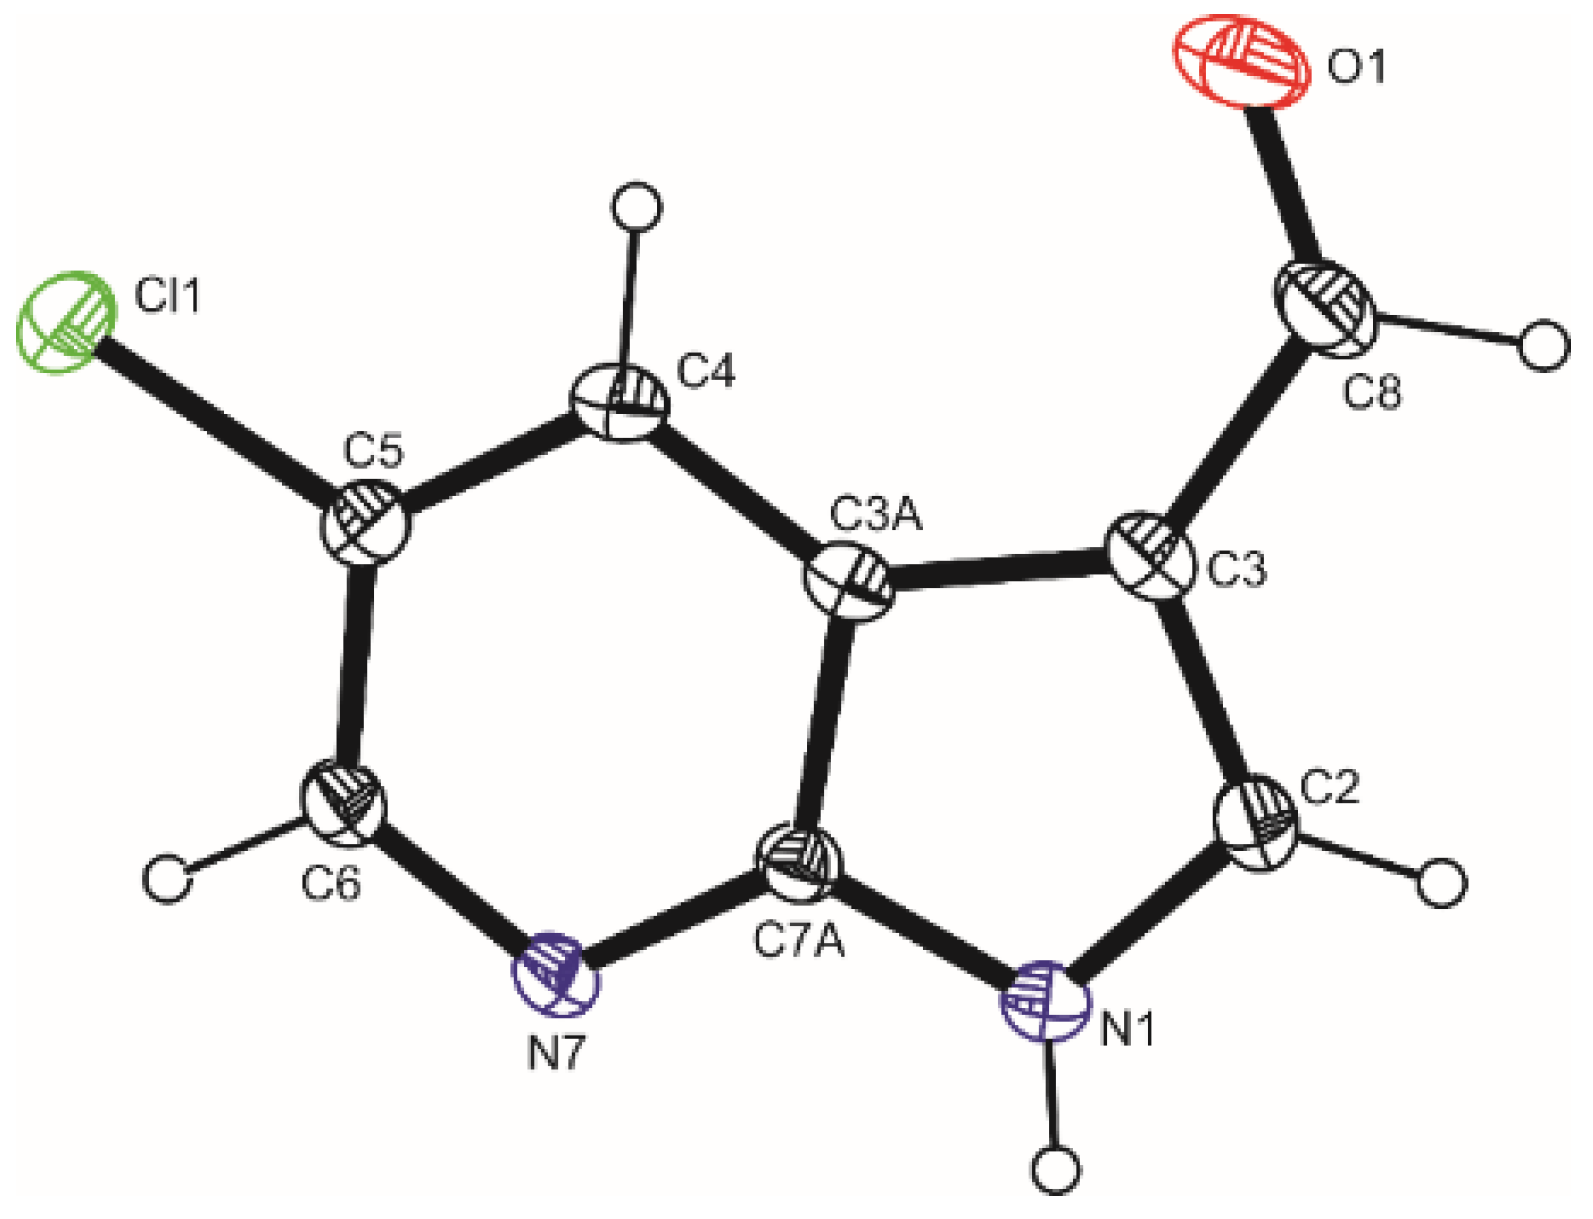
Figure 1. Molecular structure of 5Cl7AICA showing the atom numbering scheme. Displacement ellipsoids are drawn at the 25% probability level and H atoms are shown as small spheres of arbitrary radii.
Crystals 14 00631 g001
Figure 2. A fragment of the crystal lattice of 5Cl7AICA showing intermolecular interactions (turquoise line). Symmetry codes: (′)1 − x, 2 − y, 1 − z; (″) −x, 1 − y, 1 − z; (′′′) −x, 1/2 + y, 3/2 − z; (iv) 1 + x, 3/2 − y, −1/2 + z; (v) −x, −1/2 + y, 3/2 − z; (vi) −1 + x, 3/2 − y, 1/2 + z.
Crystals 14 00631 g002
Figure 3. Hirshfeld surface mapped with dnorm ((a), front and (b), back) and shape index (c). The red regions on the surface indicate distances shorter than the sum of van der Waals radii, white colour represents van der Waals separation, and blue indicates longer contacts.
Crystals 14 00631 g003
Figure 4. The computational models employed in calculations: (a) Dimer 1 of 5Cl7AICA constructed from two trans conformers; (b) Dimer 2 of 5Cl7AICA constructed from two cis conformers; (c) Dimer 1 of 4Cl7AICA constructed from two trans conformers; (d) Dimer 2 of 4Cl7AICA constructed from two cis conformers. The terms trans and cis refer to the relative orientation of the C8=O1 (carbonyl) and C3=C2 (pyrrole) bonds along the exocyclic C3–C8 bond (see Figure 1 for the numbering of atoms). Legend of colors: red—oxygen, blue—nitrogen, green—chlorine, dark gray—carbon, light gray—hydrogen atoms.
Crystals 14 00631 g004
Figure 5. Comparison of the experimental IR spectrum of 5Cl7AICA in the range 3800–50 cm−1 with the corresponding theoretical spectra calculated for dimer 1 of 5Cl7AICA using three DFT methods. Theoretical wavenumbers are scaled, as shown in Section 2.4.
Crystals 14 00631 g005
Figure 6. Comparison of the experimental Raman spectrum of 5Cl7AICA in the range 3800–50 cm−1 with the corresponding theoretical spectra calculated for dimer 1 of 5Cl7AICA using three DFT methods. Theoretical wavenumbers are scaled, as shown in Section 2.4.
Crystals 14 00631 g006
Figure 7. Comparison of the experimental IR spectrum of 4Cl7AICA in the range 3800–50 cm−1 with the corresponding theoretical spectra calculated for dimer 2 of 4Cl7AICA using three DFT methods. Theoretical wavenumbers are scaled, as shown in Section 2.4.
Crystals 14 00631 g007
Figure 8. Comparison of the experimental Raman spectrum of 4Cl7AICA in the range 3800–50 cm−1 with the corresponding theoretical spectra calculated for dimer 2 of 4Cl7AICA using three DFT methods. Theoretical wavenumbers are scaled, as shown in Section 2.4.
Crystals 14 00631 g008
Table 1. Experimental (X-ray) geometrical parameters of intermolecular interactions (distances [Å] and bond angles [°]) in 5Cl7AICA and the corresponding theoretical parameters calculated for the dimer 1 of 5Cl7AICA using three DFT methods with the 6-31++G(d,p) basis sets.
D–HH···AD···AD–H···A
N1–H1∙∙∙N7′, exp.1.024(17)1.880(17)2.8834(14)165.8(13)
N1–H1∙∙∙N7, ωB97X-D1.031.882.908172
N1–H1∙∙∙N7, PBE0-D31.041.842.870172
N1–H1∙∙∙N7, B3LYP-D31.041.872.898172
C2–H2∙∙∙O1′′′ exp.1.087(12)2.554(12)3.5285(17)148.8(9)
C6–H6∙∙∙C8iv exp.1.081(13)2.752(14)3.8051(19)164.7(10)
C4–H4∙∙∙Cl1″ exp.1.080(11)2.789(12)3.8317(13)162.2(10)
Corresponding symmetry codes are given in Figure 2.
Disclaimer/Publisher’s Note: The statements, opinions and data contained in all publications are solely those of the individual author(s) and contributor(s) and not of MDPI and/or the editor(s). MDPI and/or the editor(s) disclaim responsibility for any injury to people or property resulting from any ideas, methods, instructions or products referred to in the content.