Article

Visible-Light Spectroscopy and Rock Magnetic Analyses of Iron Oxides in Mixed-Mineral Assemblages

by
Christopher J. Lepre
*,
Owen M. Yazzie
and
Benjamin R. Klaus
School of Earth, Environment and Society, Bowling Green State University, Bowling Green, OH 43403, USA
*
Author to whom correspondence should be addressed.
Crystals 2024, 14(7), 644; https://doi.org/10.3390/cryst14070644 (registering DOI)
Submission received: 31 May 2024 / Revised: 21 June 2024 / Accepted: 24 June 2024 / Published: 13 July 2024
(This article belongs to the Special Issue Metal Oxides: Crystal Structure, Synthesis and Characterization)

Abstract

:
Iron oxide assemblages are central to many pursuits, ranging from Mars exploration to environmental remediation. Oxides and oxyhydroxides of iron both carry the special properties of color and magnetism. In this paper, we use visible-light spectroscopy and rock magnetic data collected at varying temperatures (~77–973 K) to analyze the concentrations and identities of iron oxides found in natural hematite-dominated samples that were obtained from a scientific drill core of Late Triassic red beds in the American Southwest. Our results suggest that hematite colorization of Earth materials varies from red to blue/purple as crystal size increases. Second-derivative analysis of the collected visible-light spectra allows this variation to be measured through the characteristic wavelength band position. Magnetic coercivity data indicate “hardness” differences that also may suggest smaller grain sizes are associated with redder colors. Yellowish maghemite and goethite have overlapping characteristic wavelength band positions that make it challenging to distinguish their contributions to mixed assemblages from visible-light data alone. Remanent magnetizations acquired at ~77 K and room temperature suggest the presence of hematite and a low-coercivity phase that may be maghemite and/or oxidized magnetite. However, we interpret this phase as maghemite in order to explain the changes in iron oxide concentrations indicated by visible-light intensities near ~425 nm and because the thermal demagnetization data suggest that goethite is absent from the samples. Future research that increases the resolution of hematite, maghemite, and goethite detection in experimental and natural samples will provide opportunities to refine the study of past climates and constrain soil iron availability under future changes in global moisture and temperature. Multimethod datasets improve understanding of environmental conditions that cause iron oxides assemblages to shift in phase dominance, grain size, and crystallinity.

1. Introduction

Iron oxides are commonly involved with geological, geophysical, and environmental research on Earth and Mars [1,2,3]. Current study of these minerals includes the roles that crystallinity and size play in bonding with geogenic and organic compounds [4,5,6,7,8,9]. This reveals information important for understanding the dispersal of contaminants in terrestrial ecosystems, carbon sequestration, and soil micronutrient availability [10,11,12,13,14,15,16]. Of the iron oxides, the oxyhydroxide phases are the better suited for these purposes [17,18]. The incorporation of OH into the mineral structure increases the surface area and reactivity sites of the crystal. Amorphous, poorly crystalline ferrihydrite (Fe5HO8·4H2O) [19] is efficient at bonding with a wide range of materials, including clay compounds, nitrogen and phosphorous, and critical minerals [7,8,20]. However, goethite (α-FeOOH) is the most common iron oxyhydroxide in terrestrial environments and favors cool humid climates [21]. Other iron oxyhydroxides exist as less stable phases and form in extreme environments [22,23,24,25].
A widespread application of studying iron oxides is interpreting paleoclimate sequences. This is important for understanding the context of terrestrial Earth system processes and assessing potential changes in the global climate [2]. Surveys of modern soils suggests that iron nutrients may be limited under increasing future temperatures [13]. Research on the iron oxide assemblages of paleosols that formed under a range of paleoclimates helps to constrain the variation in soil Fe availability affected by temperature, moisture, and redox conditions [26].
Detecting iron oxide minerals and identifying their concentrations is achieved by using magnetism, diffuse reflectance spectroscopy, electron microscopy, X-ray diffraction (XRD), and mass spectrometry [27,28,29,30,31,32,33,34,35,36]. Success is reached with each method but limited by how well the micro/nanoparticle populations are represented by the measured sample [37,38]. Similarly, extractive studies of iron oxide concentrations are generally uncertain of how well the isolated material is representative of the distribution present in the sample [39,40,41]. These are important considerations because the iron oxide phases and different properties of the phases vary according to grain size, and the distribution of iron oxides in most natural mixed mineral assemblages has a range of grain sizes [26,42,43,44,45,46,47].
Current studies are focused upon improving the magnetic and visible-light methods used to observe the inception of iron oxide assemblages in natural settings, assess crystal distributions, and monitor the timing of development [48,49,50,51]. This is challenging because many of the iron oxides have nonunique or overlapping properties. Larger and smaller grains of the same phase have different crystalline shapes that cause mineral properties to vary. Maghemite (γ-Fe2O3) possesses ferrimagnetic magnetism like magnetite (Fe2O3), yet chemically it is like antiferromagnetic hematite (α-Fe2O3). Goethite also carries antiferromagnetism but has visible-light properties in common with maghemite. Because of the similar characteristics, estimating the concentration of iron oxide minerals in rock, sediment, or soil through a single parameter is prone to error. This is further complicated by ongoing oxidization that shifts the iron oxide composition of assemblages [52]. The timeframe of the progressive shifts is not well constrained [53] yet the intermediary steps that may be involved have been observed under extreme temperatures [54]. The ongoing transformations lead to an eventual build-up of hematite that dominates the visible-light color spectra of mixed mineral assemblages [48,55,56]. This is exemplified by the vivid hues of red beds (Figure 1) that primarily consist of silicate grains coated by subordinate fine-grained hematite [39,57,58,59,60,61,62]. Hematite represents a small fraction of the concentration relative to the whole rock sample mass. Determining how red beds acquire color is an ongoing pursuit [63,64]; however, the timeframe for hematite to assume control of the rock’s pigment is constrained by orbital climate timescales (e.g., 100–20 kyr) [65,66]. Discreet reddened soil horizons develop over shorter timeframes, probably on the order of 100–1000 years (Figure 1). Different environmental pathways have been proposed to explain the progressive hematization of rock, soil, and sediment [67,68,69,70,71,72]. However, most studies agree that the hematite in Earth’s surface environments commonly originates through the solid-state transformation and dehydration of percussor minerals rather than directly out of solution from ions [73,74].
In this study, we use a combination of visible-light spectroscopy and rock magnetism to measure the iron oxides that contribute to mixed mineral assemblages. Examined samples are from Late Triassic red bed obtained from a scientific drill core of the Chinle Formation, Arizona [75]. Red bed samples such as these provide an opportunity to test the efficacy of different methods on iron oxide assemblages with a limited variety of phases that include a predominance of hematite, sparse goethite, and some ferrimagnetic phases [76,77]. Much of our current understanding of the Fe oxides found in sediment and soils derives from the study of the Chinese Loess Plateau sequences that began to form near the onset of the Quaternary Period some 2.6 million years ago [55,78,79]. The loess deposits and associated soils have been analyzed with magnetic parameters (e.g., magnetic susceptibility) and visible-light spectroscopy to interpret the origin of hematite, goethite, maghemite, and magnetite. In contrast, there has been less research that combines magnetic and visible-light methods to study Fe oxide assemblages formed in “deep time,” such as in the Late Triassic. To our knowledge, the research presented in this paper is one of, if not the only attempt to combine visible-light spectroscopy and rock magnetism to analyze Mesozoic red beds. As the Late Triassic is one of the few periods of Earth’s geologic history when the hematite-bearing red beds formed, further research on these units may elucidate controls on Fe oxide origins in natural systems and be instructive for understanding geologically younger/future cases.
From observations on the collected data in this study, we discuss: (1) the relationships between hematite crystals and color and how the resolution of measuring hematite with visible-light spectra is affected by the algorithms used to parameterize the data; (2) the nonunique identification of maghemite and goethite. These discussions provide the basis for a conceptual model for measuring enhanced iron oxide productivity in soils that are active in warm and wet climates. Multimethod datasets improve understanding of environmental conditions that cause iron oxide assemblages to shift in phase dominance, grain size, and crystallinity.

2. Materials and Methods

Visible-light spectra of the iron oxides were collected using diffuse reflectance spectroscopy (DRS). DRS measurements were made with a Varian Cary 60 spectrophotometer fiber-optically coupled to a sensor that was housed within an integrating sphere [80]. The sensor was placed directly onto sample surfaces and the built-in camera was used to monitor for alteration spots. Percent reflectance (%R) was derived for 200–800 nm. %R data were collected at a scan rate of 60 nm/min, at every 0.5 nm, and normalized to a Spectralon standard. Normalized data were smoothed before transforming the reflectance with the Kubelka–Munk (KM) remission function [81]. The second-derivative curve was derived from the KM output to interpret the characteristic wavelength band positions of the iron oxides [82].
Demagnetization of isothermal remanent magnetization (IRM) through progressive backfield acquisition was also used to study the samples. This involved first imparting a 2.5 T field along the −Z axis of the sample and then a progressive IRM along the +Z axis up to a terminal step of 2.5 T at increments ranging from 20 to 250 mT. Different components of the progressively acquired IRM data were analyzed by using unmixing algorithms [83,84].
Further study of the IRM components was performed by thermal demagnetization of the composite IRM that is imparted to samples at orthogonal axes [85]. This method uses different field strengths (e.g., 300 mT and 2.5 T) that are selected to identify low-coercivity ferrimagnetic phases like magnetite and maghemite and high-coercivity antiferromagnetic goethite and hematite. Unblocking steps used increments of 25–100 °C.
Low-temperature, progressive IRM experiments were used to assess the coercivity distribution, magnetic grain sizes, and iron oxide identities of a sample [37]. To study the low-temperature properties, the experiment was performed on three sister specimens of the same sample. One specimen was given a progressive IRM at room temperature. After each IRM step, the remanent magnetization was measured at room temperature. The second specimen was given a progressive IRM at room temperature. After each IRM step, the specimen was cooled with liquid nitrogen (77 K) for 5 min and then the remanent magnetization was measured. For the third specimen, each IRM step and remanence measurement was performed after cooling for 5 min at 77 K. All three were repeated up to a maximum field of 1 T using incremental field strengths of 50, 100, 200, 300, 500, and 750 mT.

3. Results and Discussion

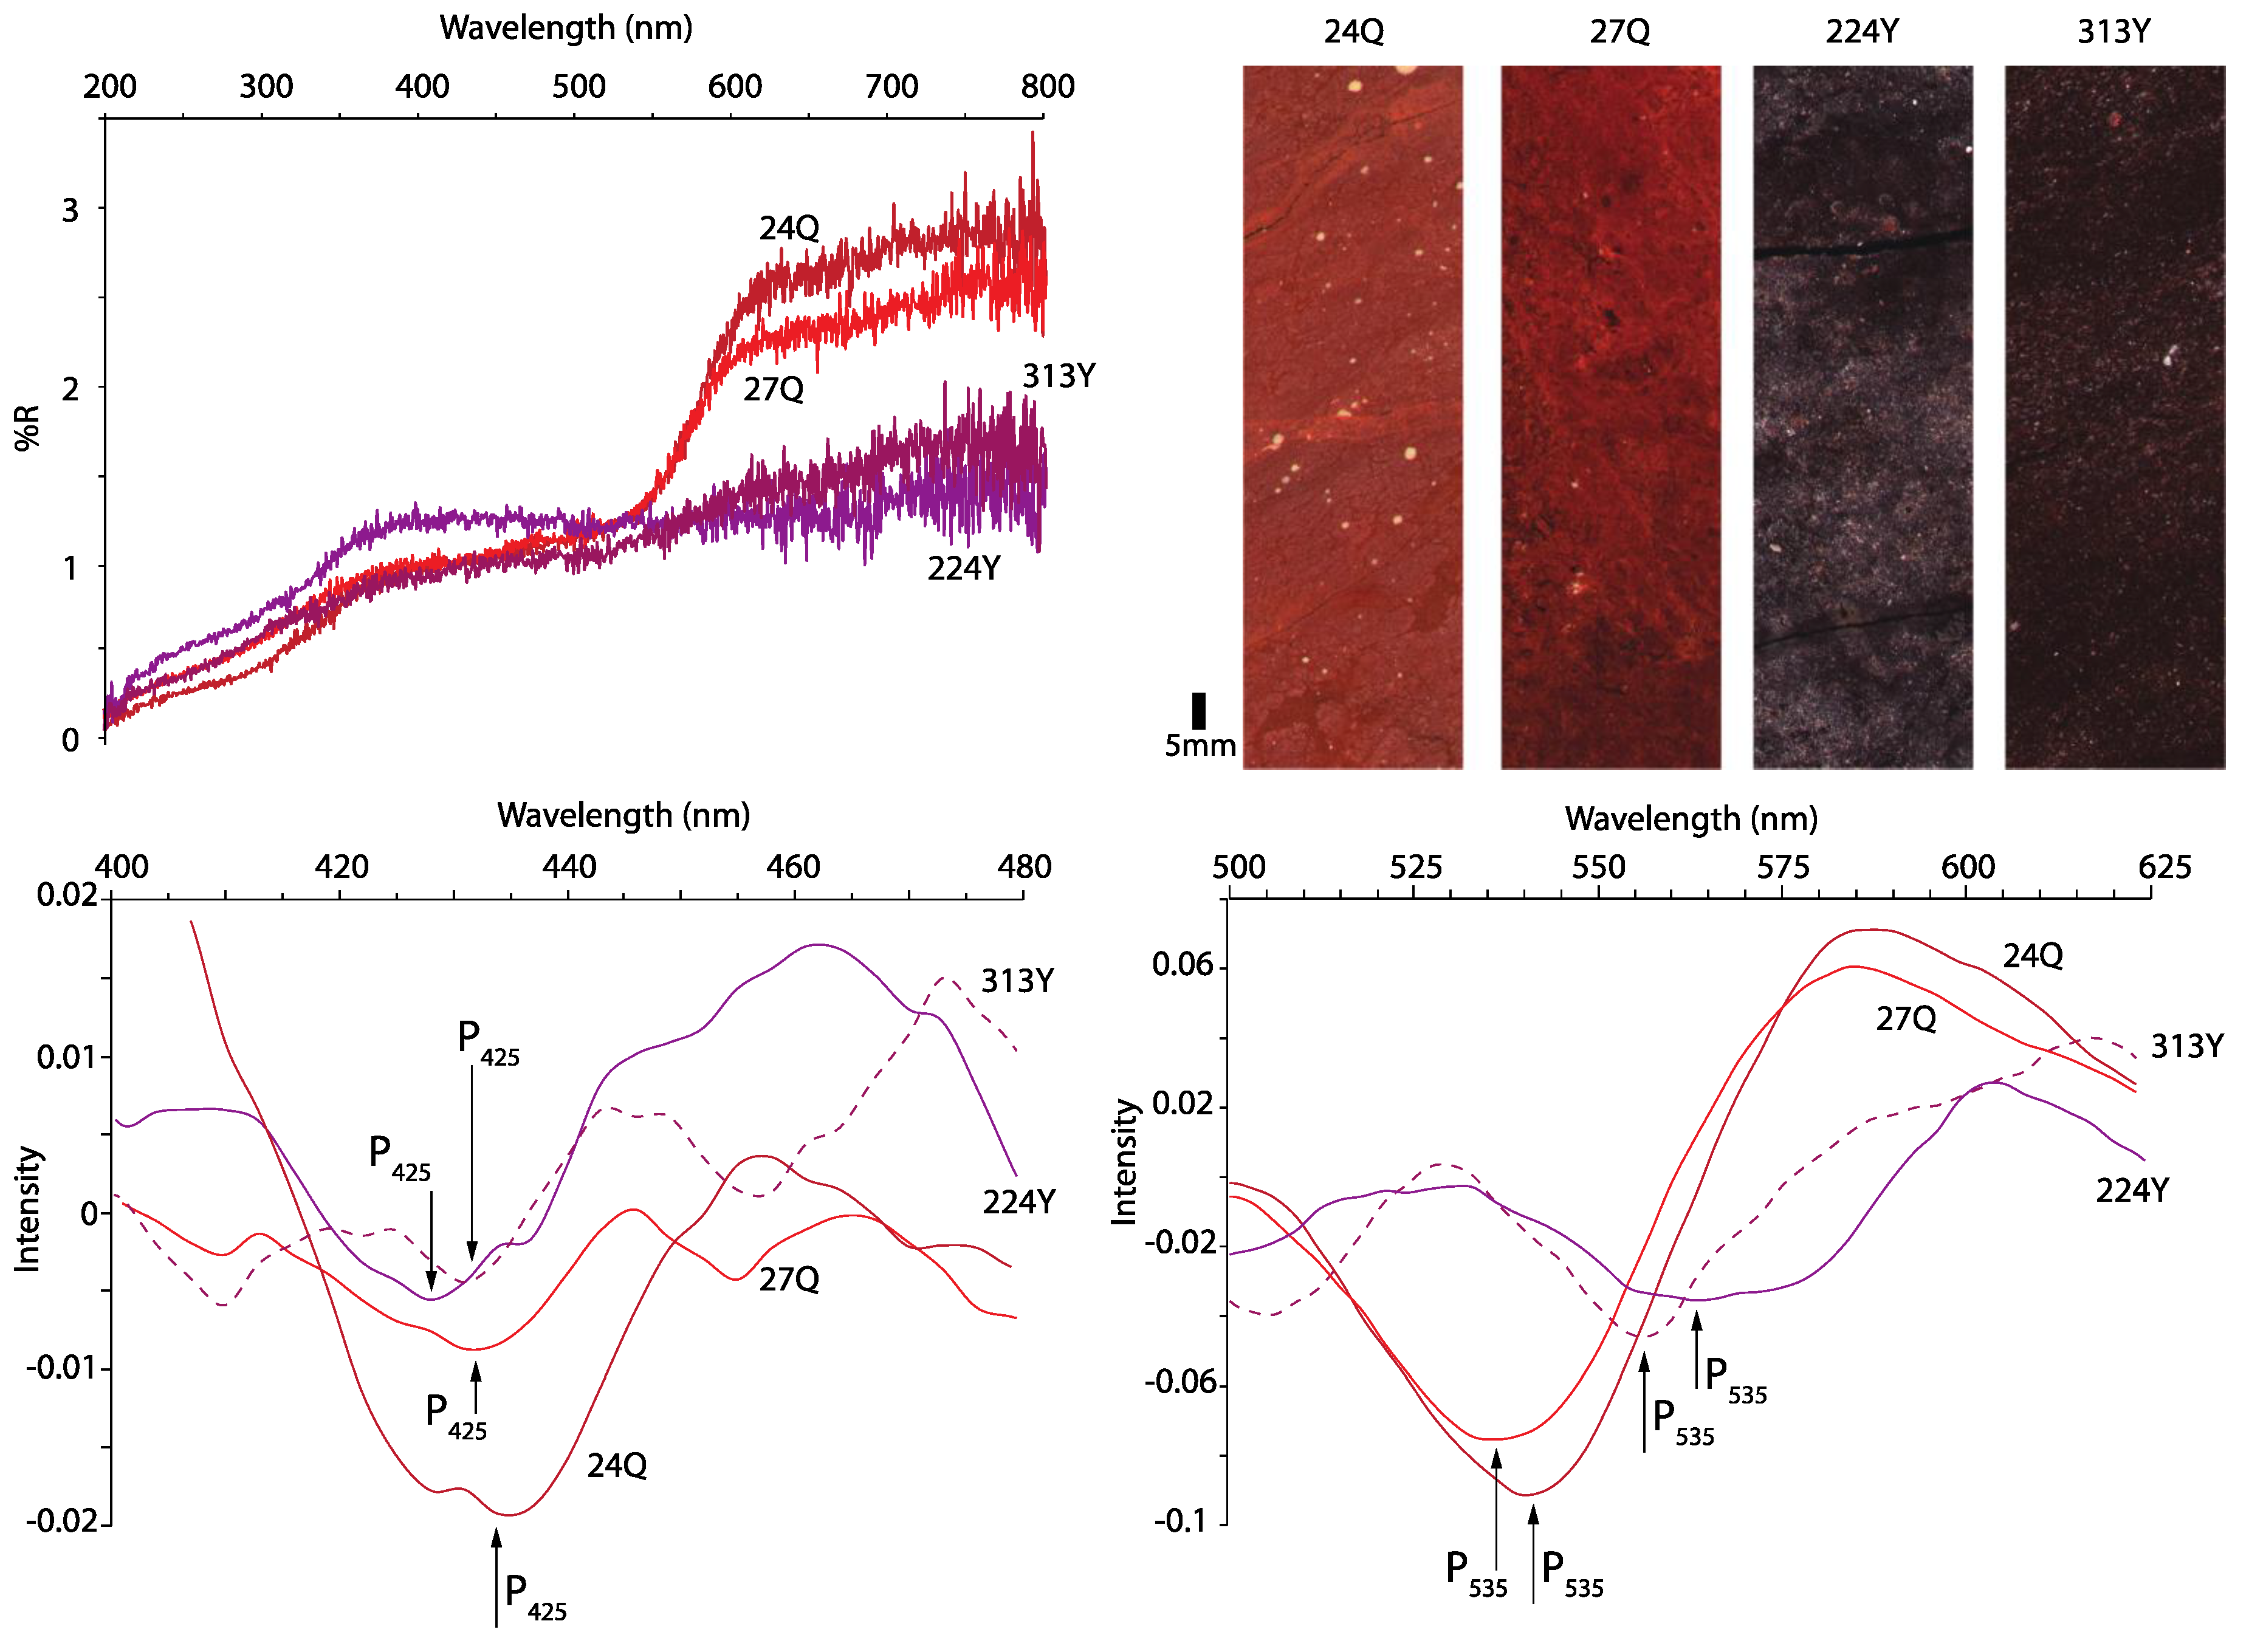
3.1. Characteristic Wavelength Band Position of Hematite

DRS data collected between ~535 and ~580 nm indicate the presence of hematite within the Chinle samples (Figure 2). The characteristic wavelength band position of hematite is at 535 nm (P535) [3,82]. This is a position of convenience [86] because the complimentary color of red is green, which has a median wavelength close to 535 nm. Semi-quantification of hematite concentration is interpreted from the intensity at 535 nm (I535), which is the amplitude of the minimum to the next associated maximum at a longer wavelength between ~535 and ~580 nm [1,82]. The concentrations of hematite in the red Chinle samples are greater compared to the blue-colored samples (Figure 2). Blue samples also demonstrate P535 shifts to longer wavelengths within the characteristic range 535–580 nm (Figure 2). This is accompanied by a decrease in optical absorption below 500 nm noted for synthetic purple samples [87].
At 535–580 nm, hematite is distinct from all other iron oxides because its characteristic colors derive from the magnetic spin coupling of the Fe ions within the octahedral structure [88,89]. When one of the coupled atoms experiences electron excitations, so does the other, doubling the energy associated with the visible-light range of the electromagnetic spectrum. This is referred to as the electron pair transition (EPT). Hematite, goethite, and maghemite all have EPT energies, but hematite intensity is unique because of the stronger magnetic coupling related to Fe3+ and O bonds at octahedral sites [89,90]. Fe3+ is bonded to OH in goethite [91], and maghemite crystals include tetrahedral and octahedral structures [92]. Single election transitions at shorter wavelength bands (~415–445 nm) are used to characterize yellowish maghemite and goethite [82].
Figure 2. Representative Chinle samples and their visible-light spectra collected with diffuse reflectance spectroscopy (see methods). Upper left: Percentage reflectance of samples 24Q, 27Q, 224Y, and 313Y. Upper right: Photographs of samples from the scientific core of the Chinle Formation. Unprocessed image files are available in a publicly available database [93]. Images are free use to the public courtesy of the Colorado Plateau Coring Project [75]. Lower left: P425 position for goethite/maghemite of the four samples. Lower right: P535 position for hematite of the four samples.
Crystals 14 00644 g002
Crystal shape (e.g., platy/acicular) and size control iron oxide color [88,94]. Smaller hematite crystals have color in comparison to opacity and grayness of larger specular hematite because the increased surface area relative to grain diameter at smaller sizes generates more refraction/incident surfaces. This is readily observed by abrading specular hematite on a scratch plate to produce a red streak. Red hematite crystals shift to blue as grain-size diameter increases from ~0.1–1.0 µm [24]. Larger crystals, greater than 1.5 µm, appear purple [95]. Torrent and Barrón [96] studied the relationship between hematite EPT position, hue, and specific surface area that approximates grain size (Figure 3). These analyses suggest that larger hematite particles are blue with longer EPT wavelengths, and shorter EPT values are associated with smaller red particles. Lepre and Olsen [64] analyzed ~350 m of the Chinle core to correlate second-derivative wavelengths to rock hues. It was demonstrated that as Chinle hematite concentrations increased, EPT positions occurred at shorter wavelengths, and colors reddened under increasing paleo-aridity.
First-derivative EPT positions shift towards longer wavelengths as hematite concentrations increase [97]. This appears to be a by-product of the calculus used to solve the first-derivative algorithm [1,86]. As discussed above, the second-derivative EPT position is informative concerning color changes, crystallinity/size, and environmental conditions. Part of the difference between the first- and second-derivative is the use of the Kubelka–Munk remission function [81]. The Kubelka–Munk remission function parameterizes layer thickness to determine reflectance properties [98]. Hematite layering effects [60] that are exacerbated by higher hematite concentrations may add to shifts in the first-derivative EPT position. Second-derivative EPT positions are not as affected by changes in hematite concentration [86,99]. However, first-derivative analyses provide stronger resolution for detecting low concentrations of hematite as compared to traditional XRD methods [100]. Although XRD is the most direct and effective method for identifying crystalline structures of minerals, iron oxides frequently occur at low concentrations (<1% by weight) in soils and sediment, below the detection limit of XRD (1–2%) for fine Fe oxide particles in bulk samples [3,97]. This is important for the analysis of marine sediment cores with subordinate fractions of terrigenous material or studies in humid environments that limit hematite formation [101,102]. Second-derivative analysis is well suited for detecting low concentrations of hematite in mixed mineral assemblages that are affected by the hue/shade of background matrix [1,30,31].

3.2. Goethite and Maghemite Discrimination

In the Chinle samples, second-derivative DRS data between 400 and 500 nm may indicate the presence of maghemite or goethite (Figure 2). However, the EPT and single electron transition of many of yellowish iron oxides overlap, posing problems for their unique visible-light detection [70,103]. Detailed second-derivative DRS studies of mono-mineral samples have low success rates (20–30%) for correct goethite and maghemite discrimination [82]. The P425 conventionally used to interpret the characteristic wavelength position for the single electron transition is also conventionally used for goethite [99,104,105]. Chinle samples demonstrate second-derivative minima near the single electron position of P425 (Figure 2). Blue samples have minima near 425–430 nm; the P425 of red samples are located at ~430–435 nm. I425 intensities of blue and red samples are not dissimilar (Figure 2).
The addition of a rock magnetic dataset may help to resolve the presence of antiferromagnetic goethite and ferrimagnetic maghemite [106,107] within the Chinle samples. IRM demagnetization provides information on the coercivity of remanence for magnetic phases [47]. Coercivity of remanence is functionally defined by the field strength required to reduce the IRM to zero. High-field remanent coercivities distinguish antiferromagnetic hematite minerals from low-coercivity maghemite. Similarly, goethite has a remanent coercivity greater than 2.5 T, whereas maghemite’s is <~50 mT [107]. Hematite in Chinle samples is indicated by the remanent coercivities resolved by the backfield IRM. A low-coercivity component in the Chinle samples is suggested by the rapid uptake pattern that is resolved by steps in the acquisition range of 0–300 mT (Figure 4). By 300–400 mT, the acquisition curve shows an emergent flattening that may signal the saturation for a ferrimagnetic phase. However, this emergent trend is replaced by the magnetically hard component that dominants the remainder of the IRM pattern up to the terminal step of 2.5 T. Saturation magnetization is not achieved in any of the samples by 2.5 T (Figure 4 and Figure 5), suggesting the presence of hematite or goethite in the hard component. IRM unmixing algorithms suggest at least one low-coercivity and two high-coercivity components contribute to the composite IRM (Figure 6). The overlap in coercivity ranges for the iron oxides requires additional data to interpret natural samples where more than one ferromagnetic mineral is present [47].
Thermal demagnetization is widely used in geology and geophysical studies to recognize properties associated with the Curie and Néel temperatures of iron oxides [85]. Goethite has an IRM unblocking temperature of ~120 °C [108]. If samples contain remanence-bearing goethite, then an IRM decrease is expected within the thermal demagnetization range of 100–200 °C for the hard component administered at 2.5 T. However, this is not the case (Figure 7). For the Chinle samples, thermal demagnetization of the hard IRM (2.5 T) within the range of 0–200 °C resolves a gradual linear decay of remanence that is accompanied by small changes in intensity. The 2.5 T IRM is reduced to nearly zero by the terminal step of 700 °C (Figure 7), indicating the predominance of hematite throughout the thermal demagnetization of the high-coercivity component. In sample 21Q, the low-coercivity component (300 mT) suggests a magnetic mineral that retains remanence above the ~575 °C Curie temperature of magnetite (Figure 7). This may be maghemite with a maximum unblocking temperature > 600 °C [109]. Gehrig and colleagues [110] suggest a Curie temperature of about 620 °C for maghemite and that it oxidizes to hematite at higher experimental temperatures. Potential Chinle samples that contain maghemite (e.g., 21Q in Figure 7) show uniformly distributed unblocking of the low-coercivity component to ~575 °C, followed by a demagnetization plateau at 575–600 °C and then a large drop in remanence at 625 °C. After 625 °C, the remanence demagnetization pattern is reduced to nearly zero by the terminal 675 °C step. However, it may be difficult to distinguish between maghemite and magnetite that has oxidized through weathering in the outcrop [111]. Other complications with identifying maghemite are introduced by the range of coercivity distributions exhibited by hematite. Hematite and goethite coercivity are “softened” by isomorphous cation substitutions [104,112,113], particularly in environments where Al is in greater concentration than average crustal values [99]. Such concerns may not apply to Chinle samples because they were obtained from a scientific drill core, and XRF measurements suggest Al concentrations < 8% [64,114]. However, perhaps of greater influence on the Chinle IRM data are the coercivity distributions < 300 mT carried by natural hematite populations [38]. Although the magnetic components in natural assemblages have continuous coercivity distributions, first-order separation between the hematite coercivity variation is observed from thermal unblocking patterns of remanent magnetizations [40,115,116]. Low-coercivity (300 mT) components for some Chinle samples (e.g., sample 244Q in Figure 7) display “distributed” thermal unblocking patterns, characterized by a gradual loss of IRM from room temperature to the Néel temperature of hematite at ~675 °C. Distributed thermal unblocking patterns are associated with colorful hematite populations [115,116].
Remanence-bearing particles only represent a fraction of the iron oxide particles in natural populations [26]. Natural hematite samples have abundant superparamagnetic (SP) particles that are too fine under typical Earth surface conditions to record remanent magnetizations [38]. As iron oxides become smaller, the crystals undergo a change to their magnetic ordering that affects remanence acquisition [117]. Small particles (≤~30 nm) lack stable remanent magnetizations and are thought to possess SP properties [42,118]. From ~0.03 to ~1 μm, particles are characterized by single-domain magnetic properties. Grain sizes larger than about 1 μm mostly have multidomain magnetic properties. Hematite has a wide grain size distribution for the remanence-bearing single domain particles [119]. The wide size range for single domain behavior in hematite means that natural hematite is expected to be dominantly in the single domain state [3]. DRS hematite concentrations have generally linear, yet highly variable and poor, relationships with magnetic parameters [1,48] that suggest contributions from non-remanence-bearing phases.
The magnetic ordering of SP particles is blocked at low-temperatures [37]. This allows small grains < ~30 nm to acquire a temporary remanence. SP goethite spontaneously acquires a remanent magnetization at low temperature [120]. The remanence of Chinle specimens cooled with liquid nitrogen is not very different from the remanence measured at room temperature (Figure 8). If goethite is present in significant quantities, then we expect large increases in the sample remanence from spontaneous magnetizations activated from SP grain subjected to low temperature [108]. The marginal difference between the room temperature and liquid nitrogen remanences may not be meaningful because the experiment was carried out with specimens split from the same sample rather than just the sample itself [37]. However, the biggest remanence difference is observed for the IRM that is acquired after cooled with liquid nitrogen (Figure 8). This IRM increase may indicate the activation of SP particles of ferrimagnetic maghemite. A large increase in magnetization occurs at the initial step of 50 mT (Figure 8). Rapid uptake of the applied field is apparent from 50 to 300 mT. IRM acquisition from 50–300 mT resembles the acquisition patterns expected for ferrimagnetic phases. After 300 mT, the IRM uptake fails to completely saturate by the terminal step of 1000 mT, which suggests an iron oxide with high coercivity. This high-coercivity phase probably is not goethite because the room temperature and cooled comparison suggested few if any spontaneous magnetizations of SP grains. At low liquid nitrogen temperature, hematite undergoes the Morin magnetic phase transition that inhibits remanence acquisition. However, the transition disappears entirely from hematite particles smaller than 20 nm [121]. The failed saturation by 1000 mT may suggest the presence of ultrafine SP hematite.

3.3. Combining Magnetic and DRS Methods to Analyze Paleoclimate

The study of paleoclimate change is a common application of iron oxide data [50,64,80,122,123,124]. Iron oxide records from terrestrial and marine geological sequences help to interpret changes in paleoclimate at various timescales [102,125]. One of the most important natural experimental theaters to study Quaternary paleoclimate changes is the Chinese Loess Plateau. The loess and paleosol sequences provide insights on the long-term evolution of the East Asian monsoon, which is a major component of the global climate system [126]. Research on the Chinese Loess Plateau has helped to develop and refine the methods used to measure iron oxides in soils/paleosols [55,78,79]. Two of the more important loess–paleosol intervals that have been examined using a combination of DRS and magnetic methods [31,127] cover the last interglacial period (~100 ka) and the mid-Brunhes climate transition (~400 ka). These events have implications for assessing the potential impacts of global climate change on contemporary and past human societies [128,129].
A key learning outcome from the study of the Chinese Loess Plateau is that warm/wet climate epochs enhance the pedogenic formation of iron oxides [26]. Such climates accelerate the chemical weathering reactions of soil clay minerals and silicates that release the Fe ions necessary for iron oxide formation [130,131]. Pedogenic activity under these conditions generates high concentrations of fine-grained iron oxide phases. The size difference helps distinguish pedogenic minerals from the larger detrital iron oxide grains [42,118]. Many of the pedogenic grains are within the SP size range and thus cannot acquire a remanent magnetization [132]. Much of hematite color is thought to be carried by ultrafine nanoparticles that are too small to acquire a remanent magnetization [38,39].
The increase in iron oxides under warm/wet conditions manifests in the paleosol data as significant increases in magnetic susceptibility [133]. Ferrimagnetic minerals dominate the contribution to magnetic susceptibility because they are an order of magnitude more magnetic than antiferromagnetic minerals. Conventional magnetic susceptibility data cannot discriminate between the contribution of ferrimagnetic magnetite or maghemite to the paleosol assemblage [45]. However, pure maghemite is rare in terrestrial environments and often occurs as an oxidation product of magnetite [110,111,134]. Changes in maghemite concentrations may go undetected by magnetic susceptibility measurements because of its limited presence within magnetite-dominated paleosols [53]. Similarly, the hard IRM (HIRM) ratio method designed for antiferromagnetic minerals may struggle to separate the contributions of goethite or hematite in a paleosol assemblage [113]. Many studies measure paleosol goethite at the I425 wavelength position of second-derivative DRS spectra [127,135,136] or as part of DRS ratio analyses meant to minimize soil matrix effects [30,31]. However, maghemite and goethite are not easily distinguished using DRS methods. DRS experimental results [82] suggest that maghemite may account for as much as 70% of the variability in the mass concentration records perceived to be indicative of goethite.
DRS data suggest that goethite concentrations may have decreased as hematite increased during the warm/wet climates of the previous interglacial and mid-Brunhes event [31,127]. The DRS decrease in goethite may be associated with an HIRM decrease that indicates the amount of goethite transformed to colorful hematite [127]. However, when iron oxides undergo phase transitions they inherit the particle size/shapes of their precursors [88]. Large HIRM-bearing goethite grains are unlikely progenitors of the smaller pedogenic hematite grains that carry color. Colorful hematite originates and increases in concentration as a result of transformation from ultrafine precursor particles of maghemite [52]. The HIRM decrease may be unrelated to goethite, but caused by the soil decreasing the production of HIRM-bearing hematite and generating more of the ultrafine colorful hematite that cannot carry remanence. Decreased production of the larger remanence-bearing grains may be associated with increased color intensity of soils that are formed under a higher relative humidity climate [48,137]. As hematite production modes shift, the depletion of ultrafine maghemite particles may register as decreasing DRS concentrations at the I425 characteristic position shared with goethite. Instead of goethite, the DRS data can indicate the loss of maghemite as it converts to hematite during the warm/wet climate (Figure 9).

4. Conclusions

Integrating rock magnetic and visible-light methods has many analytical strengths and poses some challenges for measuring complex assemblages of iron oxides. Some of these have been highlighted by the empirical data and the discussion of the literature presented in this paper. We purposefully studied a natural hematite-dominated sample set of Late Triassic red beds [75] to demonstrate that even in mixed mineral assemblages with low variability in iron oxide composition, attempting to identify a mineral phase using one method alone may be problematic. On these samples, we made visible-light spectral measurements that indicated that the characteristic wavelength band of hematite becomes longer (from ~535 to 555–565 nm) as hematite color changes from red to blue/purple. Shorter wavelengths and thus redder colors are inferred to represent smaller grain sizes. The difference in grain size and color may be associated with a ~25% increase in hematite coercivity (~750 to 1000 mT) that suggests an increase in the concentration of smaller grains with diameters that are nearly 0.1 µm. We also show how goethite detection with visible-light data is unsupported by thermal demagnetization data and low-temperature (~77 K) experiments; therefore, a better interpretation of changes in the wavelength band near 425 nm may be maghemite. The major conclusions of the research can be summarized as followed:
o
First-derivative analysis introduces shifts in the characteristic wavelength band position that are related to the math of the algorithm. This first-derivative measurement bias may be exacerbated by the layering of mineral aggregates that are produced by high concentrations of hematite. The Kubelka–Munk remission function, which is a data pretreatment step for second-derivative analysis, parameterizes the layering effects before the visible-light data are transformed by second-derivative analysis. This provides second-derivative analysis of visible-light spectra with more resolution for understanding hematite concentration and crystal size by increasing the detection sensitivity to natural shifts (<30 nm) in the characteristic wavelength band positions that are associated with hematite colors.
o
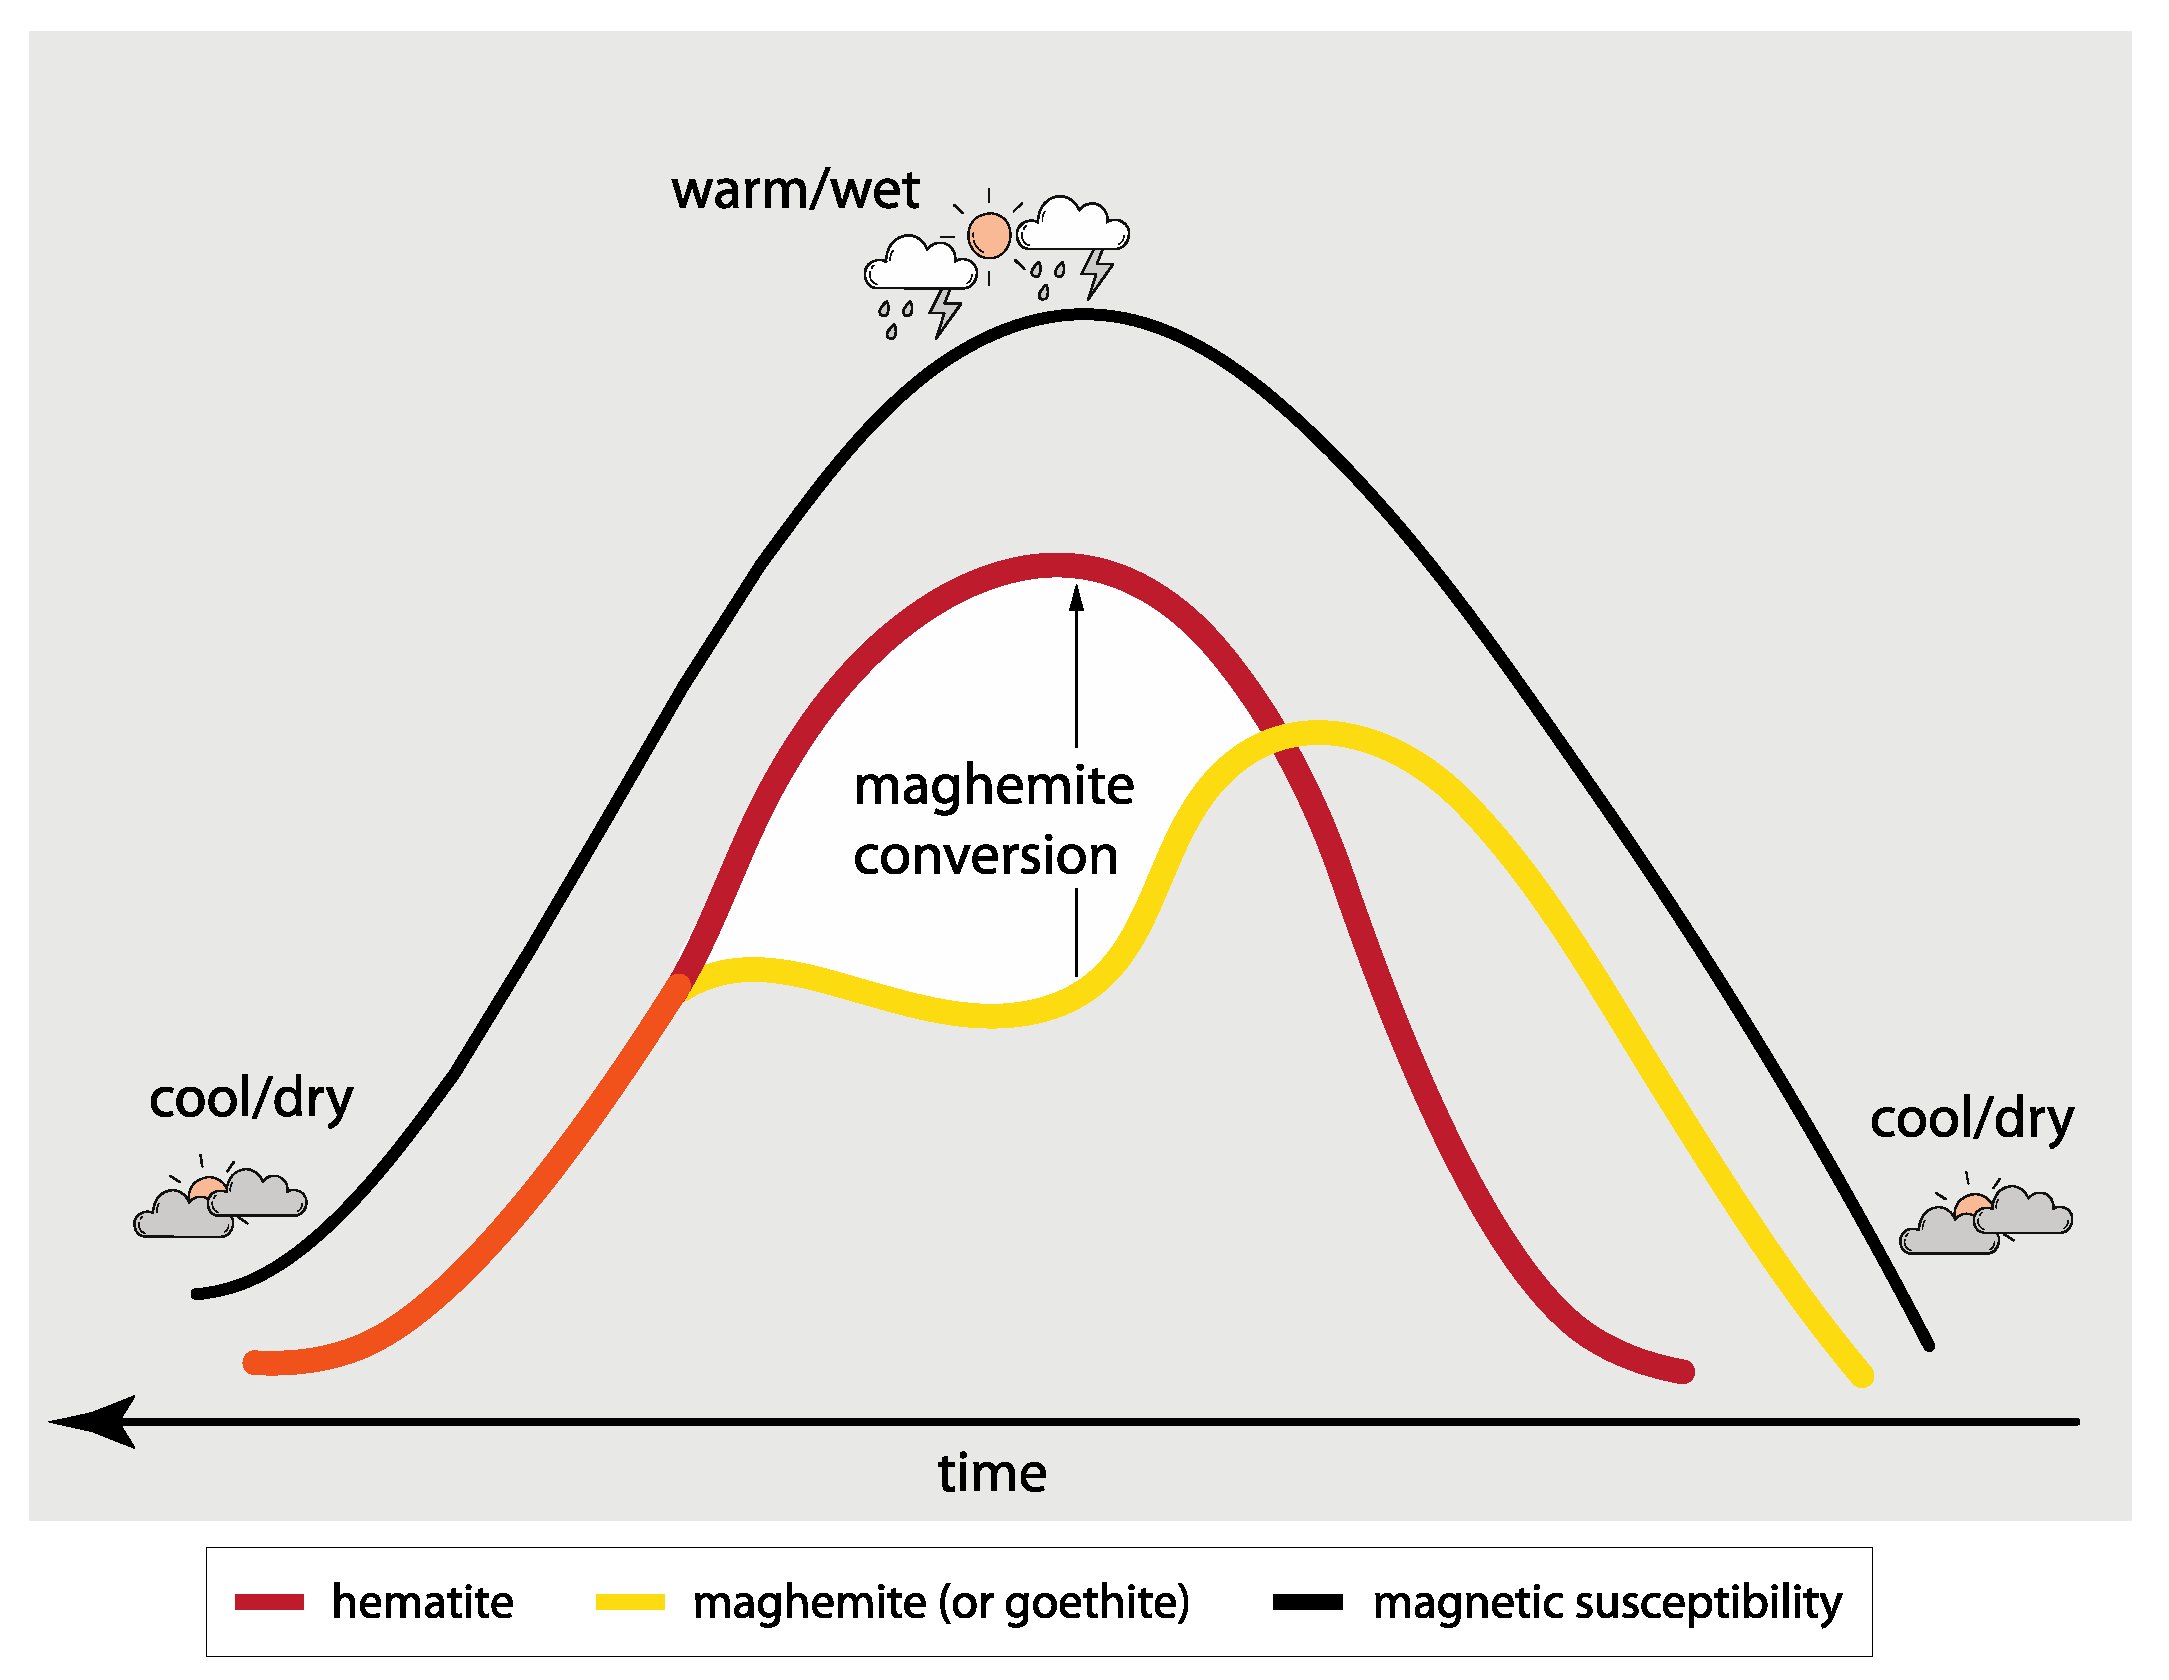
Previous studies using visible-light data have provided examples of hematite concentration increasing under warm/wet climates. The increase in the colorful hematite is probably derived from the transformation of maghemite, and as more colorful hematite is generated, the amount of maghemite is depleted. This may be recorded by visible-light spectra as decreasing intensity at the I425 characteristic wavelength position that maghemite shares with goethite. Perceived changes in colorful goethite may be due to the loss of maghemite as it converts to hematite under warm/wet climates.
o
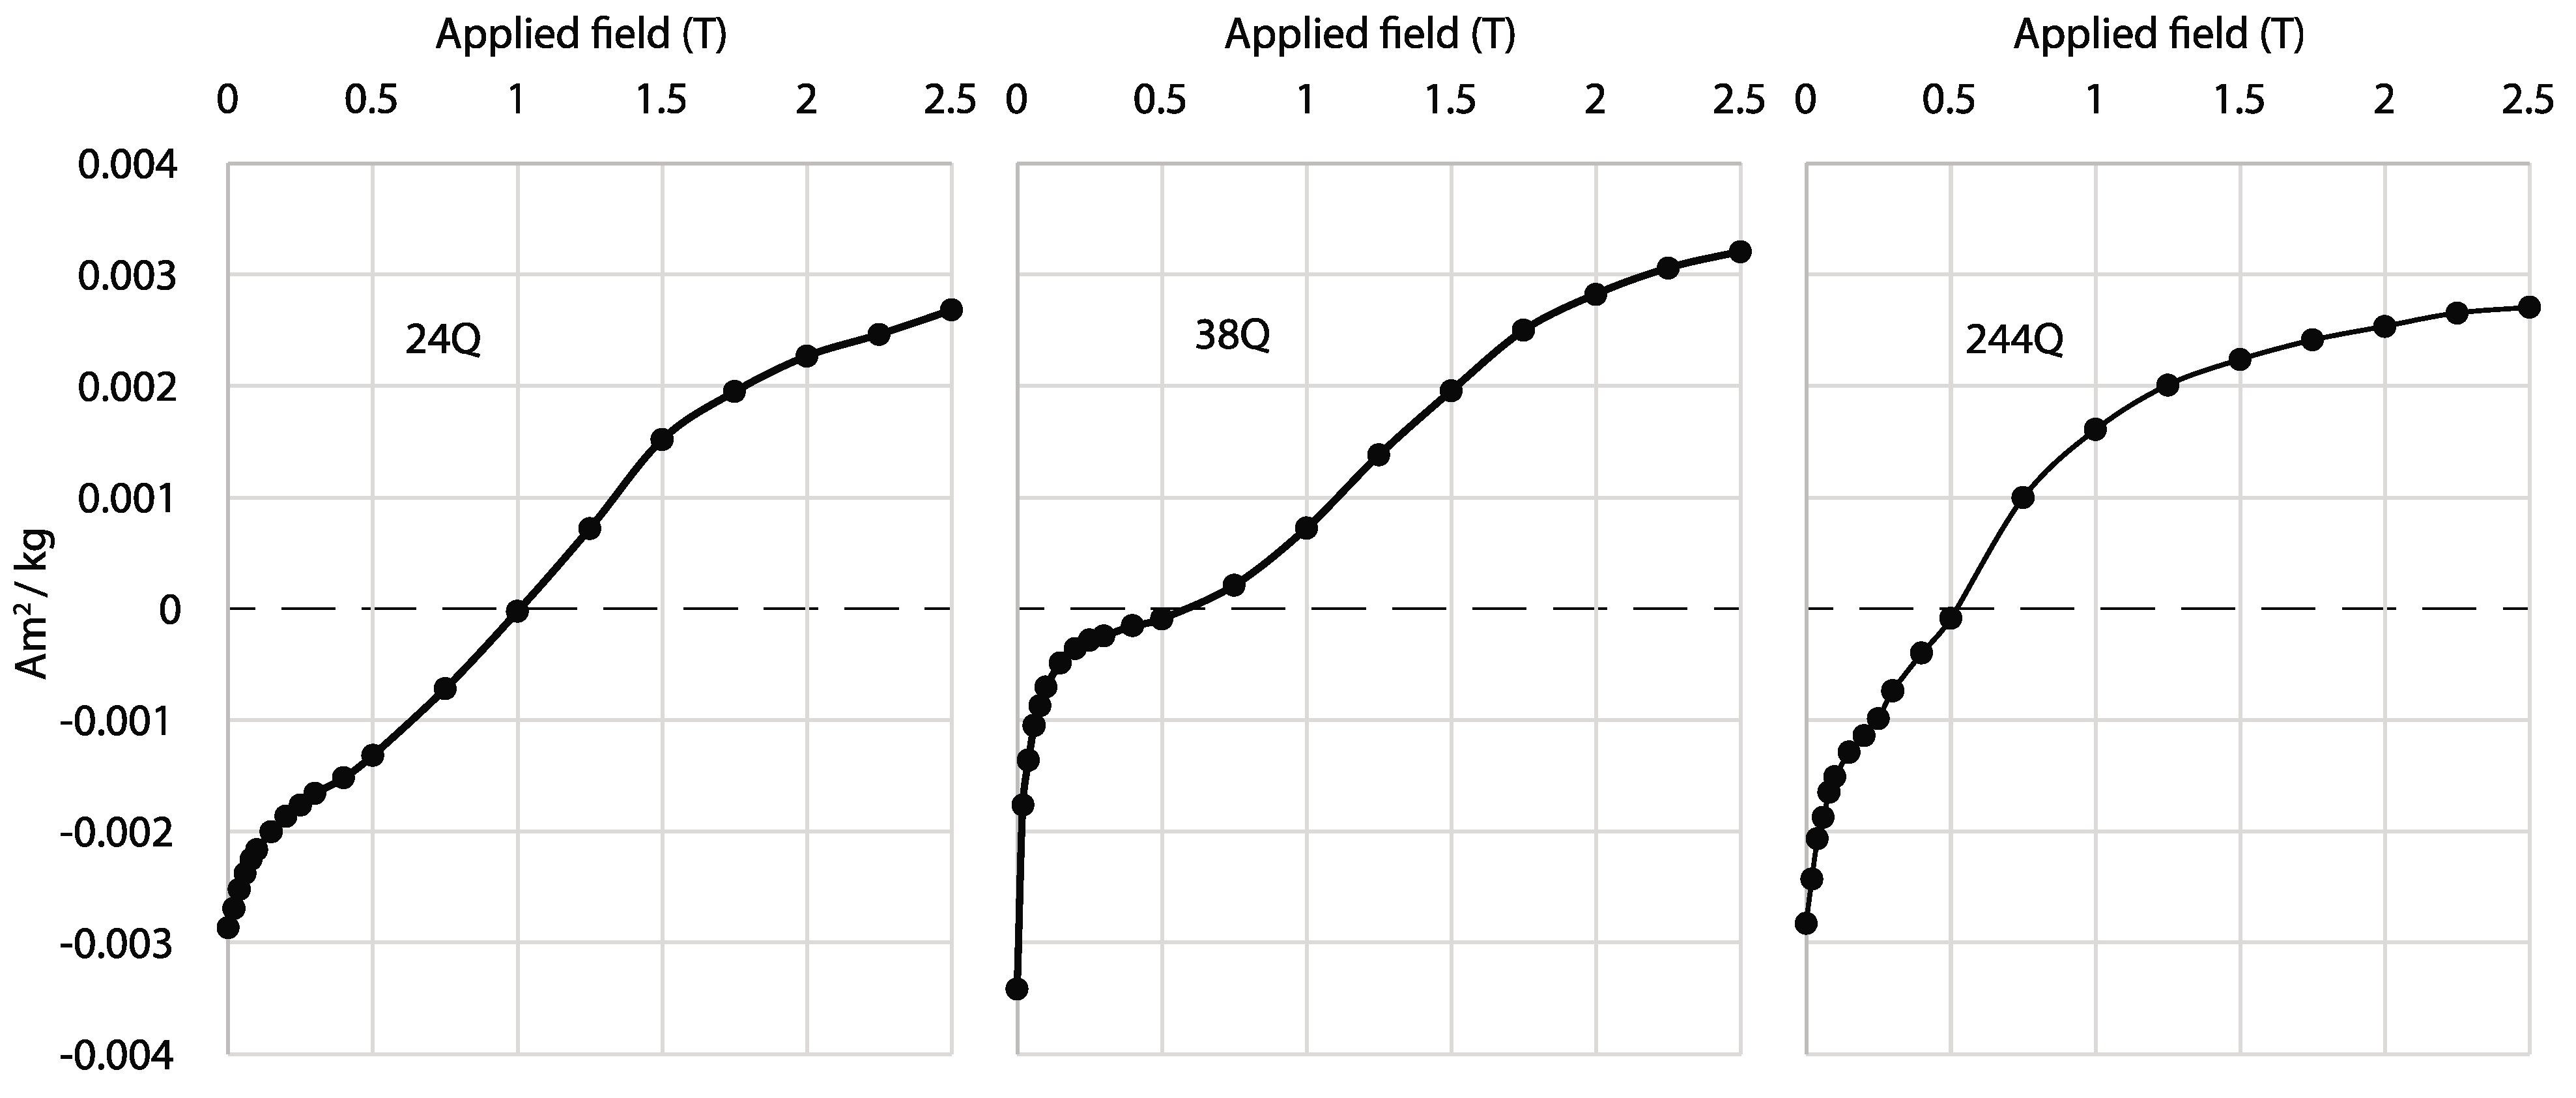
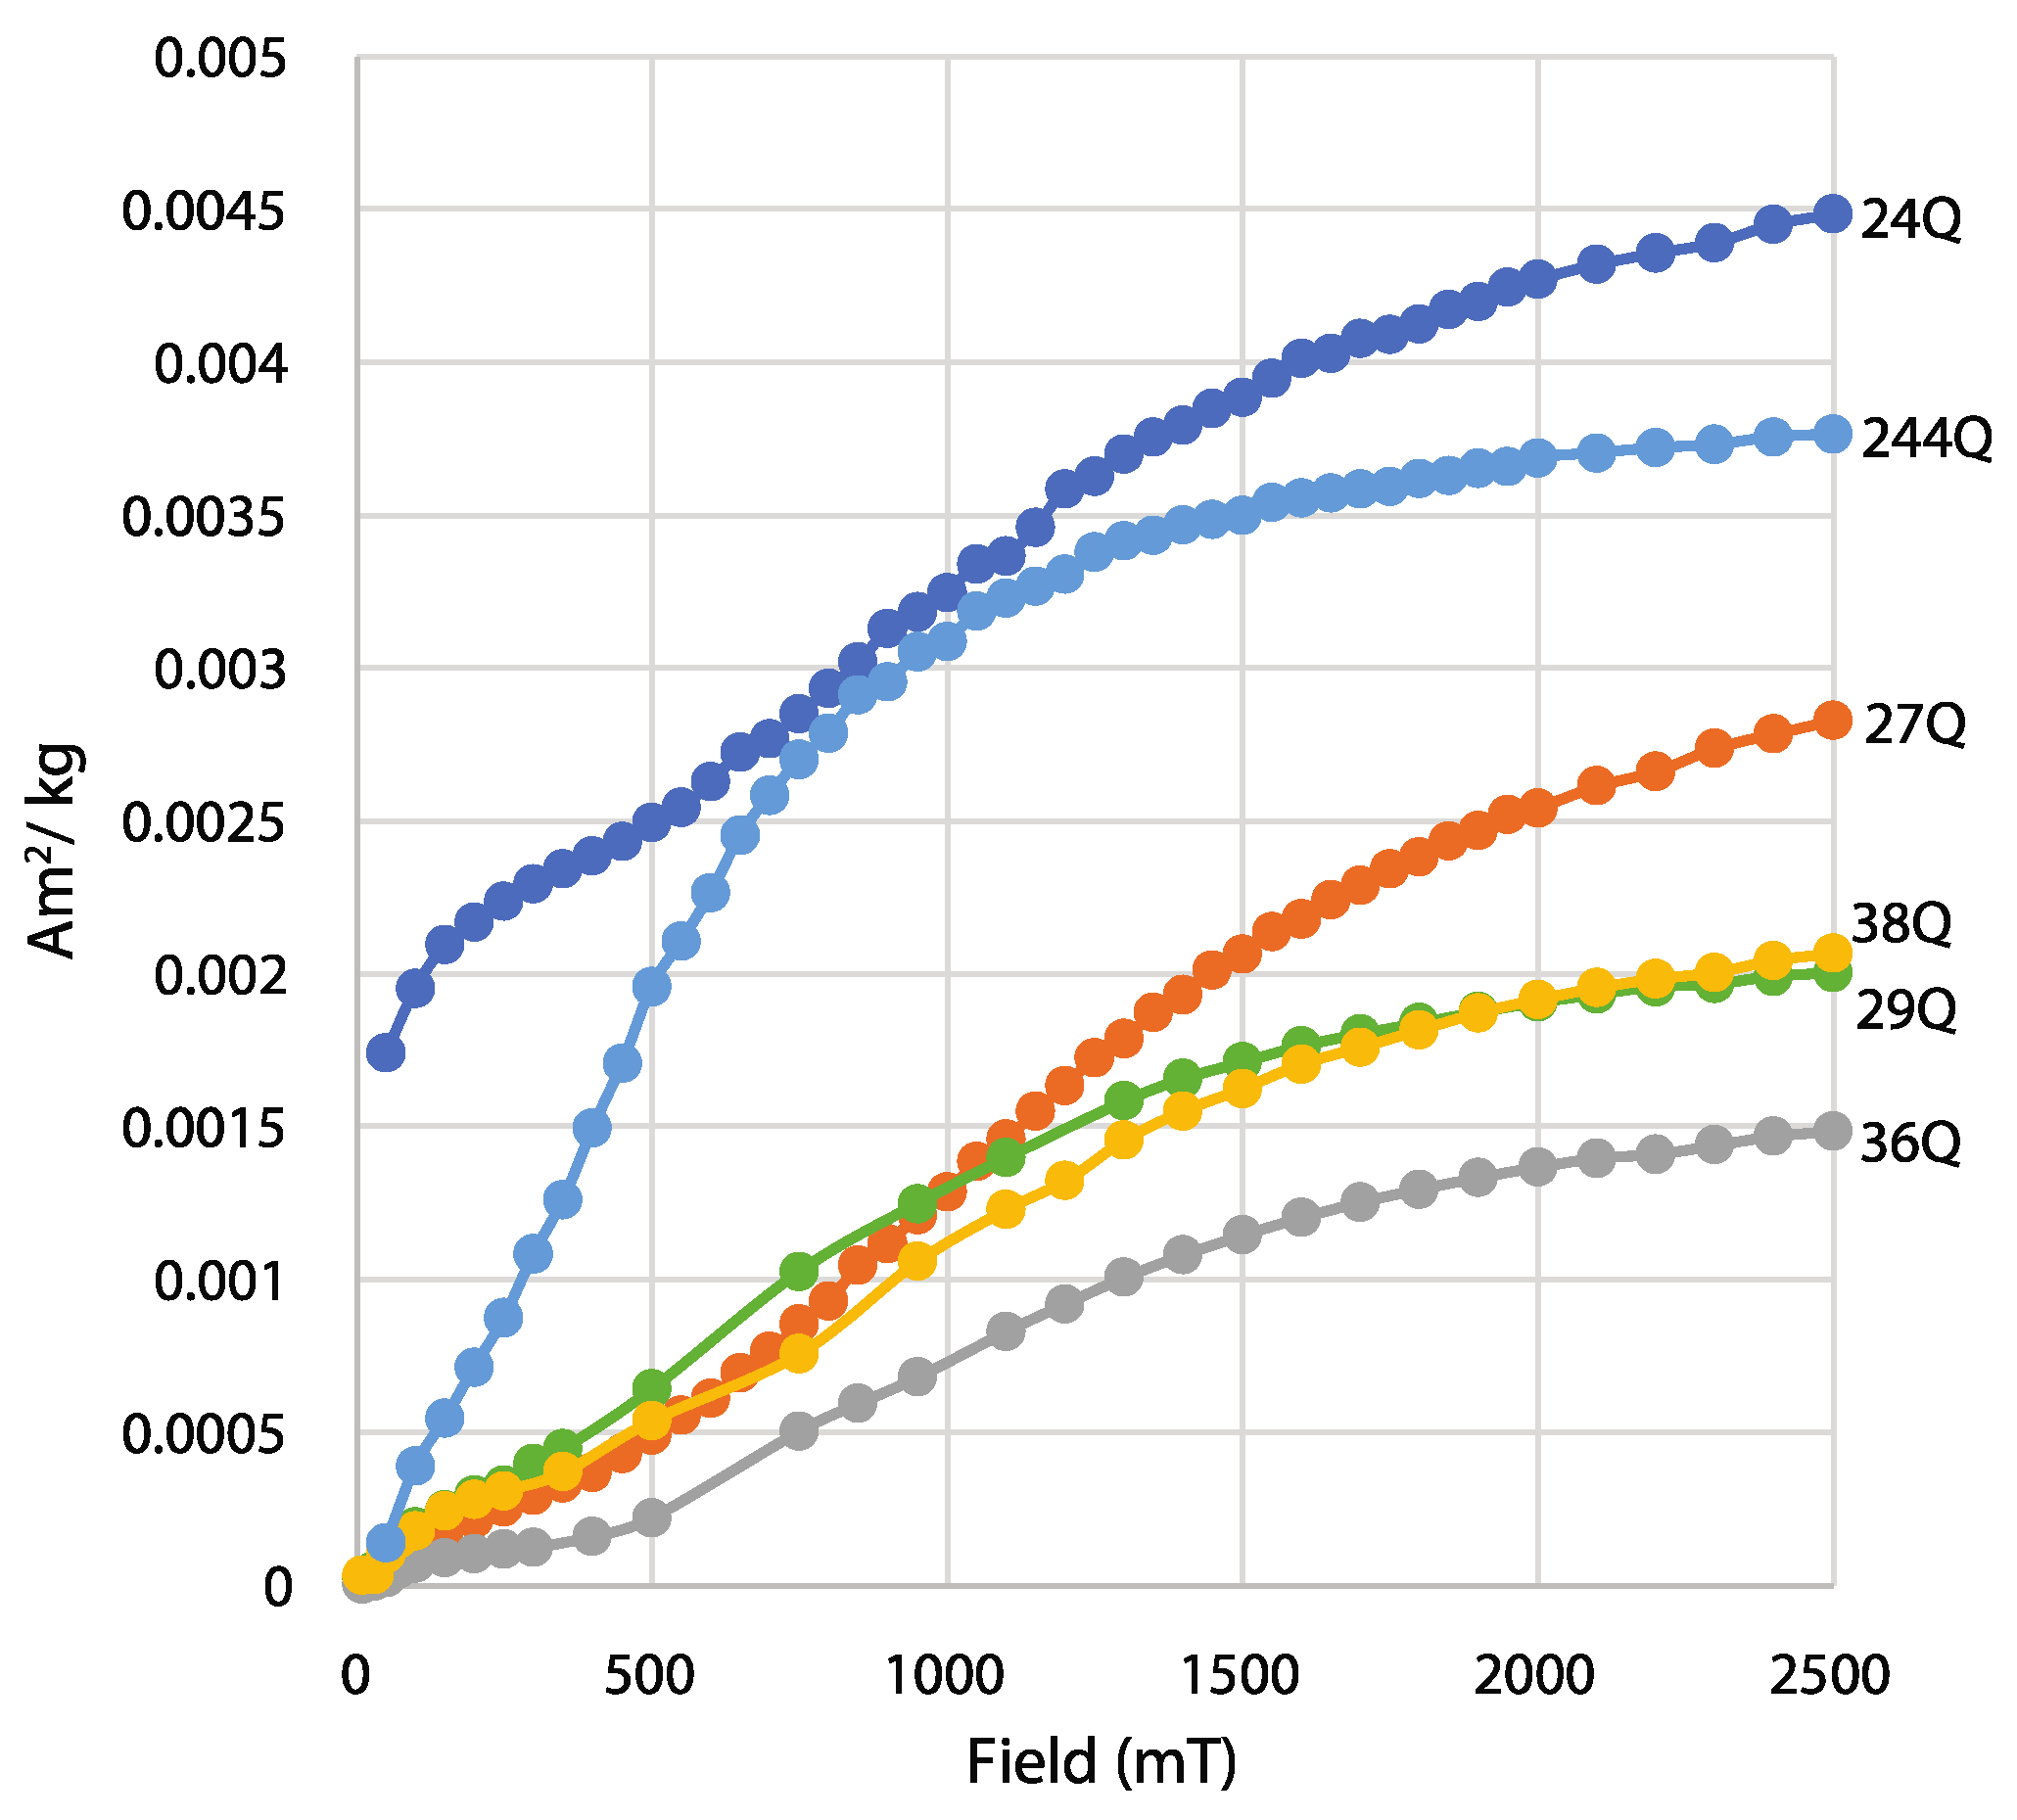
A challenge for studying maghemite and goethite from visible-light data is that the characteristic wavelength band positions of these minerals overlap at longer wavelengths near ~425 nm. To increase resolution for discriminating between maghemite and goethite, it is suggested to combine visible-light data with rock magnetic methods because of the different magnetic coercivities these minerals possess. This may improve concertation estimates for both minerals in natural assemblages and increase the understanding of the environmental conditions and the composition of mixed mineral assemblages in which goethite and maghemite form. The next steps of this research may include using the methods outlined in this paper to investigate synthetic samples doped with known concentrations of maghemite and goethite and comparing these results with natural rocks, sediment, and soil that have been validated through quantitative geochemistry.

Author Contributions

C.J.L. wrote the manuscript, conceived the idea for the research, performed measurements, and analyzed the data. O.M.Y. provided intellectual input and edited the paper. B.R.K. provided intellectual input. All authors have read and agreed to the published version of the manuscript.

Funding

This research received no external funding.

Data Availability Statement

All data are available free for public download from the OSF data repository. Search for data_publications_Lepre [138].

Acknowledgments

Bowling Green State University is thanked for generous startup funding that facilitated the research presented in this paper. Visible-light spectroscopy measurements were made at the Lepre lab in the School of Earth, Environment and Society of Bowling Green State University. Study of the Chinle core was performed at Rutgers University and Columbia University in collaboration with the Colorado Plateau Coring Project. Authors Lepre and Yazzie thank Paul Olsen for the invitation to join the project. Remnant magnetization measurements were made by Lepre on the 2G Model 760 DC-SQUID rock magnetometer in the shielded room of the Paleomagnetics Laboratory of Columbia University (Lamont–Doherty campus). The authors wish to thank Dennis Kent for providing access to the equipment and laboratory disposables, as well as expert guidance and ideas for studying the Chinle red beds with rock magnetism and visible-light spectroscopy.

Conflicts of Interest

The authors declare no conflicts of interest.

References

  1. Cao, W.; Jiang, Z.; Gai, C.; Barrón, V.; Torrent, J.; Zhong, Y.; Liu, Q. Re-Visiting the Quantification of Hematite by Diffuse Reflectance Spectroscopy. Minerals 2022, 12, 872. [Google Scholar] [CrossRef]
  2. Gao, X.; Hao, Q.; Wang, L.; Song, Y.; Ge, J.; Wu, H.; Xu, B.; Han, L.; Fu, Y.; Wu, X.; et al. Changes in monsoon precipitation in East Asia under a 2 °C interglacial warming. Sci. Adv. 2024, 10, eadm7694. [Google Scholar] [CrossRef] [PubMed]
  3. Jiang, Z.; Liu, Q.; Roberts, A.P.; Dekkers, M.J.; Barrón, V.; Torrent, J.; Li, S. The Magnetic and Color Reflectance Properties of Hematite: From Earth to Mars. Rev. Geophys. 2022, 60, e2020RG000698. [Google Scholar] [CrossRef]
  4. Boily, J.-F.; Song, X. Direct identification of reaction sites on ferrihydrite. Commun. Chem. 2020, 3, 79. [Google Scholar] [CrossRef]
  5. Joshi, P.; Fantle, M.S.; Larese-Casanova, P.; Gorski, C.A. Susceptibility of Goethite to Fe2+-Catalyzed Recrystallization over Time. Environ. Sci. Technol. 2017, 51, 11681–11691. [Google Scholar] [CrossRef] [PubMed]
  6. Kaiser, K.; Guggenberger, G. Mineral surfaces and soil organic matter. Eur. J. Soil Sci. 2003, 54, 219–236. [Google Scholar] [CrossRef]
  7. Kleber, M.; Eusterhues, K.; Keiluweit, M.; Mikutta, C.; Mikutta, R.; Nico, P.S. Mineral–Organic Associations: Formation, Properties, and Relevance in Soil Environments. In Advances in Agronomy; Elsevier: Amsterdam, The Netherlands, 2015; Volume 130, pp. 1–140. ISBN 978-0-12-802137-8. [Google Scholar]
  8. Marshall, T.A.; Morris, K.; Law, G.T.W.; Livens, F.R.; Mosselmans, J.F.W.; Bots, P.; Shaw, S. Incorporation of Uranium into Hematite during Crystallization from Ferrihydrite. Environ. Sci. Technol. 2014, 48, 3724–3731. [Google Scholar] [CrossRef] [PubMed]
  9. Ren, J.; Long, X.; Ji, J.; Barrón, V.; Torrent, J.; Wang, Y.; Xie, S. Different Enrichment Patterns of Magnetic Particles Modulated by Primary Iron-Phosphorous Input. Geophys. Res. Lett. 2020, 47, e2020GL090439. [Google Scholar] [CrossRef]
  10. Fink, J.R.; Inda, A.V.; Tiecher, T.; Barrón, V. Iron oxides and organic matter on soil phosphorus availability. Ciênc. E Agrotecnologia 2016, 40, 369–379. [Google Scholar] [CrossRef]
  11. Handler, R.M.; Frierdich, A.J.; Johnson, C.M.; Rosso, K.M.; Beard, B.L.; Wang, C.; Latta, D.E.; Neumann, A.; Pasakarnis, T.; Premaratne, W.A.P.J.; et al. Fe(II)-Catalyzed Recrystallization of Goethite Revisited. Environ. Sci. Technol. 2014, 48, 11302–11311. [Google Scholar] [CrossRef]
  12. Lalonde, K.; Mucci, A.; Ouellet, A.; Gélinas, Y. Preservation of organic matter in sediments promoted by iron. Nature 2012, 483, 198–200. [Google Scholar] [CrossRef] [PubMed]
  13. Moreno-Jiménez, E.; Plaza, C.; Saiz, H.; Manzano, R.; Flagmeier, M.; Maestre, F.T. Aridity and reduced soil micronutrient availability in global drylands. Nat. Sustain. 2019, 2, 371–377. [Google Scholar] [CrossRef] [PubMed]
  14. Wu, B.; Amelung, W.; Xing, Y.; Bol, R.; Berns, A.E. Iron cycling and isotope fractionation in terrestrial ecosystems. Earth-Sci. Rev. 2019, 190, 323–352. [Google Scholar] [CrossRef]
  15. Ye, C.; Huang, W.; Hall, S.J.; Hu, S. Association of Organic Carbon with Reactive Iron Oxides Driven by Soil pH at the Global Scale. Glob. Biogeochem. Cycles 2022, 36, e2021GB007128. [Google Scholar] [CrossRef]
  16. Zhao, M.; Mills, B.J.W.; Homoky, W.B.; Peacock, C.L. Oxygenation of the Earth aided by mineral–organic carbon preservation. Nat. Geosci. 2023, 16, 262–267. [Google Scholar] [CrossRef]
  17. Di Iorio, E.; Circelli, L.; Angelico, R.; Torrent, J.; Tan, W.; Colombo, C. Environmental implications of interaction between humic substances and iron oxide nanoparticles: A review. Chemosphere 2022, 303, 135172. [Google Scholar] [CrossRef] [PubMed]
  18. Dong, H.; Zeng, Q.; Sheng, Y.; Chen, C.; Yu, G.; Kappler, A. Coupled iron cycling and organic matter transformation across redox interfaces. Nat. Rev. Earth Environ. 2023, 4, 659–673. [Google Scholar] [CrossRef]
  19. Cudennec, Y.; Lecerf, A. The transformation of ferrihydrite into goethite or hematite, revisited. J. Solid State Chem. 2006, 179, 716–722. [Google Scholar] [CrossRef]
  20. Kadlec, R. Large Constructed Wetlands for Phosphorus Control: A Review. Water 2016, 8, 243. [Google Scholar] [CrossRef]
  21. Schwertmann, U. Transformation of hematite to goethite in soils. Nature 1971, 232, 624–625. [Google Scholar] [CrossRef]
  22. Bigham, J.M.; Fitzpatrick, R.W.; Schulze, D.G. Iron Oxides. In Soil Mineralogy with Environmental Applications; SSSA Book Series; Soil Science Society of America: Madison, WI, USA, 2002; pp. 323–366. ISBN 978-0-89118-891-9. [Google Scholar]
  23. Font, E.; Carlut, J.; Rémazeilles, C.; Mather, T.A.; Nédélec, A.; Mirão, J.; Casale, S. End-Cretaceous akaganéite as a mineral marker of Deccan volcanism in the sedimentary record. Sci. Rep. 2017, 7, 11453. [Google Scholar] [CrossRef] [PubMed]
  24. Schwertmann, U.; Cornell, R.M. (Eds.) Frontmatter. In Iron Oxides in the Laboratary; Wiley-VCH Verlag GmbH: Weinheim, Germany, 2000; pp. i–xviii. ISBN 978-3-527-61322-9. [Google Scholar]
  25. Stucki, J.W. Properties and Behaviour of Iron in Clay Minerals. In Developments in Clay Science; Elsevier: Amsterdam, The Netherlands, 2013; Volume 5, pp. 559–611. ISBN 978-0-08-099364-5. [Google Scholar]
  26. Maher, B.A. Palaeoclimatic records of the loess/palaeosol sequences of the Chinese Loess Plateau. Quat. Sci. Rev. 2016, 154, 23–84. [Google Scholar] [CrossRef]
  27. Evans, M.E.; Heller, F. Environmental Magnetism: Principles and Applications of Enviromagnetics; International geophysics series; Academic Press: Amsterdam, The Netherlands; Boston, MA, USA, 2003; ISBN 978-0-12-243851-6. [Google Scholar]
  28. Huang, W.; Jackson, M.J.; Dekkers, M.J.; Solheid, P.; Zhang, B.; Guo, Z.; Ding, L. Nanogoethite as a Potential Indicator of Remagnetization in Red Beds. Geophys. Res. Lett. 2019, 46, 12841–12850. [Google Scholar] [CrossRef]
  29. Kumar, N.; Lezama Pacheco, J.; Noël, V.; Dublet, G.; Brown, G.E. Sulfidation mechanisms of Fe(III)-(oxyhydr)oxide nanoparticles: A spectroscopic study. Environ. Sci. Nano 2018, 5, 1012–1026. [Google Scholar] [CrossRef]
  30. Li, J.; Lü, B.; Chen, T.; Liu, X.; Tang, J.; Yan, H. A New Perspective on the Applicability of Diffuse Reflectance Spectroscopy for Determining the Hematite Content of Fe-Rich Soils in the Tropical Margins of China. Minerals 2024, 14, 242. [Google Scholar] [CrossRef]
  31. Meng, X.; Li, G.K.; Long, X.; Li, S.; Ji, J. Quantifying Soil Goethite/Hematite Ratios: A New Method Based on Diffuse Reflectance Spectra. Geophys. Res. Lett. 2023, 50, e2022GL102280. [Google Scholar] [CrossRef]
  32. Nagano; Nakashima Study of colors and degrees of weathering of granitic rocks by visible diffuse reflectance spectroscopy. Geochem. J. 1989, 23, 75–83. [CrossRef]
  33. Poggere, G.C.; Inda, A.V.; Barrón, V.; Kämpf, N.; de Brito, A.D.B.; Barbosa, J.Z.; Curi, N. Maghemite quantification and magnetic signature of Brazilian soils with contrasting parent materials. Appl. Clay Sci. 2018, 161, 385–394. [Google Scholar] [CrossRef]
  34. Pohl, L.; Kölbl, A.; Werner, F.; Mueller, C.W.; Höschen, C.; Häusler, W.; Kögel-Knabner, I. Imaging of Al/Fe ratios in synthetic Al-goethite revealed by nanoscale secondary ion mass spectrometry. Rapid Commun. Mass Spectrom. 2018, 32, 619–628. [Google Scholar] [CrossRef]
  35. Thompson, R.; Oldfield, F. Environmental Magnetism; Allen & Unwin: London, UK, 1986; ISBN 978-94-011-8038-2. [Google Scholar]
  36. Tishchenko, V.; Meile, C.; Scherer, M.M.; Pasakarnis, T.S.; Thompson, A. Fe2+ catalyzed iron atom exchange and re-crystallization in a tropical soil. Geochim. Cosmochim. Acta 2015, 148, 191–202. [Google Scholar] [CrossRef]
  37. Bógalo, M.F.; Heller, F.; Osete, M.L. Isothermal remanence experiments at room and at liquid nitrogen temperature: Application to soil studies. Geophys. Res. Lett. 2001, 28, 419–422. [Google Scholar] [CrossRef]
  38. Roberts, A.P.; Zhao, X.; Heslop, D.; Abrajevitch, A.; Chen, Y.-H.; Hu, P.; Jiang, Z.; Liu, Q.; Pillans, B.J. Hematite (α-Fe2O3) quantification in sedimentary magnetism: Limitations of existing proxies and ways forward. Geosci. Lett. 2020, 7, 8. [Google Scholar] [CrossRef]
  39. Collinson, D.W. The Role of Pigment and Specularite in the Remanent Magnetism of Red Sandstones. Geophys. J. Int. 1974, 38, 253–264. [Google Scholar] [CrossRef]
  40. Swanson-Hysell, N.L.; Fairchild, L.M.; Slotznick, S.P. Primary and Secondary Red Bed Magnetization Constrained by Fluvial Intraclasts. J. Geophys. Res. Solid Earth 2019, 124, 4276–4289. [Google Scholar] [CrossRef]
  41. Tauxe, L.; Kent, D.V.; Opdyke, N.D. Magnetic components contributing to the NRM of Middle Siwalik red beds. Earth Planet. Sci. Lett. 1980, 47, 279–284. [Google Scholar] [CrossRef]
  42. Dearing, J.A.; Dann, R.J.L.; Hay, K.; Lees, J.A.; Loveland, P.J.; Maher, B.A.; O’Grady, K. Frequency-dependent susceptibility measurements of environmental materials. Geophys. J. Int. 1996, 124, 228–240. [Google Scholar] [CrossRef]
  43. Egli, R. Characterization of Individual Rock Magnetic Components by Analysis of Remanence Curves, 1. Unmixing Natural Sediments. Stud. Geophys. Geod. 2004, 48, 391–446. [Google Scholar] [CrossRef]
  44. Gao, X.; Hao, Q.; Wang, L.; Oldfield, F.; Bloemendal, J.; Deng, C.; Song, Y.; Ge, J.; Wu, H.; Xu, B.; et al. The different climatic response of pedogenic hematite and ferrimagnetic minerals: Evidence from particle-sized modern soils over the Chinese Loess Plateau. Quat. Sci. Rev. 2018, 179, 69–86. [Google Scholar] [CrossRef]
  45. Geiss, C.E.; Egli, R.; Zanner, C.W. Direct estimates of pedogenic magnetite as a tool to reconstruct past climates from buried soils. J. Geophys. Res. 2008, 113, B11102. [Google Scholar] [CrossRef]
  46. Orgeira, M.J.; Egli, R.; Compagnucci, R.H. A Quantitative Model of Magnetic Enhancement in Loessic Soils. In The Earth’s Magnetic Interior; Petrovský, E., Ivers, D., Harinarayana, T., Herrero-Bervera, E., Eds.; Springer: Dordrecht, The Netherlands, 2011; pp. 361–397. ISBN 978-94-007-0322-3. [Google Scholar]
  47. Slotznick, S.P.; Winston, D.; Webb, S.M.; Kirschvink, J.L.; Fischer, W.W. Iron mineralogy and redox conditions during deposition of the mid-Proterozoic Appekunny Formation, Belt Supergroup, Glacier National Park. In Geological Society of America Special Papers; Geological Society of America: Boulder, CO, USA, 2016; Volume 522, pp. 221–242. ISBN 978-0-8137-2522-2. [Google Scholar]
  48. Cai, Y.; Long, X.; Meng, X.; Ji, J.; Wang, Y.; Xie, S. Coordinated and Competitive Formation of Soil Magnetic Particles Driven by Contrary Climate Development. Geophys. Res. Lett. 2021, 48, e2021GL094506. [Google Scholar] [CrossRef]
  49. Jordanova, N.; Jordanova, D. Rock-magnetic and geochemical characteristics of relict Vertisols—Signs of past climate and recent pedogenic development. Geophys. J. Int. 2016, 205, 1437–1454. [Google Scholar] [CrossRef]
  50. Lepre, C.J. Constraints on Fe-Oxide Formation in Monsoonal Vertisols of Pliocene Kenya Using Rock Magnetism and Spectroscopy. Geochem. Geophys. Geosystems 2019, 20, 4998–5013. [Google Scholar] [CrossRef]
  51. Wang, S.; Chen, Z.; Yang, J.; Gao, F.; Tian, W.; Ma, X.; Xia, D. Magnetic properties of surface soils in the upper and middle reaches of the Yarlung Zangbo River Basin, southern Tibetan Plateau, and their environmental significance. Geophys. J. Int. 2023, 233, 1178–1190. [Google Scholar] [CrossRef]
  52. Jiang, Z.; Liu, Q.; Roberts, A.P.; Barrón, V.; Torrent, J.; Zhang, Q. A new model for transformation of ferrihydrite to hematite in soils and sediments. Geology 2018, 46, 987–990. [Google Scholar] [CrossRef]
  53. Ahmed, I.A.M.; Maher, B.A. Identification and paleoclimatic significance of magnetite nanoparticles in soils. Proc. Natl. Acad. Sci. USA 2018, 115, 1736–1741. [Google Scholar] [CrossRef]
  54. Liu, Q.; Barrón, V.; Torrent, J.; Eeckhout, S.G.; Deng, C. Magnetism of intermediate hydromaghemite in the transformation of 2-line ferrihydrite into hematite and its paleoenvironmental implications. J. Geophys. Res. 2008, 113, B01103. [Google Scholar] [CrossRef]
  55. Balsam, W.; Ji, J.; Chen, J. Climatic interpretation of the Luochuan and Lingtai loess sections, China, based on changing iron oxide mineralogy and magnetic susceptibility. Earth Planet. Sci. Lett. 2004, 223, 335–348. [Google Scholar] [CrossRef]
  56. Berner, R.A. Goethite stability and the origin of red beds. Geochim. Cosmochim. Acta 1969, 33, 267–273. [Google Scholar] [CrossRef]
  57. Grygar, T.; Dědeček, J.; Kruiver, P.P.; Dekkers, M.J.; Bezdička, P.; Schneeweiss, O. Iron oxide mineralogy in late Miocene red beds from La Gloria, Spain: Rock-magnetic, voltammetric and Vis spectroscopy analyses. CATENA 2003, 53, 115–132. [Google Scholar] [CrossRef]
  58. Guo, X.; Retallack, G.J.; Lü, B.; He, L.; Wang, R.; Song, H. Paleosols in Devonian red-beds from northwest China and their paleoclimatic characteristics. Sediment. Geol. 2019, 379, 16–24. [Google Scholar] [CrossRef]
  59. Sierra-Rojas, M.I.; Molina-Garza, R.S. Detrital and early chemical remanent magnetization in redbeds and their rock magnetic signature: Zicapa Formation, southern Mexico. Geophys. J. Int. 2018, 213, 1701–1719. [Google Scholar] [CrossRef]
  60. Torrent, J.; Schwertmann, U. Influence of Hematite on the Color of Red Beds. J. Sediment. Petrol. 1987, 57, 682–686. [Google Scholar]
  61. Van Houten, F.B. Origin of Red Beds A Review-1961-1972. Annu. Rev. Earth Planet. Sci. 1973, 1, 39–61. [Google Scholar] [CrossRef]
  62. Walker, T.R.; Larson, E.E.; Hoblitt, R.P. Nature and origin of hematite in the Moenkopi Formation (Triassic), Colorado Plateau: A contribution to the origin of magnetism in red beds. J. Geophys. Res. 1981, 86, 317. [Google Scholar] [CrossRef]
  63. He, W.; Yang, Z.; Du, H.; Hu, J.; Zhang, K.; Hou, W.; Li, H. Micro-Mechanisms and Implications of Continental Red Beds. Minerals 2022, 12, 934. [Google Scholar] [CrossRef]
  64. Lepre, C.J.; Olsen, P.E. Hematite reconstruction of Late Triassic hydroclimate over the Colorado Plateau. Proc. Natl. Acad. Sci. USA 2021, 118, 6. [Google Scholar] [CrossRef] [PubMed]
  65. Bahr, A.; Kolber, G.; Kaboth-Bahr, S.; Reinhardt, L.; Friedrich, O.; Pross, J. Mega-monsoon variability during the late Triassic: Re-assessing the role of orbital forcing in the deposition of playa sediments in the Germanic Basin. Sedimentology 2020, 67, 951–970. [Google Scholar] [CrossRef]
  66. Olsen, P.; Laskar, J.; Kent, D.V.; Kinney, S.T.; Reynolds, D.J.; Sha, J.; Whiteside, J.H. Mapping Solar System chaos with the Geological Orrery. Proc. Natl. Acad. Sci. USA 2019, 116, 10664–10673. [Google Scholar] [CrossRef] [PubMed]
  67. Das, S.; Hendry, M.J.; Essilfie-Dughan, J. Transformation of Two-Line Ferrihydrite to Goethite and Hematite as a Function of pH and Temperature. Environ. Sci. Technol. 2011, 45, 268–275. [Google Scholar] [CrossRef]
  68. Hanesch, M.; Stanjek, H.; Petersen, N. Thermomagnetic measurements of soil iron minerals: The role of organic carbon. Geophys. J. Int. 2006, 165, 53–61. [Google Scholar] [CrossRef]
  69. Löhr, S.C.; Grigorescu, M.; Cox, M.E. Iron nodules in ferric soils of the Fraser Coast, Australia: Relicts of laterisation or features of contemporary weathering and pedogenesis? Soil Res. 2013, 51, 77. [Google Scholar] [CrossRef]
  70. Spinola, D.N.; de Castro Portes, R.; Srivastava, P.; Torrent, J.; Barrón, V.; Kühn, P. Diagenetic reddening of Early Eocene paleosols on King George Island, Antarctica. Geoderma 2018, 315, 149–159. [Google Scholar] [CrossRef]
  71. Srivastava, P.; Sangode, S.J.; Torrent, J. Mineral magnetic and diffuse reflectance spectroscopy characteristics of the Deccan volcanic bole beds: Implications to genesis and transformations of iron oxides. Geoderma 2015, 239–240, 317–330. [Google Scholar] [CrossRef]
  72. Till, J.L.; Nowaczyk, N. Authigenic magnetite formation from goethite and hematite and chemical remanent magnetization acquisition. Geophys. J. Int. 2018, 213, 1818–1831. [Google Scholar] [CrossRef]
  73. Barron, V.; Torrent, J. Evidence for a simple pathway to maghemite in Earth and Mars soils. Geochim. Cosmochim. Acta 2002, 66, 2801–2806. [Google Scholar] [CrossRef]
  74. Schwertmann, U. Relations between Iron Oxides, Soil Color, and Soil Formation. In Soil Color; SSSA Special Publications: Madison, WI, USA, 1993; pp. 51–69. [Google Scholar]
  75. Olsen, P.E.; Geissman, J.W.; Kent, D.V.; Gehrels, G.E.; Mundil, R.; Irmis, R.B.; Lepre, C.; Rasmussen, C.; Giesler, D.; Parker, W.G.; et al. Colorado Plateau Coring Project, Phase I (CPCP-I): A continuously cored, globally exportable chronology of Triassic continental environmental change from western North America. Sci. Drill. 2018, 24, 15–40. [Google Scholar] [CrossRef]
  76. Chan, M.A.; Beitler, B.; Parry, W.T.; Ormö, J.; Komatsu, G. A possible terrestrial analogue for haematite concretions on Mars. Nature 2004, 429, 731–734. [Google Scholar] [CrossRef] [PubMed]
  77. Kent, D.V.; Olsen, P.E.; Lepre, C.; Rasmussen, C.; Mundil, R.; Gehrels, G.E.; Giesler, D.; Irmis, R.B.; Geissman, J.W.; Parker, W.G. Magnetochronology of the Entire Chinle Formation (Norian Age) in a Scientific Drill Core From Petrified Forest National Park (Arizona, USA) and Implications for Regional and Global Correlations in the Late Triassic. Geochem. Geophys. Geosystems 2019, 20, 4654–4664. [Google Scholar] [CrossRef]
  78. Ji, J.; Balsam, W.; Chen, J. Mineralogic and Climatic Interpretations of the Luochuan Loess Section (China) Based on Diffuse Reflectance Spectrophotometry. Quat. Res. 2001, 56, 23–30. [Google Scholar] [CrossRef]
  79. Heller, F.; Tung-sheng, L. Magnetostratigraphical dating of loess deposits in China. Nature 1982, 300, 431–433. [Google Scholar] [CrossRef]
  80. Lepre, C. Identifying Temperature and Moisture Controls on Fe Oxide Origins. Geophys. Res. Lett. 2023, 50, e2023GL102761. [Google Scholar] [CrossRef]
  81. Torrent, J.; Barrón, V. Diffuse Reflectance Spectroscopy. Methods Soil Anal. 2008, 5, 19. [Google Scholar]
  82. Scheinost, A.C.; Chavernas, A.; Barron, V.; Torrent, J. Use and Limitations of Second-Derivative Diffuse Reflectance Spectroscopy in the Visible to Near-Infrared Range to Identify and Quantify Fe Oxide Minerals in Soils. Clays Clay Miner. 1998, 46, 528–536. [Google Scholar] [CrossRef]
  83. Kruiver, P.P.; Dekkers, M.J.; Heslop, D. Quantification of magnetic coercivity components by the analysis of acquisition curves of isothermal remanent magnetisation. Earth Planet. Sci. Lett. 2001, 189, 269–276. [Google Scholar] [CrossRef]
  84. Maxbauer, D.P.; Feinberg, J.M.; Fox, D.L. MAX UnMix: A web application for unmixing magnetic coercivity distributions. Comput. Geosci. 2016, 95, 140–145. [Google Scholar] [CrossRef]
  85. Lowrie, W. Identification of ferromagnetic minerals in a rock by coercivity and unblocking temperature properties. Geophys. Res. Lett. 1990, 17, 159–162. [Google Scholar] [CrossRef]
  86. Liu, Q.S.; Torrent, J.; Barrón, V.; Duan, Z.Q.; Bloemendal, J. Quantification of hematite from the visible diffuse reflectance spectrum: Effects of aluminium substitution and grain morphology. Clay Miner. 2011, 46, 137–147. [Google Scholar] [CrossRef]
  87. Dos Santos, I.F.S.; Edwards, H.G.M.; De Faria, D.L.A. Hematite colour revisited: Particle size and electronic transitions. Spectrochim. Acta. A. Mol. Biomol. Spectrosc. 2024, 310, 123810. [Google Scholar] [CrossRef]
  88. Morris, R.V.; Lauer, H.V.; Lawson, C.A.; Gibson, E.K.; Nace, G.A.; Stewart, C. Spectral and other physicochemical properties of submicron powders of hematite (α-Fe2O3), maghemite (γ-Fe O3), magnetite (Fe3O4), goethite (α-FeOOH), and lepidocrocite (γ-FeOOH). J. Geophys. Res. 1985, 90, 3126. [Google Scholar] [CrossRef]
  89. Rossman, G.R. Why hematite is red: Correlation of optical absorption intensities and magnetic moments of Fe3+ minerals. Miner. Spectrosc. Tribute Roger G Bums 1996, 5, 23–27. [Google Scholar]
  90. Sherman, D.M.; Waite, T.D. Waite Electronic spectra of Fe3+ oxides and oxide hydroxides in the near IR to near UV. Am. Mineral. 1985, 70, 1262–1269. [Google Scholar]
  91. Bañuelos, J.L.; Borguet, E.; Brown, G.E.; Cygan, R.T.; DeYoreo, J.J.; Dove, P.M.; Gaigeot, M.-P.; Geiger, F.M.; Gibbs, J.M.; Grassian, V.H.; et al. Oxide– and Silicate–Water Interfaces and Their Roles in Technology and the Environment. Chem. Rev. 2023, 123, 6413–6544. [Google Scholar] [CrossRef] [PubMed]
  92. Coduri, M.; Masala, P.; Del Bianco, L.; Spizzo, F.; Ceresoli, D.; Castellano, C.; Cappelli, S.; Oliva, C.; Checchia, S.; Allieta, M.; et al. Local Structure and Magnetism of Fe2O3 Maghemite Nanocrystals: The Role of Crystal Dimension. Nanomaterials 2020, 10, 867. [Google Scholar] [CrossRef] [PubMed]
  93. OSF. Available online: https://osf.io/5vd8u/ (accessed on 30 April 2024).
  94. Scheinost, A.C.; Schwertmann, U. Color Identification of Iron Oxides and Hydroxysulfates: Use and Limitations. Soil Sci. Soc. Am. J. 1999, 63, 1463–1471. [Google Scholar] [CrossRef]
  95. Kerker, M.; Scheiner, P.; Cooke, D.D.; Kratohvil, J.P. Absorption index and color of colloidal hematite. J. Colloid Interface Sci. 1979, 71, 176–187. [Google Scholar] [CrossRef]
  96. Torrent, J.; Barrón, V. The visible diffuse reflectance spectrum in relation to the color and crystal properties of hematite. Clays Clay Miner. 2003, 51, 309–317. [Google Scholar] [CrossRef]
  97. Deaton, B.C.; Balsam, W.L. Visible Spectroscopy—A Rapid Method for Determining Hematite and Goethite Concentration in Geological Materials. J. Sediment. Petrol. 1991, 61, 628–632. [Google Scholar] [CrossRef]
  98. Landi, S.; Segundo, I.R.; Freitas, E.; Vasilevskiy, M.; Carneiro, J.; Tavares, C.J. Use and misuse of the Kubelka-Munk function to obtain the band gap energy from diffuse reflectance measurements. Solid State Commun. 2022, 341, 114573. [Google Scholar] [CrossRef]
  99. Hu, P.; Jiang, Z.; Liu, Q.; Heslop, D.; Roberts, A.P.; Torrent, J.; Barrón, V. Estimating the concentration of aluminum-substituted hematite and goethite using diffuse reflectance spectrometry and rock magnetism: Feasibility and limitations: Al-Hematite/Al-Goethite Quantification. J. Geophys. Res. Solid Earth 2016, 121, 4180–4194. [Google Scholar] [CrossRef]
  100. Balsam, W.; Junfeng, J.; Renock, D.; Deaton, B.C.; Williams, E. Determining hematite content from NUV/Vis/NIR spectra: Limits of detection. Am. Mineral. 2014, 99, 2280–2291. [Google Scholar] [CrossRef]
  101. Long, X.; Ji, J.; Balsam, W.L. Rainfall-dependent transformations of iron oxides in a tropical saprolite transect of Hainan Island, South China: Spectral and magnetic measurements. J. Geophys. Res. 2011, 116, 1–15. [Google Scholar] [CrossRef]
  102. Zhang, Y.G.; Ji, J.; Balsam, W.L.; Liu, L.; Chen, J. High resolution hematite and goethite records from ODP 1143, South China Sea: Co-evolution of monsoonal precipitation and El Niño over the past 600,000 years. Earth Planet. Sci. Lett. 2007, 264, 136–150. [Google Scholar] [CrossRef]
  103. Nagano, T.; Isobe, H.; Nakashima, S.; Ashizaki, M. Characterization of Iron Hydroxides in a Weathered Rock Surface by Visible Microspectroscopy. Appl. Spectrosc. 2002, 56, 651–657. [Google Scholar] [CrossRef]
  104. Jiang, Z.; Liu, Q.; Colombo, C.; Barrón, V.; Torrent, J.; Hu, P. Quantification of Al-goethite from diffuse reflectance spectroscopy and magnetic methods. Geophys. J. Int. 2014, 196, 131–144. [Google Scholar] [CrossRef]
  105. Torrent, J.; Liu, Q.; Bloemendal, J.; Barrón, V. Magnetic Enhancement and Iron Oxides in the Upper Luochuan Loess–Paleosol Sequence, Chinese Loess Plateau. Soil Sci. Soc. Am. J. 2007, 71, 1570. [Google Scholar] [CrossRef]
  106. Moskowitz, B.M.; Reynolds, R.L.; Goldstein, H.L.; Berquó, T.S.; Kokaly, R.F.; Bristow, C.S. Iron oxide minerals in dust-source sediments from the Bodélé Depression, Chad: Implications for radiative properties and Fe bioavailability of dust plumes from the Sahara. Aeolian Res. 2016, 22, 93–106. [Google Scholar] [CrossRef]
  107. Peters, C.; Dekkers, M.J. Selected room temperature magnetic parameters as a function of mineralogy, concentration and grain size. Phys. Chem. Earth Parts ABC 2003, 28, 659–667. [Google Scholar] [CrossRef]
  108. France, D.E.; Oldfield, F. Identifying goethite and hematite from rock magnetic measurements of soils and sediments. J. Geophys. Res. Solid Earth 2000, 105, 2781–2795. [Google Scholar] [CrossRef]
  109. Özdemir, Ö. High-temperature hysteresis and thermoremanence of single-domain maghemite. Phys. Earth Planet. Inter. 1990, 65, 125–136. [Google Scholar] [CrossRef]
  110. Gehring, A.U.; Fischer, H.; Louvel, M.; Kunze, K.; Weidler, P.G. High temperature stability of natural maghemite: A magnetic and spectroscopic study. Geophys. J. Int. 2009, 179, 1361–1371. [Google Scholar] [CrossRef]
  111. van Velzen, A.J.; Dekkers, M.J. Low-Temperature Oxidation of Magnetite in Loess-Paleosol Sequences: A Correction of Rock Magnetic Parameters. Studia Geoph. Geod. 1999, 43, 357–375. [Google Scholar] [CrossRef]
  112. Fitzpatrick, R.W.; Schwertmann, U. Al-Substituted Goethite—An Indicator of Pedogenic and other Weathering Environments in South Africa. Geoderma 1982, 27, 335–347. [Google Scholar] [CrossRef]
  113. Liu, Q.; Roberts, A.P.; Torrent, J.; Horng, C.-S.; Larrasoaña, J.C. What do the HIRM and S-ratio really measure in environmental magnetism? Geochem. Geophys. Geosystems 2007, 8, 1–10. [Google Scholar] [CrossRef]
  114. Tibbits, D.; Chang, C.; Kinney, S.T.; Bebo, C.R.; Pinnella, M.; Witkowski, R.; Prabhakar, L. Leveraging Scanning X-ray Fluorescence Spectroscopy and High-Resolution X-ray Computed Tomography to Map Density Changes Along Cores from the Colorado Plateau Coring Project Phase 1: Implications for Early Mesozoic Climate and Geogenic Groundwater Contamination. In Proceedings of the AGU Annual Meeting, San Francisco, CA, USA, 11–15 December 2023. [Google Scholar]
  115. Irving, E.; Opdyke, N.D. The Palaeomagnetism of the Bloomsburg Red Beds and its Possible Application to the Tectonic History of the Appalachians. Geophys. J. Int. 1965, 9, 153–167. [Google Scholar] [CrossRef]
  116. Jiang, Z.; Liu, Q.; Dekkers, M.J.; Tauxe, L.; Qin, H.; Barrón, V.; Torrent, J. Acquisition of chemical remanent magnetization during experimental ferrihydrite–hematite conversion in Earth-like magnetic field—Implications for paleomagnetic studies of red beds. Earth Planet. Sci. Lett. 2015, 428, 1–10. [Google Scholar] [CrossRef]
  117. Dunlop, D.J.; Özdemir, Ö. Magnetizations in rocks and minerals. In Geomagnetism; Treatise on Geophysics; Elsevier: Amsterdam, The Netherlands, 2009; Volume 5, pp. 277–336. [Google Scholar]
  118. Forster, T.; Evans, M.E.; Heller, F. The frequency dependence of low field susceptibility in loess sediments. Geophys. J. Int. 1994, 118, 636–642. [Google Scholar] [CrossRef]
  119. Özdemir, Ö.; Dunlop, D.J. Hysteresis and coercivity of hematite: Hysteresis and Coercivity of Hematite. J. Geophys. Res. Solid Earth 2014, 119, 2582–2594. [Google Scholar] [CrossRef]
  120. Lagroix, F.; Guyodo, Y. A New Tool for Separating the Magnetic Mineralogy of Complex Mineral Assemblages from Low Temperature Magnetic Behavior. Front. Earth Sci. 2017, 5, 61. [Google Scholar] [CrossRef]
  121. Özdemir, Ö.; Dunlop, D.J.; Berquó, T.S. Morin transition in hematite: Size dependence and thermal hysteresis. Geochem. Geophys. Geosystems 2008, 9, 2008GC002110. [Google Scholar] [CrossRef]
  122. Nie, J.; Garzione, C.; Su, Q.; Liu, Q.; Zhang, R.; Heslop, D.; Necula, C.; Zhang, S.; Song, Y.; Luo, Z. Dominant 100,000-year precipitation cyclicity in a late Miocene lake from northeast Tibet. Sci. Adv. 2017, 3, e1600762. [Google Scholar] [CrossRef]
  123. Retallack, G.J.; Sheldon, N.D.; Cogoini, M.; Elmore, R.D. Magnetic susceptibility of early Paleozoic and Precambrian paleosols. Palaeogeogr. Palaeoclimatol. Palaeoecol. 2003, 198, 373–380. [Google Scholar] [CrossRef]
  124. Yin, K.; Hong, H.; Algeo, T.J.; Churchman, G.J.; Li, Z.; Zhu, Z.; Fang, Q.; Zhao, L.; Wang, C.; Ji, K.; et al. Fe-oxide mineralogy of the Jiujiang red earth sediments and implications for Quaternary climate change, southern China. Sci. Rep. 2018, 8, 3610. [Google Scholar] [CrossRef] [PubMed]
  125. Ao, H.; Dupont-Nivet, G.; Rohling, E.J.; Zhang, P.; Ladant, J.-B.; Roberts, A.P.; Licht, A.; Liu, Q.; Liu, Z.; Dekkers, M.J.; et al. Orbital climate variability on the northeastern Tibetan Plateau across the Eocene–Oligocene transition. Nat. Commun. 2020, 11, 5249. [Google Scholar] [CrossRef] [PubMed]
  126. Zhisheng, A.; Guoxiong, W.; Jianping, L.; Youbin, S.; Yimin, L.; Weijian, Z.; Yanjun, C.; Anmin, D.; Li, L.; Jiangyu, M.; et al. Global Monsoon Dynamics and Climate Change. Annu. Rev. Earth Planet. Sci. 2015, 43, 29–77. [Google Scholar] [CrossRef]
  127. Liu, Q.; Bloemendal, J.; Torrent, J.; Deng, C. Contrasting behavior of hematite and goethite within paleosol S5 of the Luochuan profile, Chinese Loess Plateau. Geophys. Res. Lett. 2006, 33, L20301. [Google Scholar] [CrossRef]
  128. Ao, H.; Rohling, E.J.; Stringer, C.; Roberts, A.P.; Dekkers, M.J.; Dupont-Nivet, G.; Yu, J.; Liu, Q.; Zhang, P.; Liu, Z.; et al. Two-stage mid-Brunhes climate transition and mid-Pleistocene human diversification. Earth-Sci. Rev. 2020, 210, 103354. [Google Scholar] [CrossRef]
  129. Kukla, G.J.; Bender, M.L.; de Beaulieu, J.-L.; Bond, G.; Broecker, W.S.; Cleveringa, P.; Gavin, J.E.; Herbert, T.D.; Imbrie, J.; Jouzel, J.; et al. Last Interglacial Climates. Quat. Res. 2002, 58, 2–13. [Google Scholar] [CrossRef]
  130. Chen, J.; An, Z.; Head, J. Variation of Rb/Sr Ratios in the Loess-Paleosol Sequences of Central China during the Last 130,000 Years and Their Implications for Monsoon Paleoclimatology. Quat. Res. 1999, 51, 215–219. [Google Scholar] [CrossRef]
  131. Zhao, L.; Hong, H.; Liu, J.; Fang, Q.; Yao, Y.; Tan, W.; Yin, K.; Wang, C.; Chen, M.; Algeo, T.J. Assessing the utility of visible-to-shortwave infrared reflectance spectroscopy for analysis of soil weathering intensity and paleoclimate reconstruction. Palaeogeogr. Palaeoclimatol. Palaeoecol. 2018, 512, 80–94. [Google Scholar] [CrossRef]
  132. Evans, M.E.; Heller, F. Magnetic Enhancement and Palaeoclimate: Study of A Loess/Palaeosol Couplet Across the Loess Plateau of China. Geophys. J. Int. 1994, 117, 257–264. [Google Scholar] [CrossRef]
  133. Kukla, G.; Heller, F.; Ming, L.X.; Chun, X.T.; Sheng, L.T.; Sheng, A.Z. Pleistocene climates in China dated by magnetic susceptibility. Geology 1988, 16, 811–814. [Google Scholar] [CrossRef]
  134. Muxworthy, A.R.; Turney, J.N.; Qi, L.; Baker, E.B.; Perkins, J.R.; Abdulkarim, M.A. Interpreting high-temperature magnetic susceptibility data of natural systems. Front. Earth Sci. 2023, 11, 1171200. [Google Scholar] [CrossRef]
  135. Hao, Q.; Oldfield, F.; Bloemendal, J.; Torrent, J.; Guo, Z. The record of changing hematite and goethite accumulation over the past 22 Myr on the Chinese Loess Plateau from magnetic measurements and diffuse reflectance spectroscopy. J. Geophys. Res. 2009, 114, B12101. [Google Scholar] [CrossRef]
  136. Zhang, R.; Nie, J. Goethite Concentration Variations in the Red Clay Sequence on the Chinese Loess Plateau: Variations of Goethite in the Red Clay. Geochem. Geophys. Geosystems 2017, 18, 4179–4185. [Google Scholar] [CrossRef]
  137. Long, X.; Ji, J.; Barrón, V.; Torrent, J. Climatic thresholds for pedogenic iron oxides under aerobic conditions: Processes and their significance in paleoclimate reconstruction. Quat. Sci. Rev. 2016, 150, 264–277. [Google Scholar] [CrossRef]
  138. OSF. Available online: https://osf.io/b25h3/ (accessed on 30 April 2024).
Figure 1. Left panel: Reddened soil horizon from the sand dune at Newcomb Hollow Beach, Cape Cod, USA. The red horizon formed after Cape Cod was emplaced at the end of the last glacial maximum, constraining its timescale of development to <~20 kyr. The soil is probably a podzol/spodosol due to the ash-grey horizon overlying the red. These soils may form quickly over several hundred to several thousand years. Right panel: Red beds of the Late Triassic Chinle Formation, Petrified Forest National Park, USA (photo courtesy of the US Department of the Interior).
Crystals 14 00644 g001
Figure 3. Munsell hue in relation to specific surface area (SSA). Data graph modified from Torrent and Barrón [96] their Figure 8.
Crystals 14 00644 g003
Figure 4. Backfield IRM acquisition curves for select samples of the Late Triassic Chinle Formation. Coercivity of remanence for the three samples varies between 0.5 and 1.0 T, suggesting the presence of hematite. Failure of the curves to saturate (flatten) at the terminal step of 2.5 T suggests the presence of hematite or goethite. IRM patterns suggest all three samples carry at least one additional component that is of lower coercivity (magnetite/maghemite). This is particularly indicated by sample 38Q that shows large increases in IRM acquired from the low-field steps (i.e., <100 mT).
Crystals 14 00644 g004
Figure 5. Forward field IRM acquisition curves of select Chinle samples showing a range of magnetizations. The acquisition spectra are dominated by a high-coercivity component that is probably hematite.
Crystals 14 00644 g005
Figure 6. IRM unmixing model (Maxbauer et al. [84]) applied to the forward field IRM data of Figure 5. Note the position of the 1 T applied field indicated on the horizonal axis of sample 24Q. The vertical axis is the ratio between the derivative of M (=Am2/kg) and the derivative of logB (=applied field in mT). Each sample carries at least one low-coercivity component and two high-coercivity components. The samples are dominated by hematite with a coercivity of ~750 mT (e.g., 244Q) or ~1 T (e.g., 36Q) but hematite in natural samples occurs over a range of coercivities, contributing to the small IRM acquired <300 mT. The component at ~50 mT (e.g., 36Q) may represent magnetite/maghemite. The small contribution from a high-coercivity component > 1 T is hematite or goethite.
Crystals 14 00644 g006
Figure 7. Representative thermal demagnetization patterns of IRM components for Chinle samples. IRM was imparted along two orthogonal axes using different field strengths. The high-coercivity component (2.5 T) in all samples is dominated by hematite. Unblocking spectra of the high-coercivity component shows the “thermally distributed” pattern (e.g., 21Q, 24Q) associated with colorful hematite that is characterized by the gradual reduction in IRM from room temperature to the terminal demagnetization step. “Thermally discrete” unblocking patterns (e.g., 244Q, 252Q) of the high-coercivity component are associated with detrital hematite particles that are characterized by a large decrease in IRM in the temperature range of 650–700 °C. Low-coercivity components in some samples (e.g., 244Q) have distributed thermal unblocking patterns that suggest the presence of colorful hematite with a wide range of coercivity distributions in these samples. The second diagram for sample 21Q isolates the high-temperature demagnetization of the low-coercivity component (300 mT) that may suggest the presence of maghemite (see text for discussion).
Crystals 14 00644 g007
Figure 8. Liquid nitrogen IRM experiments. Upper panel: Remanence measurements of three sister specimens of sample 24Q. Large increases in IRM occur with cooling the specimen to liquid nitrogen temperature (77 K) for 5 min and then applying the IRM (LN + IRM). In comparison, the IRM increase is small between the specimen treated with a liquid nitrogen bath only (ln-only) and the specimen imparted with a room temperature IRM only (rt-only). Lower panel: Specimens of samples 24Q and 244Q. All IRMs were imparted with a 2.5 T field along the specimen +Z axis. The chart demonstrates that, like the upper panel, the largest IRM increase occurs with cooling the specimen to liquid nitrogen temperature (77 K) for 5 min and then applying the IRM. Procedure key: A = IRM applied at room temperature, then the specimen is bathed at 77 K for 5 min; B = room temperature remanence measurement; C = IRM applied at room temperature; D = specimen bathed at 77 K for 5 min; E = specimen bathed at 77 K for 5 min, then IRM applied and measured at ~77 K.
Crystals 14 00644 g008
Figure 9. Predictive model integrating climate change and iron oxide phase relationships. The amplitude height of the curves indicates higher concentrations of the iron oxides and increasing magnetic susceptibility. Colored lines represent hematite, maghemite, or goethite trends measured with visible-light spectra. Under a warm/wet monsoonal climate, the production of magnetic iron oxides increases, and hematite is the predominant colorful phase that derives from the oxidation of maghemite.
Crystals 14 00644 g009
Disclaimer/Publisher’s Note: The statements, opinions and data contained in all publications are solely those of the individual author(s) and contributor(s) and not of MDPI and/or the editor(s). MDPI and/or the editor(s) disclaim responsibility for any injury to people or property resulting from any ideas, methods, instructions or products referred to in the content.

