Article

Electrochemical Recovery of N and P from Municipal Wastewater

by
Panagiota D. Natsi
1,2 and
Petros G. Koutsoukos
1,2,*
1
Foundation of Research and Technology Hellas, Institute of Chemical Engineering Sciences, 26504 Patras, Greece
2
Laboratory of Inorganic & Analytical Chemistry, Department of Chemical Engineering, University of Patras, 26504 Patras, Greece
*
Author to whom correspondence should be addressed.
Crystals 2024, 14(8), 675; https://doi.org/10.3390/cryst14080675
Submission received: 26 June 2024 / Revised: 18 July 2024 / Accepted: 21 July 2024 / Published: 24 July 2024
(This article belongs to the Section Mineralogical Crystallography and Biomineralization)

Abstract

:
Phosphorus, P, is a vital element of paramount importance for both humans and for the Environment. Wastewater contains often relatively high concentrations of P which can be recovered as crystalline struvite (MgNH4PO4·6H2O, MAP). This option is quite attractive in assisting sustainable development because struvite can be used as a slow-release fertilizer. Domestic wastewater is usually high in P and nitrogen, N, but relatively poor in magnesium, Mg. It is necessary to develop low-cost solutions for the enrichment of wastewater with Mg. In the present work, sacrificial magnesium anodes were used, which dissolve upon anodic polarization, releasing sufficient magnesium for the selective precipitation of MAP. The application of constant current between two electrodes of which the anode is a low-cost magnesium cylindrical rod (4 cm2 exposed surface area) and the other a platinum cathode electrode, both immersed in ammonium phosphate solutions, without adjustment of the solution pH, was investigated. Constant current density over the range 10–100 A·m−2, between the Mg- Pt electrodes immersed in solutions of ammonium hydrogen phosphate of exactly known initial concentration, was applied using a potentiostat. In the presence of sodium chloride solutions, on the magnesium anode and in the bulk solution, Mg(OH)2 (brucite) formed because of the passivation of the Mg electrode. In dilute ammonium hydrogen phosphate solutions, the magnesium anode dissolution resulted in struvite precipitation, even at a low applied current (10 mA). Struvite crystals with an average size of 20 μm were precipitated. The behavior of the cell for the electrolyte solutions used was Faradaic as long as the surface coverage of the anode was relatively low. The anodic dissolution of Mg resulted in high pH values (pH 11) eliminating the need for alkali addition.

1. Introduction

The shortage of phosphate rock is a concern with significant implications for agriculture and food security. Phosphate rock is the key component in fertilizer production and crucial for global foodstuff production. Depletion of phosphate rock mineral deposits will require a multifaceted approach involving sustainable mining practices, improved resource management, and innovation in fertilizer production and usage [1,2,3]. Moreover, the eutrophication problem caused by excessive phosphorus discharge to natural water bodies [4] has attracted increased attention as it may well affect drinking water safety [5,6]. Phosphorus recovered from wastewater is of key importance for sustainable phosphorus management and pollution reduction. Approximately 20% of the raw phosphate ores currently used for P production mainly in the fertilizer industry could be recovered from municipal and/or agricultural wastewater [7]. Maximization of the P and N nutrient amounts recovered from wastewater is of extreme importance for the circular economy. A number of techniques have been developed to recover phosphorus from sewage discharge [8,9]. Chemical precipitation is one of the most classical methods. This methodology involves the precipitation of Ca3(PO4)2 or MgNH4PO4·xH2O (x = 1 or 6) [10] by the addition of solutions of substances, which are often either of high cost or damaging to the environment and to the application of adsorption methods using biomass-derived materials [10]. Other separation techniques using membranes (like ion exchange and reverse osmosis) have serious limitations including high operation costs, low yield at low nutrient concentrations and pollution caused sometimes by added substances to increase precipitation yield [11]. One of the promising techniques mostly studied for the recovery of phosphorus and nitrogen is the precipitation of struvite crystals, which can be used as a directly applied fertilizer [12]. Compared to traditional fertilizers, struvite is rich in nutrients for plant growth. Direct application to the soil and the slow rate of the release of its components, which is due to its moderately low solubility, make it an effective fertilizer [13,14]. Phosphorus recovery in the form of struvite crystals has been applied in urine wastewater and in anaerobic supernatant solutions [15,16,17,18]. In wastewater, struvite precipitation is spontaneous when the concentrations of ammonium, phosphate, and magnesium ions exceed the solubility threshold of struvite. The precipitation of struvite can be directly monitored using simple and controllable processes. Equation (1) describes the precipitation process of struvite from ammonium hydrogen phosphate solutions supersaturated with respect to the salt:
M g 2 + ( a q ) + N H 4 + ( a q ) + + P O 4 3 ( a q ) + 6 H 2 O M g N H 4 P O 4 · 6 H 2 O ( s )
Currently, struvite precipitation technology has evolved beyond the conventional method of adding magnesium salts to the use of sacrificial magnesium anode [19]. In this way, the purity of the obtained struvite exceeded 90% at pH levels ranging from 7.5 to 9.3. This method seems to have the advantage of purity of the produced struvite as well as saving alkali for pH adjustment since alkali addition is normally used to increase supersaturation of the treated wastewater with respect to struvite [20]. In the present work, an electrochemical cell consisting of a metallic magnesium anode and a platinum electrode was used. Anodic polarization of the Mg anode released the concentrations needed to selectively precipitate struvite into the aqueous solution. The precipitation process took place primarily at the Mg/ammonium phosphate aqueous solution interface. The main electrochemical reactions taking place at the cathode and the anode, respectively, are:
Cathode reaction: O 2 + 2 H 2 O + 4 e 4 O H
2 H 2 O + 2 e H 2 + 2 O H
Anode reaction: M g M g 2 + + 2 e
Struvite precipitation depends strongly on the concentrations of Mg2+, NH4+ and PO43− ions, ionic strength and pH of the supersaturated solutions from which it precipitates [21]. The solution pH, which is responsible for the relative form of the species, is considered the key factor controlling struvite precipitation, the optimal pH value being over 8.0 [22,23]. However, it should be stressed that from the thermodynamics point of view, it is only supersaturation that matters, which includes all of the above-mentioned parameters. The results and conclusions of studies referring to the effect of each of the individual parameters (pH, or ionic concentrations in the solutions in which struvite precipitated) unless referring to the same solution supersaturation with respect to struvite, are questionable. In the present work, the precipitation of struvite in supersaturated solutions prepared in situ by applying constant current between a low-cost magnesium metal anode and a platinum electrode cathode immersed in ammonium phosphate solutions or synthetic wastewater without initial adjustment of the solution pH using an alkali was investigated. Controlled magnesium dissolution was used as a means to vary the solution supersaturation with respect to struvite.

2. Materials and Methods

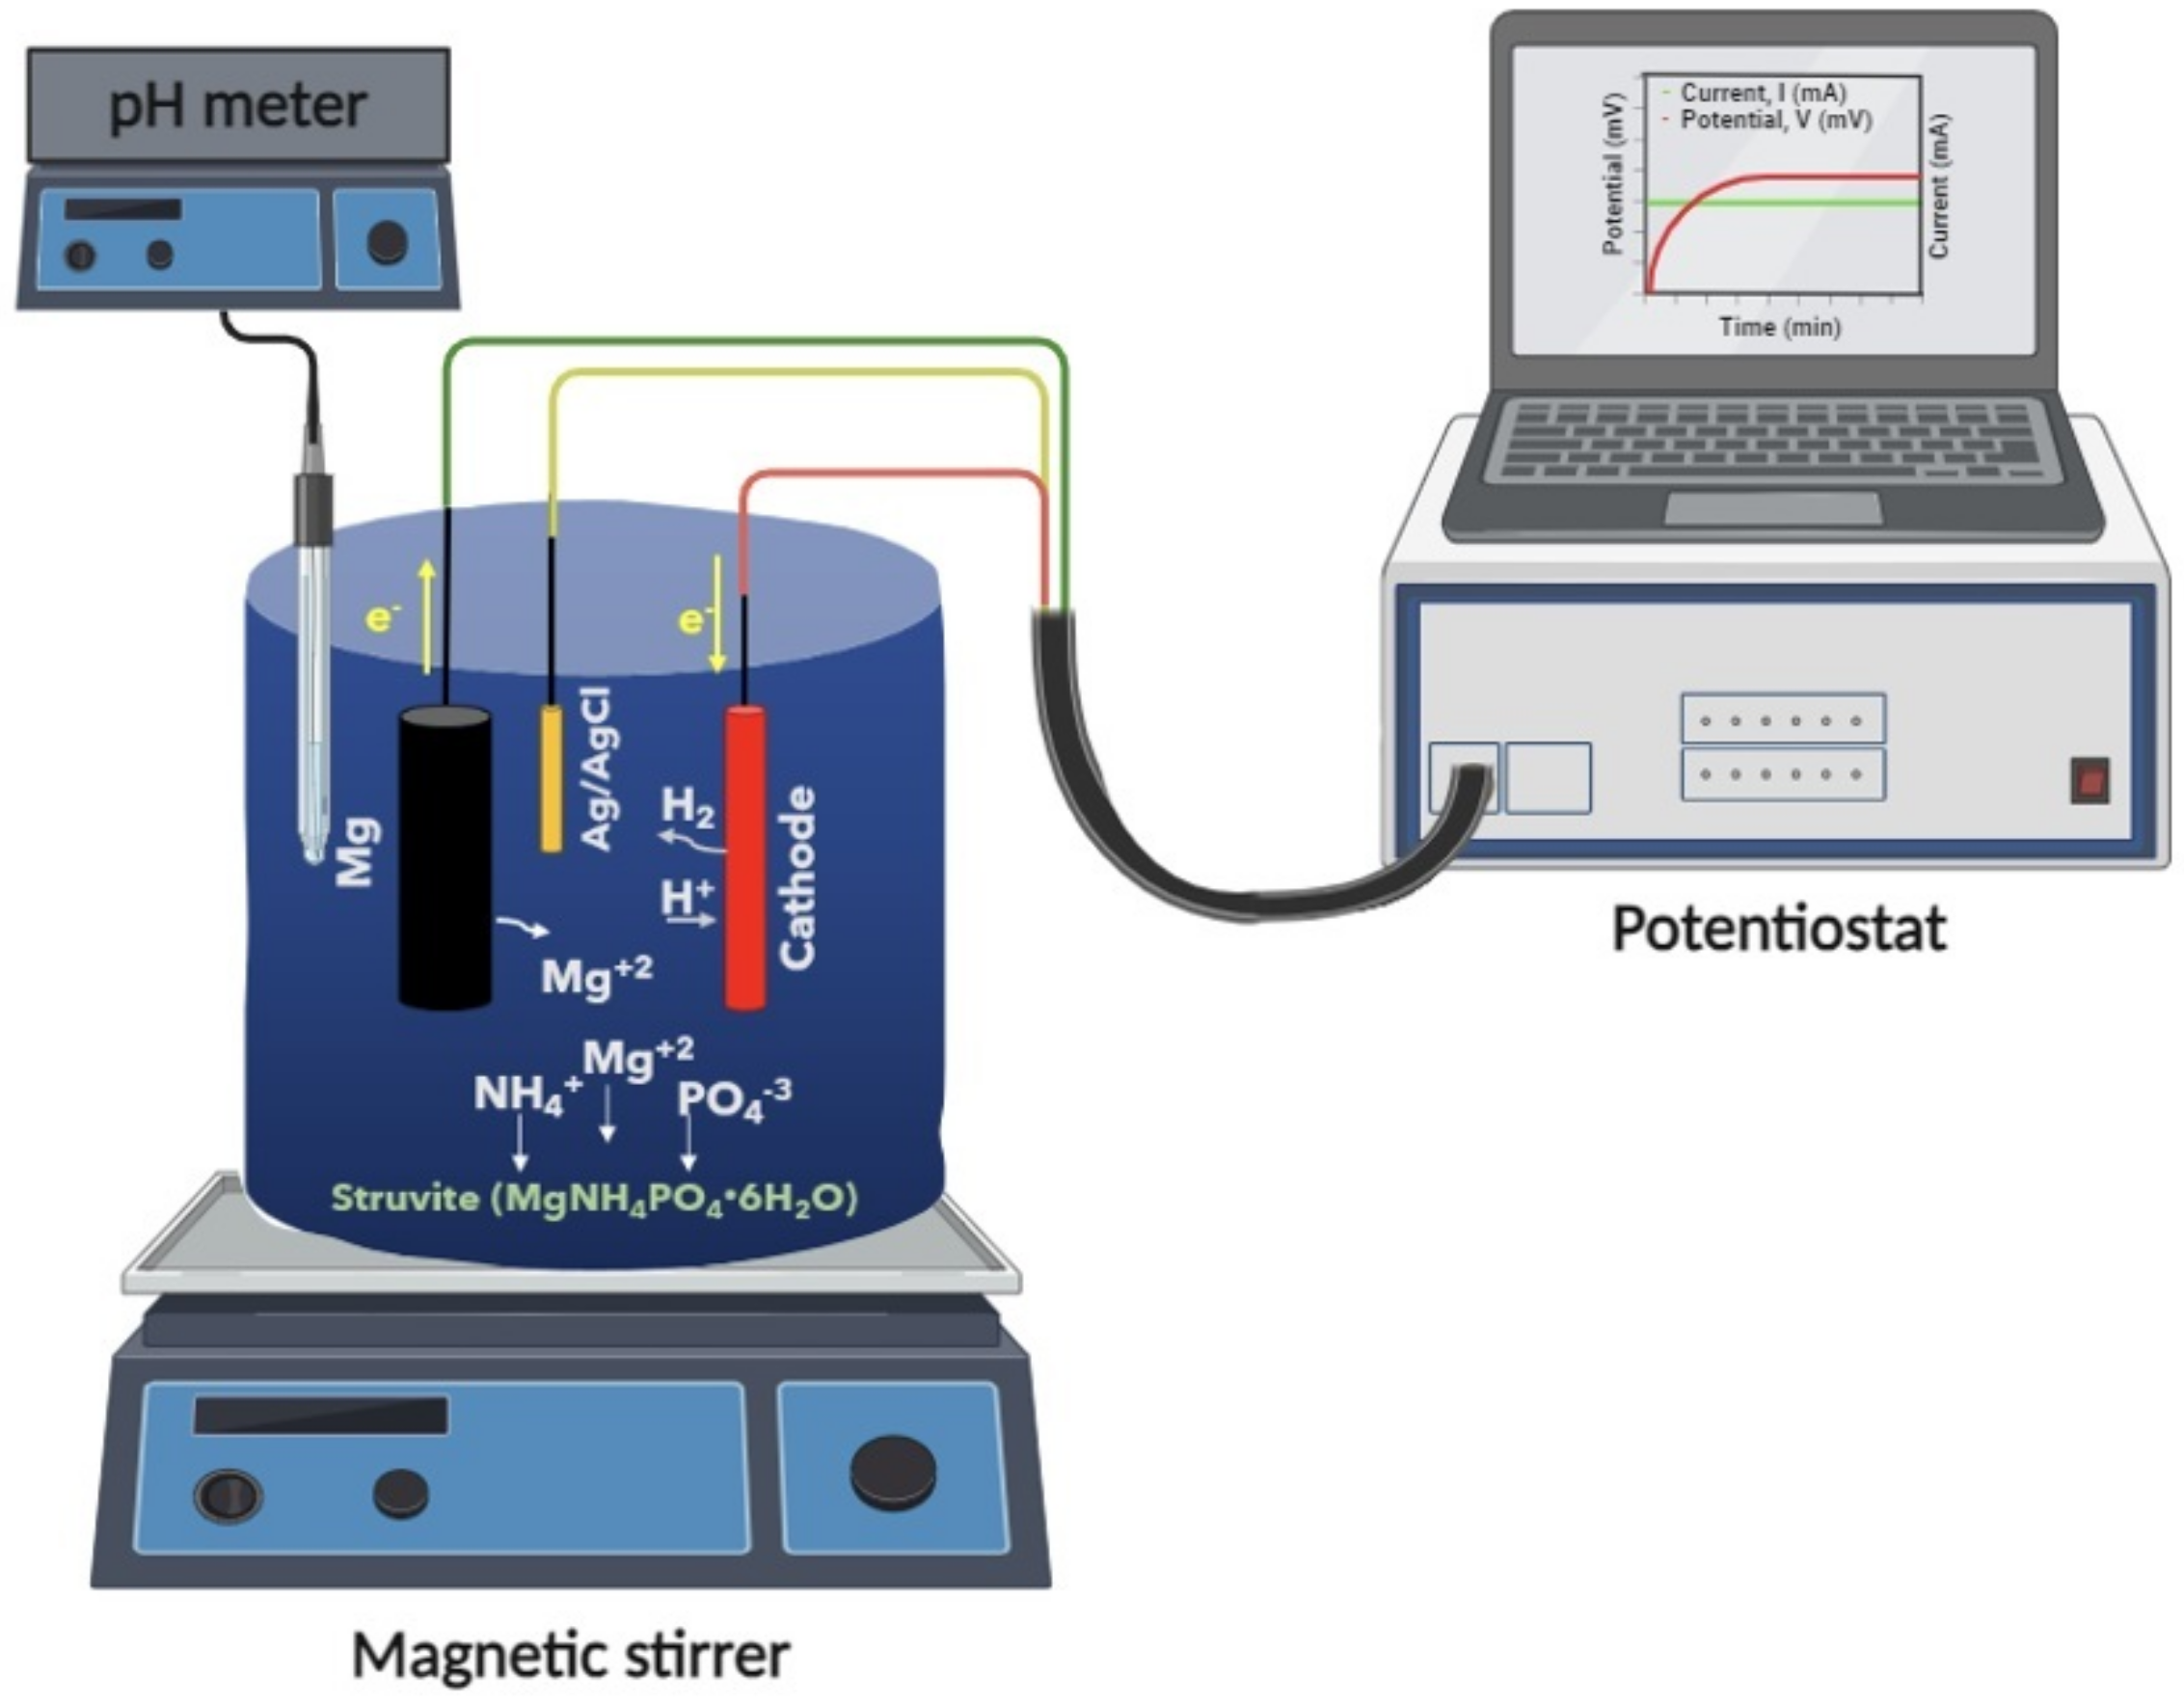
2.1. Experimental Set Up

The experimental setup for the batch electrolysis experiments is shown in Figure 1. The working solution, prepared in a batch Pyrex ® reactor with a total volume of 200 mL, was either sodium chloride (NaCl) or ammonium hydrogen phosphate (NH4H2PO4) solution with NaCl. A cell consisting of a commercial grade Mg anode (total surface 4 cm2) and Pt cathode with a reference electrode (Ag/AgCl) was used. The anode was polished with 1000-grit sandpaper, rinsed with distilled water and dried with acetone prior to use. The constant current density was applied through a Potentiostat over the range of 10 to 100 A·m−2. Samples were withdrawn from the solution and magnesium and phosphorus concentrations were measured, after filtration through membrane filters (0.22 μm). The current applied across the electrodes and the potential developed between the electrodes were recorded from the potentiostat. The solution pH was monitored as well. The release of magnesium was accompanied by a voltage and pH increase. The main assumption was that the magnesium released from the anode may be used exclusively for struvite precipitation.
Simulated domestic wastewater, supersaturated with respect to struvite, was also used as the aqueous medium in which struvite precipitated by the addition of ammonium phosphate solutions and electrochemical generation of Mg by anodic dissolution of the Mg anode in the cell described already. The composition of the simulated wastewater is shown in Table 1. Glucose was added to make up COD to 100 ppm.
After immersion of the magnesium anode in the SWW working solution containing a known concentration of NH4H2PO4, the constant anodic current was applied between the magnesium anode and the platinum cathode. The dissolution of the magnesium anode and the concomitant increase in the respective total magnesium concentration and pH increased the solution supersaturation with respect to struvite to sufficiently high levels to initiate nucleation and growth of struvite crystals.

2.2. Analysis

In all experiments, samples were withdrawn from the reactor at regular time intervals and were filtered through membrane filters (Sartorius 0.2 um). The filtrates were acidified with 0.1 mL of hydrochloric acid (0.1 N) to stop struvite precipitation. The pH of the supersaturated solutions was measured by a pH meter (691 pH meter, Metrohm, Herisau, Switzerland). Voltage and current were recorded from the potentiostat (Potetiostat Galvanostat EDAQ EA 163 with e-corder ED-210). Phosphate concentration in the filtrates was measured with the ammonium molybdate spectrophotometric method [24] using a UV-VIS spectrophotometer (Perkin Elmer, Waltham, MA, USA, Model Lambda 35). The concentration of magnesium was analyzed by atomic absorption spectrometry (Perkin Elmer AAnalyst 300) and complexometric titrations with standard EDTA solution using a calmagite indicator. In the supersaturated solutions, the total Mg: total NH3: total phosphorus ratio was 1:1:1. The relative struvite supersaturation, σs, is defined by Equation (5):
σ s = a M g 2 + α N H 4 + α P O 4 3 K s o 1 / 3 1
where α is the activity of the subscripted ions and K s o is the thermodynamic solubility product of struvite.
The activities of the free ions were calculated from the total concentrations of the main components of the solutions using PHREEQC® equilibrium calculations software, v. 3.3.12.12704 [25]. The relative supersaturation of the solutions in this work was in the range of 0.04 to 1.15. The precipitation of struvite was conducted at a constant temperature of 25.0 ± 0.5 °C in batches in a magnetically stirred reactor.
The theoretical mass of dissolved magnesium during the Mg anode electrode dissolution was calculated as follows (Faraday’s 2nd Law):
m t A t = I × t × M M g n × F
where mt is the is the mass (mg) of total magnesium at time t), calculated from Equation (6). MMg is the molar mass of magnesium (24.3 g mol−1), I is the constant current (A), t is the time (s), F is the Faraday constant (96,485 C mol−1) and n is the number of electrons transferred in the oxidation reaction of the magnesium anode (n = 2 for magnesium).
Measurements of magnesium and phosphate concentrations provided concentration–time profiles, the shapes of which were indicative of the precipitation progress, which after some time, depending on the solution concentrations, almost stopped, reaching very slow growth rates. Next, the precipitated solid, present in the bulk solution and on the Mg anode electrode, was collected by filtration of the solutions past the end of precipitation by filtration and was characterized by powder x-ray diffraction (XRD) (Siemens D-500, Siemens AG, Karlsruhe, Germany, Cu Kα radiation). The morphology of the precipitated solid was studied by scanning electron microscopy (SEM) (LEO SUPRA 35VP, Zeiss Oberkochen, Oberkochen, Germany with a microanalysis probe, BRUKER AXS, Billerica, MA, USA).

3. Results

3.1. Anode Immersion Experiments at Open Circuit Potential (OCP) Conditions

First, the dissolution of the magnesium anode in electrolyte solutions, without current flowing the electrode circuit was measured as a function of time. Moreover, the solution pH variation was measured as a function of time. From the beginning of the immersion of the electrode of the solution, until equilibrium was reached, pH values were between 10 and 11.5, as may be seen in the plots shown in Figure 2. As may be seen, the pH change rate was relatively faster in 10 mM NaCl in comparison with the respective at 1 mM NaCl. In both cases, pH reached plateau values ca. 11 for 1 mM and ca. 11.5 for 10 mM NaCl at 25 °C. The behavior is typical for the dissolution of alkaline earth metals dissolution in water:
M g s + H 2 O l M g O H 2 s + H 2 ( g )
The formation of Mg(OH)2 (s) on the surface of the polished Mg electrode was identified by XRD analysis of the surface of the electrode. The alkaline pH of the solutions is apparently due to the formation of the hydroxide which is next equilibrated with water:
M g O H 2 s + H 2 O l M g 2 + + O H
Both reactions given by Equations (7) and (8) proceed rather slowly, which may explain the pH time profiles shown in Figure 2.
pH increase with time, was indicative of the metal dissolution process, as a result of which the electrolyte solutions in contact with the magnesium anode at OCP were enriched with respect to magnesium. The presence of increasingly higher magnesium concentrations with time was confirmed from the measurements of total magnesium concentration in the electrolyte solutions. The respective profiles are shown in Figure 3. Measurements showed that the (initial) dissolution rate in the 10 mM NaCl solution was R1 = 4.12 × 10⁻⁷ mol·min−1, and for 1 mM NaCl, it was R2 = 3.10 × 10⁻⁷ mol·min−1. Dissolution of magnesium reached a plateau corresponding to a quasi-equilibrium state.

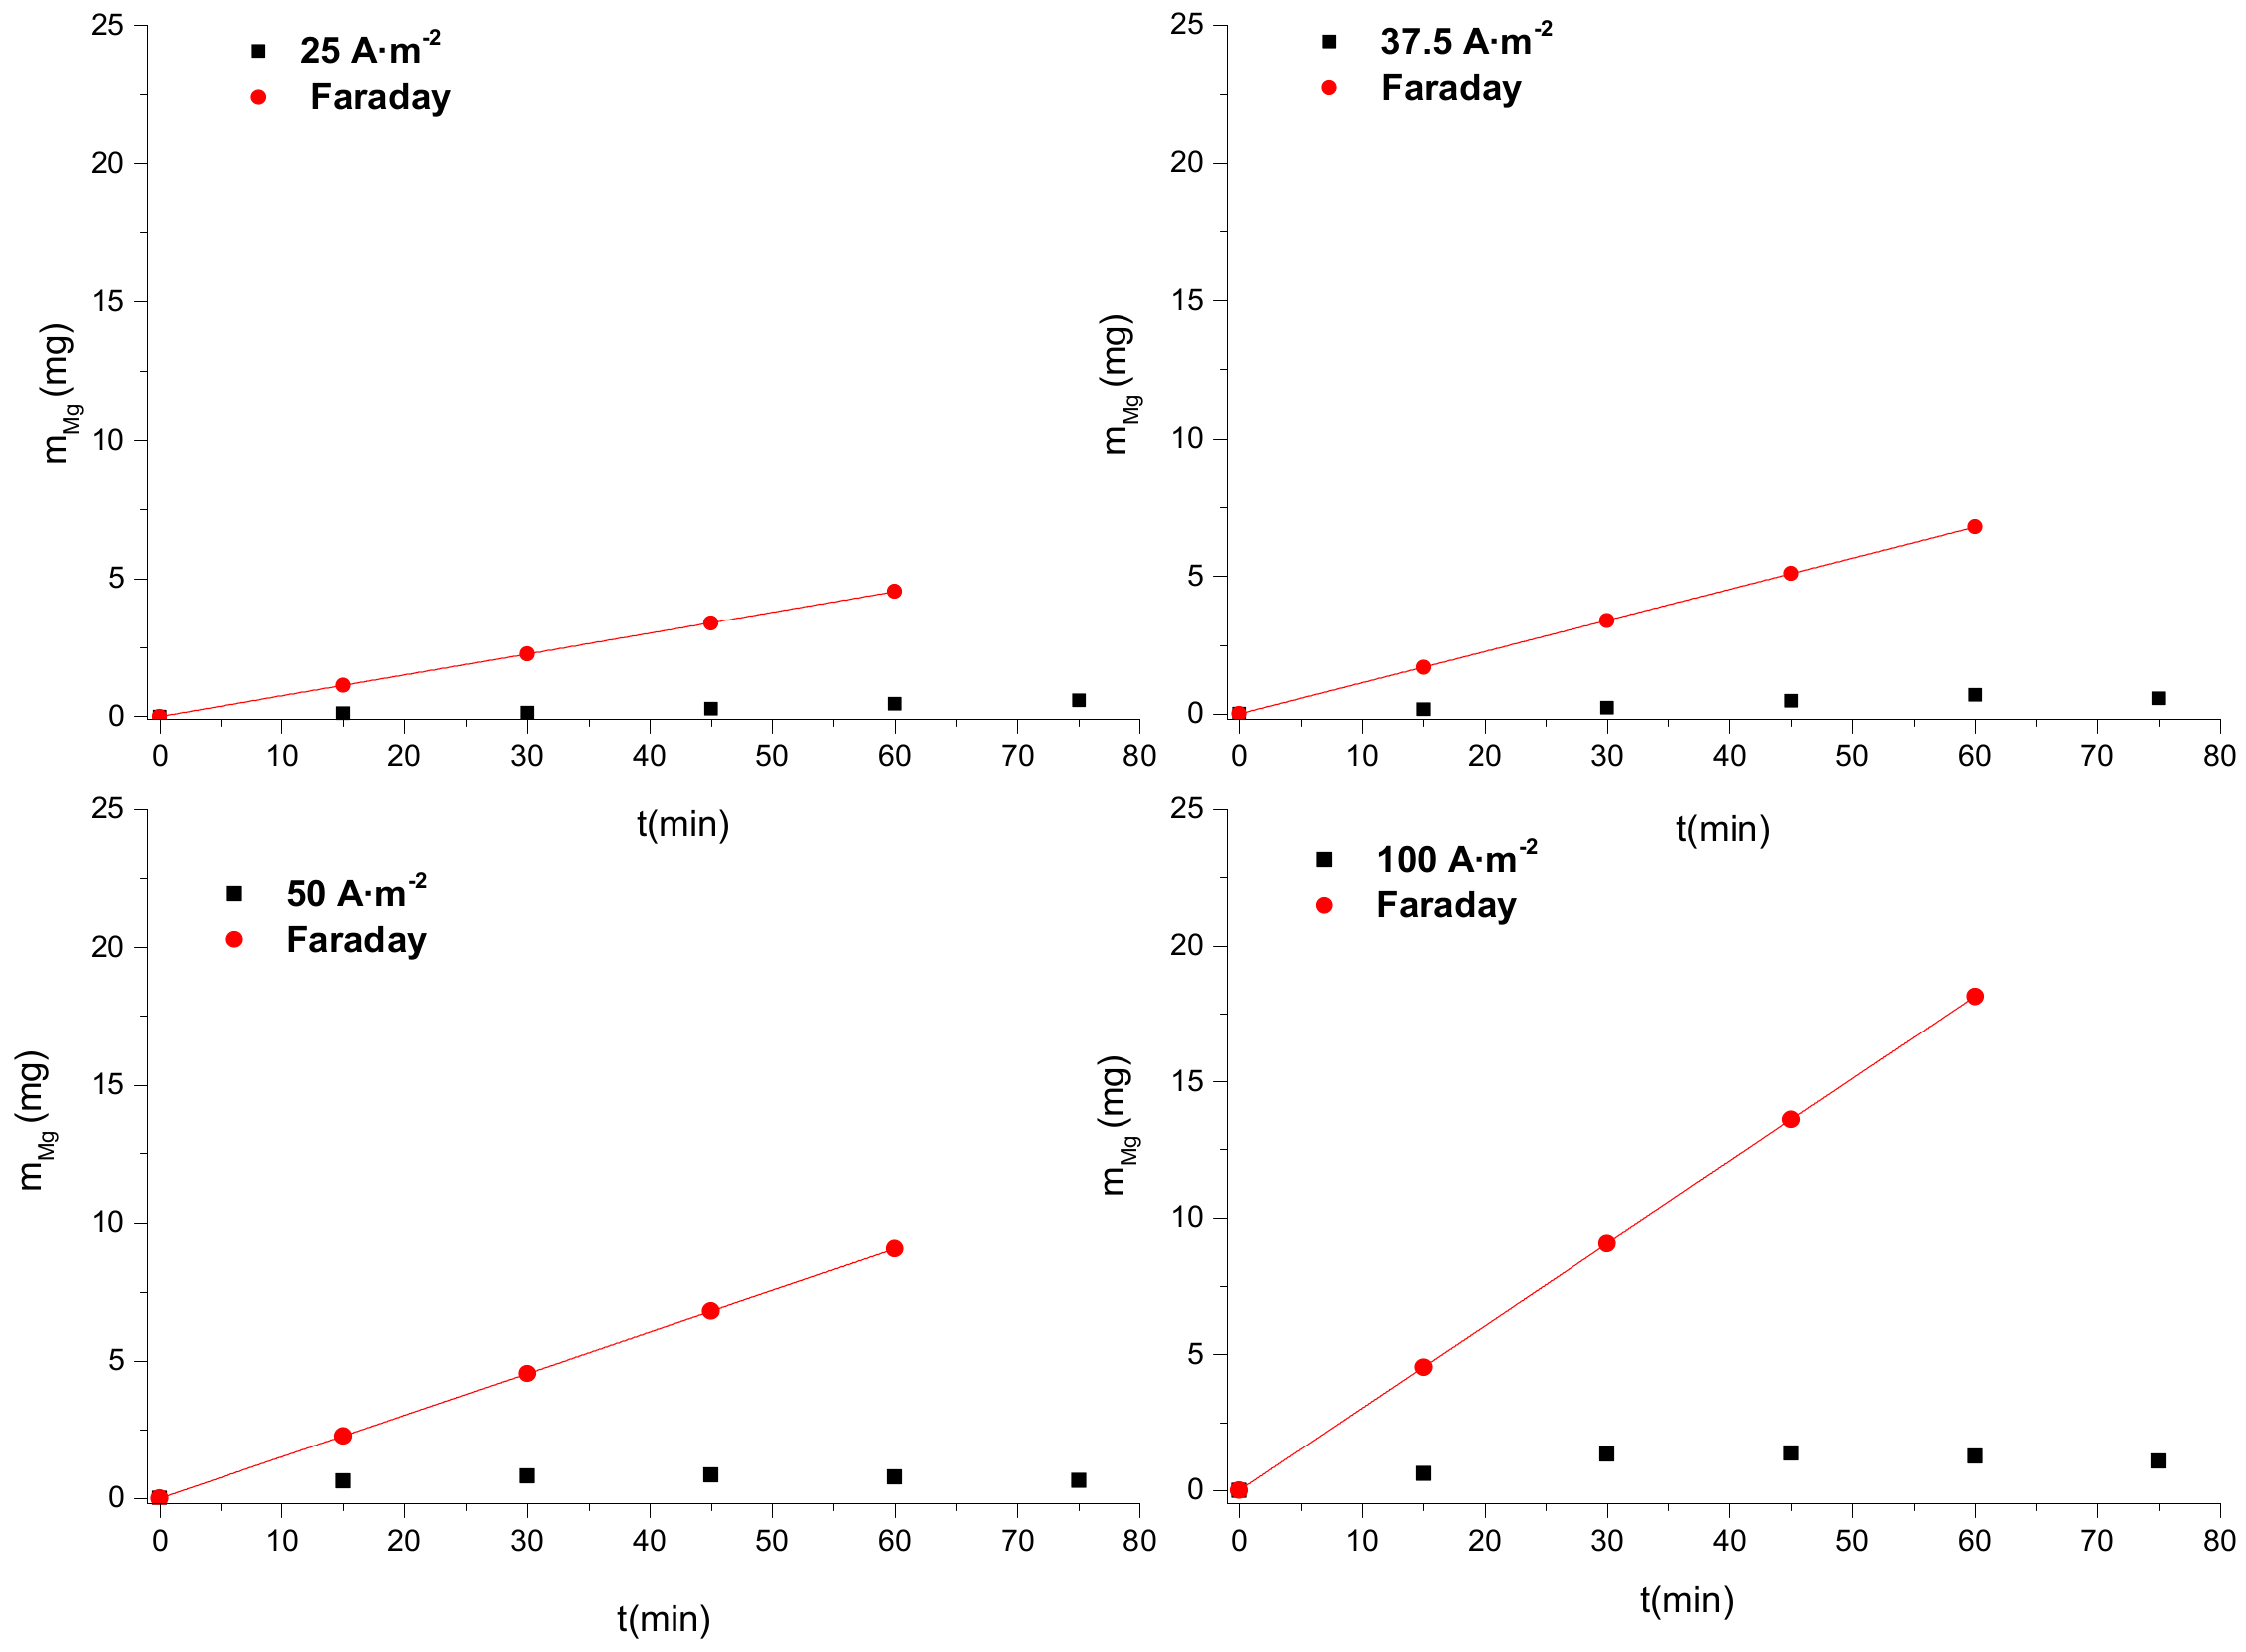
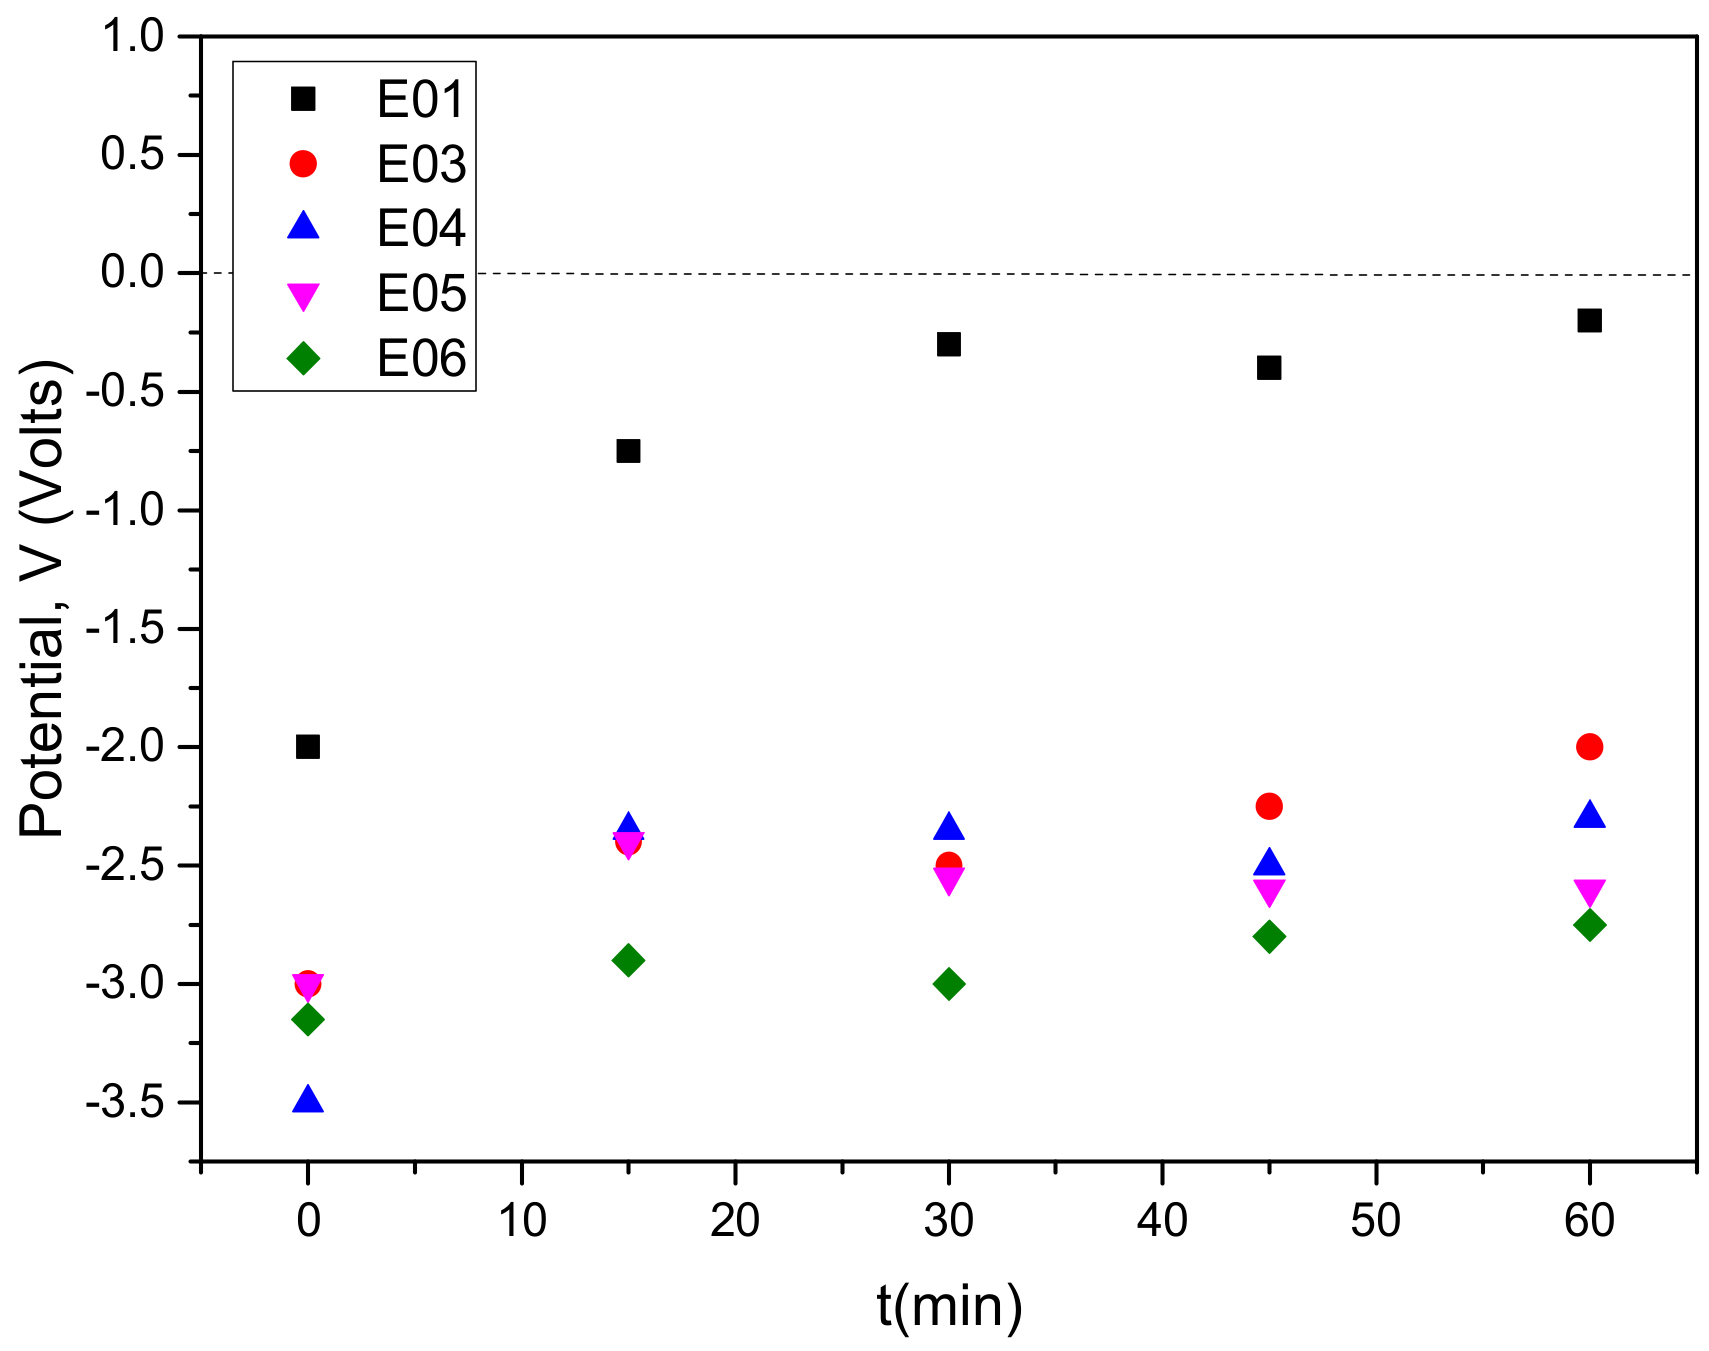
3.2. Constant Current Dissolution of Mg Anode

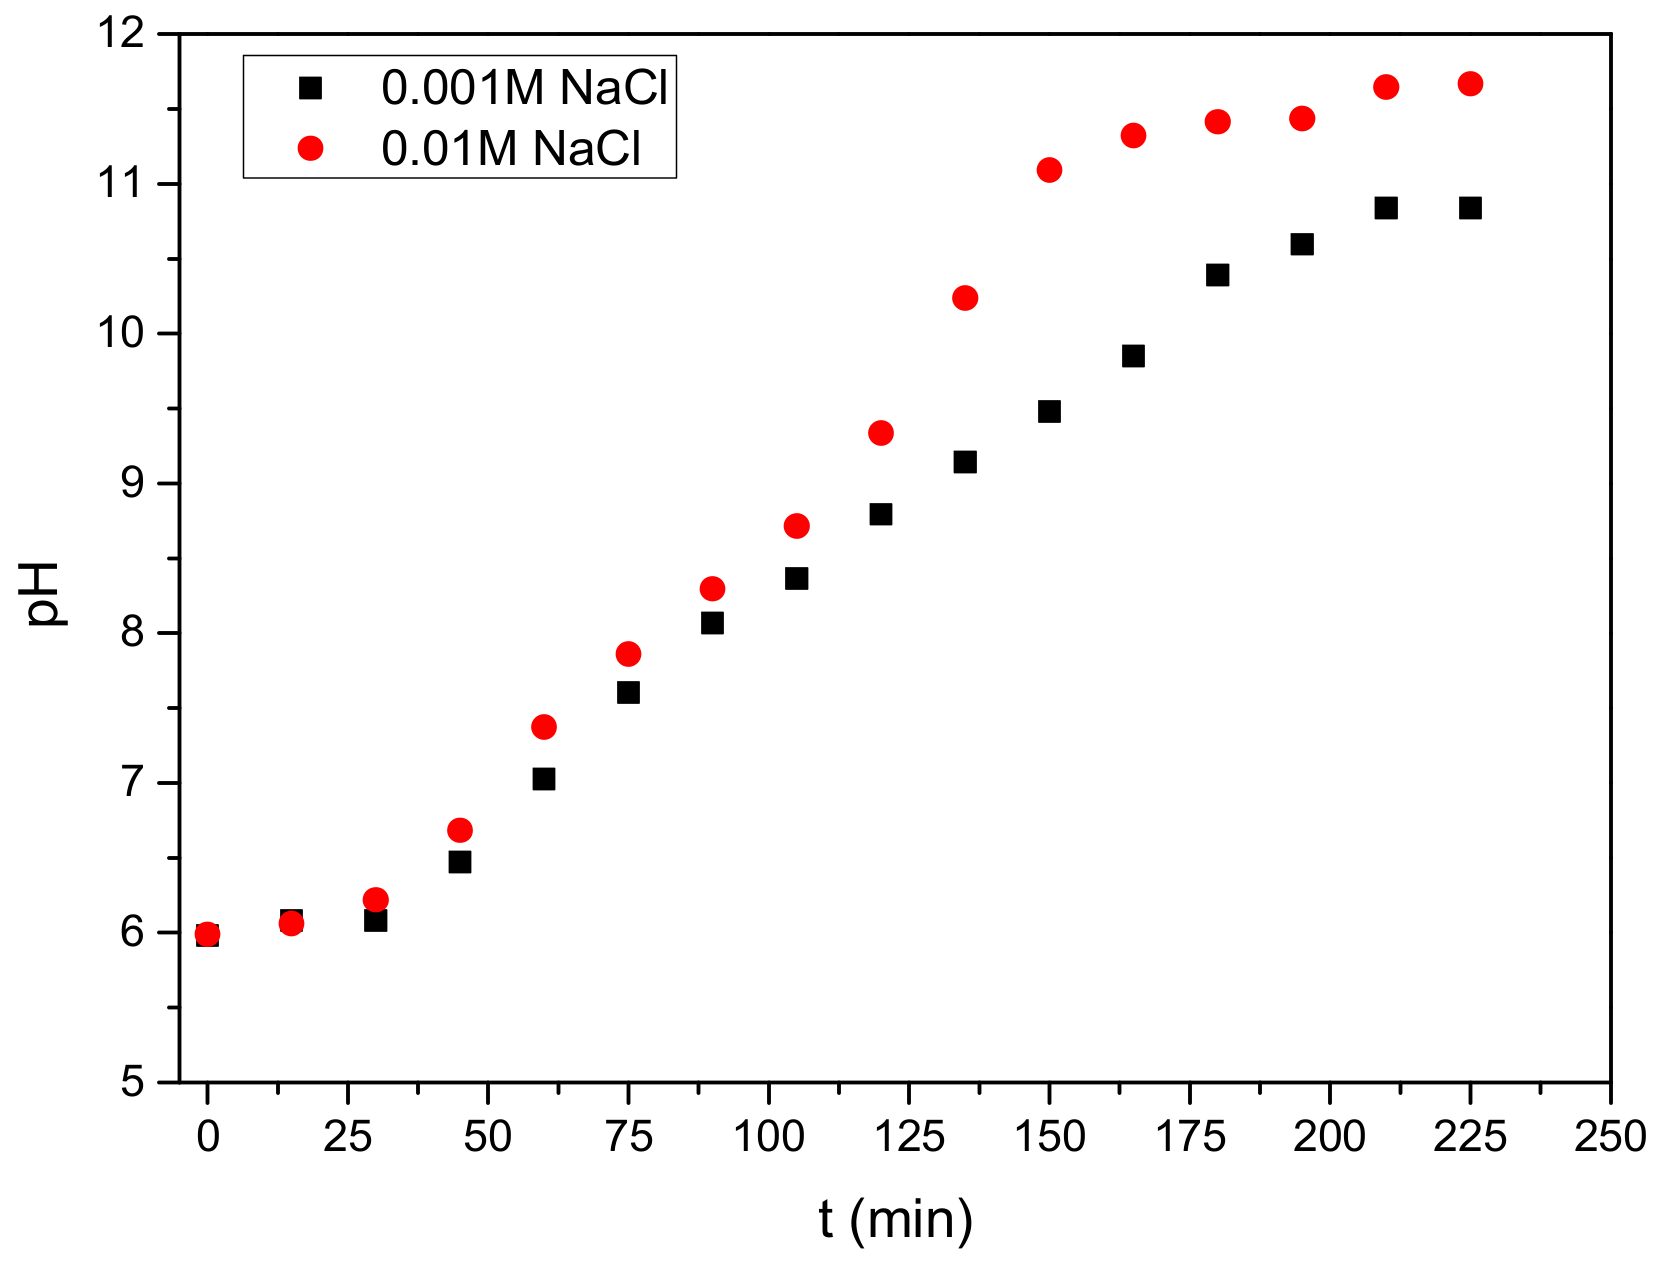
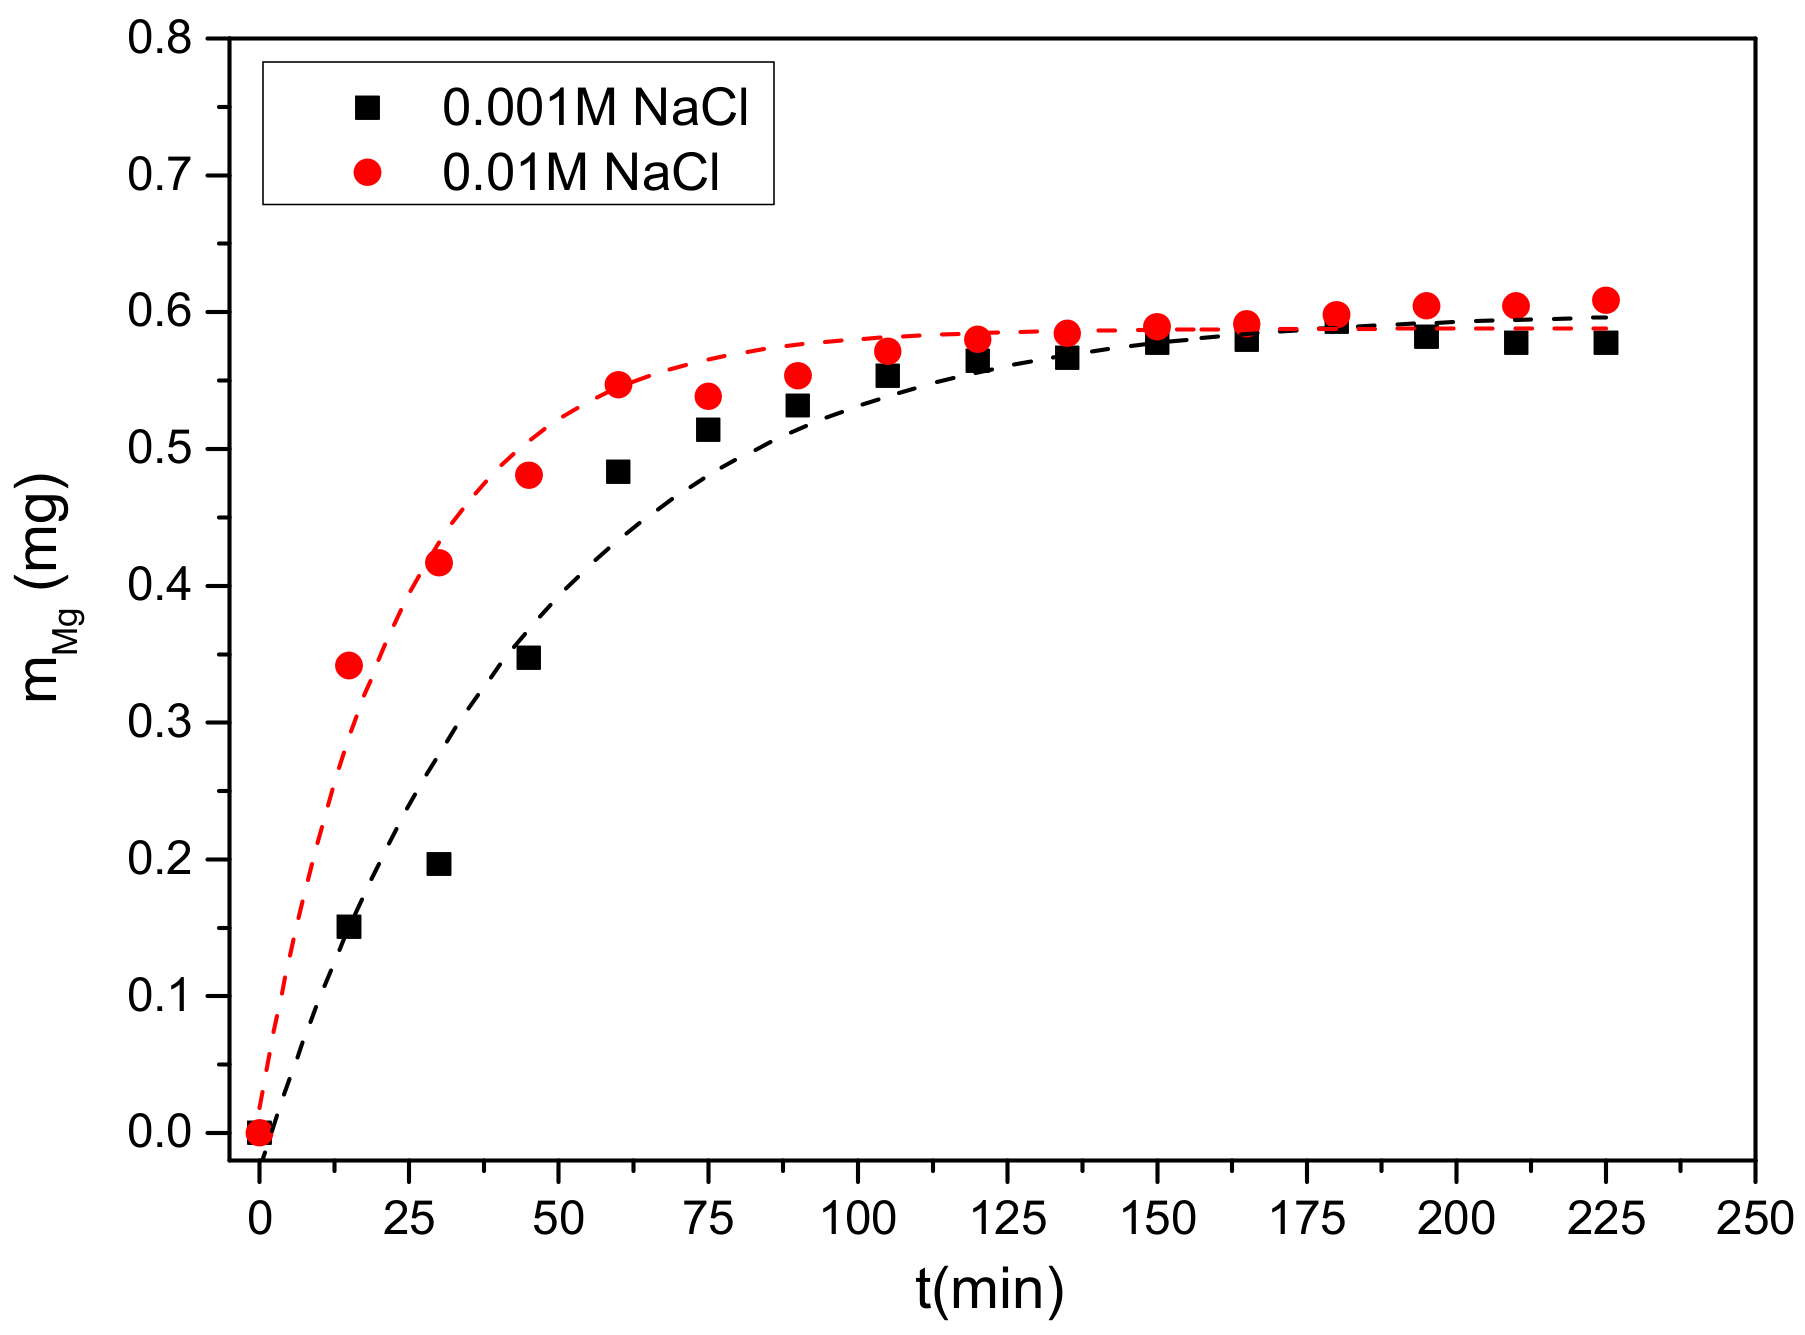
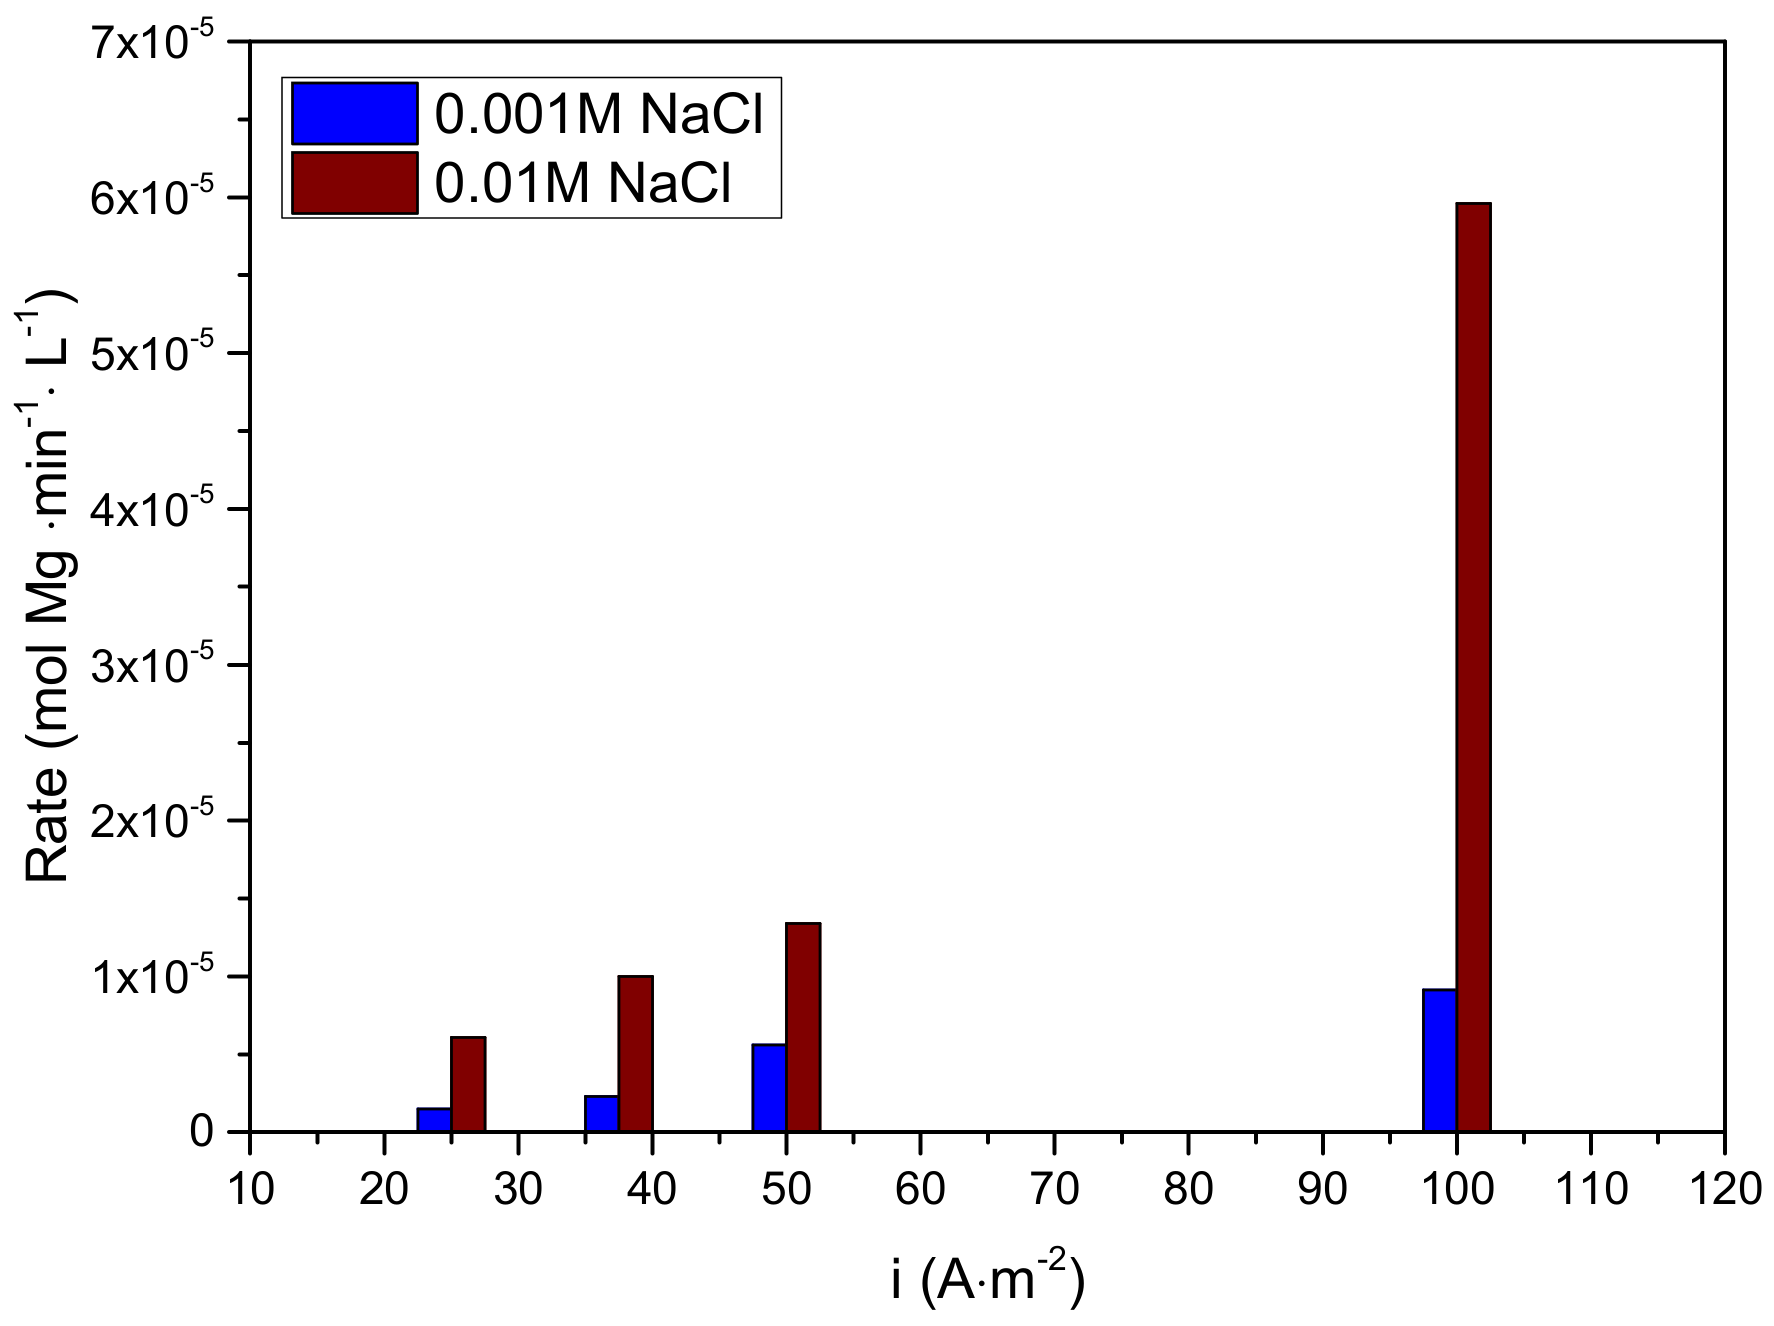
3.2.1. Electrolyte Concentration Effect

The dissolution of Mg anode applying different current densities was investigated in 1 mM and 10 mM NaCl electrolyte solutions and the results are shown in Figure 4 and Figure 5. The dissolved mass of magnesium was much lower than the theoretically calculated mass (Equation (6)), i.e., the deviation from the Faradaic behavior was high, ca 60% for the 1 mM NaCl solution and ca. 90% for the 10 mM NaCl solution. It was observed that as the current density applied increased, the deviation from the theoretically calculated value was smaller. Magnesium added in the solution by anodic dissolution was significantly higher only upon application of anodic current density equal or exceeding 100 A·m−2 for 1 mM NaCl concentration.
In 10 mM NaCl, the current efficiency was 100% only for current density 100 A·m−2. At lower current density (25.0, 37.5 and 50.0 A·m−2), the magnesium dissolved was more than twice the concentration in the solution present because of the metal dissolution at OCP. From the plots of magnesium released by anodic dissolution as a function of time, the initial rates of dissolution were computed for each current density for 1 and 10 mM NaCl electrolyte solutions. The results are shown in Figure 6.

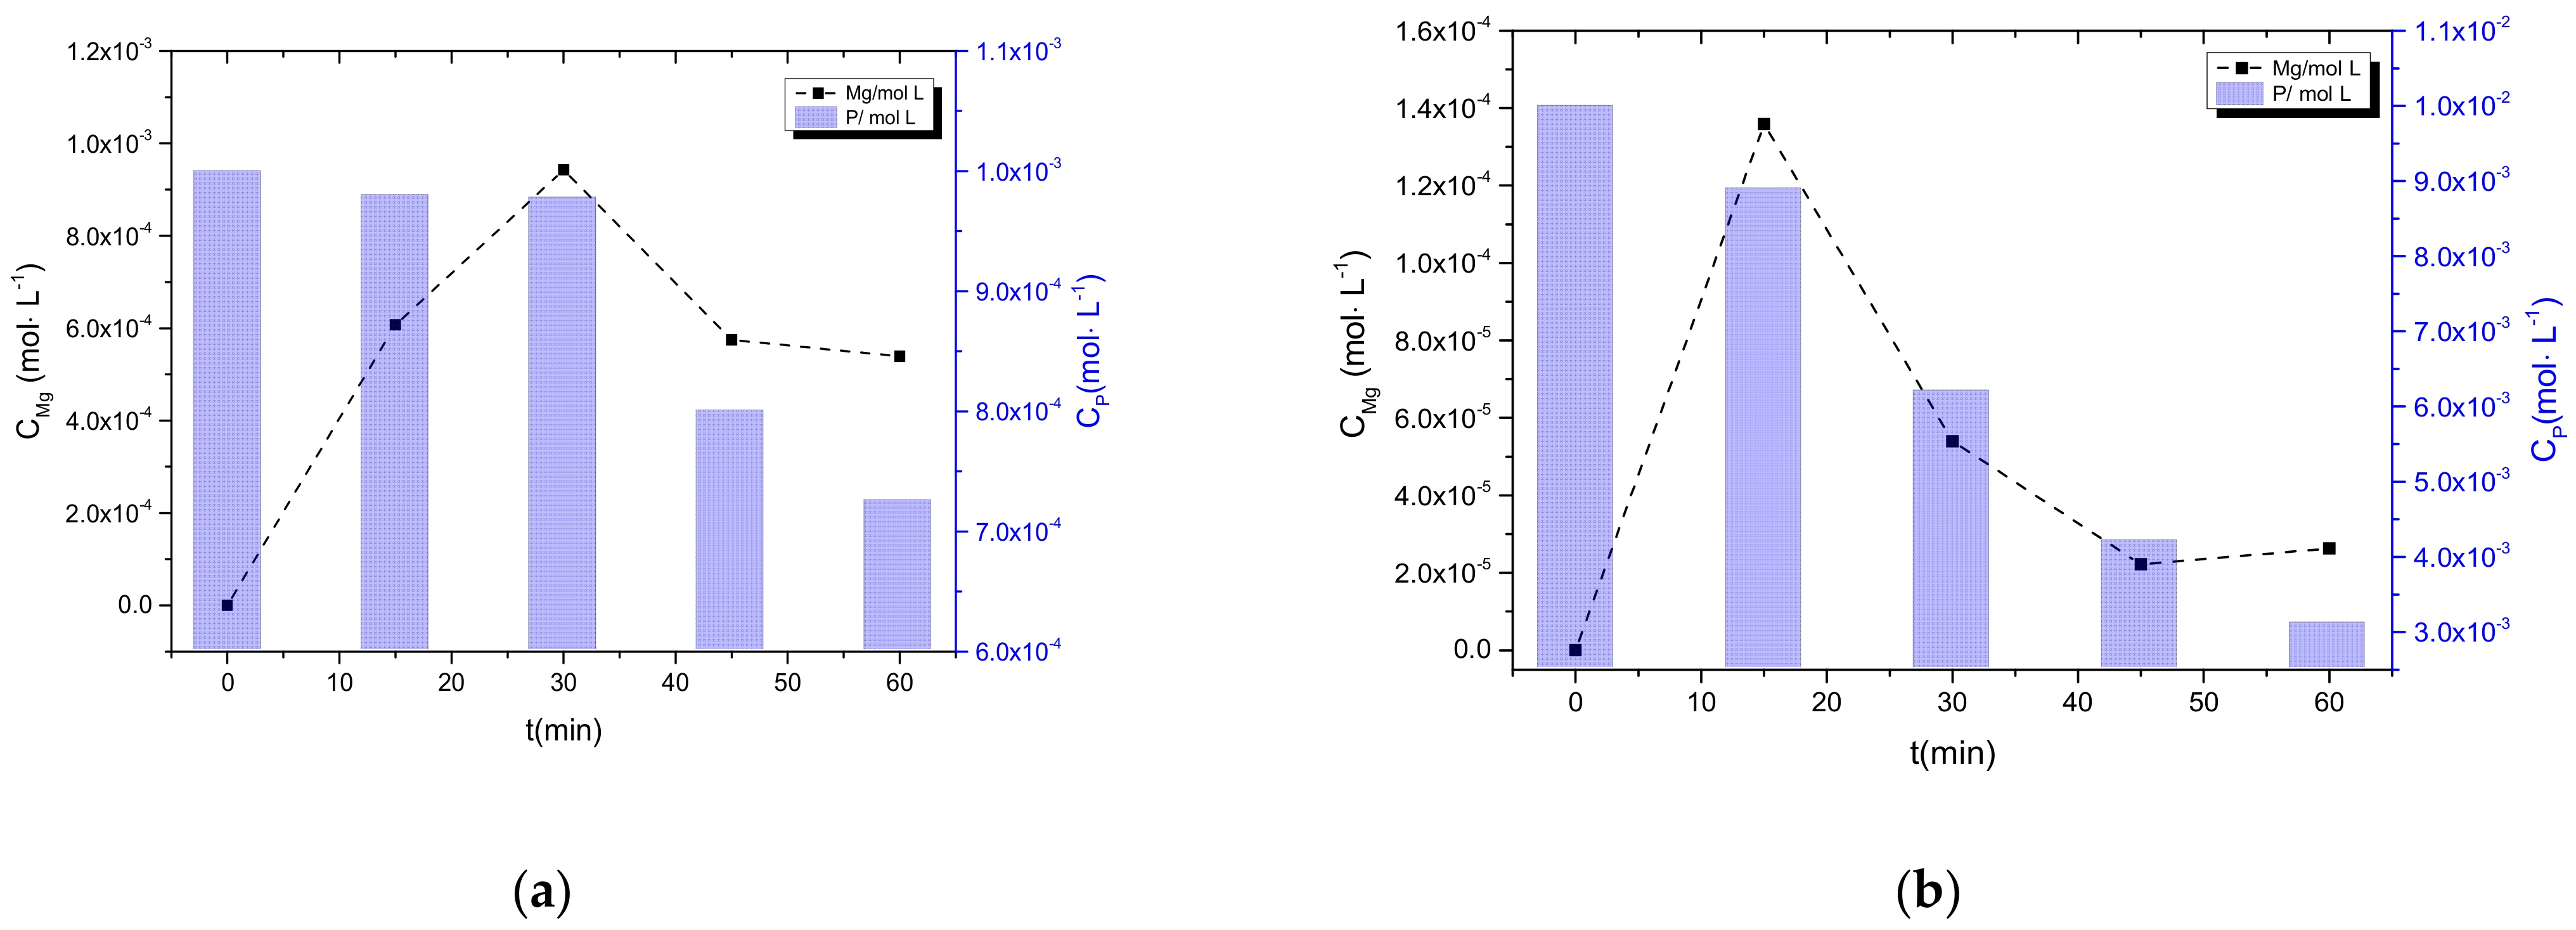
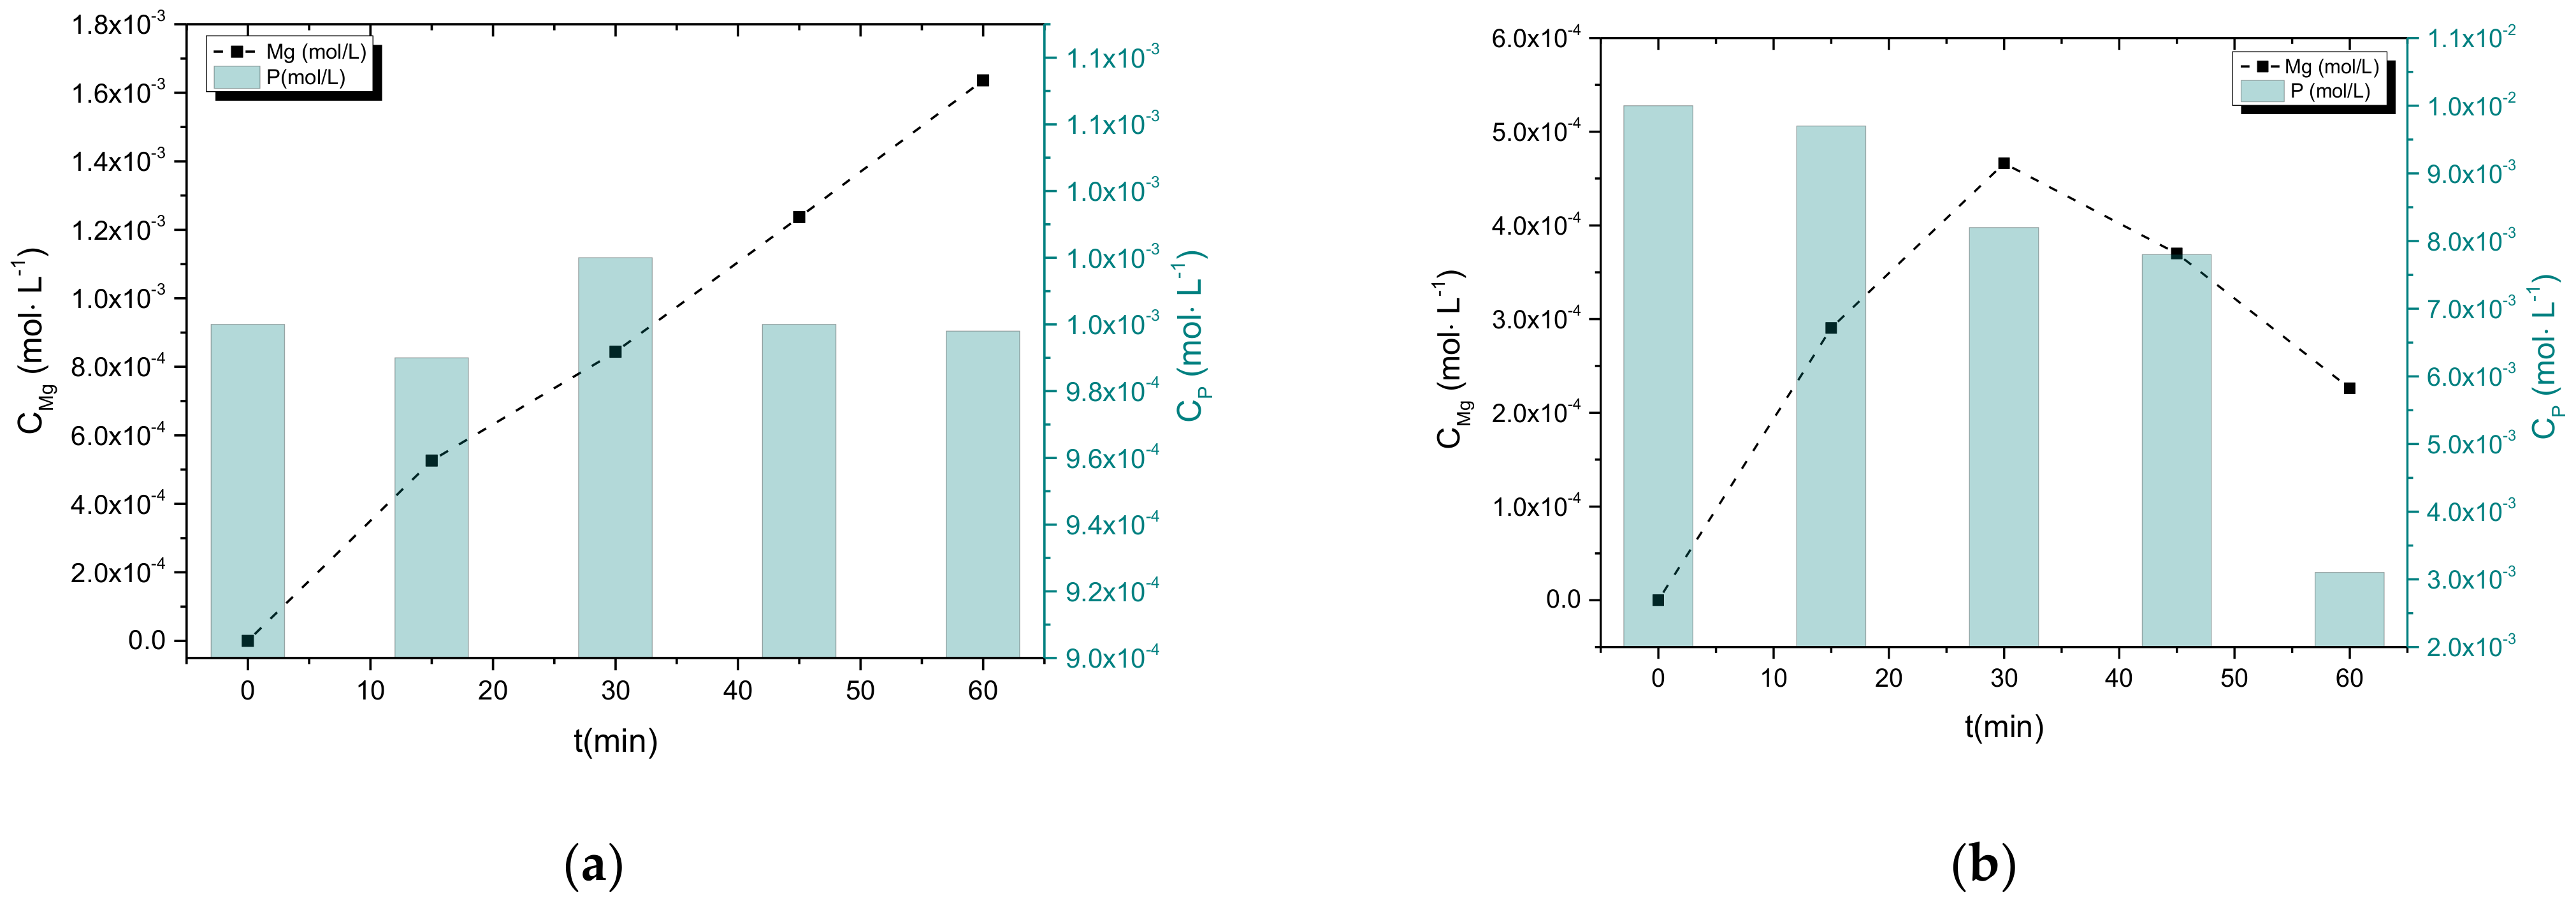
3.2.2. Precipitation in the Presence of NH4H2PO4

The first series of measurements of the kinetics of struvite precipitation refer to the precipitation of struvite from solutions with different NH4H2PO4 concentrations, which became supersaturated past magnesium anode electrodissolution. The measured concentration of magnesium and phosphate ions in the solution is presented in the graphs in Figure 7.
In both cases, it is observed that initially, the concentration of magnesium increases in the solution due to the electrodissolution of the Mg anode and then decreases due to its consumption by phosphate and ammonium ions to form struvite based on the reaction (Equation (1)). On the contrary, the concentration of phosphates until a certain time (equal to 30 min for lower initial concentrations and equal to 15 min for higher initial concentrations) decreases. At the same time, in the working solution, after specific time intervals (15 min or 30 min), once a maximum magnesium concentration in the electrodissolution process sufficient to make the solution supersaturated with respect to struvite was reached, the precipitation of struvite started at a certain level of relative supersaturation with respect to struvite (0.04 and 1.15 for 1 mM and 10 mM ammonium phosphate, respectively. The concentrations and relative supersaturated values in between these values are shown in Table 2). This is evidenced by the drop in total phosphate concentration in the solution. These findings underline the importance of supersaturation as the determining factor for the initiation of struvite precipitation and not the ratios of the reactants in the supersaturated solutions, as is very often mistaken in the relevant literature.
Defined as induction time preceding the onset of spontaneous struvite precipitation, the time lapsed before both magnesium and phosphate concentration started decreasing in the working solutions; the values of initial relative supersaturation were calculated for all experiments using the measured magnesium and phosphate concentrations using the equilibrium speciation software PHREEQC® [25], provided that the stoichiometry of the solid forming was Mg:NH3:P = 1:1:1. The rates of spontaneous struvite precipitation were also calculated based on the decrease in phosphate concentration in the solutions, which is presented in Table 2.
The rate of struvite precipitation from supersaturated solutions is a function of relative supersaturation described by the semiempirical law:
R P S = k S σ s t r u v i t e n
where ks is the apparent rate constant, and the exponent n, the apparent order of the precipitation of struvite, usually an integer, is indicative of the dominant mechanism of the precipitation from the corresponding supersaturated solutions [26].
The dependence of the initial rates of struvite precipitation as a function of the relative supersaturation, σstruvite, for the first series of precipitation experiments is presented in the plot in Figure 8. The high order dependence of the rate on the relative supersaturation (n = 3 ± 0.4) suggested that the rate-determining step is surface diffusion of the struvite growth units on the crystallites formed. The apparent rate constant was calculated as ks = 8.19 × 10⁵ mol min1.
A comparison of struvite precipitation rate from supersaturated solutions with respect to struvite, using magnesium from the electrodissolution of the respective metal anode, brucite (from hydrothermal treatment of MgO) [27], magnesium chloride [28] and magnesium sulfate [29] as a source of magnesium in the respective solutions, is shown in Figure 9. As may be seen, magnesium originating from the Mg anode dissolution yielded the highest rates of struvite precipitation for the same relative supersaturation. This, in turn, suggested that at given conditions, making up the supersaturated solutions by electrochemically dissolved Mg, originating from the anode of the cell used, resulted in more efficient phosphorus recovery.
In Table 3, the apparent order and the rate constant are presented (Equation (9)), calculated for different sources of magnesium ions for supersaturation achievement.
In all cases of different magnesium sources, the apparent order is n > 2, so the polynuclear model of crystal growth predominated in the mechanism underlying the formation of struvite crystals. The differences between the kinetics parameters were due to the different magnesium sources.
During the dissolution of magnesium and the subsequent struvite precipitation, the potential between the electrodes at the constant current applied was also measured (Figure 10). As shown, past 15 min or 30 min, for higher or lower initial phosphate concentrations in the working solution, respectively, the potential showed very little changes (almost constant). However, this does not indicate that electrodissolution stopped but that the precipitation process that begins seems to overcome the first process (also seen by the high rate). Furthermore, this small change in potential with time could also be attributed to the development of a solid film on the surface of the anode Mg electrode, which could inhibit further electrolysis of the magnesium anode, possibly because of passivation [30]. Further investigation of the parameters (current and potential) of the electrochemical process is needed for optimizing P recovery.
Mg entering the solutions by electrodissolution was calculated from the reduction in the phosphate concentration in the solution (Equation (10)) following the termination of the precipitation process. Phosphorus removal from the supersaturated solutions was calculated from Equation (10).
P h o s p h o r u s   r e m o v a l   % = P i n i t i a l P f i n a l P i n i t i a l × 100
where Pinitial and Pfinal are the initial and final phosphorus concentrations in the supersaturated solutions, respectively.
The phosphorus removal from the supersaturated solutions at different supersaturations with respect to struvite is presented in Figure 11. It is shown that the removal of phosphorus reached 65% corresponding to the solution with the highest initial relative supersaturation with respect to struvite (σstruvite = 1.15).
The solid precipitated from the supersaturated solutions used as a magnesium source. The magnesium derived from anode electrode electrodissolution consisted of hydrated phases of magnesium ammonium phosphate (NH4MgPO4·6H2O, struvite or NH4MgPO4·H2O, dittmarite) at higher relative supersaturation. However, for lower relative supersaturation, the formation of magnesium hydroxide was identified as well (Mg(OH)2, brucite). This was due to the higher rate of Mg2+ production from electrodissolution in comparison with the phosphate and ammonium consumption rate for struvite formation, resulting in the additional Mg(OH)2 precipitation. XRD patterns of the precipitates obtained (Expts. # E06 and E01) and of the standards are shown in Figure 12. The formation of MgO on the Mg electrode is also believed to take place because of the passivation of the electrode [30].
The morphology of the precipitated solid was characteristic of struvite with the crystallites size ranging from 10 to 20 μm, as shown in the SEM pictures in Figure 13.
In some cases, especially for experiments at high values of relative supersaturation ratio for struvite, the solid was also formed on the surface of the magnesium anode electrode. SEM photos of these solids are presented in Figure 14 below, where struvite was also identified with characteristic morphologies of flattened, plate-like crystals with an average size of 40 μm.

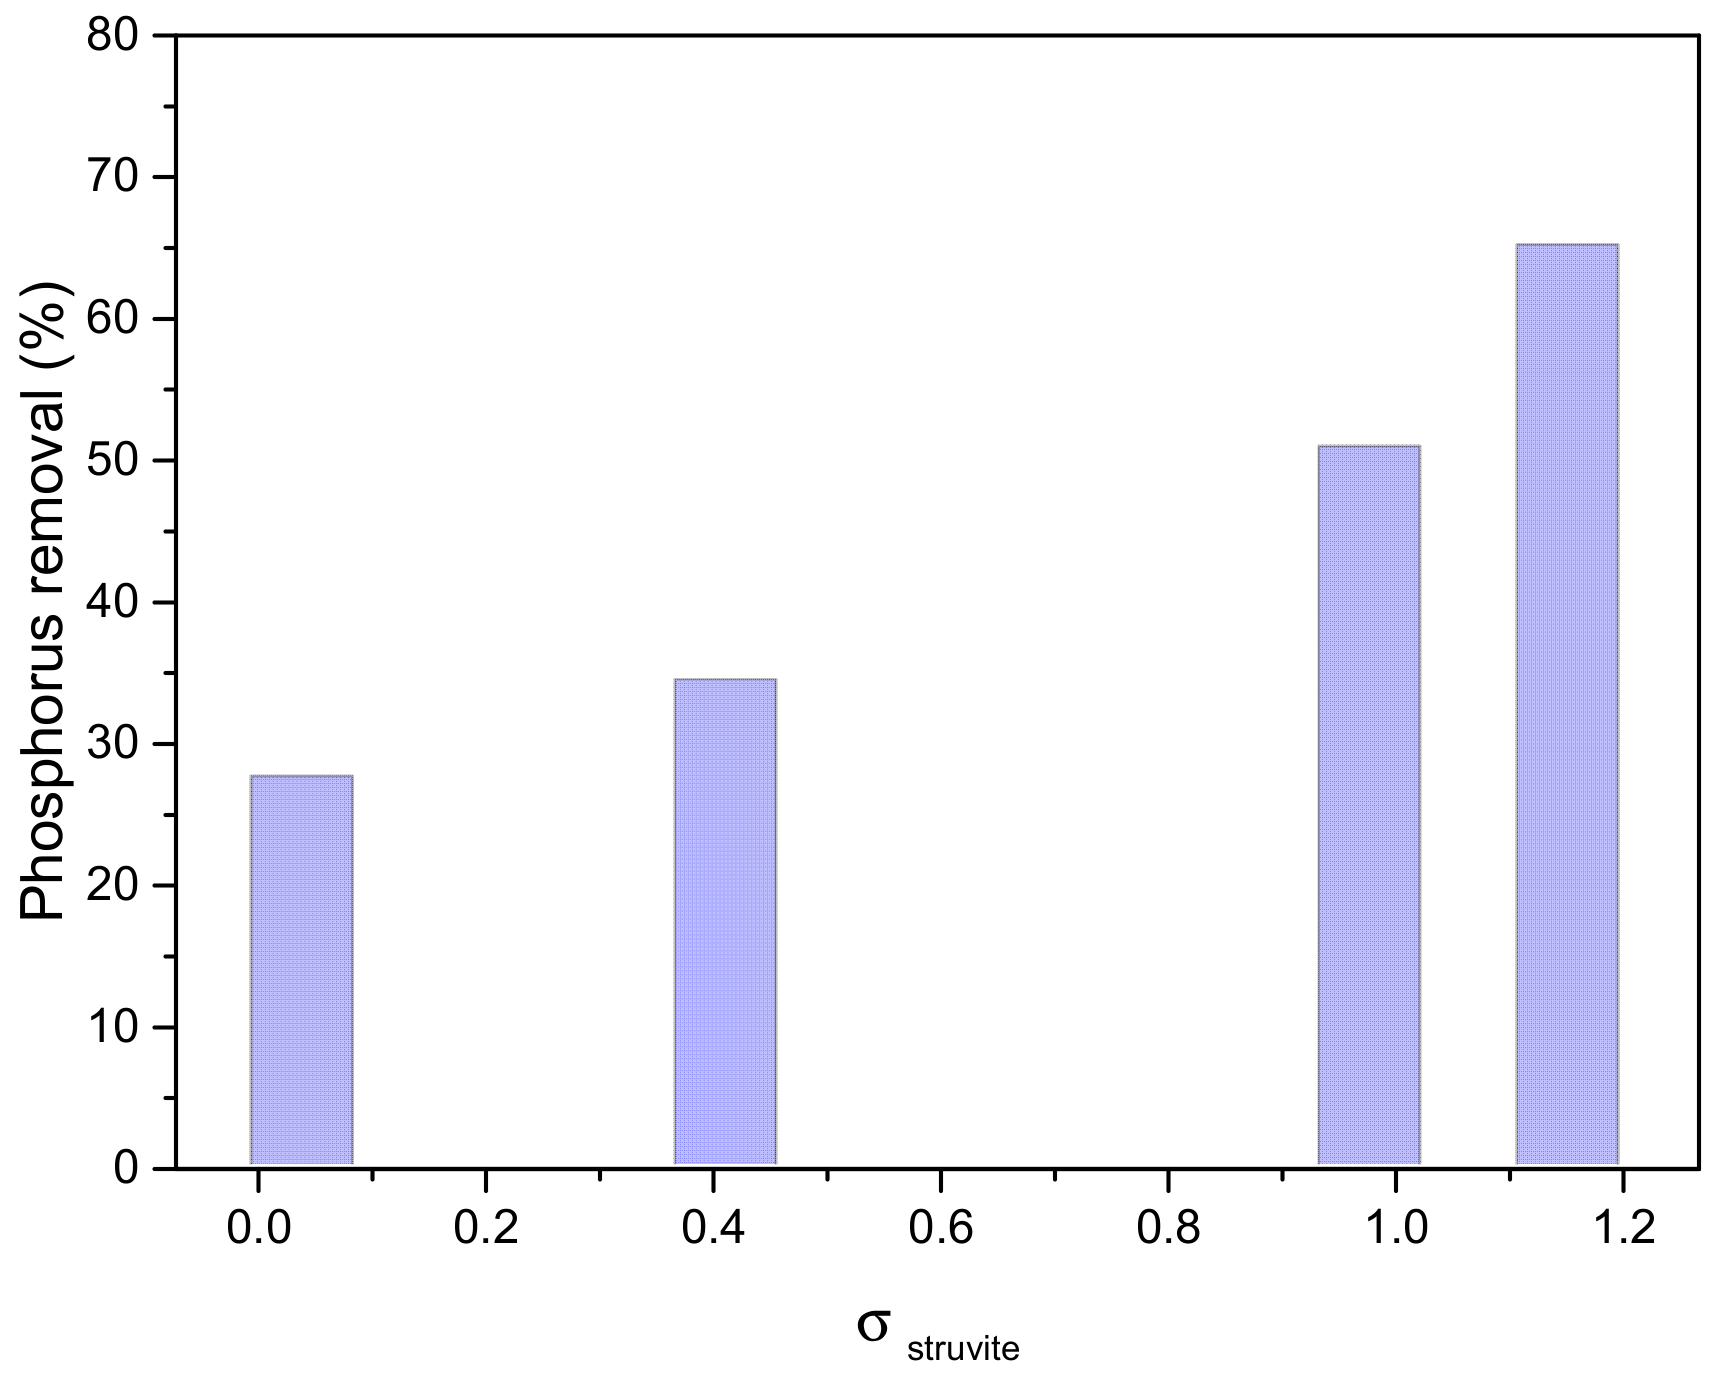
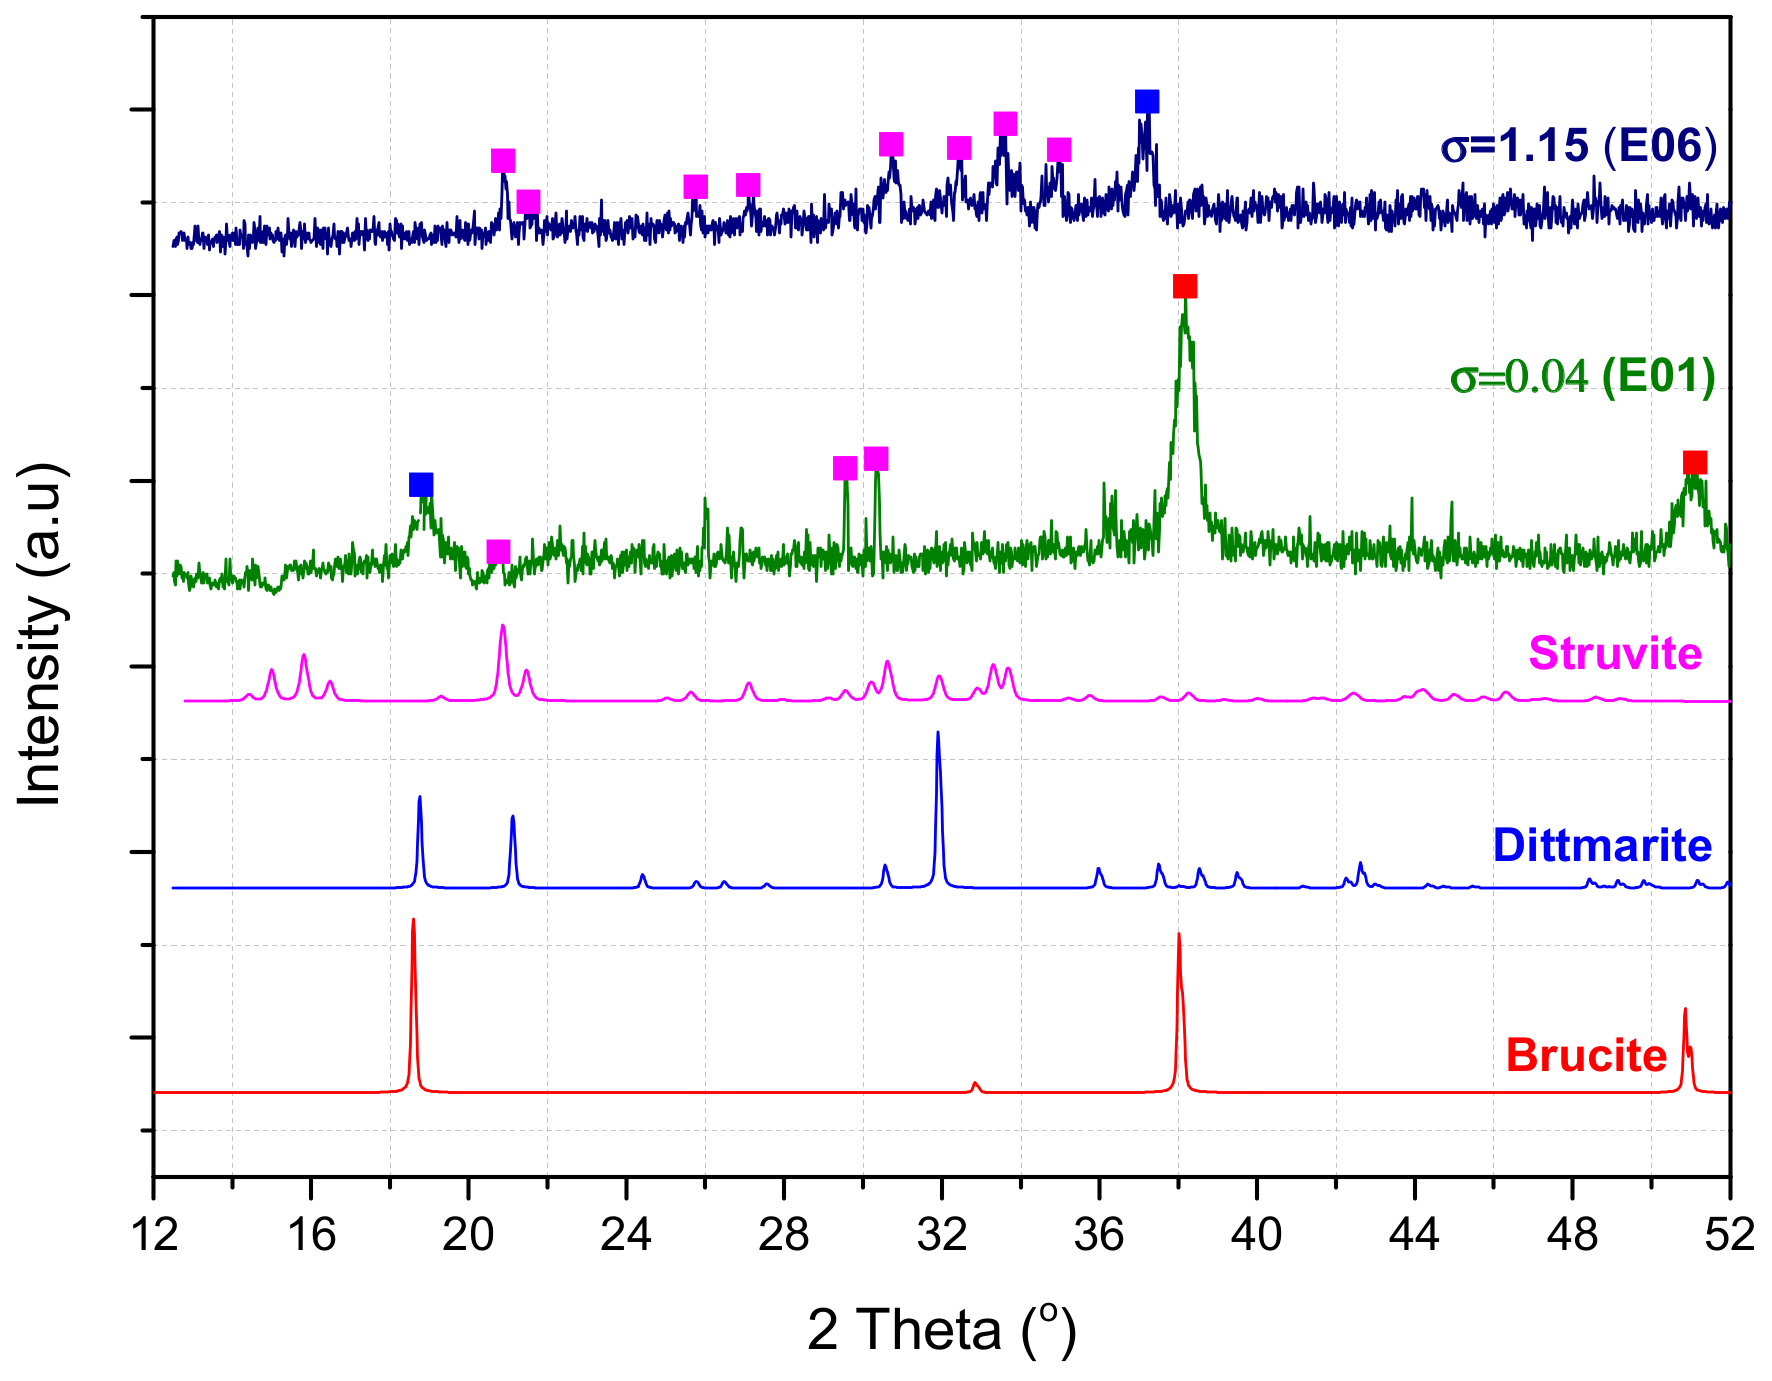
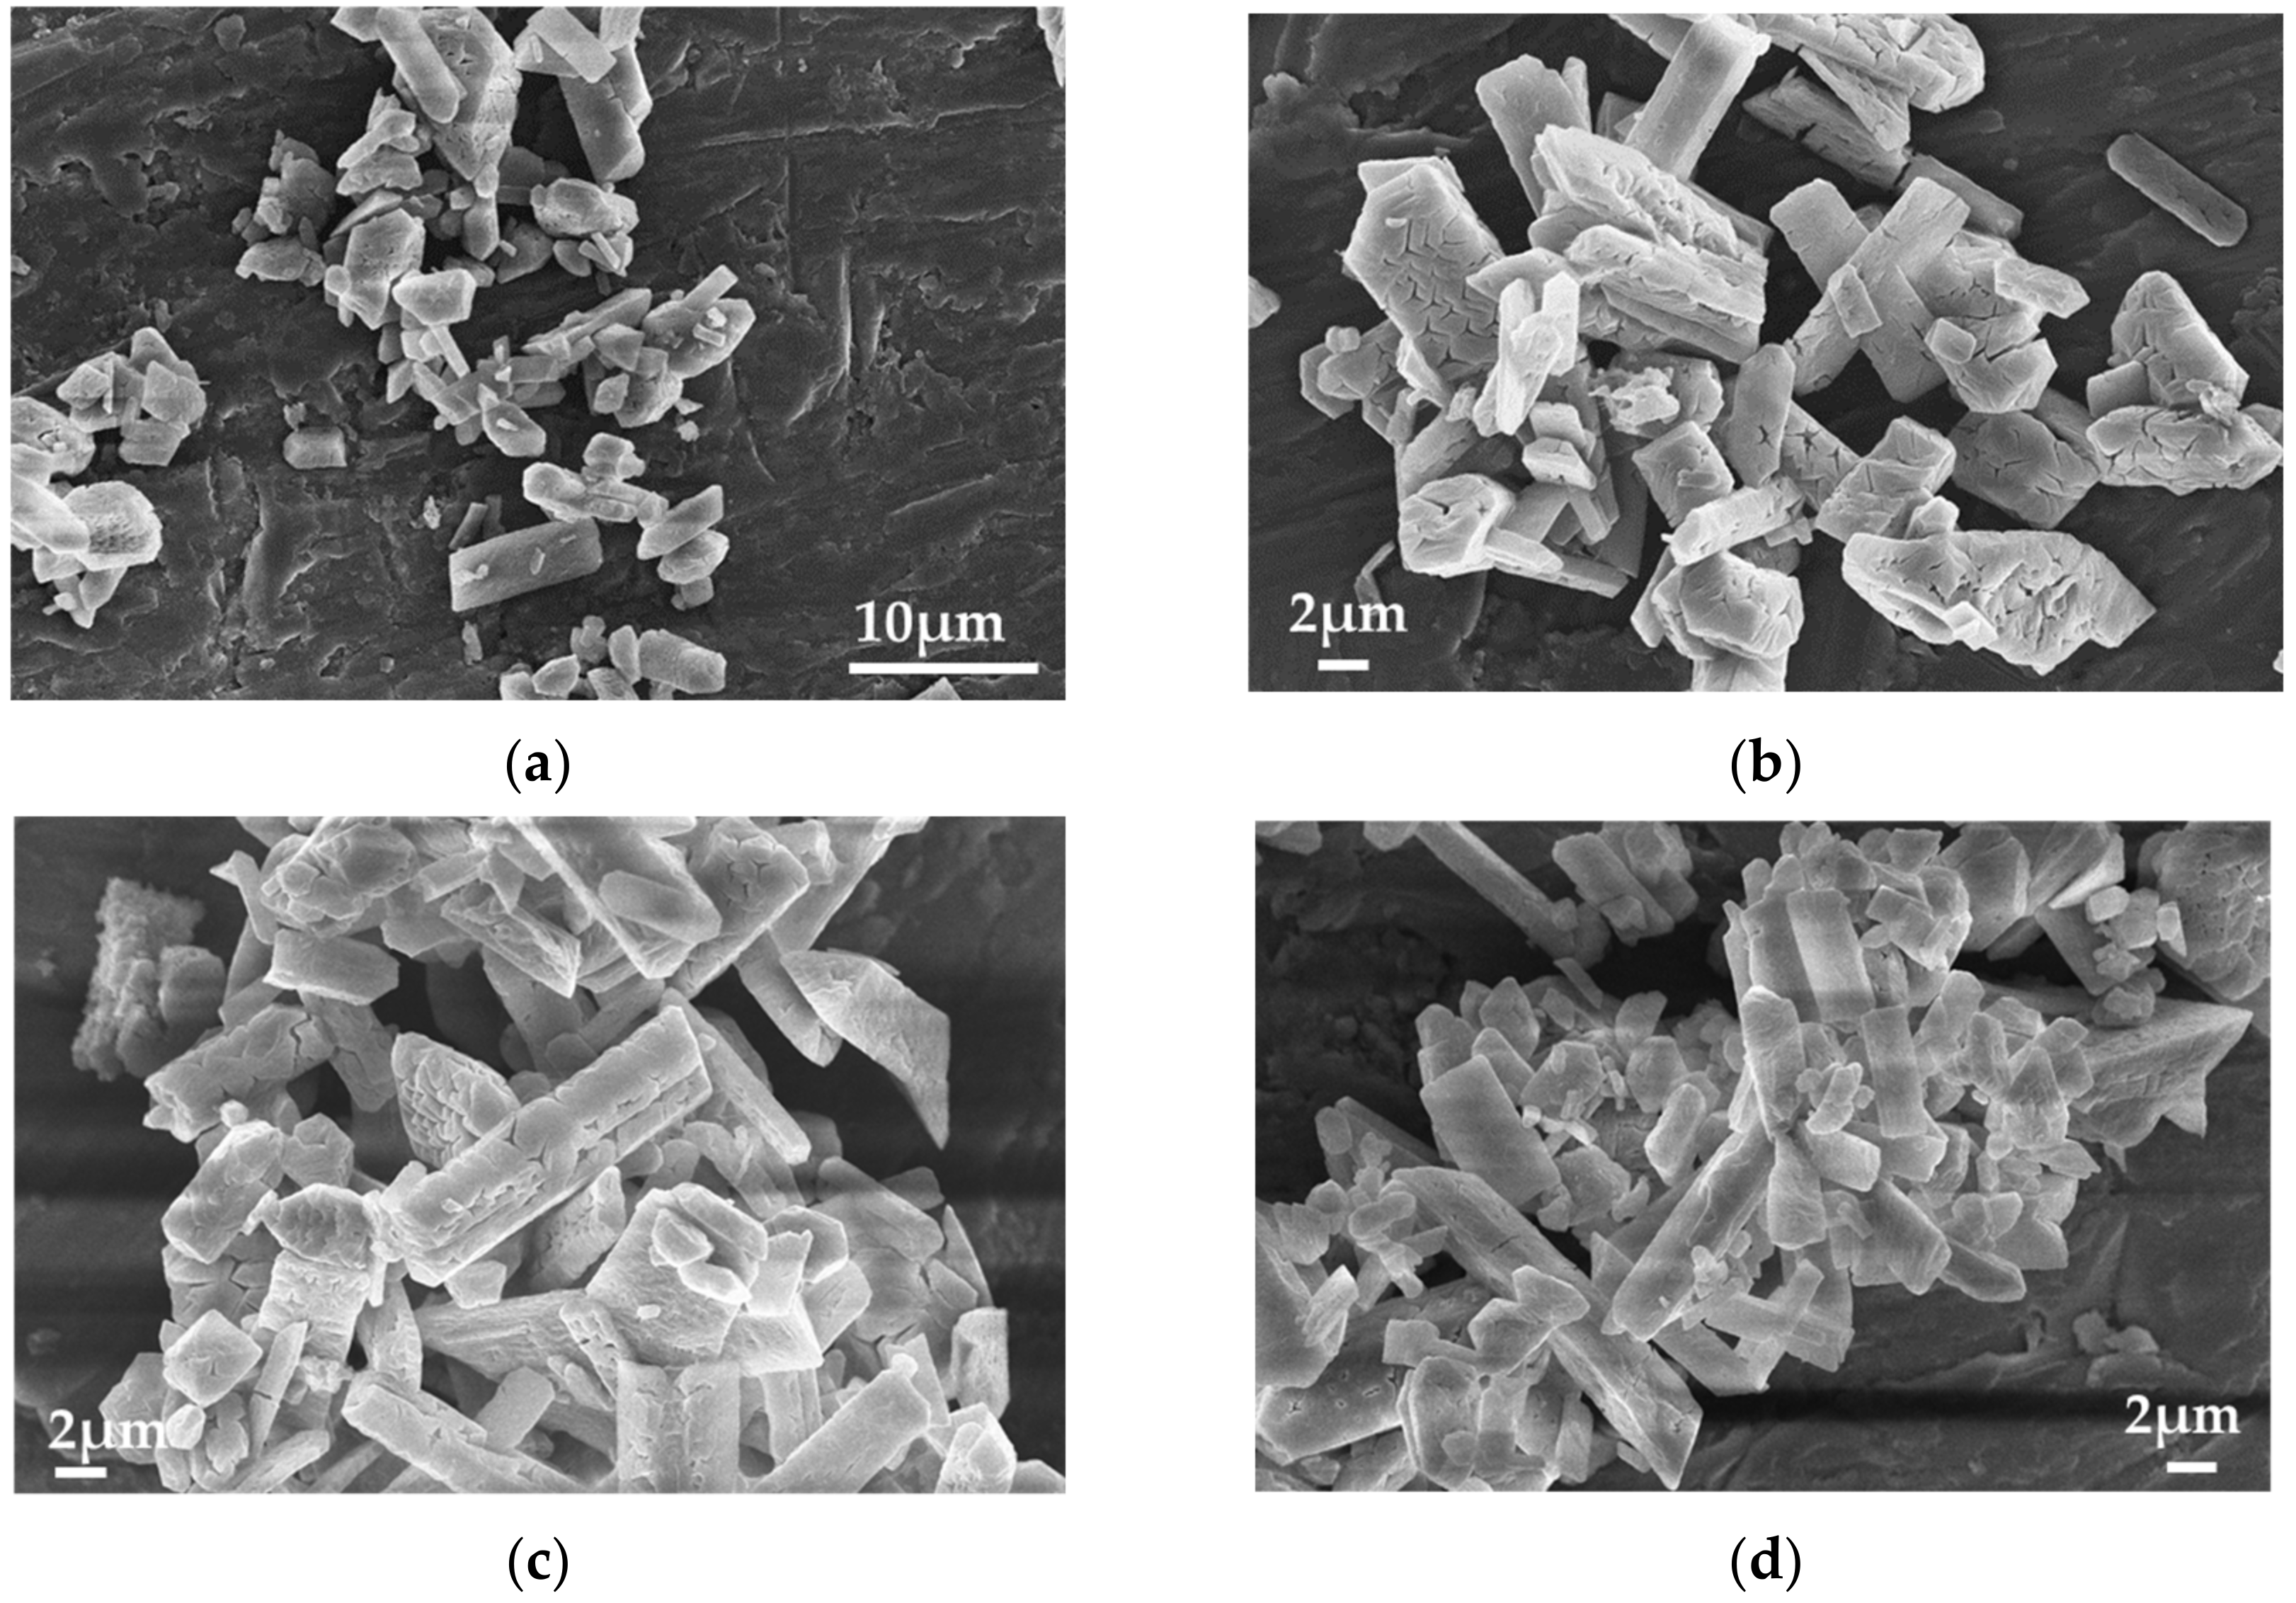
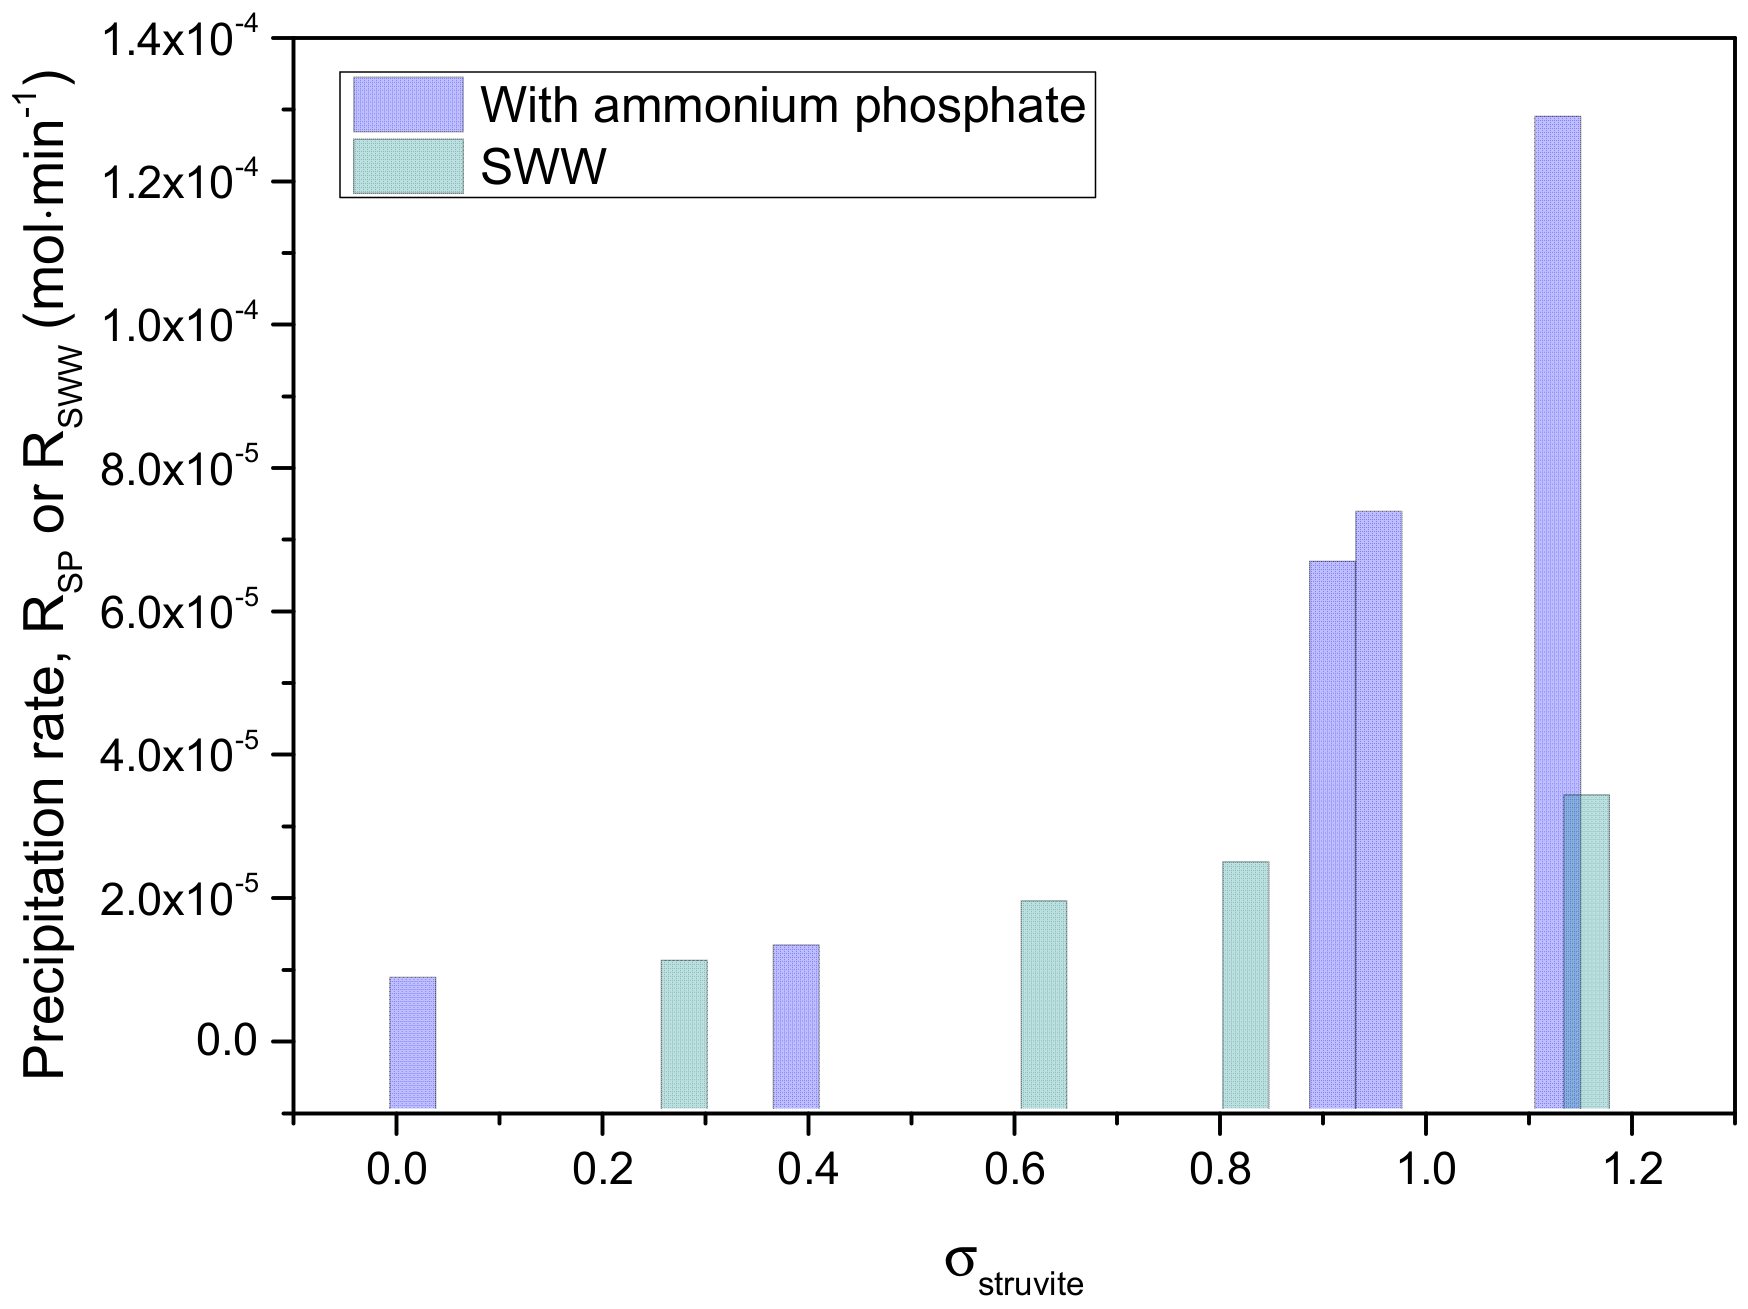
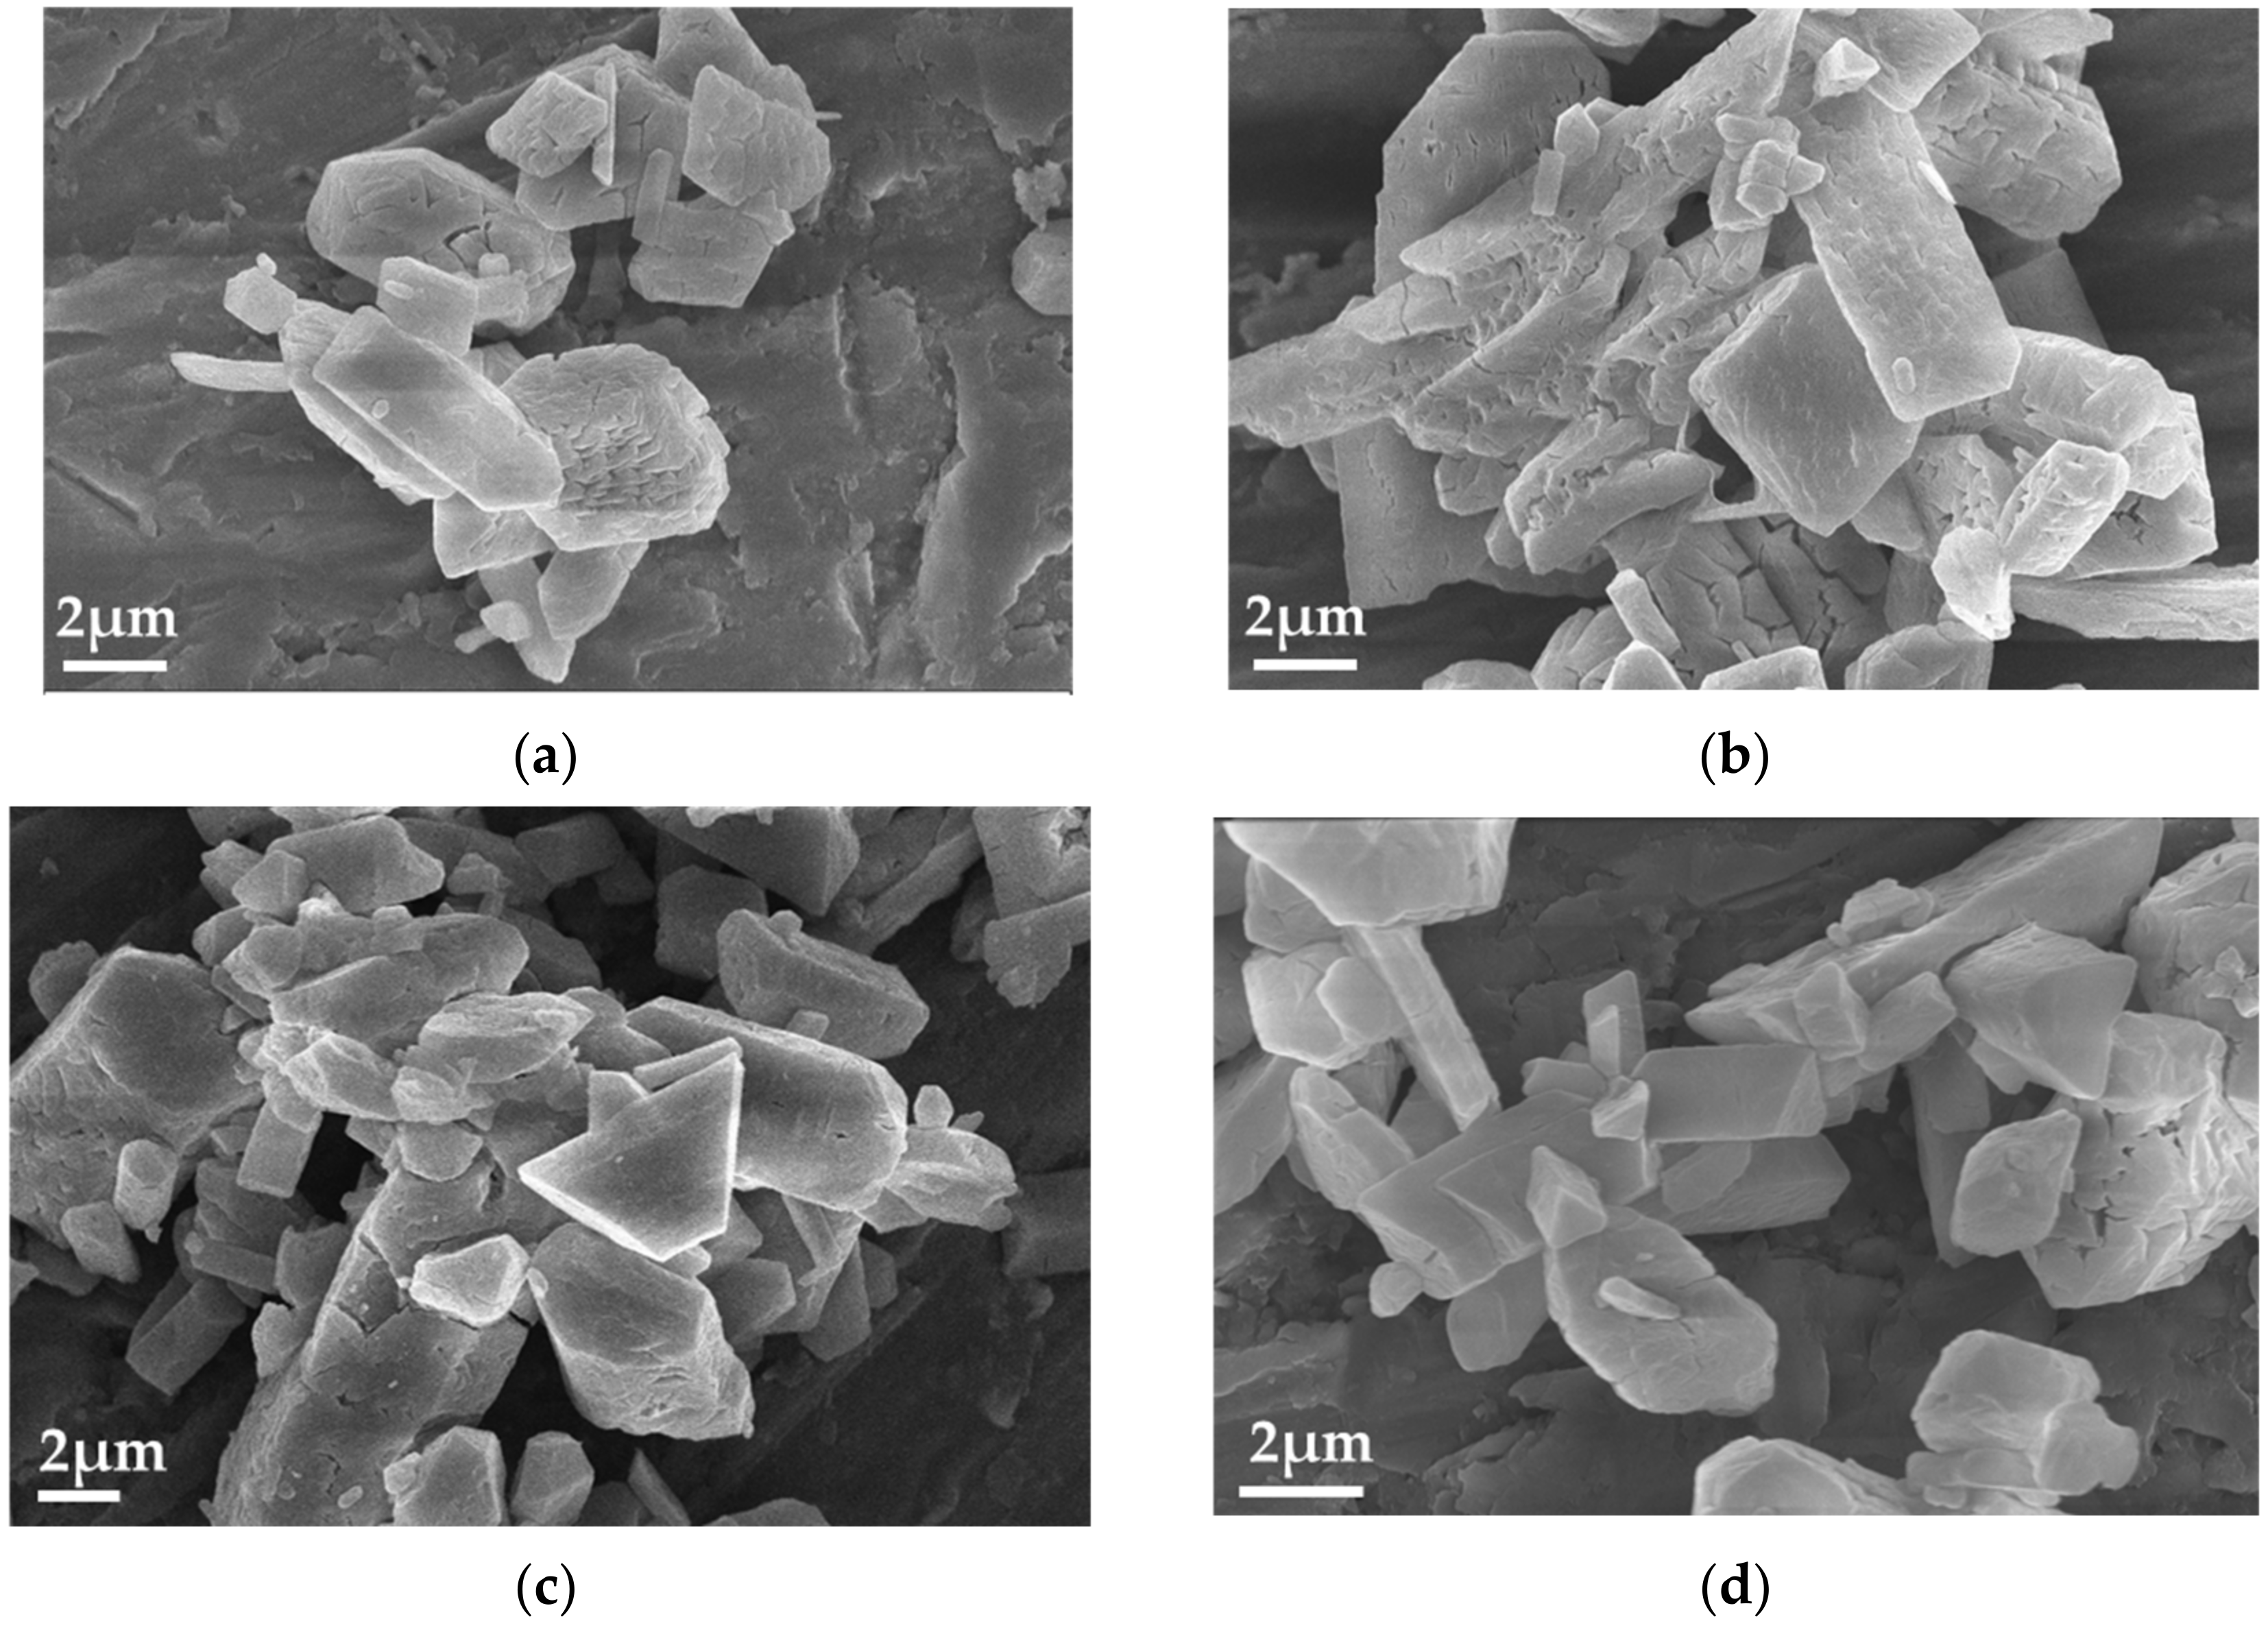
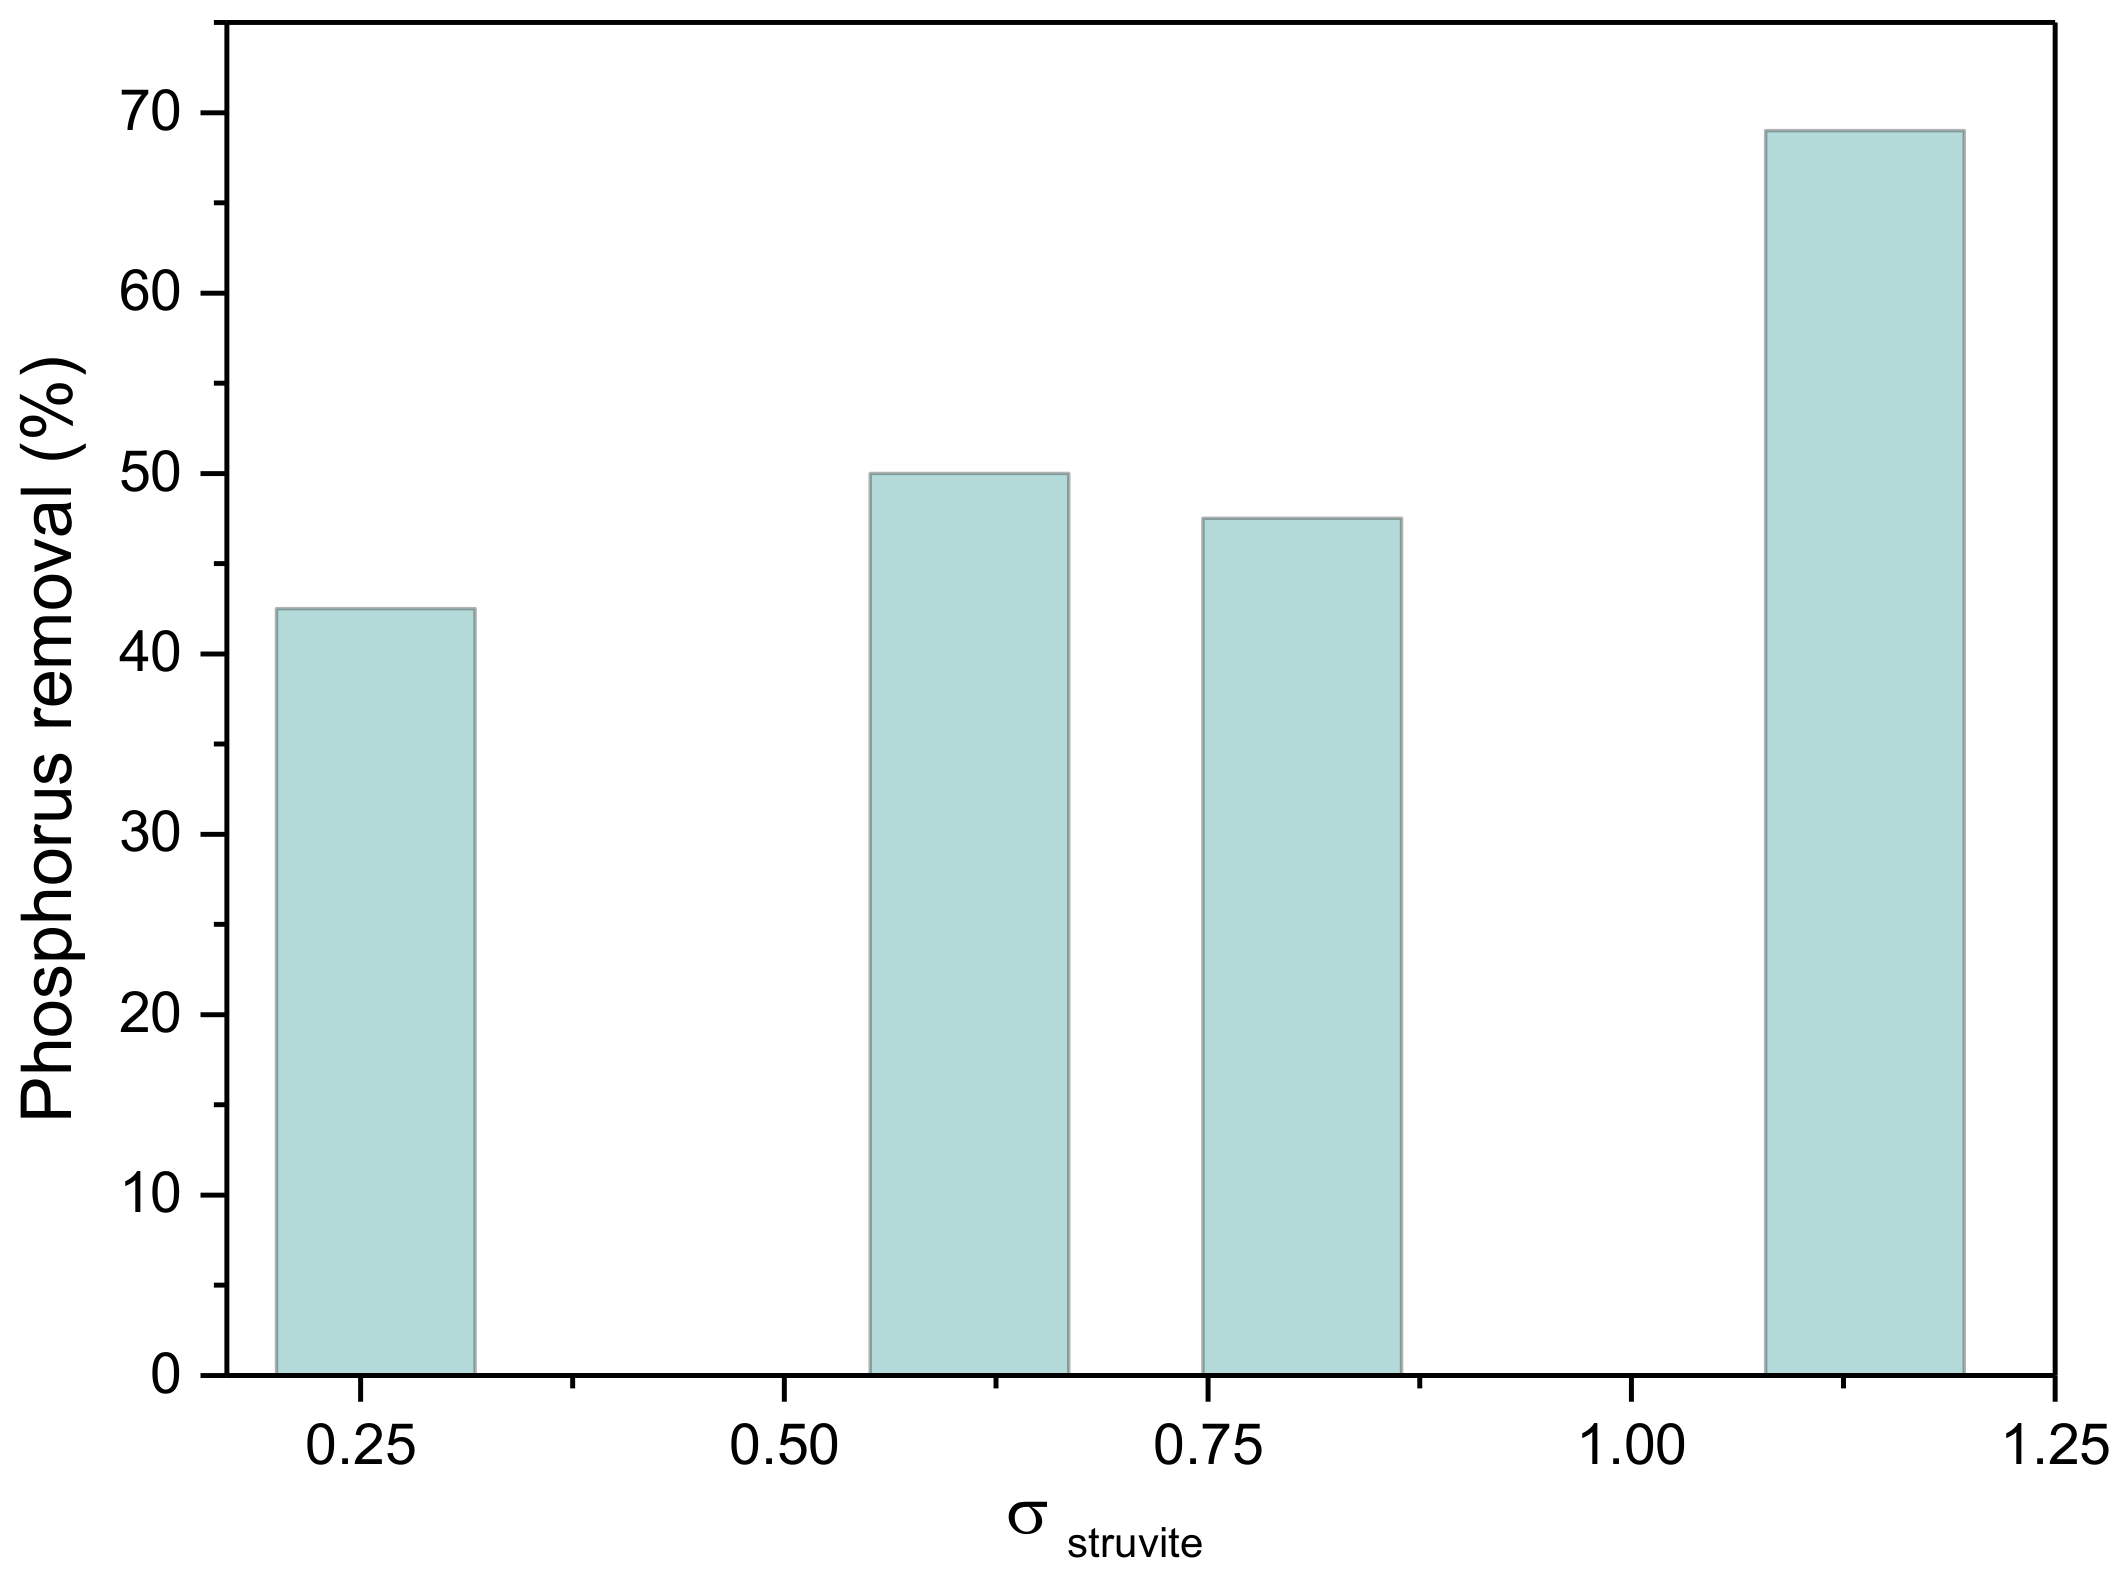
3.2.3. Struvite Precipitation in Simulated Wastewater (SWW)

Struvite precipitation was further examined in solutions simulating wastewater (SWW), supersaturated with respect to struvite. This supersaturation in the SWW was achieved following magnesium anode electrodissolution in ammonium phosphate solutions. Magnesium elimination during struvite precipitation took place past reaching a supersaturation threshold.
Throughout the struvite precipitation, monitoring involved sampling and analyzing the fluid phase for inorganic orthophosphate and magnesium, with consideration given to the stoichiometry of the solid formation (Mg:NH3:P = 1:1:1). The pH of the solution was also monitored. The magnesium concentration–time profiles for typical experiments at low and high initial concentrations of ammonium phosphate used for the calculation of struvite precipitation rates are shown in Figure 15.
As may be seen, for the low initial concentration of ammonium and phosphate ions in the solution, the magnesium concentration follows Faraday’s law and increases throughout the experiment. The concentration of magnesium ions in the solution did not reach the maximum values according to the stoichiometry and the appropriate supersaturation was achieved in the solution for precipitation initiation. However, for a higher initial concentration of phosphate in the solutions, there was a maximum level of magnesium concentration achieved by electrodissolution of the anode electrode, where sufficient supersaturation was attained and the struvite precipitation started.
The rate of struvite precipitation was determined by the reduction in phosphate concentration in the solution and is presented in Table 4. The relative supersaturation concerning struvite was notably low compared to experiments that took place without simulating wastewater conditions due to the presence of other ions in the SWW, forming a number of complexes. All potential equilibria were considered in calculating the supersaturation.
The plot of the measured rates of precipitation as a function of the relative supersaturation of SWW with respect to struvite is shown in Figure 16.
From the rate of precipitation of struvite as a function of the relative supersaturation, the apparent order from Equation (9) was calculated equal to 1.00 ± 0.06, suggesting that surface diffusion was the rate-determining step. The apparent rate constant was (3.0 ± 0.1) × 10−5, which was significantly lower than the corresponding for mass transport. A comparison of the rates of precipitation of struvite as a function of the relative supersaturation with respect to struvite for solutions simulating wastewater and solutions of sodium chloride is shown in Figure 17. As can be seen, the rates in NaCl were higher in comparison with the respective in synthetic wastewater. Τhis could be due to the interference created by the various ions included in SWW, which probably inhibit the precipitation of struvite.
The potential between the electrodes during the constant current application was also measured (Figure 18). As can be seen for low initial phosphate and ammonium concentrations (Figure 18a), the potential shows very small changes (almost constant). However, this does not indicate that the electrodialysis did not take place because the concentration of released magnesium in the solution was constantly increased. Furthermore, by increasing the initial phosphate and ammonium concentrations in the synthetic wastewater (Figure 18b), the decrease in the voltage is obvious, with higher changes. Due to the electrolysis process taking place, it was expected that the voltage would increase. However, maybe due to the precipitation, the measured voltage decreased.
From supersaturated SWW, the precipitate solid was identified as struvite (Figure 19b) for relative supersaturation in the range σstruvite = 0.26–1.14. In the precipitation of struvite at lower initial concentrations of ammonium phosphate (E07 and E08), the solid that precipitated was exclusively brucite (Figure 19a), as the respective conditions were not satisfactory for the preparation of supersaturated solutions with respect to struvite.
The morphology of the precipitated solid (Figure 20) was characteristic of struvite; however, the crystals were not well formed enough in comparison with the experiments in the absence of SWW.
Phosphorus removal from SWW solutions supersaturated with respect to struvite was also calculated by the reduction in phosphorus concentration in the solutions (Equation (10)). As shown in Figure 21, the removal efficiency of phosphorus was increasing proportionally to the supersaturation in the SWW with respect to struvite resulting in higher P removal from the aqueous phase and the recovery in the form of struvite. It reached 70%, corresponding to the SWW with the highest relative supersaturation with respect to struvite (σstruvite = 1.14). Comparison of the P removal efficiency with similar processes where magnesium anode electrolysis is applied in different systems (two-chamber electrolysis cell) [31]; for similar current densities (~25 A m−2), the removal efficiency is lower, which may be not only due to the different composition of the studied solution but also the overall process.
A comparison also can be conducted with earlier reports of P removal by struvite precipitation from model supersaturated solutions with respect to struvite in which MgSO4 [32] or Mg(OH)2 [33] was the source of magnesium in the solutions, which yielded twice as much removal compared with the case of Mg(OH)2 as magnesium source and the same removal efficiency compared to MgSO4 as magnesium source even in a lower supersaturation, as can be seen in Figure 22.
Y. Cai et al. [34], using Mg anodic dissolution, reported that in synthetic wastewater at supersaturation similar to that used in the present work (σstruvite = 1.31), and higher applied current (50 mA), the maximum percentage of P removal reached approximately 90%. In the present work, for a similar value of relative supersaturation (σstruvite = 1.14), the phosphorus removal was calculated equal to 70%. Moreover, the struvite precipitation rate was found to be quite high equal to 3.40 × 10⁻⁵ mol·min−1 in comparison with the respective rate calculated for Y. Cai (0.57 × 10⁻⁵ mol·min−1). Research on the electrochemical precipitation of struvite obtained by the dissolution of sacrificial magnesium anodes is ongoing with increasing interest in applying pulsed electrochemical methods and using saline solutions to avoid the formation of passive magnesium oxide layers which reduce the overall yield of the process [35,36].

3.2.4. Estimate of Process Cost

As the cost of any new method is a limiting factor, the cost of struvite production in synthetic wastewater was calculated. The total costs for this process are related to the electrical energy consumption for the magnesium enrichment of the solutions. Based on the above results, a satisfactory concentration of magnesium for the achievement of supersaturation was obtained in the first 30 min (Experiments E09 to E12). For these experiments, on average, the concentration of magnesium in the solution obtained by electrodissolution (before precipitation begins) was 5 × 10⁻⁴ M (1 × 10⁻⁴ mol). From Equation (1), 1 mol of Mg2+ forms 1 mol of struvite, so for 1 × 10⁻⁴ mol of magnesium ions, the total mass of struvite precipitated in the solution was 24.54 mg. From the applied current (10 mA), the total power is 20 mW, assuming that the average potential is 2 volts. So, for the production of 24.54 mg of struvite, a power of 20 mW is needed, and 0.82 kW for 1 kg of struvite. For 30 min of DC current application, to reach maximum magnesium concentration, 1.64 kWh is needed. As a result, 1640 kWh is needed per ton of struvite precipitate. Considering that the cost of 1 kWh is approximately 0.09 EUR (price in Greece), for the production of 1 ton of struvite, the total cost incurred by the electrical energy consumption alone is 147 EUR/ton of struvite, which is considered a reasonable cost compared to the current price [37].
The work presented yielded encouraging results but it is still at the laboratory scale. Further investigation of several parameters (constant current vs. constant potential, application of waveforms in the applied potential or current to cope with the problem of the passivation of the Mg electrode which limits Mg supply in the solution; the presence of biomass in the reactor) is needed before proceeding to scale up of the process.

4. Conclusions

In the absence of phosphorus and ammonia, the main crystal phases obtained in the blank electrolyte, either in the magnesium anode electrode or in the bulk solution, were Mg(OH)2 (brucite). In the presence of NH4+ and PO43−, the magnesium ions dissolved anodically, resulting in struvite precipitation even at a low applied current (10 mA) in the presence of low concentrations of phosphorus and ammonia in the working solution. Struvite crystals with an average size of 20 μm were formed. The behavior of the electrochemical cell for the electrolyte solutions used was Faradaic (linear dependence of the mass of magnesium as a function of time) for the first 30 min upon the onset of precipitation. The deviation from theoretical mass (Faradaic) was very high (60–90%), especially for high initial phosphate and ammonium concentrations. The P removal was equal to 70% for the highest value of relative supersaturation. On the other hand, in solutions simulating municipal wastewater, Faradaic yield was maintained for longer periods of time (low relative supersaturation), and the deviation from the theoretically calculated magnesium mass was relatively lower (~50%). The phosphorus removal was also about 70%. The overall process was shown to be efficient, even at low applied current, meaning that this method can be cost-effective for recovering phosphorus from wastewater.

Author Contributions

Conceptualization, P.G.K.; methodology, P.D.N.; investigation, P.D.N.; resources, P.G.K.; data curation, P.D.N.; writing—original draft preparation, P.D.N. and P.G.K.; writing—review and editing, P.G.K. and P.D.N.; supervision, P.G.K. All authors have read and agreed to the published version of the manuscript.

Funding

This research received no external funding.

Data Availability Statement

The original contributions presented in the study are included in the article, further inquiries can be directed to the corresponding author.

Conflicts of Interest

The authors declare no conflicts of interest.

References

  1. Ohtake, H.; Tsuneda, S. (Eds.) Phosphorus Recovery and Recycling; Springer: Singapore, 2019. [Google Scholar] [CrossRef]
  2. Li, B.; Boiarkina, I.; Yu, W.; Huang, H.M.; Munir, T.; Wang, G.Q.; Young, B.R. Phosphorous recovery through struvite crystallization: Challenges for future design. Sci. Total Environ. 2019, 648, 1244–1256. [Google Scholar] [CrossRef] [PubMed]
  3. Tang, C.; Gai, S.; Liu, Z.; Sui, L.; Cheng, K.; Yang, F. Sustainable phosphorus recycling: A review of advanced recovery methods with a focus on hydrothermal humification technology and potential phosphorus resources in China for this method. Soil Use Manag. 2024, 40, e13001. [Google Scholar] [CrossRef]
  4. Rotta, E.H.; Bitencourt, C.S.; Marder, L.; Bernardes, A.M. Phosphorus recovery from low phosphate-containing solution by electrodialysis. J. Membrane. Sci. 2019, 573, 293–300. [Google Scholar] [CrossRef]
  5. Liu, W.; Ke, H.; Xie, J.; Tan, H.; Luo, G.; Xu, B.; Abakari, G. Characterizing the water quality and microbial communities in different zones of a recirculating aquaculture system using biofloc biofilters. Aquaculture 2020, 529, 735624. [Google Scholar] [CrossRef]
  6. Suresh, K.; Tang, T.; van Vliet, M.T.H.; Bierkens, M.F.P.; Strokal, M.; Sorger-Domenigg, F.; Wad, Y. Recent advancement in water quality indicators for eutrophication in global freshwater lakes. Environ. Res. Lett. 2023, 18, 063004. [Google Scholar] [CrossRef]
  7. Cai, Y.; Han, Z.; Lin, X.; Duan, Y.; Du, J.; Ye, Z.; Zhu, J. Study on removal of phosphorus as struvite from synthetic wastewater using a pilot-scale electrodialysis system with magnesium anode. Sci. Total Environ. 2020, 726, 138221. [Google Scholar] [CrossRef] [PubMed]
  8. Jiao, G.J.; Ma, J.; Li, Y.; Jin, D.; Ali, Z.; Zhou, J.; Sun, R. Recent advances and challenges on removal and recycling of phosphate from wastewater using biomass-derived adsorbents. Chemosphere 2021, 278, 130377. [Google Scholar] [CrossRef] [PubMed]
  9. Al-Juboori, R.A.; Ahmed, F.E.; Khanzada, N.K.; Khatri, M.; Al-shaeli, M.; Ibrahim, Y.; Hilal, N. Burgeoning innovation and scalability activities for phosphorus recovery from wastewater treatment facilities. Sustain. Mater. Technol. 2024, 40, e00907. [Google Scholar] [CrossRef]
  10. Munir, M.T.; Li, B.; Mardon, I.; Young, B.R.; Baroutian, S. Integrating wet oxidation and struvite precipitation for sewage sludge treatment and phosphorus recovery. J. Clean. Prod. 2019, 232, 1043–1052. [Google Scholar] [CrossRef]
  11. Shakoor, B.; Ye, Z.L.; Chen, S. Engineered biochars for recovering phosphate and ammonium from wastewater: A review. Sci. Total Environ. 2021, 779, 146240. [Google Scholar] [CrossRef] [PubMed]
  12. Egle, L.; Rechberger, H.; Zessner, M. Overview and description of technologies for recovering phosphorus from municipal wastewater. Resour. Conserv. Recycl. 2015, 105, 325–346. [Google Scholar] [CrossRef]
  13. Zhang, T.; He, X.; Deng, Y.; Tsang, D.C.W.; Jiang, R.; Becker, G.C.; Kruse, A. Phosphorus recovered from digestate by hydrothermal processes with struvite crystallization and its potential as a fertilizer. Sci. Total Environ. 2020, 698, 134240. [Google Scholar] [CrossRef] [PubMed]
  14. Zhang, T.; Jiang, R.; Deng, Y. Phosphorus Recovery by Struvite Crystallization from Livestock Wastewater and Reuse as Fertilizer: A Review. In Physico-Chemical Wastewater Treatment and Resource Recovery; Chapter 7; Farooq, R., Ahmad, Z., Eds.; IntechOpen: London, UK, 2017. [Google Scholar]
  15. Le Corre, K.; Valsami-Jones, E.; Hobbs, P.; Parsons, S. Phosphorus recovery from wastewater by struvite crystallization: A review. Crit. Rev. Environ. Sci. Technol. 2009, 39, 433–477. [Google Scholar] [CrossRef]
  16. Ronteltap, M.; Maurer, M.; Gujer, W. Struvite precipitation thermodynamics in source-separated urine. Water Res. 2007, 41, 977–984. [Google Scholar] [CrossRef] [PubMed]
  17. Pastor, L.; Mangin, D.; Barat, R.; Seco, A. A pilot-scale study of struvite precipitation in a stirred tank reactor: Conditions influencing the process. Bioresour. Technol. 2008, 99, 6285–6291. [Google Scholar] [CrossRef] [PubMed]
  18. Moerman, W.; Carballa, M.; Vandekerckhove, A.; Derycke, D.; Verstraete, W. Phosphate removal in agro-industry: Pilot and full-scale operational considerations of struvite crystallization. Water Res. 2009, 43, 1887–1892. [Google Scholar] [CrossRef] [PubMed]
  19. Kruk, D.J.; Elektorowicz, M.; Oleszkiewicz, J.A. Struvite precipitation and phosphorus removal using magnesium sacrificial anode. Chemosphere 2014, 101, 28–33. [Google Scholar] [CrossRef] [PubMed]
  20. Huang, H.; Zhang, P.; Zhang, Z. Simultaneous removal of ammonia nitrogen and recovery of phosphate from swine wastewater by struvite electrochemical precipitation and recycling technology. J. Clean. Prod. 2016, 127, 302–310. [Google Scholar] [CrossRef]
  21. Le Corre, K.S.; Valsami-Jones, E.; Hobbs, P.; Parsons, S.A. Impact of calcium on struvite crystal size, shape and purity. J. Cryst. Growth 2005, 283, 514–522. [Google Scholar] [CrossRef]
  22. Doyle, J.D.; Parsons, S.A. Struvite formation control and recovery. Water Res. 2002, 36, 3925–3940. [Google Scholar] [CrossRef] [PubMed]
  23. Trotta, S.; Adani, F.; Fedele, M.; Salvatori, M. Nitrogen and phosphorus recovery from cow digestate by struvite precipitation: Process optimization to maximize phosphorus recovery. Results Eng. 2023, 20, 101478. [Google Scholar] [CrossRef]
  24. Nagul, E.A.; McKelvie, I.D.; Worsfold, P.; Kolev, S.D. The molybdenum blue reaction for the determination of orthophosphate revisited: Opening the black box. Anal. Chim. Acta 2015, 890, 60–82. [Google Scholar] [CrossRef] [PubMed]
  25. Parkhurst, D.L.; Appelo, C.A.J. Description of Input and Examples for PHREEQC Version 3—A Computer Program for Speciation, Batch-Reaction, One-Dimensional Transport, and Inverse Geochemical Calculations. In U.S. Geological Survey Techniques and Methods, Book 6; Chapter A43; U.S. Geological Survey: Reston, VA, USA, 2013; p. 497. [Google Scholar]
  26. Mullin, W. Crystallization, 3rd ed.; Butterworth-Heinemann Ltd.: Oxford, UK, 2001; p. 189. [Google Scholar]
  27. Natsi, P.D.; Goudas, K.-A.; Koutsoukos, P.G. Phosphorus Recovery from Municipal Wastewater: Brucite from MgO Hydrothermal Treatment as Magnesium Source. Crystals 2023, 13, 208. [Google Scholar] [CrossRef]
  28. Sönel, O.; Garside, J. Precipitation, Basic Principles and Industrial Applications; Butterworth-Heineman Ltd.: Oxford, UK, 1992; pp. 89–92. [Google Scholar]
  29. Matsouki, N. Phosphorus Recovery from Municipal Wastewater. Master’s Thesis, Graduate Program in Environmental Sciences, University of Patras, Patras, Greece, 2013. Available online: https://nemertes.library.upatras.gr/search?query=%CE%9C%CE%B1%CF%84%CF%83%CE%BF%CF%8D%CE%BA%CE%B7%20%CE%9D%CE%A%CE%BA%CE%B7 (accessed on 10 April 2024).
  30. Bagastyo, A.Y.; Anggrainy, A.D.; Khoiruddin, K.; Ursada, R.; Warmadewanthi, I.; Wenten, I.G. Electrochemically-driven struvite recovery: Prospect and challenges for the application of magnesium sacrificial anode. Sep. Purif. Technol. 2022, 288, 120653. [Google Scholar] [CrossRef]
  31. Lin, X.; Han, Z.; Yu, H.; Ye, Z.; Zhu, S.; Zhu, J. Struvite precipitation from biogas digestion slurry using a two-chamber electrolysis cell with a magnesium anode. J. Clean. Prod. 2018, 174, 1598–1607. [Google Scholar] [CrossRef]
  32. Kofina, A.N.; Koutsoukos, P.G. Spontaneous Precipitation of Struvite from Synthetic Wastewater Solutions. Cryst. Growth Des. 2005, 5, 489–496. [Google Scholar] [CrossRef]
  33. Kofina, A.N. Recovery of Inorganic Phosphates from Aqueous Solutions. Ph.D. Thesis, University of Patras, Patras, Greece, 2006. Available online: https://hdl.handle.net/10889/1468 (accessed on 25 June 2024).
  34. Cai, Y.; Han, Z.; Lin, X.; Du, J.; Lei, Z.; Ye, Z.; Zhu, J. Mechanisms of releasing magnesium ions from a magnesium anode in an electrolysis reactor with struvite precipitation. J. Environ. Chem. Eng. 2022, 10, 106661. [Google Scholar] [CrossRef]
  35. Sultana, R.; Greenlee, L.F. The implications of pulsating anode potential on the electrochemical recovery of phosphate as magnesium ammonium phosphate hexahydrate (struvite). Chem. Eng. J. 2023, 459, 141522. [Google Scholar] [CrossRef]
  36. Sultana, R.; Kékedy-Nagy, L.; Daneshpour, R.; Greenlee, L.F. Electrochemical recovery of phosphate from synthetic wastewater with enhanced salinity. Electrochim. Acta 2022, 426, 140848. [Google Scholar] [CrossRef]
  37. Muys, M.; Phukan, R.; Brader, G.; Samad, A.; Moretti, M.; Haiden, B.; Pluchon, S.; Roest, K.; Vlaeminck, S.E.; Spiller, M. A systematic comparison of commercially produced struvite: Quantities, qualities and soil-maize phosphorus availability. Sci. Total Environ. 2021, 756, 143726. [Google Scholar] [CrossRef] [PubMed]
Figure 1. Experimental setup for the precipitation of struvite using magnesium electro-dissolution (ED).
Crystals 14 00675 g001
Figure 2. pH value deviation through time after the immersion of magnesium anode in electrolyte solutions with different concentrations.
Crystals 14 00675 g002
Figure 3. Total magnesium in solution as a function of time for the magnesium anode at OCP conditions in 1 and 10 mM NaCl electrolyte solutions; 25 °C.
Crystals 14 00675 g003
Figure 4. Magnesium mass dissolved on the electrolytic solution as a function of time for different current densities applied each time; 0.001 M NaCl, 25 °C.
Crystals 14 00675 g004
Figure 5. Magnesium mass dissolved on the electrolytic solution as a function of time for different current densities applied each time; 0.01 M NaCl, 25 °C.
Crystals 14 00675 g005
Figure 6. Magnesium dissolution rate from anodic reaction of electrode in solutions with different ionic strength, at various applied constant current densities in 1 mM and 10 mM NaCl solutions.
Crystals 14 00675 g006
Figure 7. Variations in phosphate and magnesium concentration produced and consumed, respectively, in the electrolysis reactor with different compositions of solutions (a) 10−3 M NH4H2PO4 (E01) and (b) 10−2 M NH4H2PO4 (E06); applied current 10 mA, 0.01 M NaCl, 25 °C.
Crystals 14 00675 g007
Figure 8. Rate of struvite precipitation calculated from phosphate concentration reduction in working solutions as a function of the initial relative supersaturations with respect to struvite; applied current 10 mA, 0.01 M NaCl, 25 °C, pHinitial 9. Red line is best fit on the experimental data (black squares).
Crystals 14 00675 g008
Figure 9. Rate of struvite precipitation calculated from phosphate concentration reduction in working solutions as a function of initial relative supersaturations with respect to struvite; applied current 10 mA, 0.01 M NaCl, 25 °C, pHinitial 9;σstruvite ≅ 0.4.
Crystals 14 00675 g009
Figure 10. Measured potential at constant current application (10 mA) for different compositions of working solution; 0.01 M NaCl, 25 °C, pHinitial 9.
Crystals 14 00675 g010
Figure 11. Phosphorus removal (%) during precipitation of struvite in supersaturated solutions using as magnesium source electrodissolution of solid magnesium anode; applied current 10 mA, 0.01 M NaCl, 25 °C, pHinitial 9.
Crystals 14 00675 g011
Figure 12. XRD patterns for the solid obtained by precipitation of struvite from supersaturated solutions prepared using as magnesium source the electrodissolution process of magnesium electrode anode. Applied current 10 mA, 0.01 M NaCl, 25 °C, pHinitial 9.
Crystals 14 00675 g012
Figure 13. Scanning electron microscopy (SEM) photographs of struvite spontaneously precipitated after constant current application in supersaturated solutions with different relative supersaturations (a) σ = 0.04 (b) σ = 0.41 (c) σ = 0.93 (d) σ = 0.98 (e) σ = 1.12 and (f) σ = 1.15; Applied current 10 mA, 0.01 M NaCl, 25 °C, pHinitial 9.
Crystals 14 00675 g013aCrystals 14 00675 g013b
Figure 14. Precipitated solid on two different sites (a,b) of the surface of the magnesium anode electrode; applied current 10 mA; 0.01 M NaCl; 25 °C; pHinitial 9.
Crystals 14 00675 g014
Figure 15. Variations of phosphate and magnesium concertation produced and consumed, respectively, in the electrolysis reactor with different compositions of simulated wastewater solutions (a) 10−3 M NH4H2PO4 (Exp. E07) and (b) 10−2 M NH4H2PO4 (Exp. E12); applied current 10 mA, 0.01 M NaCl, 25 °C.
Crystals 14 00675 g015
Figure 16. Rate of struvite precipitation in SWW solutions as a function of initial relative supersaturations with respect to struvite; applied current 10 mA; 0.01 M NaCl; 25 °C; pHinitial 9.
Crystals 14 00675 g016
Figure 17. Precipitation of struvite from supersaturated solutions using as magnesium source magnesium electrodissolution in ammonium phosphate and synthetic wastewater; applied current 10 mA; 0.01 M NaCl; 25 °C; pHinitial 9.
Crystals 14 00675 g017
Figure 18. Measured potential after specific current application (10 mA) for different compositions of simulated wastewater; 25 °C; pHinitial 9; initial NH4H2PO4 concentration (a) 1.0 mM (E07), 2.0 mM (E08), 4 mM (E09) (b) 6.0 mM (E10), 8.0 mM (E11), 10 mM (E11).
Crystals 14 00675 g018
Figure 19. XRD patterns of the precipitate formed from SWW supersaturated with respect to struvite; (a) Experiment E07; (b) Experiment E12. Applied current 10 mA, 0.01 M NaCl, 25 °C, pHinitial 9.
Crystals 14 00675 g019
Figure 20. Scanning electron microscopy (SEM) photographs of struvite precipitated after constant current application in supersaturated solutions with different relative supersaturation values in simulated wastewater (a) σ = 0.26 (b) σ = 0.61 (c) σ = 0.81 and (d) σ = 1.14; applied current 10 mA, 0.01 M NaCl, 25 °C, pHinitial 9.
Crystals 14 00675 g020
Figure 21. Phosphorus removal (%) from precipitation of struvite in supersaturated SWW solutions using as magnesium source Mg derived from electrodissolution of magnesium anode; applied current 10 mA; 0.01 M NaCl; 25 °C; pHinitial 9.
Crystals 14 00675 g021
Figure 22. Phosphorus removal (%) from synthetic wastewater solutions supersaturated with respect to struvite () with magnesium derived from anode electrodissolution (this work), () inoculated with brucite obtained from hydrothermal treatment of MgO (ref. [27]) and () MgSO4 as a magnesium source (ref [32]).
Crystals 14 00675 g022
Table 1. Composition of simulated domestic wastewater (SWW).
ComponentConcentration (/×10−4 mol·L−1)
Glucose5.17
NaHCO3176.8
NaCl100
NaNO35.88
Na2SO4120
Table 2. Initial relative supersaturation and precipitation rates, RPS for experiments took place under different initial NH4H2PO4 concentrations; applied current 10 mA, 0.01 M NaCl, 25 °C.
Experiment Number[N-NH3]tot = [P]tot
/×10−3 mol·L−1
Relative Supersaturation, σstruvitePrecipitation Rate, RPS/×10−5 mol·min−1
E0110.040.84
E0220.411.30
E0340.936.67
E0460.987.37
E0581.125.00
E06101.1512.9
Table 3. Comparison of kinetic parameters resulting from experiments with different magnesium sources.
Magnesium SourcesRelative Supersaturation Range, σstruviteApparent Order, nRate Constant, ks
Mg-anode (This work)0.04 < σ < 1.1538.19 × 10−5
Mg(OH)2 [23]0.3 < σ < 36.645.00 × 10−10
MgSO4 [26]0.43 < σ < 0.8241.29 × 10−5
MgCl2 [27]0.27 < σ < 0.5433.40 × 10−5
Table 4. Initial relative supersaturation and precipitation rates, RPS for experiments took place under different initial NH4H2PO4 concentrations in simulated wastewater (SWW); applied current 10 mA, 0.01 M NaCl, 25 °C.
Experiment Number[N-NH3]tot = [P]tot
/×10−3 mol·L−1
Relative Supersaturation, σstruvitePrecipitation Rate, RPS/×10−5 mol·min−1
E071--
E082--
E0940.261.08
E1060.611.91
E1180.812.46
E12101.143.40
Disclaimer/Publisher’s Note: The statements, opinions and data contained in all publications are solely those of the individual author(s) and contributor(s) and not of MDPI and/or the editor(s). MDPI and/or the editor(s) disclaim responsibility for any injury to people or property resulting from any ideas, methods, instructions or products referred to in the content.

