Article

Nanoindentation Stress Relaxation to Quantify Dislocation Velocity–Stress Exponent

1
School of Nuclear Science and Engineering, Oregon State University, Corvallis, OR 97330, USA
2
Idaho National Laboratory, 1955 Fremont Ave, Idaho Falls, ID 83415, USA
*
Author to whom correspondence should be addressed.
Current address: General Atomics, San Diego, CA 92121, USA.
Crystals 2024, 14(8), 680; https://doi.org/10.3390/cryst14080680 (registering DOI)
Submission received: 3 July 2024 / Revised: 18 July 2024 / Accepted: 22 July 2024 / Published: 26 July 2024

Abstract

:
This work reports a new methodology using indentation stress relaxation to characterize the dislocation velocity–stress exponent. Through the indentation stress relaxation process, the dislocation structure builds up at the rate governed by dislocation velocity, which is a function of the externally applied stress. The relationship between the dislocation velocity and stress can thus be derived from the indentation stress relaxation data of the stress as a function of time. In this study, instrumented nanoindentation stress relaxation experiments were performed on pure aluminum samples, following three different initial displacement rates of 100, 400, and 800 nm/s. Based on the scaling properties of dislocation kinetics, the data were interpreted to derive a dislocation velocity–stress exponent of 2.5 ± 0.5 for room-temperature aluminum. Crystal plasticity finite-element simulations were performed to illustrate the sensitivity of the proposed nanoindentation stress relaxation methodology to the dislocation velocity–stress exponent value.

1. Introduction

Emerging instrumented nanoindentation techniques are facilitating the high-throughput characterization of local mechanical properties, especially in materials with microstructural heterogeneity and limited available volume, such as in nuclear materials, thin films, composites, and functionally graded materials [1,2,3,4,5]. However, the gradients of stress and strain under indentation create barriers to data interpretation. Strategies utilizing the nature of the stress fields of different indentation tip geometries have been applied to interpretate the nanoindentation data. For instance, the self-similarity of a Berkovich indenter facilitates the extrapolation of bulk hardness from indentation data subjected to the size effect [6], as well as the determination of the strain rate–stress exponent, n , of the strain rate from nanoindentation creep experiments [7,8,9,10]. However, as pointed out by Goodall and Clyne, the strain rate–stress exponent determined by the nanoindentation creep methodology is rarely consistent with that determined by conventional bulk creep testing [10]. Another example is the utilization of a flat-punch indenter to mitigate the stress gradient, as seen in several indentation creep and stress relaxation studies [11,12]. Yet, with the reduction in indenter size, the heterogeneity of the stress field at the periphery of a flat punch becomes more significant; the existing data interpretation model of the flat-punch stress relaxation also relies on the presumption of dislocation density invariance [11]. Utilizing established scaling relationships among the stress, dislocation kinetics, and time [13], we present a new approach to determine the dislocation velocity–stress exponent, m , through the nanoindentation stress relaxation method with a Berkovich indenter. In the following section, we introduce the basis of dislocation kinetics concerning the importance of m , the general stress relaxation process associated with the coevolution of stress components and dislocations. We also discuss the theorical basis for the development of a new nanoindentation stress relaxation methodology.
Plastic strain in crystalline materials is typically mediated by dislocations. Under applied stress, dislocation generation, motion, interaction, and annihilation govern both the macroscopic plastic straining and the flow stress. Notably, the relationship between dislocation velocity and stress is a key to the rate of plastic deformation. For example, it influences the kinetics of dislocation interactions that form networks, the strain rate under steady-state dislocation density, and the plastic energy dissipation during ductile fracture. This relationship has been described by a power law, shown in Equation (1), which is commonly used in both reduced-order models and physics-based models, including the crystal plasticity (CP) finite element method and dislocation dynamics simulations [14].
v = B ( σ σ i ) m ,
In Equation (1), v is the dislocation velocity, B is a material constant depending on the microstructure profile, σ is the applied stress, σ i is the internal stress, and m is a velocity–stress exponent [15,16]. m relates to the mechanism of dislocation mobility. For example, m 1 corresponds to the viscous motion of dislocations, e.g., when a solute cloud is formed and exerts a drag force on the dislocation. A much larger m ( 1 ) corresponds to the jerky movement of dislocations as the pinned dislocations break away from obstacles [16]. The unpinning process may involve thermal activation, including diffusion, for dislocations to overcome the obstacles and move freely before encountering the next obstacle.
The dislocation velocity–stress relationship and its macroscopic manifestation, the strain rate–stress relationship, can be investigated using stress relaxation experiments [11,17,18,19,20]. Following transient loading, the total strain is held constant, allowing the elastic strain, ε e , to convert to plastic strain, ε p , over time. As a result, the rate of stress relaxation, σ ˙ , is controlled by the plastic strain rate, ε p ˙ :
σ ˙ = E ε e ˙ = E ε p ˙ ,
where E is the Young’s modulus of the material. The rate of plastic strain accumulation relates to the dislocation mobility via the Orowan equation [14]:
ε ˙ p = 1 M b ρ v ,
where b is the Burgers vector, ρ is the dislocation density, and M is the Taylor factor homogenizing the dislocation motion in different grain orientations. Equation (3) assumes a constant ρ and σ i through the stress relaxation transient, so the dislocation velocity–stress exponent can be derived from the experimentally observed σ t curve, where t stands for the time passed since the start of the strain holding period [17,19]. However, the plastic straining processes are often associated with dislocation accumulation and evolution, supposedly changing both ρ and σ i . As reported in [17,21], the assumptions of constant ρ and σ i , leading to an inaccurate estimation of the effect stress, σ * , have led to errors in the estimated stress components as large as 100% [21].
In this work, we introduce an indentation-based stress relaxation methodology, whose data interpretation does not require the assumption of a fixed dislocation density. Instead, ρ and σ i are interdependent, based on their scaling relationship. For simplification and coherence with our selected model alloy system, aluminum, we employ the Orowan hardening model for this relationship [16,22]:
σ i = α M b G ρ ,
where α is the dislocation interaction constant and G is the elastic shear modulus. We also consider that the rate of dislocation accumulation correlates to plastic straining:
ρ ˙ = M b 1 Λ ε p ˙ ,
where Λ is the mean free path (MFP) of dislocations and approximates to 1/ ρ , with the absence of precipitates or grain boundaries, such as in pure metals under the nanoindentation condition. The above equations lead to the following:
σ ˙ = E b M σ i 2 α M b G 2 B σ σ i m ,
σ ˙ i = α M G 2 b σ i 2 α M b G 2 B σ σ i m ,
Defining the applied stress at the beginning of the stress relaxation process to be σ 0 , the evolutions of σ and σ i can be described by the dimensionless parameters σ + and σ i + :
σ = σ + σ 0 ,
σ i = σ i + σ 0 ,
σ + and σ i + have initial values of 1 and 0, respectively, and they decrease and increase, respectively, until σ + = σ i + . Thus, Equation (6) can be written in the following form:
σ ˙ = B E b M α M b G 2 σ 0 m + 2 ( σ i + ) 2 σ + σ i + m ,
In Equation (10), σ ˙ , is kept dimensional to be consistent with the experimental measurement in this work. The stress relaxation rate scales with the initial stress via the following:
σ ˙ ~ σ 0 m + 2 ,
The stress gradient forms underneath the Berkovich indenter, during the nanoindentation. The deeper a point is from the contact surface, the lower the stress that point experiences. Via Equations (1) and (3), the kinetics of stress relaxation depend on the local stress and thus on the depth from the contact surface. The stress relaxation process is faster at a shallower point, closer to the contact surface, than at a deeper point, which is further away. We assign d e f f and σ e f f as the effective depth and stress of the region, respectively, where stress relaxation primarily occurs at the beginning of the indenter-holding phase. Then, σ e f f scales inversely with the time elapsed during the indenter loading, t l o a d , as d e f f increases with t l o a d , during which time the stress relaxation has already taken place in the shallower region where the kinetics are faster. Defining the indenter pre-loading rate to be h ˙ ( h ˙ ~ 1 / t l o a d ), the scaling relationship between σ e f f and h ˙ can be derived based on the theorems of dislocation similitude in [13]:
σ e f f ~ t l o a d ( 1 m + 1 ) ~ h ˙ ( 1 m + 1 ) ,
where the indenter loading rate h ˙ is inversely proportional to t l o a d . Recognizing that this σ e f f is the initial stress σ 0 during the stress relaxation in Equation (10), we obtain the scaling relationship between the simultaneous stress relaxation rate, σ ˙ , and the indenter displacement rate before the relaxation, h ˙ :
σ ˙ ~ σ e f f m + 2 ~ h ˙ ( m + 2 m + 1 ) ,
With this scaling relationship, we designed and performed the following experiments with varying h ˙ and derived the dislocation velocity–stress exponent m using the obtained σ ˙ ~ h ˙ relationship. We further employed crystal plasticity (CP) simulations to illustrate the abovementioned temporal and spatial behavior of nanoindentation stress relaxation. The CP simulations showed the depth dependence of stress relaxation kinetics on h ˙ , which underpins Equation (13).

2. Materials and Methods

Commercial pure aluminum (99.9% purity) was used in this study. A specimen of 10 × 8 × 6 mm3 was mechanically ground with silicon carbide sandpapers of 600, 800, and 1200 grits, polished with 0.1 μ m alumina suspensions, and vibratory polished with 0.05 μ m alumina suspensions. This creates a mirror-like flat surface with minimal residual stress for nanoindentation experiments.
We used instrumented nanoindentation (FT-NMT04, FemtoTool, Buchs, Zwitserland) with a diamond Berkovich tip to perform the stress relaxation testing at room temperature. The indentation was first loaded in displacement-controlled mode with various displacement rates of 100, 400, and 800 nm/s. As soon as the maximum depth of 800 nm was reached, the tip was held at this depth for 60 s, during which the applied load was monitored. For each displacement rate, the dataset comprising 10 indents was analyzed to provide statistical reliability. The interspacing of the indents was greater than 20 μ m .
Crystal plasticity finite element method simulations of the stress relaxation process were performed using Idaho National Laboratory’s Multiphysics Object-Oriented Simulation Environment (MOOSE 2.0) software [23]. MOOSE uses a continuous update system, with revision history tracked by git. These simulations used the version of MOOSE current in 02_2023. The Kalidindi model was adopted as reported in [24]. The model parameters are provided in Table 1.
The simulation used a Berkovich tip with semi-angle of 65.27°, an effective cone angle of 70.3°, and a roundness of 20 nm [25]. The tip was inserted in the <001> direction of the face center cubic crystal, simulating aluminum. The displacement control was conducted in the CPFE simulation with various loading rates of 100, 800, and 1600 nm/s. The tip was held at a depth of 400 nm for 15 s to simulate the stress relaxation process. As shown later, a holding time of 15 s is sufficient for the stress relaxation of interest to fully take place. The indentation depth was reduced to 400 nm from the experimental value of 800 nm due to the limitation of computational power. Similarly, only one indentation orientation of <001> was selected to represent the general cases. However, such modification and simplifications should not qualitatively change the relationship between the stress relaxation process and the pre-loading rate, which is the key to the computational investigation in this work.

3. Results

Figure 1a presents examples of the experimental stress relaxation data following different initial loading rates. In all the cases, the stress-reduction rate is rapid at the beginning and gradually slows down towards the end of stress relaxation. The transition from the rapid/transient relaxation to the slower phase can be seen in Figure 1b, zooming into the initial relaxation period in Figure 1a. The slope of the initial stress relaxation correlates to the pre-loading rate, as expected from the above scaling analysis.
The evolution of stress with time can be described by the sum of multiple exponential terms:
σ ( t ) = σ 1 e X 1 t 1 + σ 2 e X 2 t 2 + + σ n e X n t n + σ s a t ,
where n   = 1, 2, 3, … indicates different rate components of stress relaxation, due to different relaxation mechanisms and various microstructures [26,27]. σ n is the stress drop relative to initial stress, and X n is a stress decay constant with an inverse time unit. The stress relaxation data in this study fit to a double exponent expression, Equation (15). The fitting parameters are presented in Table 2.
σ t = σ 1 e X 1 t 1 + σ 2 e X 2 t 2 + σ s a t ,
σ 1 and X 1 correspond to the rapid/transient relaxation within the first ~0.1 s, shown in Figure 1b, whereas σ 2 and X 2 correspond to the following slower relaxation process. The kinetics of the rapid/transient relaxation are strongly dependent on the pre-loading rate, whereas the kinetics during the slow relaxation are less so. The loading-rate dependency of the initial stress relaxation agrees with the above theoretical analysis of Equation (13). That is, a higher pre-loading rate leads to a higher effective stress, causing more rapid kinetics of stress relaxation. On the other hand, the secondary relaxation, characterized by σ 2 and X 2 , is believed to be due to the dynamics equilibrium process as dislocation generation is balanced by annihilation.
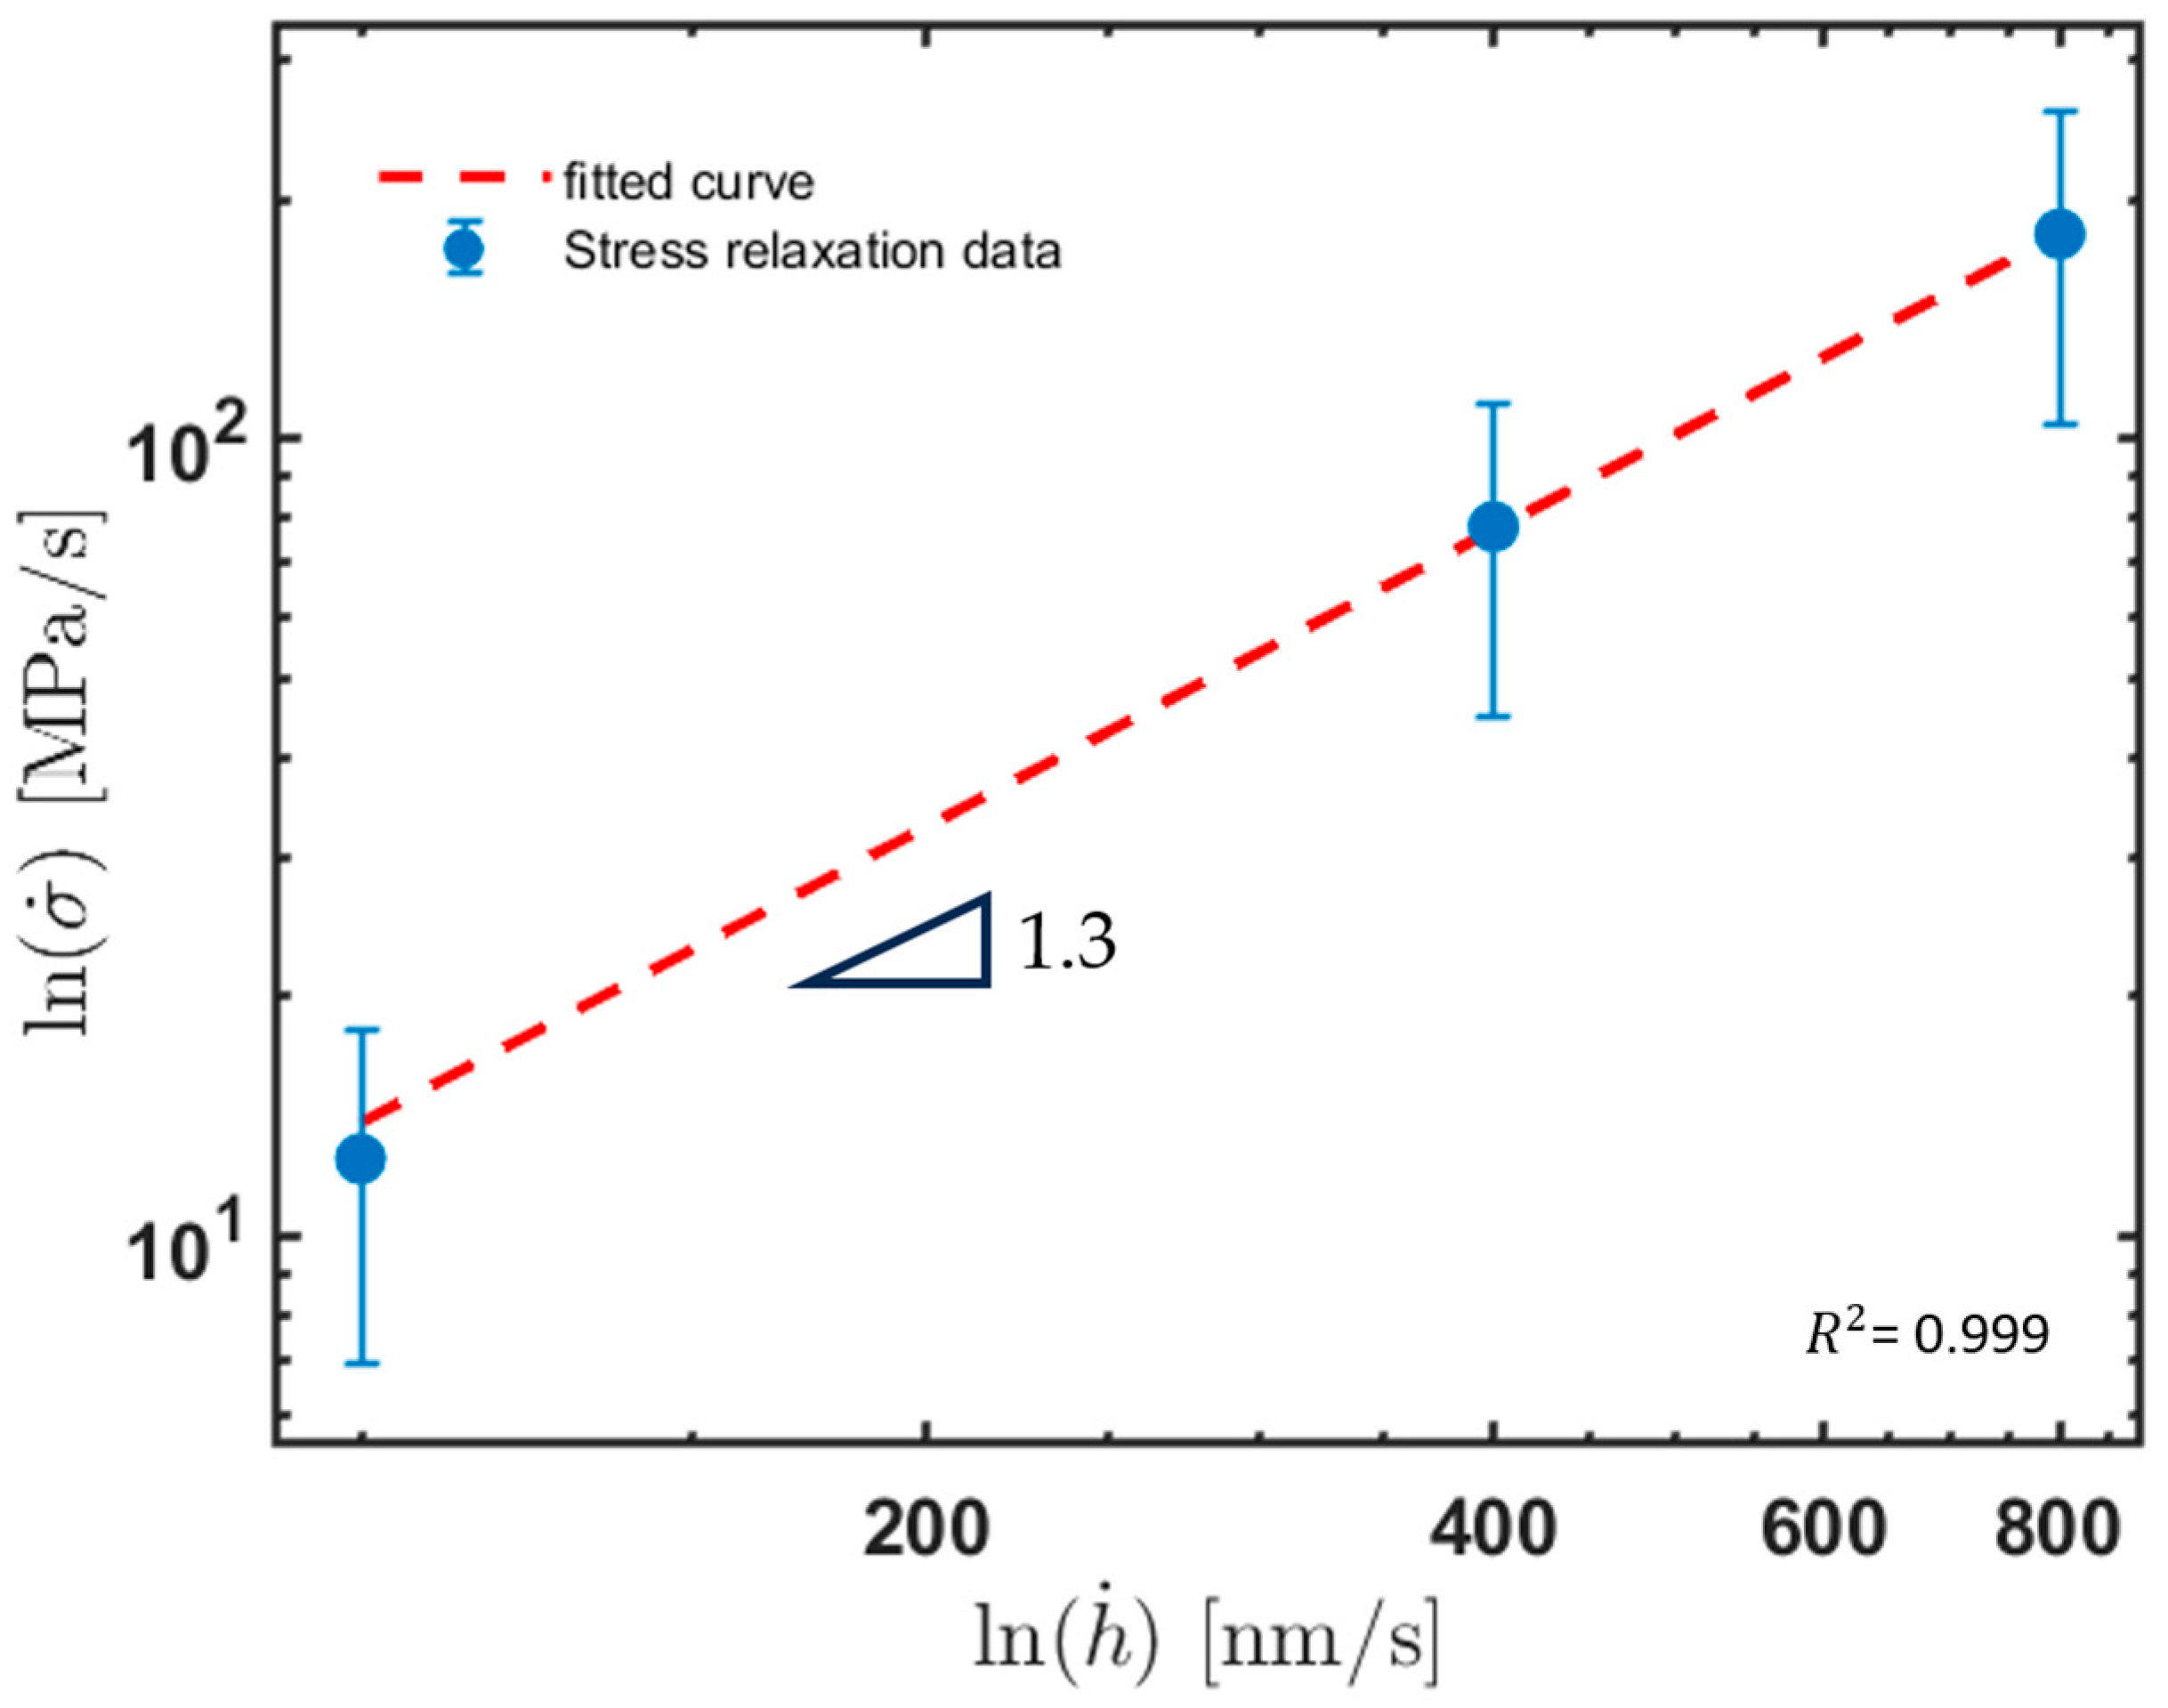
Therefore, the rate of stress change due to dislocation accumulation at the beginning of the stress relaxation can be estimated by the product of σ 1 and X 1 (i.e., σ ˙ = σ 1 ×   X 1 ). Equation (13), indicates that the stress-changing rate and pre-loading rate have an exponential relationship:
ln   σ ˙ ~ m + 2 m + 1 ln h ˙ ,
The ln σ ˙ l n ( h ˙ ) relation is shown in Figure 2; the slope was fitted to be 1.3 ± 0.3 within 95% confidence bounds. Therefore, the dislocation velocity—exponent m —is derived to be 2.5 ± 0.5, according to Equation (16).

4. Discussion

4.1. Data Validation

This value of m indicates that the dislocation velocity is governed by both the thermal activation of dislocation climb and its velocity, dominated by the MFP of a free dislocation. The former depends on the diffusion coefficient and the latter on stress [28]. Considering that vacancies are mobile in aluminum at room temperature [29], and that the dislocation MFP will be limited by the high-density dislocation network formed under indentation [8], our derived value of m of 2.5 ± 0.5 appears reasonable.
Furthermore, based on Equations (3) and (4), one can derive the strain rate–stress exponent, n , of the plastic strain rate, ε ˙ p , as equal to m + 2 . That result is because the dislocation density, ρ , and velocity, v , in Equation (3) have stress exponents of 2 and m , respectively [30]. Therefore, the strain rate–stress exponent can be derived using the reported nanoindentation stress relaxation method. In the room-temperature aluminum, we found the strain rate–stress exponent, n, to be 4.5 ± 0.5, which agrees with that derived from macroscopic creep testing, i.e., between 4 and 5 [10,31].
It is noteworthy that the strain rate–stress exponent determined by this new method aligns well with the values obtained from bulk creep testing. In contrast, the strain rate exponent derived from nanoindentation creep tests does not show this consistency. According to [10], nanoindentation creep tests are influenced by potential changes in dislocation density during deformation, as well as by significant gradients in stress, strain, and strain rate beneath the indentation. The proposed method, however, inherently accounts for these variables through the scaling relationships outlined in Equations (10)–(13).

4.2. Hypothesis Verification

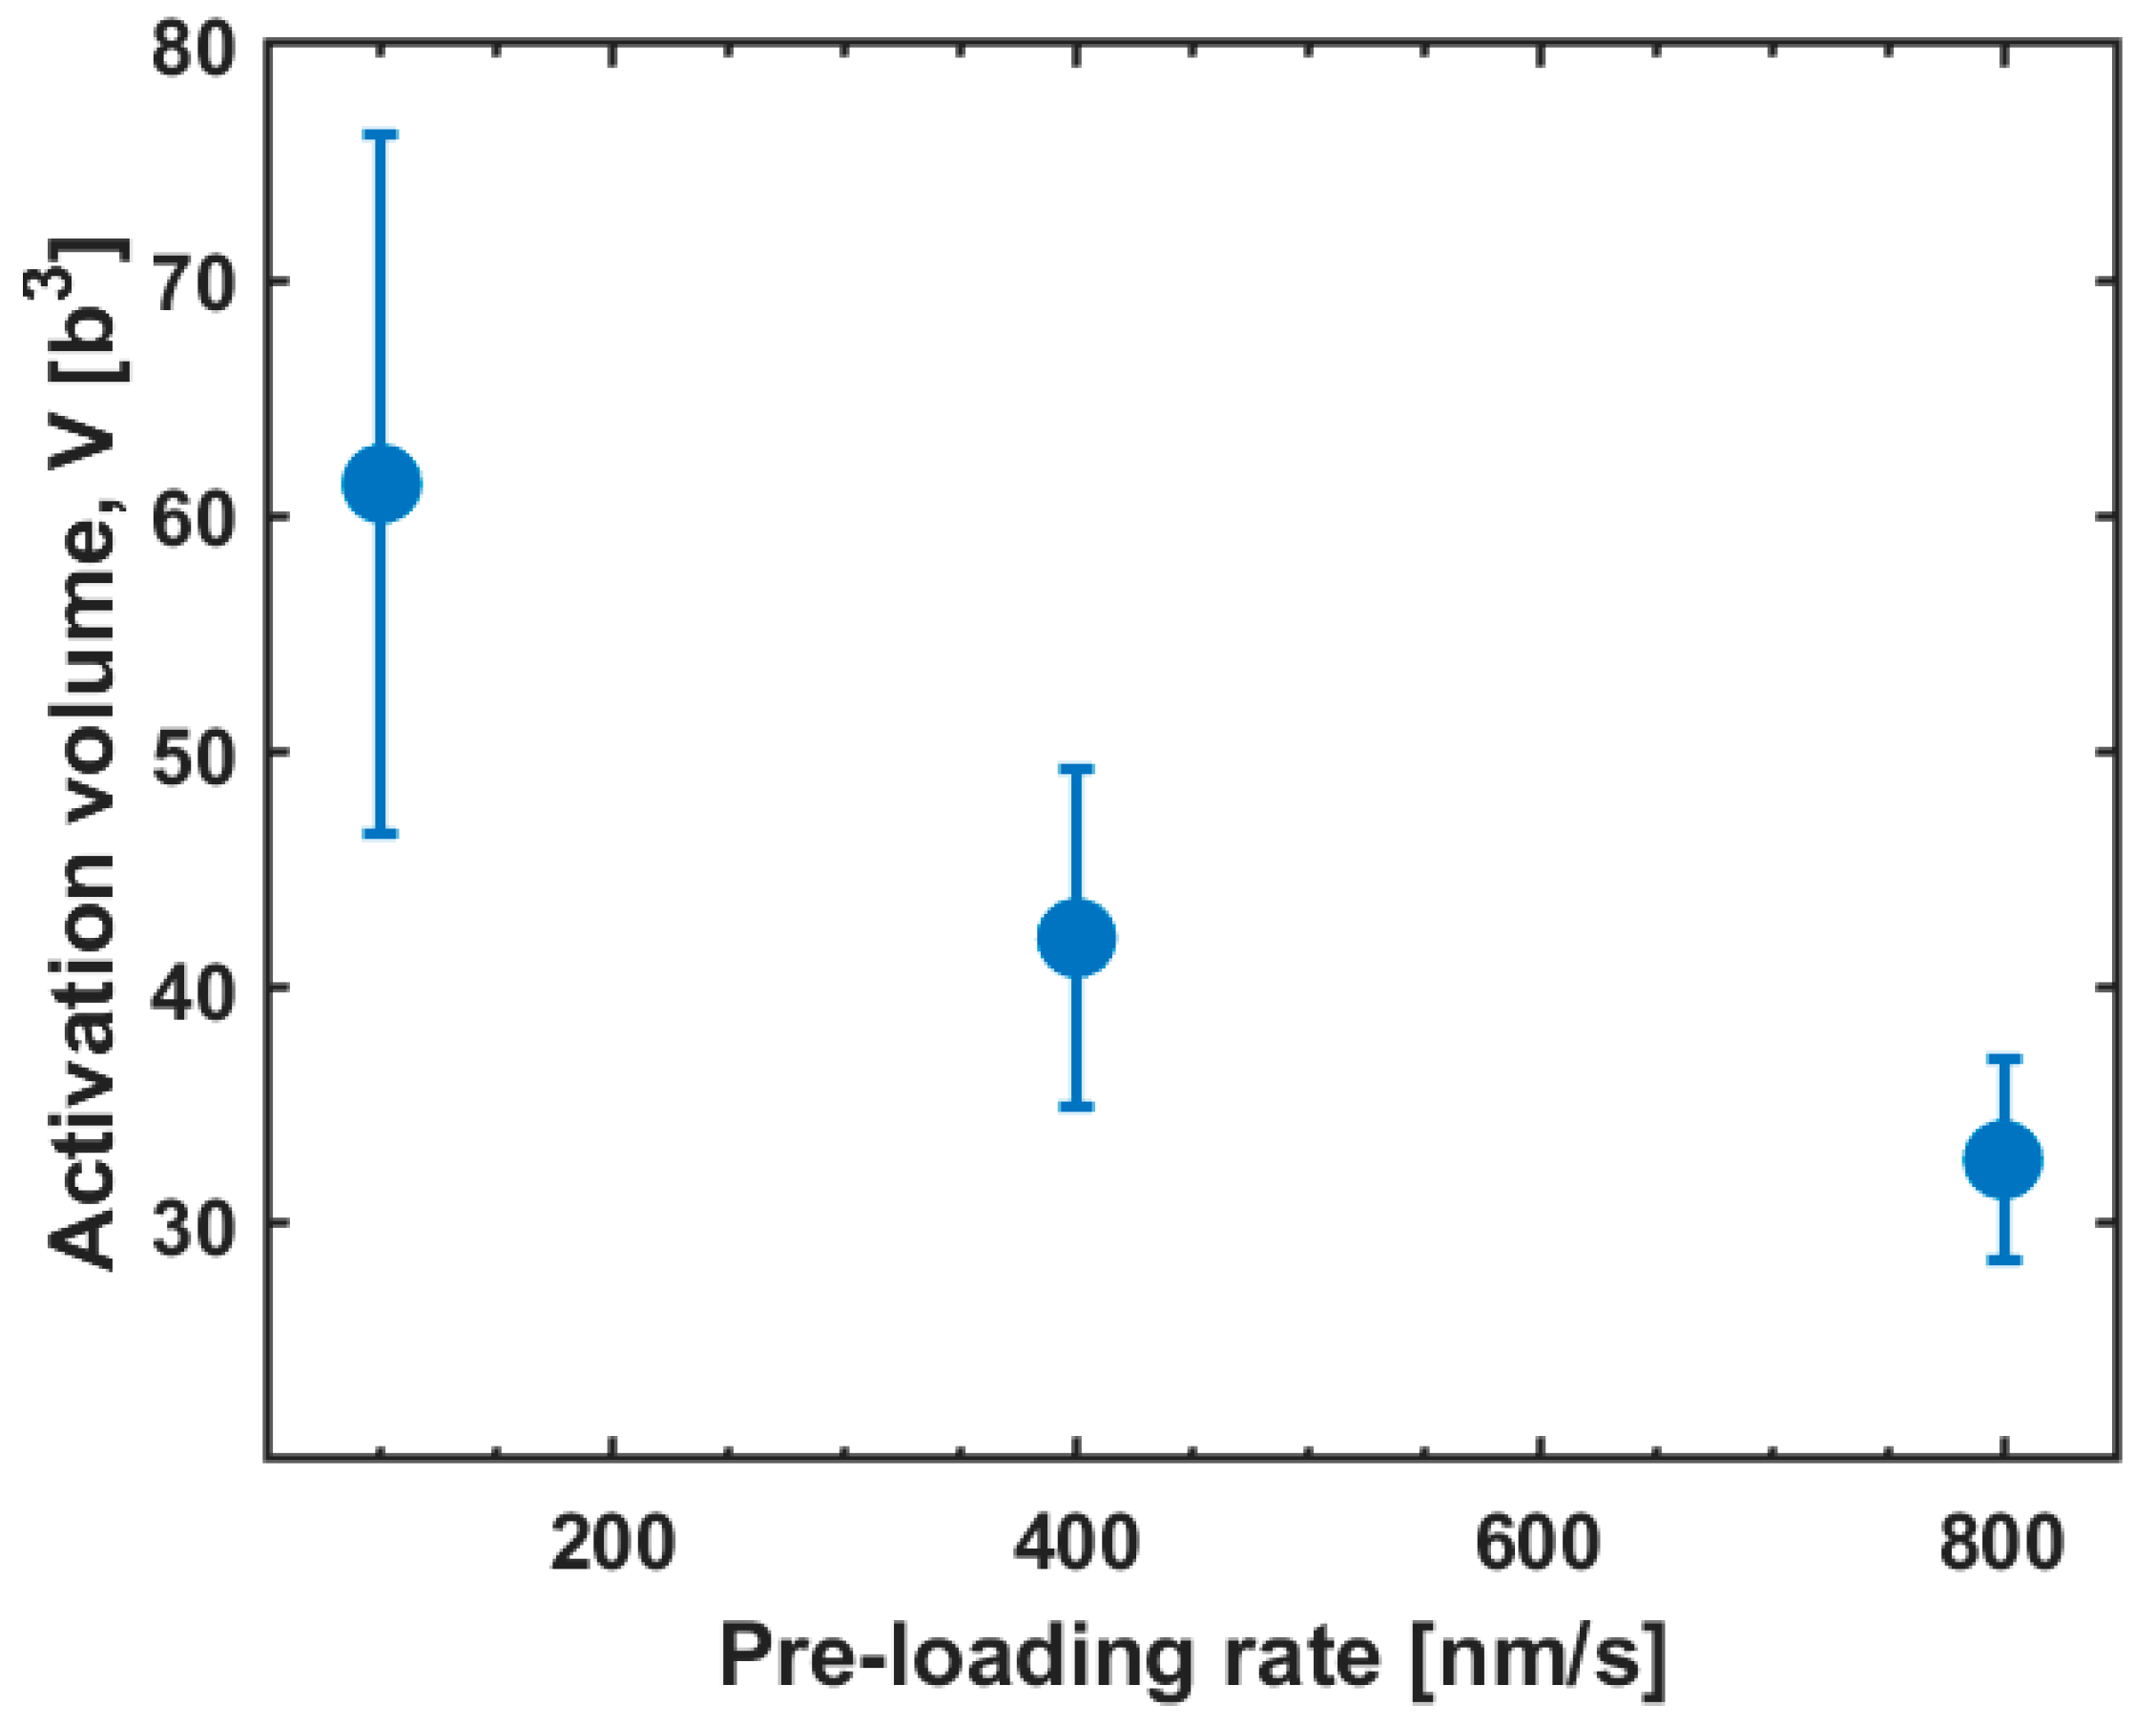
As presented in the Introduction, the theory behind this reported method relies on a hypothesis that, immediately following the indentation loading, spontaneous stress relaxation occurs at a shallower region, with respect to the indenter tip, as the pre-loading displacement rate increases. In the following section, we discuss how this hypothesis is verified using both the experimentally derived dislocation activation volume, as a function of the pre-loading rate, and CP simulations to spatially resolve the stress relaxation process.
Activation volume ( V ) represents the volume of a dislocation involved in the rate process. It is fundamentally defined based on the dislocation length ( l ), Burgers vector ( b ), and its MFP ( x ) [32], as
V = l b x ,
The activation volume under transient relaxation can be related to the stress drop over time [33]:
σ = k T V l n ( 1 + A t ) ,
where σ is the stress drop, k is a Boltzmann constant, T is temperature, A is a time constant, and t is time. By fitting the stress relaxation curves in Figure 1 to Equation (18), we obtain the dislocation activation volumes under various pre-loading rates, as shown in Figure 3. Under a higher displacement rate, the smaller activation volume implies a smaller dislocation MFP. This reduction in the MFP is because the dislocation relaxation occurs at a shallower region where the dislocation density is higher. The uncertainties of the activation volumes are believed to have two sources. Firstly, the noise from the instrument becomes more significant at a lower pre-loading rate as the stress relaxation becomes less significant (Figure 1). Secondly, for each pre-loading rate, indentations are performed on multiple grains with different grain orientations, varying the dislocation network density underneath the indenter, as reported in [8].
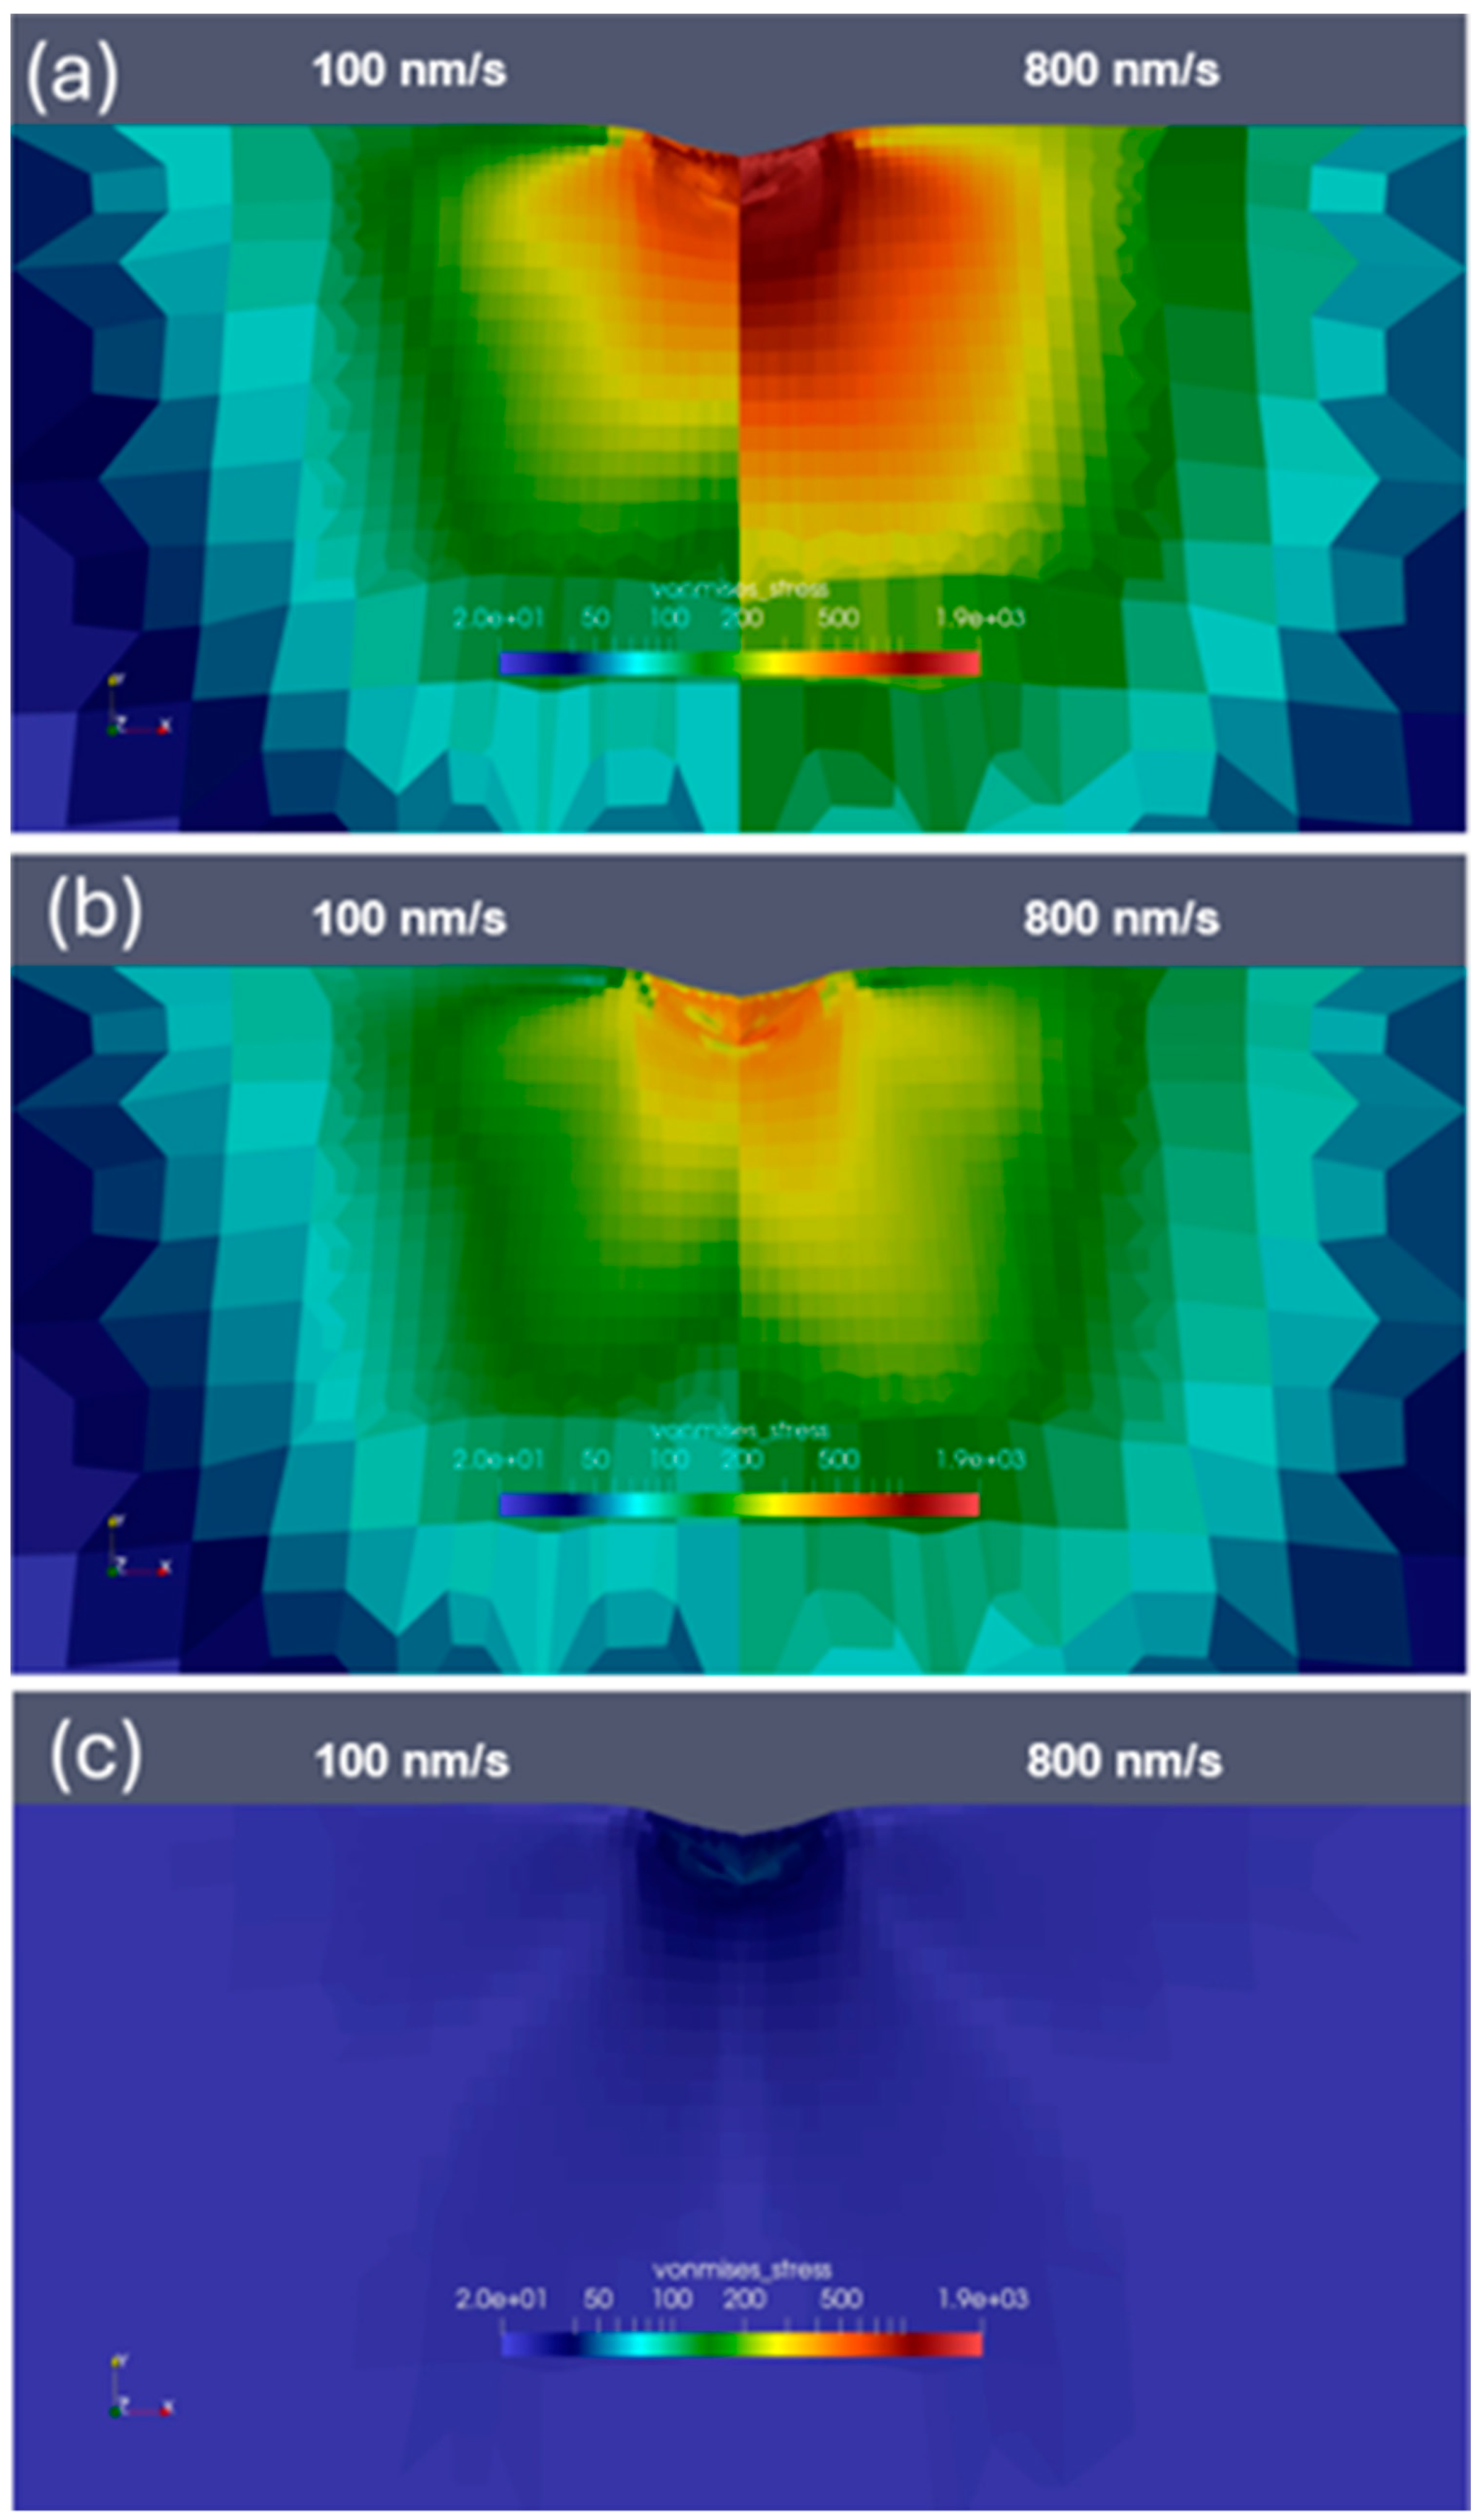
Figure 4 shows the snapshots of the CP simulations taken at 0, 1, and 15 s, following the pre-loading in Figure 4a, Figure 4b, and Figure 4c, respectively. The von Misses stress distributions in samples with pre-loading rates of 100 and 800 nm/s are shown in the left and right panels, respectively. As shown in Figure 4a, the higher initial stress in the faster-loaded sample, on the right, indicates that less stress relaxation had happened during the loading period, supporting the abovementioned hypothesis. During the first second, the stress relaxation is more significant in the faster-loaded sample, agreeing with the trend observed in Figure 1 and the σ 1 and X 1 values in Table 1. At 15 s, similar stress states are reached between the two samples, agreeing with the fact that the steady-state relaxation is less sensitive to the pre-loading rate, as shown by σ 2 and X 2 in Table 1.
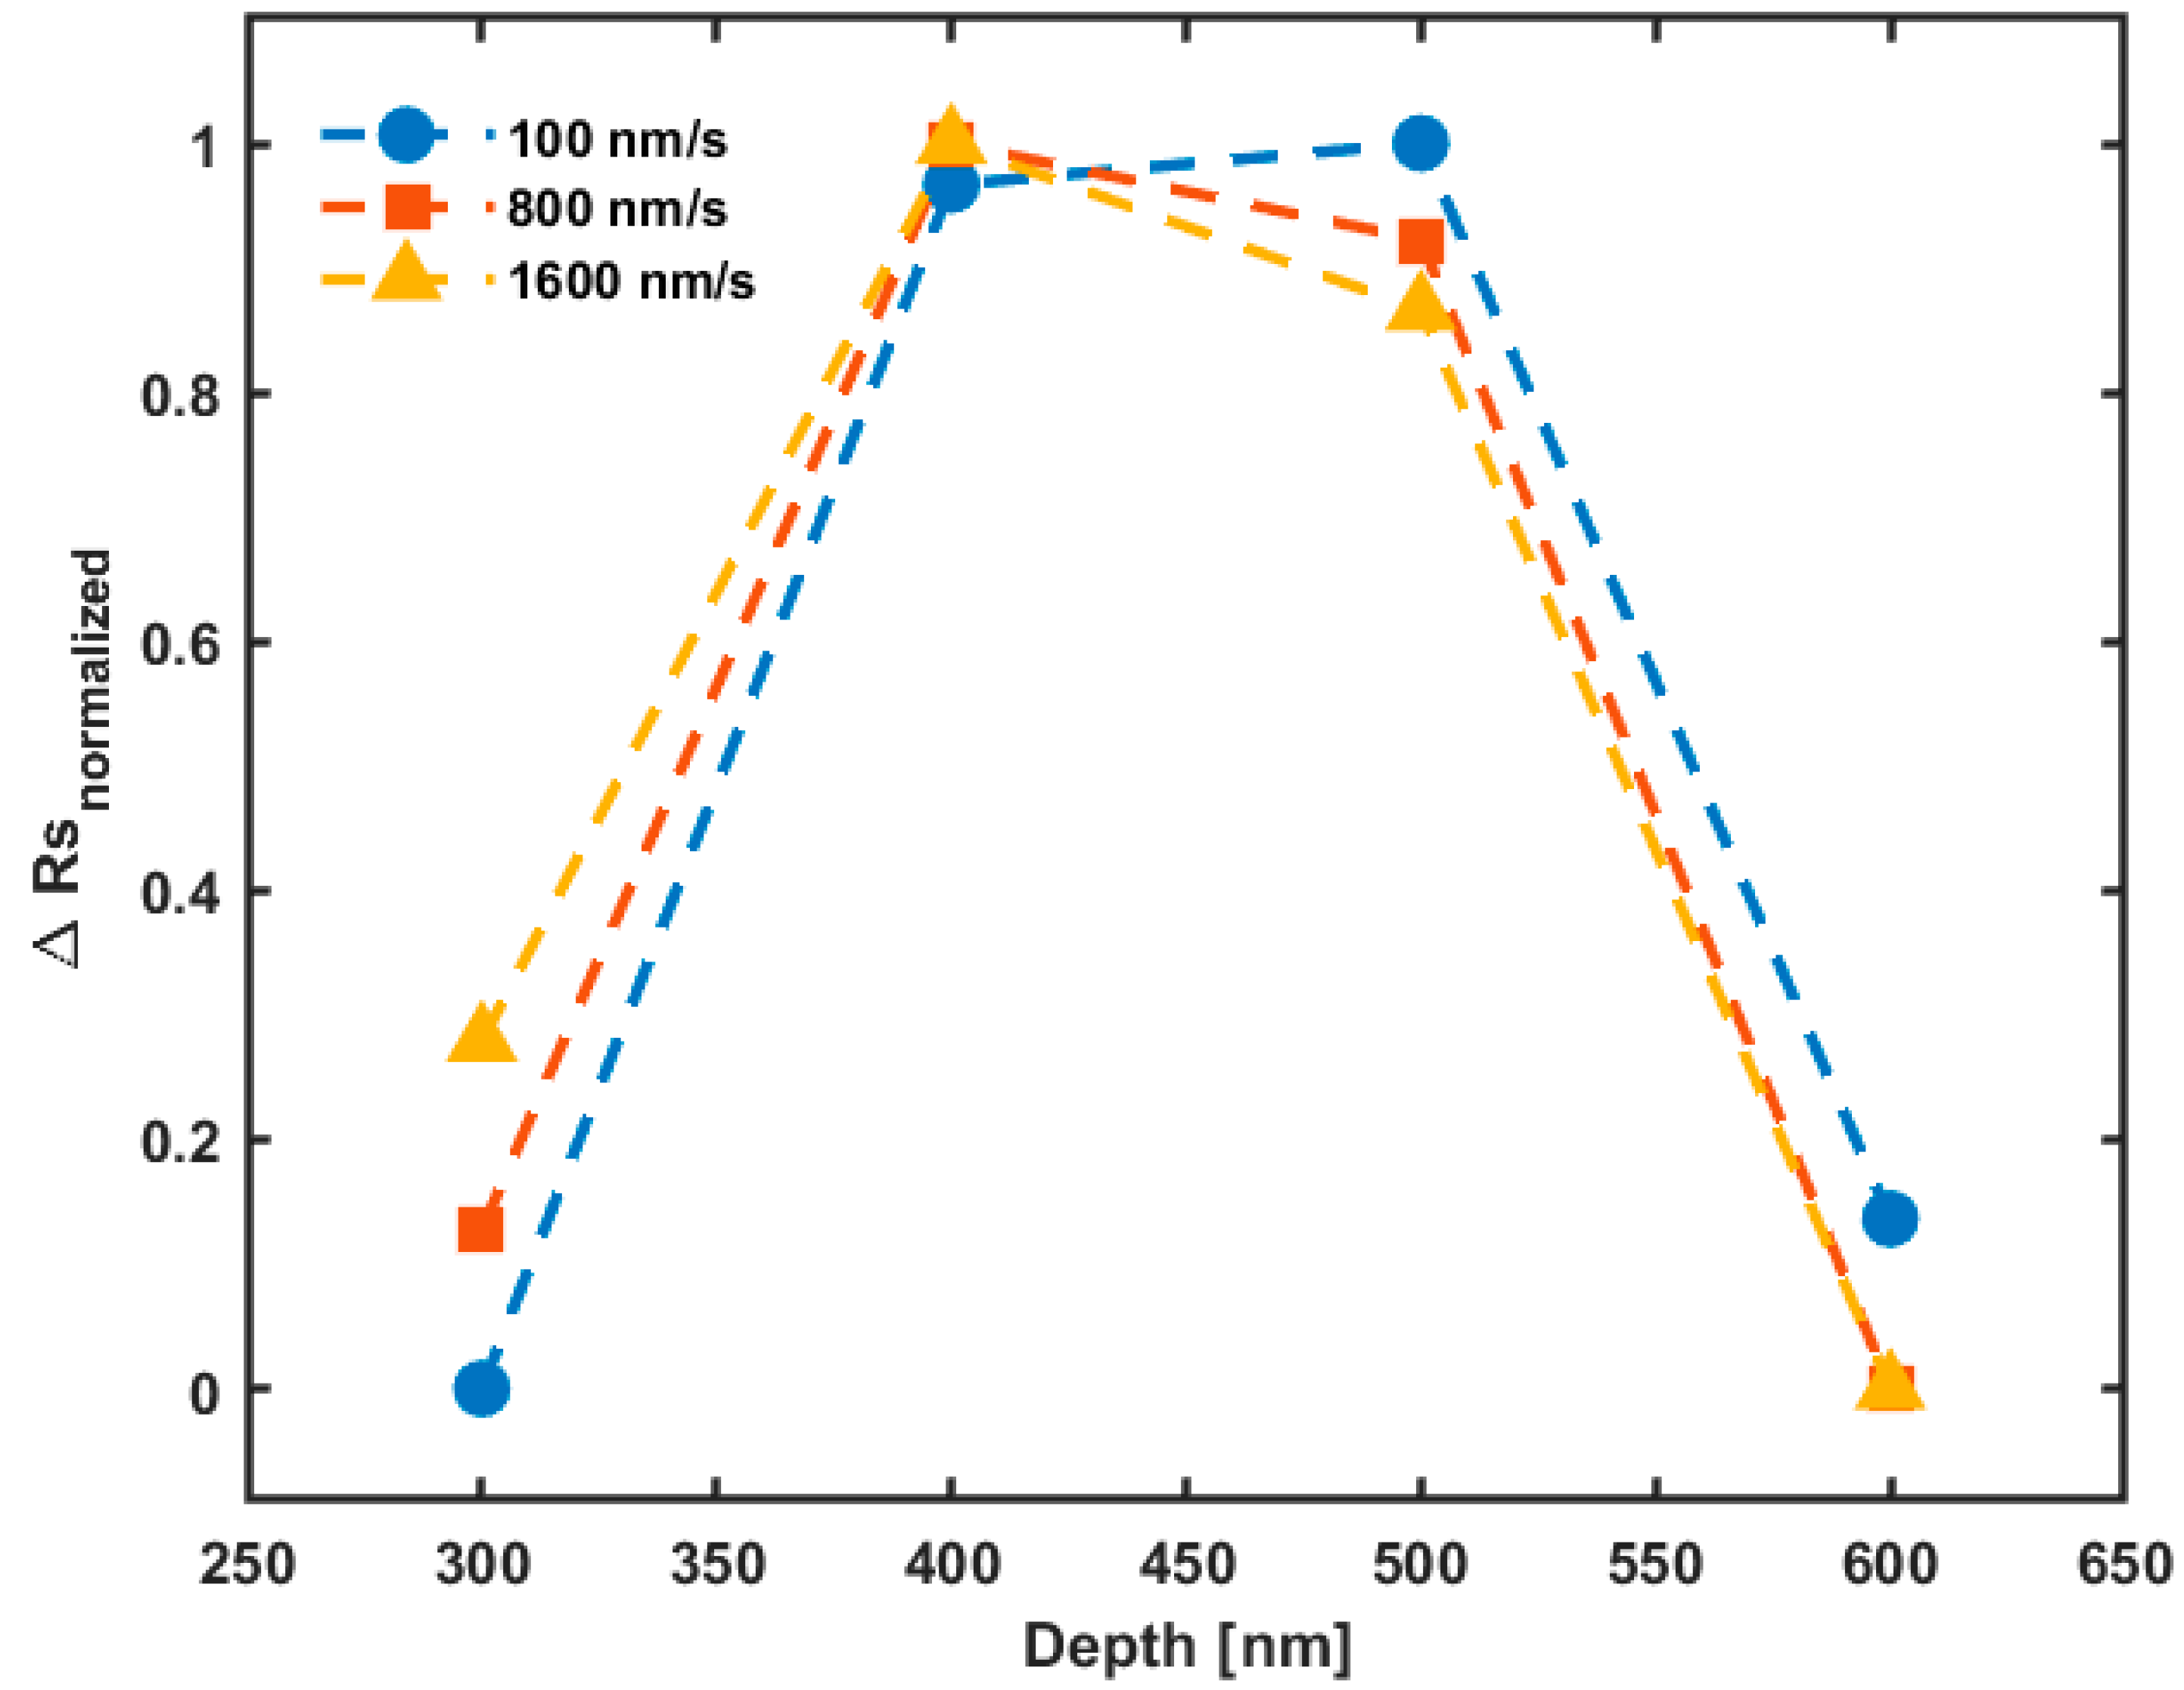
The CP stress relaxation simulation results were further analyzed to show the spatial distribution of the spontaneous dislocation accumulation following different pre-loading rates. In the Kalidindi model [24], the slip resistance, R S , is employed to characterize the dislocation density, as rationalized by Equation (4). In Figure 5, the changes in R S within the first 0.002 s of stress relaxation were probed at different depths from the indenter tip, following the pre-loading at 100, 800, and 1600 nm/s. When normalized for comparison, the data show that the dislocation accumulation rate peaks at a shallower position at a greater pre-loading displacement rate. This result, agreeing with the experimental observation in Figure 3, supports our hypothesis that the effective depth of dislocation accumulation during the stress relaxation decreases with an increasing indentation pre-loading rate.

4.3. Limitations

The limitations of the data interpretation method for nanoindentation stress relaxation arise from the applicability of the underlying scaling relationships and the constraints of instrumented nanoindentation. The scaling analysis assumes that dislocation mobility is proportional to the network density via the MPF, as described in Equations (3)–(5). However, this relationship does not apply to the dislocation-glide regime, where the high stress enhances the dislocation MPF beyond the limits set by network density.
Moreover, the range of the pre-loading rates for stress relaxation tests is constrained by the instrument’s capabilities. If the pre-loading rate is too high, the rapid initial stress relaxation may exceed the system’s dynamic response capability. Conversely, if the pre-loading rate is too low, the stress relaxation is so subtle that noise can overshadow the signal.

5. Conclusions

The stress relaxation process under nanoindentation is complicated due to the strong stress and strain gradients. For room-temperature aluminum, at least two mechanisms contribute to stress relaxation, as indicated by the two distinctive characteristic frequencies in Table 2. The more rapid stress relaxation transient, happening right after the indenter is held in position, is attributed to the dislocation accumulation and associated with an increase in internal stress and decrease in effective stress. As a result, the conventional assumptions of constant internal stress or constant dislocation density do not apply to interpreting the nanoindentation stress relaxation data. We verified that the effective depth of dislocation accumulation during the stress relaxation decreases with an increasing indentation pre-loading rate, which is a consequence of the similitude in dislocation kinetics [13]. As a result, the scaling relationship between the stress relaxation kinetics and the indentation pre-loading rate can be utilized to obtain the dislocation velocity–stress exponent, m , from a set of nanoindentation stress relaxation experiments with various pre-loading rates. This new method found m = 2.5 ± 0.5 , leading to a strain rate–stress exponent n = 4.5 ± 0.5 for pure aluminum at room temperature. Such consistency with the strain rate–stress exponent determined by the bulk creep experiment has not been achieved by other nanoindentation-based methods and is attributed to the scaling analysis in data interpretation.

Author Contributions

Conceptualization, T.C. and D.M.F.; methodology, T.C., D.Y., S.P. and T.-Y.C.; formal analysis, T.-Y.C. and G.V.; investigation, T.-Y.C. and G.V.; resources, T.C., D.M.F., D.Y. and S.P.; writing—original draft preparation, T.-Y.C. and T.C.; writing—review and editing, T.C., D.M.F., D.Y. and S.P.; visualization, T.-Y.C. and G.V.; supervision, T.C., D.M.F., D.Y. and S.P.; project administration, D.M.F.; funding acquisition, D.M.F., D.Y. and T.C. All authors have read and agreed to the published version of the manuscript.

Funding

Work supported through the Idaho National Laboratory Directed Research & Development (LDRD) Program under Department of Energy Idaho Operations Office Contract DE-AC07-05ID14517.

Data Availability Statement

Data are available upon reasonable request.

Acknowledgments

This research made use of Idaho National Laboratory’s High Performance Computing systems located at the Collaborative Computing Center and was supported by the Office of Nuclear Energy of the U.S. Department of Energy and the Nuclear Science User Facilities under Contract No. DE-AC07-05ID14517.

Conflicts of Interest

Author David M. Frazer was employed by the company General Atomics. The remaining authors declare that the research was conducted in the absence of any commercial or financial relationships that could be construed as a potential conflict of interest.

References

  1. Herbert, E.G.; Pharr, G.M.; Oliver, W.C.; Lucas, B.N.; Hay, J.L. On the Measurement of Stress–Strain Curves by Spherical Indentation. Thin Solid Films 2001, 5, 331–335. [Google Scholar] [CrossRef]
  2. Hosemann, P. Small-Scale Mechanical Testing on Nuclear Materials: Bridging the Experimental Length-Scale Gap. Scr. Mater. 2018, 143, 161–168. [Google Scholar] [CrossRef]
  3. Frazer, D.; Hosemann, P. Plasticity of UO2 Studied and Quantified via Elevated Temperature Micro Compression Testing. J. Nucl. Mater. 2019, 525, 140–144. [Google Scholar] [CrossRef]
  4. Frazer, D.; Abad, M.D.; Krumwiede, D.; Back, C.A.; Khalifa, H.E.; Deck, C.P.; Hosemann, P. Localized Mechanical Property Assessment of SiC/SiC Composite Materials. Compos. Part A Appl. Sci. Manuf. 2015, 70, 93–101. [Google Scholar] [CrossRef]
  5. Chen, T.; Frazer, D.; Cullison, M.; Teng, F.; Lian, J.; Mo, K.; Cappia, F. The Effects of Radiation-Induced Grain Subdivision and Dislocations on the Fracture Properties of Uranium Dioxide. J. Nucl. Mater. 2023, 577, 154297. [Google Scholar] [CrossRef]
  6. Nix, W.D.; Gao, H. Indentation Size Effects in Crystalline Materials: A Law for Strain Gradient Plasticity. J. Mech. Phys. Solids 1998, 46, 411–425. [Google Scholar] [CrossRef]
  7. Frazer, D.; Shaffer, B.; Gong, B.; Peralta, P.; Lian, J.; Hosemann, P. Elevated Temperature Nanoindentation Creep Study of Plastically Deformed and Spark Plasma Sintered UO2. J. Nucl. Mater. 2021, 545, 152605. [Google Scholar] [CrossRef]
  8. Chen, T.; Tan, L.; Lu, Z.; Xu, H. The Effect of Grain Orientation on Nanoindentation Behavior of Model Austenitic Alloy Fe-20Cr-25Ni. Acta Mater. 2017, 138, 83–91. [Google Scholar] [CrossRef]
  9. Chen, T.; He, L.; Cullison, M.H.; Hay, C.; Burns, J.; Wu, Y.; Tan, L. The Correlation between Microstructure and Nanoindentation Property of Neutron-Irradiated Austenitic Alloy D9. Acta Mater. 2020, 195, 433–445. [Google Scholar] [CrossRef]
  10. Goodall, R.; Clyne, T.W. A Critical Appraisal of the Extraction of Creep Parameters from Nanoindentation Data Obtained at Room Temperature. Acta Mater. 2006, 54, 5489–5499. [Google Scholar] [CrossRef]
  11. Xu, B.X.; Wang, X.M.; Yue, Z.F. Determination of the Internal Stress and Dislocation Velocity Stress Exponent with Indentation Stress Relaxation Test. J. Mater. Res. 2008, 23, 2486–2490. [Google Scholar] [CrossRef]
  12. Kutty, T.R.G.; Basak, C.B.; Kumar, A.; Kamath, H.S. Creep Behaviour of δ-Phase of U–Zr System by Impression Creep Technique. J. Nucl. Mater. 2011, 408, 90–95. [Google Scholar] [CrossRef]
  13. Zaiser, M.; Sandfeld, S. Scaling Properties of Dislocation Simulations in the Similitude Regime. Model. Simul. Mater. Sci. Eng. 2014, 22, 065012. [Google Scholar] [CrossRef]
  14. Hull, D.; Bacon, D.J. Introduction of Dislocation, 5th ed.; Elsevier: Amsterdam, The Netherlands, 2011; ISBN 978-0-7506-4681-9. [Google Scholar]
  15. Blum, W.; Eisenlohr, P.; Breutinger, F. Understanding Creep—A Review. Metall. Mater. Trans. A 2002, 33, 291–303. [Google Scholar] [CrossRef]
  16. Blum, W. Mechanisms of Creep Deformation in Steel. In Creep-Resistant Steels; Elsevier: Amsterdam, The Netherlands, 2008; pp. 365–402. ISBN 978-1-84569-178-3. [Google Scholar]
  17. Varma, A.; Krishnaswamy, H.; Jain, J.; Lee, M.-G.; Barlat, F. Advanced Constitutive Model for Repeated Stress Relaxation Accounting for Transient Mobile Dislocation Density and Internal Stress. Mech. Mater. 2019, 133, 138–153. [Google Scholar] [CrossRef]
  18. Aifantis, E.C.; Gerberich, W.W. A Theoretical Review of Stress Relaxation Testing. Mater. Sci. Eng. 1975, 21, 107–113. [Google Scholar] [CrossRef]
  19. Gupta, I.; Li, J.C.M. Stress Relaxation, Internal Stress, and Work Hardening in Some Bcc Metals and Alloys. Metall. Trans. 1970, 1, 2323–2330. [Google Scholar] [CrossRef]
  20. Dotsenko, V.I. Stress Relaxation in Crystals. Phys. Status Solidi B 1979, 93, 11–43. [Google Scholar] [CrossRef]
  21. Kruml, T.; Coddet, O.; Martin, J.L. About the Determination of the Thermal and Athermal Stress Components from Stress-Relaxation Experiments. Acta Mater. 2008, 56, 333–340. [Google Scholar] [CrossRef]
  22. Barlat, F. A Simple Model for Dislocation Behavior, Strain and Strain Rate Hardening Evolution in Deforming Aluminum Alloys. Int. J. Plast. 2002, 18, 919–939. [Google Scholar] [CrossRef]
  23. Lindsay, A.D.; Gaston, D.R.; Permann, C.J.; Miller, J.M.; Andrš, D.; Slaughter, A.E.; Kong, F.; Hansel, J.; Carlsen, R.W.; Icenhour, C.; et al. 2.0—MOOSE: Enabling Massively Parallel Multiphysics Simulation. SoftwareX 2022, 20, 101202. [Google Scholar] [CrossRef]
  24. Kalidindi, S.R.; Bronkhorst, C.A.; Anand, L. Crystallographic Texture Evolution in Bulk Deformation Processing of FCC Metals. J. Mech. Phys. Solids 1992, 40, 537–569. [Google Scholar] [CrossRef]
  25. Karimzadeh, A.; Koloor, S.S.R.; Ayatollahi, M.R.; Bushroa, A.R.; Yahya, M.Y. Assessment of Nano-Indentation Method in Mechanical Characterization of Heterogeneous Nanocomposite Materials Using Experimental and Computational Approaches. Sci. Rep. 2019, 9, 15763. [Google Scholar] [CrossRef] [PubMed]
  26. Kubát, J.; Rigdahl, M. The Exponential and Power Laws of Stress Relaxation Kinetics and a General Relation between the Activation Volume and Effective Stress. Phys. Status Solidi A 1976, 35, 173–180. [Google Scholar] [CrossRef]
  27. Hérault, Q.; Gozhyk, I.; Balestrieri, M.; Montigaud, H.; Grachev, S.; Lazzari, R. Kinetics and Mechanisms of Stress Relaxation in Sputtered Silver Thin Films. Acta Mater. 2021, 221, 117385. [Google Scholar] [CrossRef]
  28. Caillard, D.; Martin, J.-L. Thermally Activated Mechanisms in Crystal Plasticity; Pergamon: Amsterdam, The Netherlands, 2003; ISBN 978-0-08-042703-4. [Google Scholar]
  29. Zinkle, S.J. Radiation-Induced Effects on Microstructure. In Comprehensive Nuclear Materials; Elsevier: Amsterdam, The Netherlands, 2020; pp. 91–129. ISBN 978-0-08-102866-7. [Google Scholar]
  30. Kassner, M.E.; Pérez-Prado, M.-T. Fundamentals of Creep in Metals and Alloys, 1st ed.; Elsevier: Amsterdam, The Netherlands; Heidelberg, Germany, 2004; ISBN 978-0-08-043637-1. [Google Scholar]
  31. Ueda, S.; Kameyama, T.; Matsunaga, T.; Kitazono, K.; Sato, E. Re-Examination of Creep Behaviour of High Purity Aluminium at Low Temperature. J. Phys. Conf. Ser. 2010, 240, 012073. [Google Scholar] [CrossRef]
  32. Gibbs, G.B. Creep and Stress Relaxation Studies with Polycrystalline Magnesium. Philos. Mag. J. Theor. Exp. Appl. Phys. 1966, 13, 317–329. [Google Scholar] [CrossRef]
  33. Kombaiah, B.; Murty, K.L. Dislocation Cross-Slip Controlled Creep in Zircaloy-4 at High Stresses. Mater. Sci. Eng. A 2015, 623, 114–123. [Google Scholar] [CrossRef]
Figure 1. Nanoindentation stress relaxation curves following pre-loading at various displacement rates (a) and the initial transient relaxation within the first second (b).
Crystals 14 00680 g001
Figure 2. Correlation between transient stress-changing rate due to dislocation accumulation and pre-loading rate.
Crystals 14 00680 g002
Figure 3. Activation volume of transient stress relaxation as a function of indentation pre-loading rate.
Crystals 14 00680 g003
Figure 4. Comparison between von Misses stress distributions of samples pre-loaded at 100 (left) and 800 nm/s (right) after 0, 1, and 15 s following indentation loading in (a), (b), and (c), respectively.
Crystals 14 00680 g004
Figure 5. Normalized spontaneous slip resistance changes as a function of depth from indenter tip following indenter pre-loading at 100, 800, and 1600 nm/s loading rates.
Crystals 14 00680 g005
Table 1. Parameterization for aluminum CP model.
γ ˙ 0 Reference Slip Rate0.001 s−1
h 0 Hardening Constants75 M P a
g 0 Initial Slip Resistance31 M P a
g s a t Saturated Slip Resistance63 M P a
x m Strain Rate Sensitivity0.333
q Latent Hardening Constant1.4
a Hardening Exponent2.25
C 11 Elasticity Tensor107 M P a
C 12 Elasticity Tensor61 M P a
C 44 Elasticity Tensor28 M P a
Table 2. Fitting parameters of double exponent at various loading rates.
Pre-Loading Rate (nm/s)800400100
σ 1  (MPa)61 ± 244 ± 423 ± 1
X 1  (/s)3.2 ± 0.41.9 ± 0.50.67 ± 0.01
σ 2  (MPa)150 ± 10163 ± 7154 ± 6
X 2  (/s)0.037 ± 0.010.027 ± 0.0040.018 ± 0.004
σ s a t  (MPa)300 ± 22340 ± 20363 ± 3
Disclaimer/Publisher’s Note: The statements, opinions and data contained in all publications are solely those of the individual author(s) and contributor(s) and not of MDPI and/or the editor(s). MDPI and/or the editor(s) disclaim responsibility for any injury to people or property resulting from any ideas, methods, instructions or products referred to in the content.