Article

Critical Aluminum Etch Material Amount for Local Droplet-Etched Nanohole-Based GaAs Quantum Dots

Lehrstuhl für Angewandte Festkörperphysik, Ruhr-Universität Bochum, Universitätsstraße 150, 44801 Bochum, Germany
*
Author to whom correspondence should be addressed.
Crystals 2024, 14(8), 714; https://doi.org/10.3390/cryst14080714
Submission received: 12 July 2024 / Revised: 31 July 2024 / Accepted: 5 August 2024 / Published: 9 August 2024
(This article belongs to the Special Issue Materials and Devices Grown via Molecular Beam Epitaxy)

Abstract

:
Local droplet-etched-based GaAs quantum dots are promising candidates for high-quality single and entangled photon sources. They have excellent optical and spin properties thanks to their size, shape and nearly strain-free matrix integration. In this study, we investigate the onset of aluminum nanodroplet formation for the local droplet etching process. Using molecular beam epitaxy, we grew several local droplet-etched quantum dot samples with different arsenic beam equivalent pressures. In each sample, we varied the etch material amount using a gradient technique and filled the nanoholes with GaAs to form optically active quantum dots after overgrowth. We repeated the local droplet etching process without the filling process, enabling us to characterize surface nanoholes with atomic force microscopy and compare them with photoluminescence from the buried quantum dots. We found a linear dependency on the arsenic beam-equivalent pressures for a critical aluminum amount necessary for nanohole formation and analyzed shape, density and optical properties close to this transition.

1. Introduction

Self-assembled semiconductor quantum dots (QDs) are promising candidates for the generation of single photons [1,2,3]. Due to their device integrability, they are excellent candidates for applications in the fields of quantum communication and quantum cryptography [4]. Examples are Stranski–Krastanov (SK) InAs QDs in GaAs [5] and the local droplet-etched (LDE) quantum dots [6,7] used here. GaAs-filled LDE QDs in (Al,Ga)As can be tuned to emit at wavelengths below 800 nm [8,9], making them ideal for quantum memory applications in, e.g., Rubidium atom vapor D2 and D1 transitions ( 780   nm and 795   nm ) [10,11] or silicon defects in silicon carbide ( 737   nm ) [12]. Since indium is not required for LDE QDs, LDE QDs can be grown virtually strain-free [13], which offers a number of advantages, e.g., for coherent electron- and nuclear spin properties and manipulation [14,15,16,17,18]. LDE QDs also achieve a higher oscillator strength compared to both SK-InGaAs and droplet epitaxial QDs [19,20], making them ideal as quantum light sources of indistinguishable photons [2,21].
There are a couple of crucial parameters for the integration of QDs into such devices. These are the emission wavelength, QD density and shape. The wavelength is largely determined by the constituents’ bandgaps but can be tuned by the size [8,9,19]. This parameter has to be matched to the device application. For LDE QDs, it has been shown that the density depends on the substrate temperature during nucleation [22,23], while low-density QDs are preferential for single quantum emitter devices. The shape and size impact the oscillator strength and radiative lifetime [19,24] and alter the coupling to phonons [25]. Radiative [26] and non-radiative [27] Auger processes may as well be influenced by the shape and size of the QDs.
Typically, an abundance of arsenic is provided for the molecular beam epitaxy growth of AlAs, GaAs or InAs layers [28], as well as for nanowire or QD formation. In the LDE process, the amount of arsenic is significantly reduced, whereby the material of elemental group III, in this case aluminum, is deposited in its metallic form onto the wafer’s surface. Here, this is an (Al,Ga)As matrix. In depositing a sufficient amount, aluminum droplets form on this matrix, which “etch” into the surface at low As pressure and form nanoholes [29,30]. The etching process is driven by the arsenic concentration gradient between the aluminum droplet and the matrix material. Material is transported to the substrate surface and edges of the droplet [30]. These holes are filled with GaAs and the amount of filling material determines the filling height and thus the emission wavelength [8,9]. To achieve quantum confinement for electrons and holes and to decouple them from the exterior, the filled holes are covered with an AlGaAs layer.
The LDE process is highly dependent on the As-BEP [23,29,31,32,33]. Here, we want to investigate the transition to hole formation with very small amounts of etching material to find the critical Al-amount. For this purpose, we analyze the onset of nanohole formation for a series of samples with LDE nanoholes nucleated with different arsenic flux and aluminum etching material gradients. The QDs created by filling the LDE nanoholes with GaAs are then examined using photoluminescence. In addition to the buried quantum dots, the LDE process was repeated again without filling on the surface so that the density and shape of similarly synthesized nanoholes can be determined using AFM measurements.

2. Methods

All samples were grown in an adapted Riber Epineat III/V S MBE system. The growth was performed on 3   inch undoped GaAs wafers with (001)-orientation and a miscut of less than 0.1 ° . There is an angle of 49 ° between the effusion cells and the substrate wafer, as shown in Figure 1a. The distance between the opening of the effusion cells and the center of the substrate is 255   mm . The azimuth angle difference between the aluminum and gallium effusion cell is 110 ° . This determines the orientation of the AlGaAs compositional gradients. The temperature at which the growth took place on the substrate was set using a pyrometer before growth started. To dioxide the wafer, the sample was brought to a temperature of 640   under an arsenic beam equivalent pressure (BEP) of 9.6   μ Torr and left there for 10 min. For layer growth, a substrate temperature of 590   and an As-BEP of 9.6   μ Torr were used. The growth rates for GaAs are 0.20   nm / s , for AlAs 0.10   nm / s and for Al0.33Ga0.67As 0.30   nm / s .
A total of four samples were used for this study. The growth for all samples started with a 100   nm GaAs buffer layer. This was followed by a short-period superlattice (SPSL) of 20 repetitions of a combination of a 2.8   nm -thick AlAs layer and a 2.8   nm -thick Al0.33Ga0.67As layer. These layers are there to ensure that the surface is as smooth as possible so that the growth of the relevant layers is as undisturbed as possible. This was overgrown by a 70   nm -thick Al0.33Ga0.67As buffer layer. All layers so far have been grown with substrate rotation. For the next layers, the rotation of the wafer was stopped, causing material gradients across the wafer. The first gradient is the AlGaAs matrix. In addition to an insignificant variation in composition, the material gradient results in a sinusoidal variation of the surface roughness due to the fact that the surface alternates between complete layers and incomplete, fractional filling layers. Bart et al. [34] call this roughness modulation a pattern-defining layer (PDL). The PDL leads to a wavelength shift in LDE QDs [8] and a density modulation in InAs quantum dots [34]. The steepness of the density gradient determines the modulation period. Here, the overall thickness of the rotation-stopped PDL is 15   nm for all samples, resulting in a thickness difference of 6   nm from the close to the far side of the cells. This leads to a modulation period of 3   mm . The PDL gradient is visualized in Figure 1a, where the Al0.33Ga0.67As PDL is depicted as a purple layer grown on top of the black substrate.
The substrate temperature has now been reduced for the LDE process to 545   ° C . The aluminum etch material makes up the second gradient and is visualized in Figure 2b. For the LDE process, the arsenic valve was partially closed to obtain a low arsenic chamber pressure and flux to the surface. After partially closing the arsenic valve, 240   s were waited to reduce the growth chamber pressure. After Al-deposition at an AlAs equivalent rate of 0.10   nm / s and according to an Al-shutter opening time of 2 to 3.5   s , the etching process then runs for 180   s . The As-BEP is the main difference between the samples and is the parameter to be investigated in this study. Since the As-BEP cannot be measured during growth, the etching recipe was repeated shortly before and after growth with a flux measurement gauge at the sample position to obtain values for the arsenic BEP at the start and end of the etching process. The utilized As-BEPs varied from 0.15   μ Torr to 0.68   μ Torr . The mean value of the As-BEP at the beginning and end of the etching process is shown in Table 1. The internally used naming of the samples, which comes from the order in which the samples were grown, is seen and, additionally, the further used naming of the samples according to the analyzed parameter of the As-BEP in nTorr is printed in bold. The droplet deposition process, illustrated in Figure 1b, involves the deposition of the blue Al etching material onto the previously grown purple PDL. A portion of the etching material undergoes crystallization with the As-BEP present within the chamber, resulting in the formation of an AlAs layer. However, it is noteworthy that there exists a threshold for the etching material. When this threshold is exceeded, the aluminum starts to form droplets on the surface. These droplets subsequently transform into nanoholes. The intricacies of this process will be explored in greater depth in this study.
The third gradient is the GaAs filling material of the previously etched holes starting simultaneously with the As-valve opening, i.e., a BEP of 9.6   μ Torr , and it can be seen in Figure 1c. The Ga-gradient changes the filling amount across the wafer, which in turn changes the emission wavelength [8]. The nominal filling amounts at the wafers’ centers are shown in Table 1. After deposition of the GaAs filling material, the sample was annealed for another 180   s . This is followed by another rotated 26   nm thick Al0.33Ga0.67As layer and a 13-pair SPSL consisting of alternating 2.8   nm AlAs and 2.8   nm Al0.34Ga0.66As layers. Finally, another PDL and etching process followed (see above), which was terminated by rapidly lowering the substrate temperature. The filling of the nanoholes is shown in Figure 1c, where the previously etched nanoholes are filled with GaAs. The nanoholes are not up to scale and the figure is just for illustrative purposes. The gradients are visualized in Figure 1d. We should note that the Al-etch amount was adapted for each sample to find a critical etch amount around the wafer center, allowing for similar growth conditions between all samples. The Al etch amount and Ga fill amount are identical for samples 150n and 175n, and the As BEP between samples 150n and 175n shows marginal differences, confirming replicability of the method.
The upper layers are used to analyze the LDE hole density by AFM measurements, whereby the formation of LDE holes is to be investigated. The AFM measurements were performed with a Park Systems AFM in NCHR mode. The rough AFM measurements, where the density is extracted from, consist of a 20 × 20   μ m 2 map. In the case of sample 510n, higher-resolution AFM measurements were conducted along the transition where quantum dots were identified via the coarse AFM measurements. These high-resolution measurements, with an increased pixel density, were utilized to determine the quantum dots’ depth and diameter. Further details are elaborated in the results section. The characterization of the buried QDs was also carried out using PL spectroscopy. For this purpose, a homemade setup was used, consisting of a 3 copper cold finger in a cryostat. The cryostat was cooled with liquid nitrogen so that the temperature can be kept at about 100   K during the measurements. For the purpose of wafer mapping, the entire cryostat was maneuvered using a dual-stepper motor system. This allows for precise positioning and comprehensive mapping of the wafer surface. A 518   nm laser with a spot size 100   μ m in diameter and a power of approximately 30   μ W was used to excite the QDs in the sample, allowing for the collective emission of a QD ensemble to be investigated. A mini-spectrometer (spectral resolution of 1.38   nm ) equipped with a Si CCD detector was used to measure the PL at wavelengths from 340   nm to 1020   nm .
The cell flux distribution profiles are estimated from PL wafer mapping of rotation-stopped grown quantum wells [35].

3. Results and Discussion

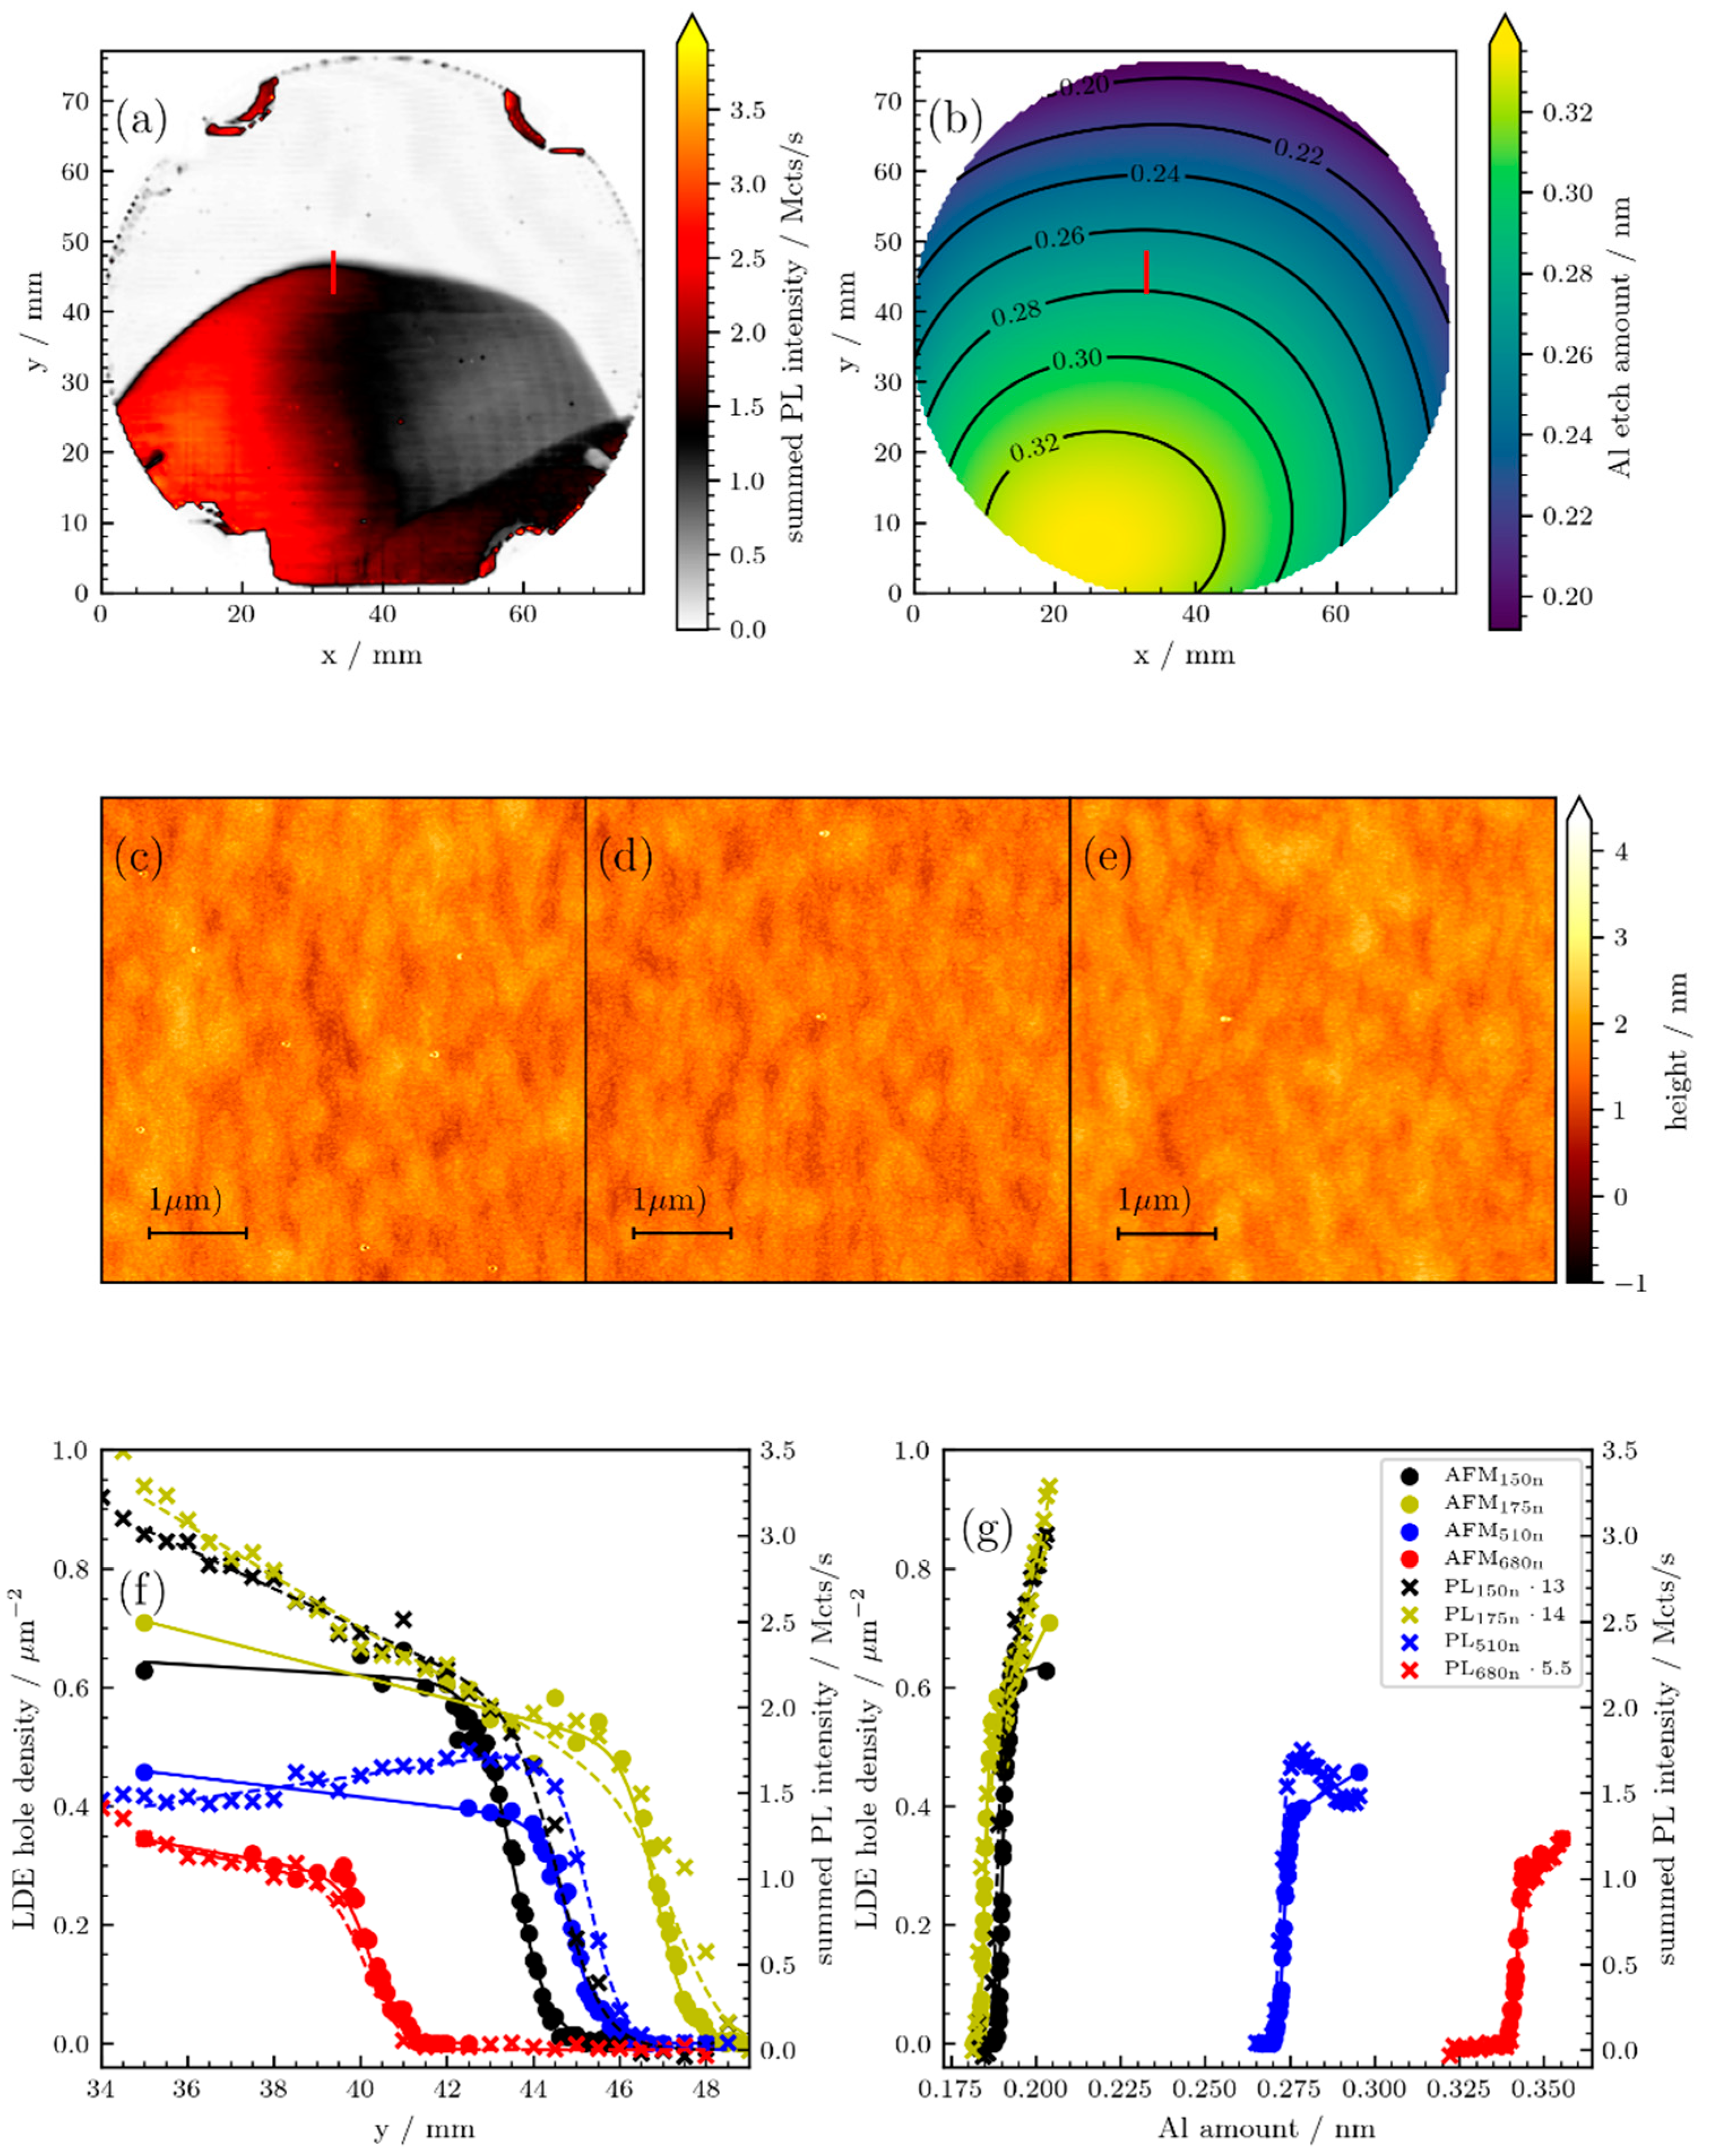
Figure 2a shows a wafer map of the integrated PL intensity for wavelengths between 750 and 820   nm (QD-related luminescence) for sample 680n. No emission in the upper part ( y > 40   mm ) of the wafer is found. It can be interpreted to mean that no QDs can be found in that region.. This is because the critical Al etch amount for the formation of droplet-etched holes has not yet been reached. This critical Al etch amount depends on the As-BEP, which is summarized for all samples in Table 1. Figure 2b shows the calculated layer thickness, which represents the Al etch material amount equivalent across the wafer. In Figure 2b, the radiation profile of the Al effusion cell can also be seen in the contour lines, which explains the course of the quantum dot transition line in Figure 2a. Figure 2c–e depicts AFM measurements conducted on sample 510n. We take 20 × 20 μm2 non-contact-mode AFM scans and manually count the number of nano holes from 5 × 5 μm2 sections. Figure 2c presents the measurement at y = 44   mm , with a corresponding hole density of 0.37 8   μ m 2 with the uncertainty of the last printed digit given in brackets. Figure 2d illustrates the measurement at y = 45   mm , where the hole density is 0.17 6   μ m 2 . Lastly, Figure 2e displays the measurement at y = 45.8   mm , with a hole density of 0.03 3   μ m 2 . Figure 2f shows the LDE hole density along the red line shown in Figure 2a perpendicular to the transition line in steps of 100   μ m for all samples and the integrated QD-related PL intensity in 0.5   mm steps (wavelength from 750   nm to 820   nm for samples 150n, 175n and 680n; 680   nm to 780   nm for sample 510n). The LDE hole density was extracted from AFM measurements that were made along the dashed line shown in Figure 2a. Each point represents a 20 × 20   μ m 2 -sized AFM measurement from which the LDE hole density can be extracted. It can be seen that the LDE hole density falls in a linear fashion until it gets to a certain point and sharply falls off to 0 over a distance of roughly 2   mm . The PL intensity follows a similar trend except for sample 510n, where the PL intensity increases in the linear range. The sharp drop in PL intensity and LDE hole densities coincides relatively well and shows that the LDE process is reproducible. We attribute deviations between PL intensity and AFM density to differences in the QDs’ carrier capture cross-section [36,37,38,39] and oscillator strength [19]. This manifests especially in the linear slopes of sample 510n with the smallest GaAs filling height. A combination of a linear fit in the linear range and a logistic function L / ( 1 + e k θ Al θ Al , crit ) for the sharp drop in the critical range was used and plotted along the measurement points. The Fit parameter L represents the maximum LDE hole density that is achieved during the critical transition region. The parameter k quantifies the steepness of the critical transition. In other words, it measures how rapidly the LDE hole density evolves during the transition dependent on the Al etch amount θ Al .   The inverse k 1 then provides a measure of the broadening of the critical transition. The parameter θ Al , crit indicates the specific amount of Al etch material at which the critical transition occurs. This can be understood as the threshold amount of Al etch material necessary for the formation of LDE holes. The fit parameters were found using the least squares method. Apparently, the LDE hole densities follow a similar trend. We empirically found a linear region and logistic function to match our data best. While other S-shaped functions describe the data too, a combination of a linear fit and a logistic function excellently describes our data. Furthermore, the transition from no LDE holes to maximum LDE hole density takes place in a range of approximately 2   mm for all samples, irrespective of the arsenic pressure and thus the LDE hole density. In Figure 2g, the position is converted in an equivalent Al amount, and the hole density and integrated PL intensity are shown. The Al etch amount is the physically important parameter driving LDE hole formation. If one compares the shape of the transition in Figure 2a and the shape of the contour lines in Figure 2b, it can be seen that they deviate from each other in the edge areas of the wafer. This is partly due to the lower temperature at the edges influencing the droplet density [40]. We expect that the critical amount will be influenced as well. In the part in the middle of the wafer that is relevant for this analysis, the simulated Al etching amounts fit very well. It can be seen that the curves in Figure 2g are ordered according to the As-BEP values. The center of the transition is found at higher Al etch amount values. In addition, the decrease in the maximum LDE hole density with higher As-BEP and thus also higher AL etching material amount can be clearly seen here.
For each curve, the parameters have been determined independently. To quantify the observations, the fit parameters are examined in more detail collectively as a function of the As-BEP. Figure 3a shows the slope in the linear range as a function of the AS-BEP for the LDE hole density and the PL intensity. No clearly recognizable correlation can be seen. Figure 3b shows the maximum hole density and the maximum PL intensity in the critical transition represented by the fit parameter L of the logistic function. While no correlation can be recognized for the PL intensity, a clearly recognizable linear relationship can be seen for the LDE hole density:
L AFM = 0.53 ( 5 )   μ m 2 μ Torr 1 · p As + 0.7 ( 5 )   μ m 2 ,   R 2 = 0.983 ,
with As-BEP p As , correlation coefficient R 2 and the uncertainty of the last printed digit given in brackets. Figure 3c shows the broadening of the critical transition, which is represented by the inverse fit parameter 1/k. For the LDE hole density and PL intensity, linear relationships can be recognized:
k AFM 1 = 0.48 ( 4 )   pm   μ Torr 1 · p As + 0.53 ( 2 )   pm ,   R 2 = 0.983
k PL 1 = 0.3 ( 2 )   pm   μ Torr 1 · p As + 0.8 ( 1 )   pm ,   R 2 = 0.427
There is an outlier for sample 175n, which is already recognizable in the PL data in Figure 2c in a jump between 47   mm and 47.5   mm . Figure 3d shows the fit parameter θ Al ,   crit , which determines at which point the center of the transition is located and one common linear relation for both PL intensity and hole density is found. The determined points are almost identical for the PL intensity and the LDE hole density and we find
θ Al , crit , AFM / PL = 290 27   pm   μ Torr - 1 · p As + 140 10   pm ,   R 2 = 0.982
for both curves.
We attempt to explain the mechanisms that are responsible for the observed effects. The nucleation of nanodroplets has been modeled and investigated for Al droplets [23,41,42] and for Ga [43], taking elemental group III material flux and substrate temperature into account. Critical transitions have been examined for InAs SK QDs [44]. However, models near the critical transition for Al droplets are lacking, and the impact of surface morphology variations on LDE remains unexplored. During the LDE process, Al atoms hit the surface, diffuse and are subsequently recrystallizing with residual As from the As-rich (2 × 4) reconstruction. After reaching a critical Al amount, which fully saturates the surface arsenic, additional Al atoms diffuse and encounter two potential pathways. They can either recrystallize with As molecules from the flux or form dimers with other Al adatoms. These dimers can also recrystallize with As from the flux but they are less mobile and can form critical nuclei for cluster growth, culminating in droplet formation. This process, with the exception of the delay in critical nuclei formation due to As flux, is partially elucidated by Heyn et al. [23]. Surface diffusion is affected by step edges and diffusion barriers like the Ehrlich–Schwöbel barrier [45]. This must impact the formation and location of where critical nuclei form. We thus speculate there are preferential conditions for nucleation; for example, small puddles surrounded by smooth surfaces lead to early droplet nucleation. Rough surfaces hinder surface diffusion [45] and thus may delay nucleation due to recrystallization.
We thus propose the following explanation for the nature of the transition. In order for LDE holes to form, enough aluminum must be deposited on the surface so that residual surface arsenic is soaked in AlAs and Al droplets can form. These then etch into the surface. The higher the As-BEP, the more aluminum is required for nucleation. This is evidenced in Figure 3b,d and by the fact that the center of the transition is shifted to higher Al etching amounts at higher As-BEP. Furthermore, we speculate the droplets form first in early and then in late-nucleation centers. The difference between early and late nucleation centers is due to local surface morphology. At higher As-BEP, a proportionally more critical aluminum amount is needed to cover all nucleation centers, as the As flux slows down nucleation. This explains the broadening of the transition for higher As-BEP, shown in Figure 3c. At high As-BEP at a later stage, the early nucleation centers still form droplets and evolve into holes. However, Al material forms AlAs compounds with the As flux at a higher rate and delays droplet nucleation at late nucleation centers or even hinders nucleation altogether. This explains the decrease in hole density for higher As-BEP as seen in Figure 3d.
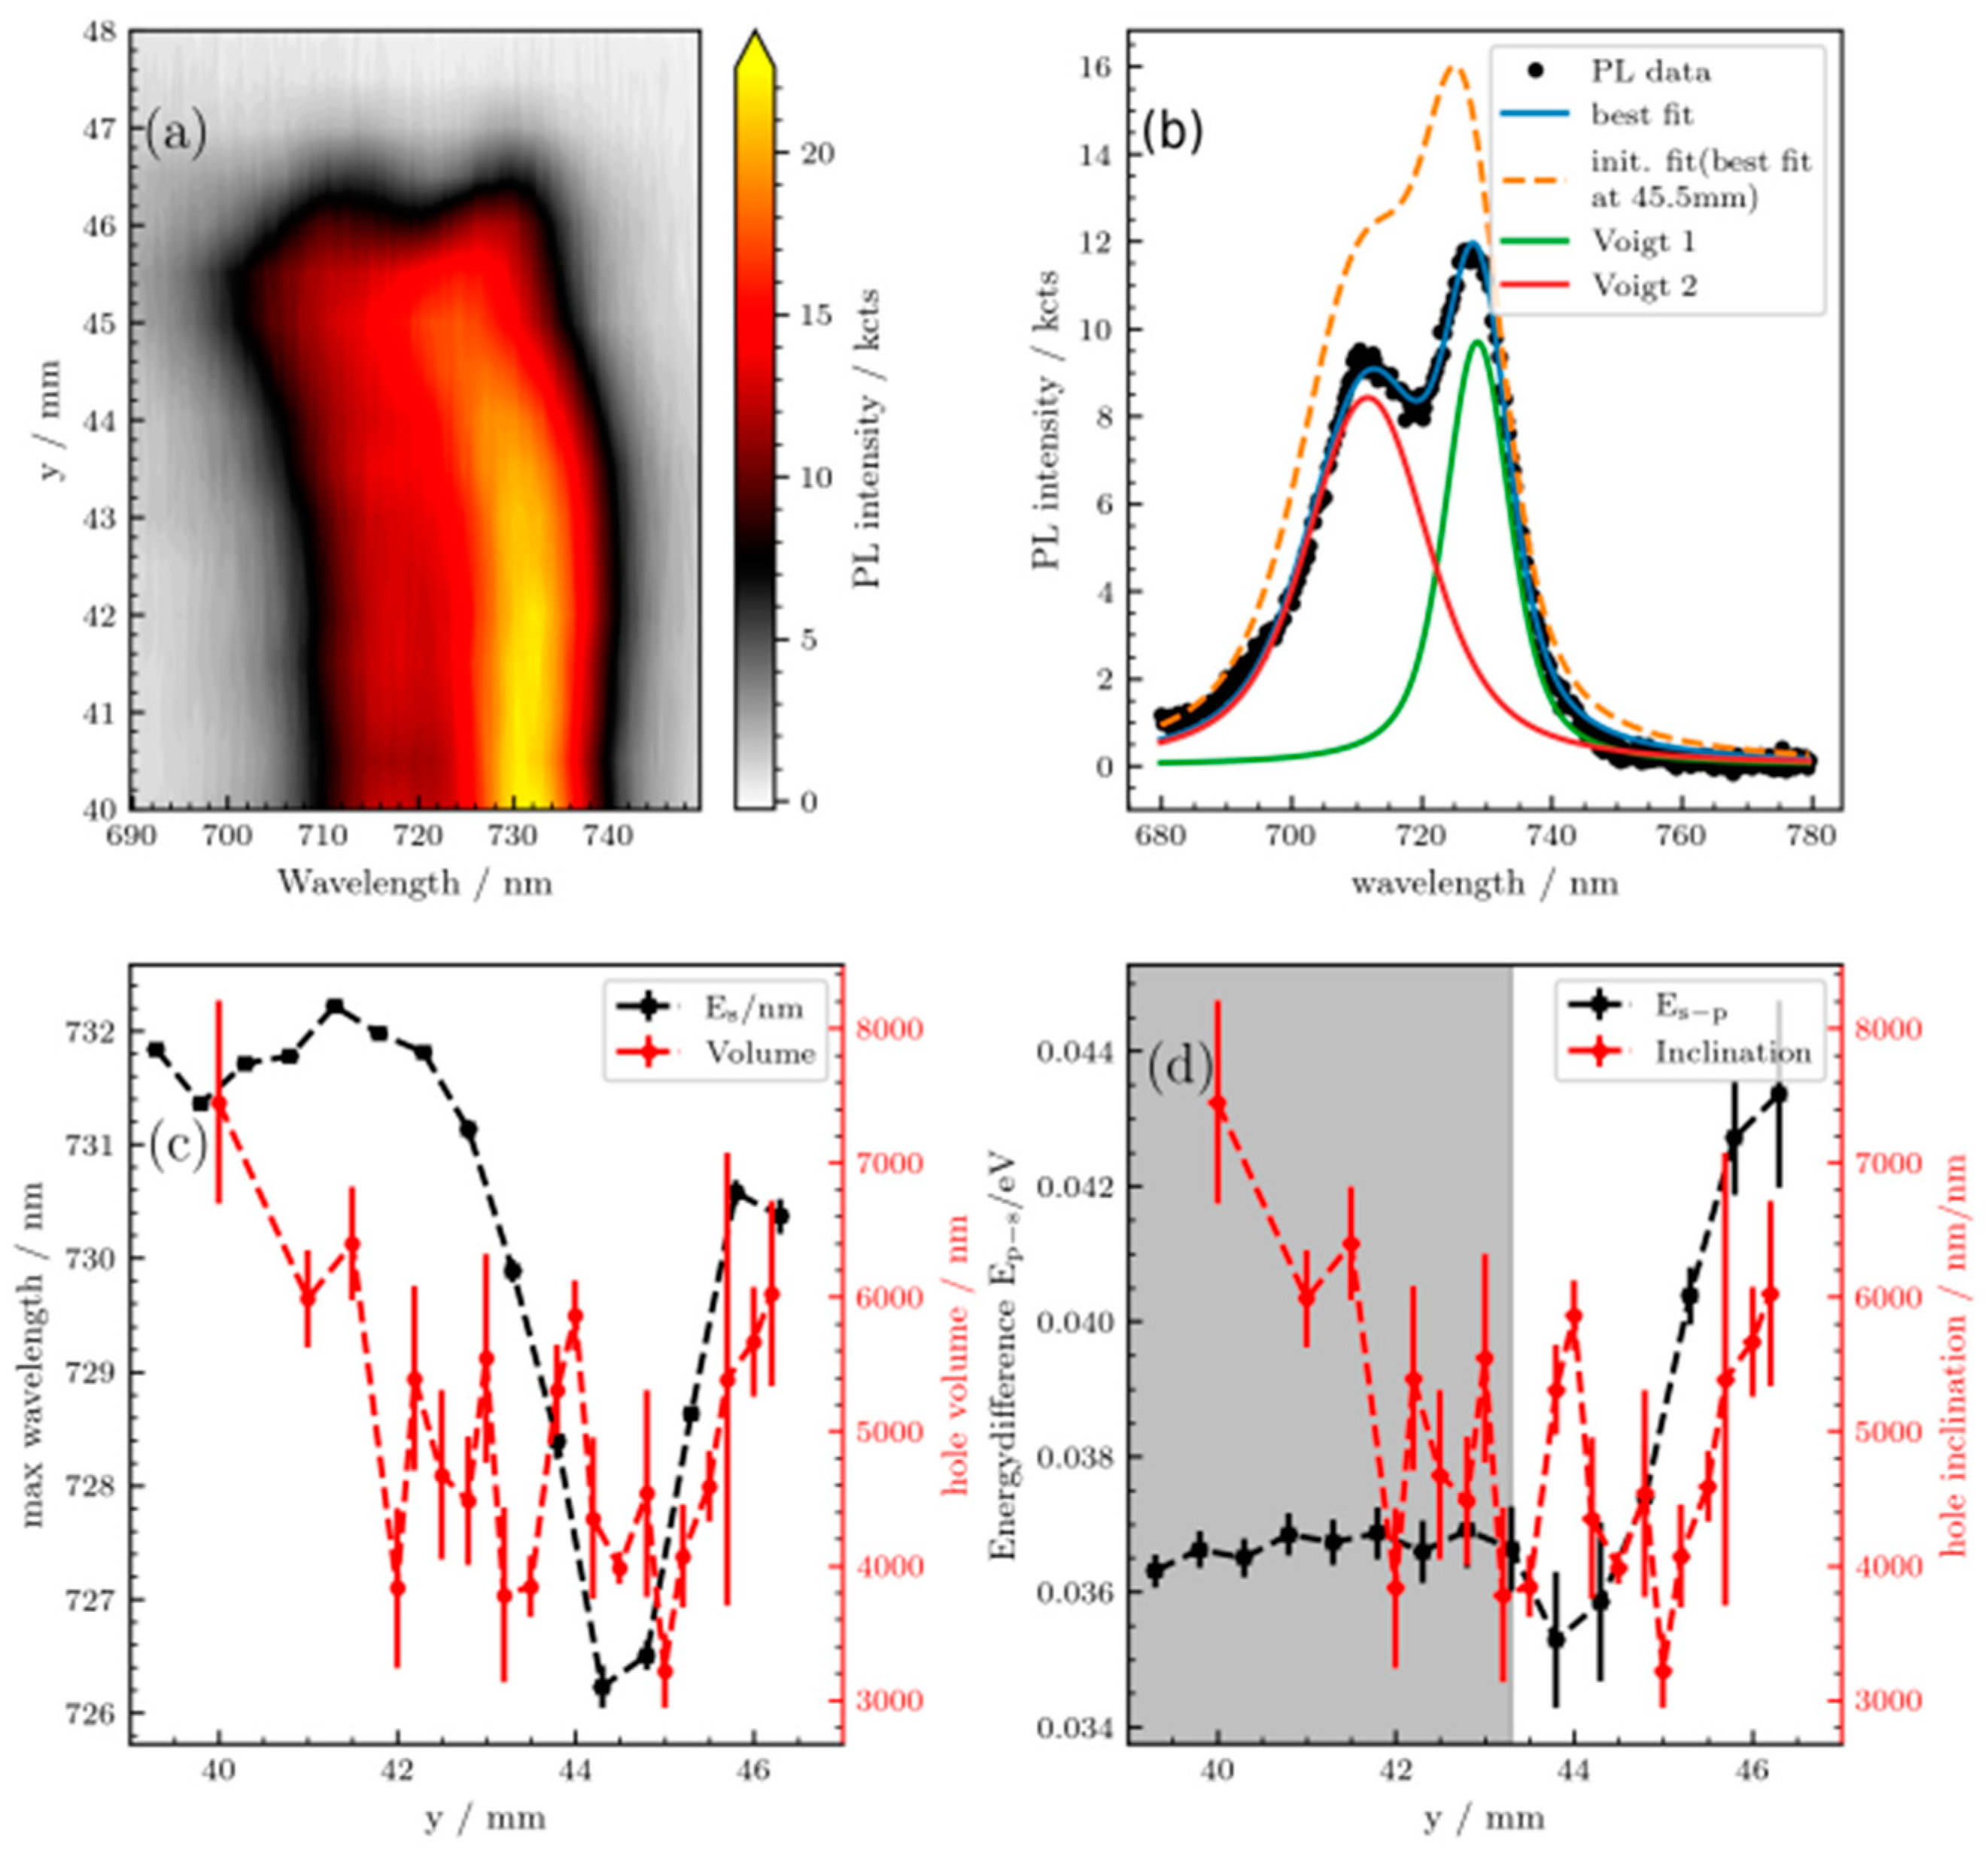
Growth parameters similar to sample 510n are identified as promising for QD growth, enabling high-fidelity generation of entangled photon pairs [46] and coherent quantum optics experiments [47,48]. We thus investigate the PL intensity and spectral features and the AFM morphology of sample 510n around the transition in more detail. For this, multiple LDE holes have been measured by AFM with a higher resolution at numerous points along the transition. The relevant parameters for the shape of the nanoholes can be found in Figure 4. Figure 4a shows one of these AFM measurements of a single LDE hole and Figure 4b shows the profiles along the [ 110 ] and [ 1 1 ¯ 0 ] direction. Figure 4b also shows the diameter, depth and inclination of the hole. The volume of the holes is subsequently calculated from these parameters, with the nanoholes’ shape approximated as a conical form for this purpose. First, the PL measurements are analyzed in more detail. In Figure 5a, we show the PL intensity against the y-position and wavelength for the central wafer region (c.f. red line in Figure 2a) in a contour plot. The curves were shifted by 0.8   mm to each other to correct experimental setup offsets. Particular attention should be paid to a strong blueshift followed by a strong red shift in the last millimeters, which occurs at the critical transition and is not related to the PDL. This is a common feature on all samples except for 680n, where there is only a strong blueshift. At the used excitation laser power, there are two peaks. A ground state transition (s-peak) and an excited state transition (p-peak). The energetic difference between the s- and p-peak increases for all samples during the critical transition. Figure 5b provides an instance of a PL measurement at the point y = 47   mm , in addition to the fitted curve, which is a combination of two Voigt functions for the s- and p-peak. The individual Voigt curves and the fitted curve from the point at 46.5   mm , utilized as the starting parameter for the fit, are also displayed. The peak wavelengths of the s- and p-peak and the energy differences between the two are subsequently derived from these fits. Now, the PL parameters of the wavelength of the s-peak and the energetic difference between s- and p-peak are compared with the AFM parameters and analyzed for correlations by discussing the Pearson correlation coefficient. The correlation of the volume of the holes with the wavelength of the s-peak is 0.57. The volume of the holes and the wavelength of the s-peak can be seen in Figure 5c, where they are plotted against the y position on the wafer. The error of the PL wavelengths and energies comes from the standard deviation of the fit parameters. The errors of the AFM dimensions come from the statistical standard deviation. The correlation of the inclination of the holes with the energy difference between the p- and s-peak is 0.52. If only the last 3   mm transition range is considered, the correlation increases to 0.79. There is only a tiny difference between the [ 110 ] direction and the [ 1 1 ¯ 0 ] direction. The inclination of the holes and the energy difference between the p- and the s-peak can be seen in Figure 5d plotted against the y position on the wafer.
We interpret these correlations as follows: Larger volume LDE nanoholes can collect more material, resulting in larger QDs and thus redshifted emission. The low nanohole density in this region allows for more Al-etch material to be collected from a larger Voronoi area [49,50]. This supports our assumption that early nucleation centers form first. The absence of the redshift in sample 680n may be related to the larger As-BEP, not allowing for deeply etched nanohole formation around the critical Al-amount, as the As flux partially recrystallizes the Al to AlAs. This has been shown by Heyn et al. [40].
A larger inclination results in stronger lateral confinement, increasing the s- to p-splitting [19]. Larger s-p splitting has also been observed by Babin et al. [8] for a smaller GaAs filling amount.

4. Conclusions

Our study commenced with an analysis of the relationship between the Al etch amount and hole density. The hole density decreases linearly with a decreasing Al etch amount until it reaches a critical threshold beyond which the hole density drops sharply.
Interestingly, the critical etch amount showed a linear increase with the As-BEP. This indicates that the transition is not independent of the As-BEP. Moreover, the width of the transition also showed a linear increase with As-BEP.
The maximum quantum dot density reached during this transition also decreased linearly with the As-BEP. We explain this phenomenon suggesting the existence of early and late nucleation centers. The Al etch material tends to crystallize into AlAs with larger As-BEP. This makes the nucleation of droplets in the late centers more difficult, resulting in a broader transition and a lower maximum quantum dot density.
In the critical transition region, a strong PL red shift of the peak wavelengths was observed in three of the four samples studied. In addition, the energy difference between the ground state transition (s-peak) and the excited state transition (p-peak) was found to increase for all samples at the transition. These observation are in agreement with our AFM studies of the hole shape parameters.
While we have performed a parameter study for the critical etch amount at ideal parameters for low-noise, high-quality QDs [2,21], this study has the potential to be extended to other growth parameters. A study of the impact of other buffer matrices, other etching materials, or at other nucleation temperatures could provide a universal model of the critical etch amount. Materials for this purpose could be (In, Ga, Al)(As, Sb, P) as buffer matrix and etching materials could be other group 3 metals, such as In and Ga or alloys of In, Ga and Al.

Author Contributions

Conceptualization, T.K., H.G.B. and A.L.; methodology, T.K., H.G.B. and A.L.; validation, T.K., H.G.B. and A.L.; formal analysis, T.K., H.G.B. and A.L.; investigation, T.K. and H.G.B.; resources, A.D.W. and A.L.; data curation, T.K.; writing—original draft preparation, T.K., H.G.B. and A.L.; writing—review and editing, T.K., H.G.B., A.D.W. and A.L.; visualization, T.K.; supervision, A.D.W. and A.L.; project administration, A.D.W. and A.L.; funding acquisition, A.D.W. and A.L. All authors have read and agreed to the published version of the manuscript.

Funding

We acknowledge financial support from the grants DFH/UFA CDFA05-06 and BMBF QR.X 16KISQ009; T.K. received funding from MERCUR Pe-2019-0022; H.G.B. received funding from the International Max Planck Research School for Interface Controlled Materials for Energy Conversion (IMPRS-SurMat).

Data Availability Statement

The original data presented in the study are openly available in: https://doi.org/10.6084/m9.figshare.26521045.v2.

Conflicts of Interest

The authors declare no conflict of interest.

References

  1. Senellart, P.; Solomon, G.; White, A. High-performance semiconductor quantum-dot single-photon sources. Nat. Nanotechnol. 2017, 12, 1026–1039. [Google Scholar] [CrossRef]
  2. Zhai, L.; Löbl, M.C.; Nguyen, G.N.; Ritzmann, J.; Javadi, A.; Spinnler, C.; Wieck, A.D.; Ludwig, A.; Warburton, R.J. Low-noise GaAs quantum dots for quantum photonics. Nat. Commun. 2020, 11, 4745. [Google Scholar] [CrossRef] [PubMed]
  3. Tomm, N.; Javadi, A.; Antoniadis, N.O.; Najer, D.; Löbl, M.C.; Korsch, A.R.; Schott, R.; Valentin, S.R.; Wieck, A.D.; Ludwig, A.; et al. A bright and fast source of coherent single photons. Nat. Nanotechnol. 2021, 16, 399–403. [Google Scholar] [CrossRef]
  4. Kuhlmann, A.V.; Houel, J.; Ludwig, A.; Greuter, L.; Reuter, D.; Wieck, A.D.; Poggio, M.; Warburton, R.J. Charge noise and spin noise in a semiconductor quantum device. Nat. Phys. 2013, 9, 570–575. [Google Scholar] [CrossRef]
  5. Leonard, D.; Krishnamurthy, M.; Reaves, C.M.; Denbaars, S.P.; Petroff, P.M. Direct formation of quantum-sized dots from uniform coherent islands of InGaAs on GaAs surfaces. Appl. Phys. Lett. 1993, 63, 3203–3205. [Google Scholar] [CrossRef]
  6. Heyn, C.; Stemmann, A.; Schramm, A.; Welsch, H.; Hansen, W.; Nemcsics, Á. Faceting during GaAs quantum dot self-assembly by droplet epitaxy. Appl. Phys. Lett. 2007, 90, 203105. [Google Scholar] [CrossRef]
  7. Gurioli, M.; Wang, Z.; Rastelli, A.; Kuroda, T.; Sanguinetti, S. Droplet epitaxy of semiconductor nanostructures for quantum photonic devices. Nat. Mater. 2019, 18, 799–810. [Google Scholar] [CrossRef]
  8. Babin, H.-G.; Bart, N.; Schmidt, M.; Spitzer, N.; Wieck, A.D.; Ludwig, A. Full wafer property control of local droplet etched GaAs quantum dots. J. Cryst. Growth 2022, 591, 126713. [Google Scholar] [CrossRef]
  9. Atkinson, P.; Zallo, E.; Schmidt, O.G. Independent wavelength and density control of uniform GaAs/AlGaAs quantum dots grown by infilling self-assembled nanoholes. J. Appl. Phys. 2012, 112, 054303. [Google Scholar] [CrossRef]
  10. Wolters, J.; Buser, G.; Horsley, A.; Béguin, L.; Jöckel, A.; Jahn, J.-P.; Warburton, R.J.; Treutlein, P. Simple Atomic Quantum Memory Suitable for Semiconductor Quantum Dot Single Photons. Phys. Rev. Lett. 2017, 119, 60502. [Google Scholar] [CrossRef] [PubMed]
  11. Keil, R.; Zopf, M.; Chen, Y.; Höfer, B.; Zhang, J.; Ding, F.; Schmidt, O.G. Solid-state ensemble of highly entangled photon sources at rubidium atomic transitions. Nat. Commun. 2017, 8, 15501. [Google Scholar] [CrossRef] [PubMed]
  12. Sukachev, D.D.; Sipahigil, A.; Nguyen, C.T.; Bhaskar, M.K.; Evans, R.E.; Jelezko, F.; Lukin, M.D. Silicon-Vacancy Spin Qubit in Diamond: A Quantum Memory Exceeding 10 ms with Single-Shot State Readout. Phys. Rev. Lett. 2017, 119, 223602. [Google Scholar] [CrossRef]
  13. Heyn, C.; Stemmann, A.; Köppen, T.; Strelow, C.; Kipp, T.; Grave, M.; Mendach, S.; Hansen, W. Highly uniform and strain-free GaAs quantum dots fabricated by filling of self-assembled nanoholes. Appl. Phys. Lett. 2009, 94, 183113. [Google Scholar] [CrossRef]
  14. Nguyen, G.N.; Spinnler, C.; Hogg, M.R.; Zhai, L.; Javadi, A.; Schrader, C.A.; Erbe, M.; Wyss, M.; Ritzmann, J.; Babin, H.-G.; et al. Enhanced Electron-Spin Coherence in a GaAs Quantum Emitter. Phys. Rev. Lett. 2023, 131, 210805. [Google Scholar] [CrossRef] [PubMed]
  15. Zaporski, L.; Shofer, N.; Bodey, J.H.; Manna, S.; Gillard, G.; Appel, M.H.; Schimpf, C.; Da Covre Silva, S.F.; Jarman, J.; Delamare, G.; et al. Ideal refocusing of an optically active spin qubit under strong hyperfine interactions. Nat. Nanotechnol. 2023, 18, 257–263. [Google Scholar] [CrossRef] [PubMed]
  16. Millington-Hotze, P.; Dyte, H.E.; Manna, S.; Da Covre Silva, S.F.; Rastelli, A.; Chekhovich, E.A. Approaching a fully-polarized state of nuclear spins in a solid. Nat. Commun. 2024, 15, 985. [Google Scholar] [CrossRef] [PubMed]
  17. Gillard, G.; Clarke, E.; Chekhovich, E.A. Harnessing many-body spin environment for long coherence storage and high-fidelity single-shot qubit readout. Nat. Commun. 2022, 13, 4048. [Google Scholar] [CrossRef] [PubMed]
  18. Chekhovich, E.A.; da Silva, S.F.C.; Rastelli, A. Nuclear spin quantum register in an optically active semiconductor quantum dot. Nat. Nanotechnol. 2020, 15, 999–1004. [Google Scholar] [CrossRef] [PubMed]
  19. Heyn, C.; Gräfenstein, A.; Pirard, G.; Ranasinghe, L.; Deneke, K.; Alshaikh, A.; Bester, G.; Hansen, W. Dot-Size Dependent Excitons in Droplet-Etched Cone-Shell GaAs Quantum Dots. Nanomaterials 2022, 12, 2981. [Google Scholar] [CrossRef]
  20. Huber, D.; Reindl, M.; Huo, Y.; Huang, H.; Wildmann, J.S.; Schmidt, O.G.; Rastelli, A.; Trotta, R. Highly indistinguishable and strongly entangled photons from symmetric GaAs quantum dots. Nat. Commun. 2017, 8, 15506. [Google Scholar] [CrossRef]
  21. Zhai, L.; Nguyen, G.N.; Spinnler, C.; Ritzmann, J.; Löbl, M.C.; Wieck, A.D.; Ludwig, A.; Javadi, A.; Warburton, R.J. Quantum interference of identical photons from remote GaAs quantum dots. Nat. Nanotechnol. 2022, 17, 829–833. [Google Scholar] [CrossRef]
  22. Kerbst, J.; Heyn, C.; Slobodskyy, T.; Hansen, W. Density limits of high temperature and multiple local droplet etching on AlAs. J. Cryst. Growth 2014, 389, 18–22. [Google Scholar] [CrossRef]
  23. Heyn, C.; Feddersen, S. Modeling of Al and Ga Droplet Nucleation during Droplet Epitaxy or Droplet Etching. Nanomaterials 2021, 11, 468. [Google Scholar] [CrossRef]
  24. Langbein, W.; Borri, P.; Woggon, U.; Stavarache, V.; Reuter, D.; Wieck, A. Radiatively limited dephasing in InAs quantum dots. Phys. Rev. B 2004, 70, 033301. [Google Scholar] [CrossRef]
  25. Strobel, T.; Weber, J.H.; Schmidt, M.; Wagner, L.; Engel, L.; Jetter, M.; Wieck, A.D.; Portalupi, S.L.; Ludwig, A.; Michler, P. A Unipolar Quantum Dot Diode Structure for Advanced Quantum Light Sources. Nano Lett. 2023, 23, 6574–6580. [Google Scholar] [CrossRef] [PubMed]
  26. Löbl, M.C.; Spinnler, C.; Javadi, A.; Zhai, L.; Nguyen, G.N.; Ritzmann, J.; Midolo, L.; Lodahl, P.; Wieck, A.D.; Ludwig, A.; et al. Radiative Auger process in the single-photon limit. Nat. Nanotechnol. 2020, 15, 558–562. [Google Scholar] [CrossRef] [PubMed]
  27. Kurzmann, A.; Ludwig, A.; Wieck, A.D.; Lorke, A.; Geller, M. Auger Recombination in Self-Assembled Quantum Dots: Quenching and Broadening of the Charged Exciton Transition. Nano Lett. 2016, 16, 3367–3372. [Google Scholar] [CrossRef]
  28. Ageev, O.A.; Solodovnik, M.S.; Balakirev, S.V.; Mikhaylin, I.A. Monte Carlo simulation of V/III flux ratio influence on GaAs island nucleation during MBE. J. Phys. Conf. Ser. 2016, 681, 012036. [Google Scholar] [CrossRef]
  29. Fuster, D.; González, Y.; González, L. Fundamental role of arsenic flux in nanohole formation by Ga droplet etching on GaAs(001). Nanoscale Res. Lett. 2014, 9, 309. [Google Scholar] [CrossRef]
  30. Heyn, C.; Bartsch, T.; Sanguinetti, S.; Jesson, D.; Hansen, W. Dynamics of mass transport during nanohole drilling by local droplet etching. Nanoscale Res. Lett. 2015, 10, 67. [Google Scholar] [CrossRef]
  31. Heyn, C.; Schnüll, S.; Hansen, W. Scaling of the structural characteristics of nanoholes created by local droplet etching. J. Appl. Phys. 2014, 115, 024309. [Google Scholar] [CrossRef]
  32. Balakirev, S.V.; Chernenko, N.E.; Eremenko, M.M.; Ageev, O.A.; Solodovnik, M.S. Independent Control Over Size and Surface Density of Droplet Epitaxial Nanostructures Using Ultra-Low Arsenic Fluxes. Nanomaterials 2021, 11, 1184. [Google Scholar] [CrossRef]
  33. Heyn, C.; Stemmann, A.; Eiselt, R.; Hansen, W. Influence of Ga coverage and AS pressure on local droplet etching of nanoholes and quantum rings. J. Appl. Phys. 2009, 105, 054316. [Google Scholar] [CrossRef]
  34. Bart, N.; Dangel, C.; Zajac, P.; Spitzer, N.; Ritzmann, J.; Schmidt, M.; Babin, H.G.; Schott, R.; Valentin, S.R.; Scholz, S.; et al. Wafer-scale epitaxial modulation of quantum dot density. Nat. Commun. 2022, 13, 1633. [Google Scholar] [CrossRef]
  35. Schmidt, M. Optische Untersuchung Ganzer 3 Zoll Wafer zur Optimierung Von III-V Halbleiter-Quantenpunkten Hergestellt Mittels Molekularstrahlepitaxie. Ph.D. Thesis, Ruhr-Universität Bochum, Bochum, Germany, 2022. [Google Scholar]
  36. Ranasinghe, L.; Heyn, C.; Deneke, K.; Zocher, M.; Korneev, R.; Hansen, W. Luminescence from Droplet-Etched GaAs Quantum Dots at and Close to Room Temperature. Nanomaterials 2021, 11, 690. [Google Scholar] [CrossRef]
  37. Zhou, X.L.; Chen, Y.H.; Ye, X.L.; Xu, B.; Wang, Z.G. Abnormal temperature dependent photoluminescence of excited states of InAs/GaAs quantum dots: Carrier exchange between excited states and ground states. J. Appl. Phys. 2011, 109, 113540. [Google Scholar] [CrossRef]
  38. Bacher, G.; Schweizer, H.; Kovac, J.; Forchel, A.; Nickel, H.; Schlapp, W.; Lösch, R. Influence of barrier height on carrier dynamics in strained InxGa1-xAs/GaAs quantum wells. Phys. Rev. B Condens. Mater. 1991, 43, 9312–9315. [Google Scholar] [CrossRef]
  39. Yin, H.; Li, G.; Jiang, C. Temperature effect of activation energy for GaSb quantum dots using variable temperature photoluminescence. J. Nanosci. Nanotechnol. 2013, 13, 1022–1025. [Google Scholar] [CrossRef]
  40. Heyn, C.; Zocher, M.; Schnüll, S.; Hansen, W. Role of Arsenic During Aluminum Droplet Etching of Nanoholes in AlGaAs. Nanoscale Res. Lett. 2016, 11, 428. [Google Scholar] [CrossRef]
  41. Wang, Y.; Jiang, C.; Huang, Y.; Ding, Z.; Luo, Z.; Wang, J.; Guo, X. Mechanism of Aluminum Droplet Nucleation and Ripening on GaAs(001) Surface by Molecular Beam Epitaxy. J. Electron. Mater. 2023, 52, 463–470. [Google Scholar] [CrossRef]
  42. Zocher, M.; Heyn, C.; Hansen, W. Alloying during local droplet etching of AlGaAs surfaces with aluminium. J. Appl. Phys. 2019, 125, 025306. [Google Scholar] [CrossRef]
  43. Reyes, K.; Smereka, P.; Nothern, D.; Millunchick, J.M.; Bietti, S.; Somaschini, C.; Sanguinetti, S.; Frigeri, C. Unified model of droplet epitaxy for compound semiconductor nanostructures: Experiments and theory. Phys. Rev. B 2013, 87, 165406. [Google Scholar] [CrossRef]
  44. Patella, F.; Arciprete, F.; Fanfoni, M.; Sessi, V.; Balzarotti, A.; Placidi, E. Reflection high energy electron diffraction observation of surface mass transport at the two- to three-dimensional growth transition of InAs on GaAs(001). Appl. Phys. Lett. 2005, 87, 252101. [Google Scholar] [CrossRef]
  45. Lysenko, O.V.; Stepanyuk, V.S.; Hergert, W.; Kirschner, J. Interlayer mass transport in homoepitaxy on the atomic scale. Phys. Rev. B 2003, 68, 33409. [Google Scholar] [CrossRef]
  46. Chen, C.; Yan, J.-Y.; Babin, H.-G.; Wang, J.; Xu, X.; Lin, X.; Yu, Q.; Fang, W.; Liu, R.-Z.; Huo, Y.-H.; et al. Wavelength-tunable high-fidelity entangled photon sources enabled by dual Stark effects. Nat. Commun. 2024, 15, 5792. [Google Scholar] [CrossRef] [PubMed]
  47. Yan, J.-Y.; Chen, C.; Zhang, X.-D.; Wang, Y.-T.; Babin, H.-G.; Wieck, A.D.; Ludwig, A.; Meng, Y.; Hu, X.; Duan, H.; et al. Coherent control of a high-orbital hole in a semiconductor quantum dot. Nat. Nanotechnol. 2023, 18, 1139–1146. [Google Scholar] [CrossRef] [PubMed]
  48. Yan, J.-Y.; Zhai, L.; Babin, H.-G.; Li, Y.; Pei, S.-H.; Cygorek, M.; Fang, W.; Gao, F.; Wieck, A.D.; Ludwig, A.; et al. Complete Quantum Control of Orbital Qubits by Phase-Controlled Stimulated Raman Transitions. arXiv 2024, arXiv:2403.15295. [Google Scholar] [CrossRef]
  49. Löbl, M.C.; Zhai, L.; Jahn, J.-P.; Ritzmann, J.; Huo, Y.; Wieck, A.D.; Schmidt, O.G.; Ludwig, A.; Rastelli, A.; Warburton, R.J. Correlations between optical properties and Voronoi-cell area of quantum dots. Phys. Rev. B 2019, 100, 155402. [Google Scholar] [CrossRef]
  50. Mulheran, P.A.; Blackman, J.A. Capture zones and scaling in homogeneous thin-film growth. Phys. Rev. B Condens. Mater. 1996, 53, 10261–10267. [Google Scholar] [CrossRef]
Figure 1. Schematic representation of the growth process. (a) First, the substrate (here, the PDL) is applied, (b) the LDE etching material is applied and (c) after the LDE material has been applied and the holes have been etched, the holes are filled. This step was omitted for the holes on the surface. (d) The different gradients with their respective directions on the wafer.
Crystals 14 00714 g001
Figure 2. (a) Wafer map depicting the integrated PL intensity in a wavelength range between 760 nm and 820 nm for sample 510n at T = 80   K . (b) Calculated layer thickness for the Al etch material coverage for sample 510n. (ce) 5 × 5 µm2 sections of AFM measurements of sample 510n at y = 44   mm , 45 mm and 45.8 mm, respectively. (f) LDE hole density and PL intensity against y-position on the wafer. Legend is shared with (g). (g) LDE hole density and PL intensity against the Al-etch amount.
Crystals 14 00714 g002
Figure 3. Fit parameters of the combined linear and logistic fit for the LDE hole density and PL intensity. (a) Slope of the linear fit m . (b) Maximal LDE hole density L of the logistic function. (c) widening of the transition k 1 of the logistic function. (d) Center of the transition θ A l , c r i t of the logistic function.
Crystals 14 00714 g003
Figure 4. (a) Detailed AFM measurement to extract the hole dimension (b) profiles along the lines shown in (a) for the [110] (black) and 1 1 ¯ 0 direction (red) together with the hole dimensions’ diameter, height and inclination.
Crystals 14 00714 g004
Figure 5. (a) PL contourplot of sample 510n, showing PL intensity against y-position on the wafer and wavelength (b) PL measurement data at y = 46 mm with a fit consisting of two Voigt peaks and the best fit at y = 45.5 mm , which was used for the initial parameters (c) max wavelength of the s-peak and hole volume against y position on the wafer (d) Energy difference E p s and hole inclination versus y position on the wafer.
Crystals 14 00714 g005
Table 1. Growth parameters of the used samples.
Sample As - BEP / μ Torr Al Etch Amount/nm Ga   Fill   Amount / nm
150n/153670.150.201.8
175n/153690.180.201.8
510n/153890.510.290.44
680n/153850.680.351.0
Disclaimer/Publisher’s Note: The statements, opinions and data contained in all publications are solely those of the individual author(s) and contributor(s) and not of MDPI and/or the editor(s). MDPI and/or the editor(s) disclaim responsibility for any injury to people or property resulting from any ideas, methods, instructions or products referred to in the content.