Article

Study on Pulsed Gas Tungsten Arc Lap Welding Techniques for 304L Austenitic Stainless Steel

School of Mechanical Engineering, Jiangnan University, Wuxi 214000, China
*
Author to whom correspondence should be addressed.
Crystals 2024, 14(8), 715; https://doi.org/10.3390/cryst14080715
Submission received: 20 July 2024 / Revised: 6 August 2024 / Accepted: 6 August 2024 / Published: 9 August 2024
(This article belongs to the Section Crystalline Metals and Alloys)

Abstract

:
The lap welding process for 304L stainless steel welded using the pulsed gas tungsten arc welding (P-GTAW) procedure was studied, and the effects of the pulse welding parameters (the peak current, background current, duty cycle, pulse frequency, and welding speed) on the macroscopic morphology, microstructure, and mechanical properties of the resultant lap joints were investigated. Tensile tests, hardness measurements, and SEM/EDS/XRD analyses were conducted to reveal the characterization of the joint. The relationships between the welding parameters; certain joint characteristic dimensions (the weld width, D; the weld width on the lower plate, La; the weld depth on the lower plate, P; and the minimum fusion radius, R); and the maximum tensile bearing capacity were studied. The weld zone was primarily composed of vermicular ferrite, skeletal ferrite, and austenite, and no obvious welding defects, precipitation, or phase transformations were evident in the weld. Microhardness tests demonstrated that the weld microhardness was highest in the base metal zone and lowest in the weld zone. As the heat input increased, the average microhardness decreased. The hardness difference reached 17.6 Hv10 due to the uneven grain size and the transformation of the structure to ferrite in the weld. The fracture location in welded joints varied as the heat input changed. In some parameter combinations, the weld tensile strength was significantly higher than that of the base material, with fractures occurring in the weld. Scanning electron microscopy results exhibited an obvious dimple morphology, which is a typical form of ductile fracture. XRD revealed no significant phase changes in the weld zone, with a higher intensity of the austenite diffraction peaks compared to the ferrite diffraction peaks.

1. Introduction

Liquefied natural gas (LNG) is the most sustainable and reliable clean energy source. It has a large storage capacity and high energy density and is convenient to transport. LNG is typically transported by LNG carriers and is stored in cargo holds that are surrounded by low-temperature insulation systems [1]. As the global demand for LNG has increased over recent years, the LNG transportation market has expanded, thereby posing new challenges to the carrying capacity designs of LNG carriers. Because thin-film liquid cargo tanks have several advantages, including good impact resistance, high capacity utilization rates, low evaporation rates, and low maintenance costs, they have been increasingly used for global LNG transportation by ships [2]. The MARK III film-type liquid cargo tank structure developed by the GTT company of France is the most widely used liquid cargo tank structure. It is mainly composed of a primary screen wall, a secondary screen wall, and an insulation layer. The primary screen wall is composed of a welded 304L austenitic stainless steel corrugated plate with two ripple sizes. This plate has dimensions of 3000 mm × 1000 mm × 1.2 mm, and it takes the form of a lap-welded joint.
The nominal composition of austenitic stainless steel includes 19% chromium and 9% nickel. Its chemical composition can be adjusted to meet different needs, however. For example, the formation of chromium carbide can be prevented by reducing the carbon content or by adding other elements, such as titanium, niobium, and tantalum. The addition of molybdenum can also enhance its local corrosion resistance [3].
Austenitic stainless steel has excellent strength, ductility, and corrosion resistance properties, and it is easy to weld. These characteristics make it a favored material in a wide range of fields, such as steam power generation, automotive engineering, biomedical engineering, petrochemical engineering, and chemical engineering [4]. Among the many 300 series austenitic stainless steel grades, AISI 304L stainless steel is widely used for LNG transportation and storage equipment, as well as in the petrochemical and nuclear industries, because of its excellent low-temperature toughness and high corrosion resistance characteristics. It is evident from published studies that, because it has such a wide application range, austenitic stainless steel has been adapted for different welding processes to suit the needs of various manufacturing applications.
The welding parameters are closely related to the welding heat input, which is the total heat applied to the welding area during the welding process; this heat input directly affects the quality, performance, and microstructure of welded joints. In the pulsed gas tungsten arc welding (P-GTAW) process, arc energy is input in the form of a pulse rather than as a continuous direct current arc. The capacity and distribution of the arc energy are precisely controlled by adjusting the relevant parameters of the pulse signals. The influence of heat accumulation on the controlled weld formation is reduced. When studying the welding of AISI 304L stainless steel with a thickness of 6 mm at different arc energy input levels, Kumar et al. [5] found that the GTAW process provided good parameter combination flexibility and produced welded joints that were stronger than the substrate. Wang et al. [6] studied invar alloy lap P-GTAW welding for samples with thicknesses of 0.7 and 1.0 mm. They found that the pulse period significantly affected the microstructures and mechanical properties of lap joints. The P-GTAW process effectively prevented thermal cracking in welded joints, and good welding results were achieved without filling materials. The effective connection area was proportional to the tensile shear force, and the maximum tensile shear force was proportional to the pulse period. Arivarasu et al. [7] found that the use of P-GTAW produced better tensile properties when welding two different materials, AISI 4340 and AISI 304L. Mohandas et al. [8] observed that pulsed current welding results not only surpassed those of DC welding in terms of strength and plasticity but also exhibited better grain sizes, martensitic strip sizes, and segregation tendencies. Saluja et al. [9] studied the effects of the welding parameters on the microhardness distribution of a 304L austenitic stainless steel welded plate during the P-GTAW process; they found that the cooling rate and alloying elements significantly affected the microhardness value and the ferrite content. Kumar et al. [10] studied the effects of the welding parameters on the microstructure, mechanical properties, and corrosion rate of the SDSS welded joints, finding that GTAW can produce weld joints with excellent performance.
Lap welding is a common welding method that involves overlapping the edge portions of two or more metal parts and then permanently joining them together by welding. This type of welding is very common in a variety of industrial applications, especially structural part manufacturing, pipe connecting, and automotive applications. Wang et al. [11] studied the microstructures and mechanical properties of pulsed gas tungsten arc welding joints composed of Fe-36Ni and 304L stainless steel with thicknesses of 0.7 mm and 2 mm, such as those used in LNG transport ships. They found that, as the frequency increased, the feature size of the floor width (La) and depth (P) of welded joints remained unchanged, while the welding throat (R) increased. The welds did not experience solid-phase transformation during the cooling and solidification process but exhibited a single austenitic γ phase. The welded joints can be divided into multiple regions, from the base metal (BM) to the weld core, each of which has a different structure. The fracture positions of the tensile samples were related to the structural distribution and joint strength. The fracture locations in the samples subjected to shear forces were related to changes in the structure size and stress concentration. When studying the cold metal transfer (CMT) welding of galvannealed (GA) hot-rolled steel sheets flat lap, Lee et al. [12] found that the torch-aiming position and work angle and the peak current all significantly affected the welding process. They identified that the optimization of these parameters is crucial to the formation of high-quality welds. Through the systematic research and experimental verification of these parameters, a set of process parameters that can produce good weld formation effects was successfully determined. Manuel et al. [13] studied the effects of the welding parameters on the tensile properties and metallographic structure of AISI 439 stainless steel welded plates using P-GTAW, finding that optimal combinations of the parameters can produce weld joints with good performance. Muhammad et al. [14] studied various P-GTAW parameters for welding dissimilar alloys of Ti-5Al-2.5Sn and 304 stainless steel, focusing on the microstructure and joint mechanical properties. The results showed that P-GTAW can produce high-quality weld joints.
As was mentioned previously, P-GTAW is characterized by more precise control of the welding current, which results in better penetration control, decreased welding deformation, reduced heat input during the welding process, and decreased residual stresses in the welded joints. Precise control of the weld geometry and the suppression of brittle phase precipitation in the weld both improve the stability of the welding process, contribute to the formation of smaller and more uniform welds, and improve the aesthetic and mechanical properties of welds. Nevertheless, there are few studies on the impact of welding speed on welds and on 1.2 mm thick corrugated sheet metal. Therefore, the effects of the P-GTAW parameters on the weld formation, microstructures, and mechanical properties of 304L austenitic stainless steel lap joints used in LNG carriers were systematically investigated during this study.

2. Materials and Methods

The material used during this study was 304L stainless steel, such as is used for the corrugated plate of the primary screen of the MARK III cargo enclosure system. The samples had dimensions of 500 mm × 100 mm × 1.2 mm. The chemical composition of the test material is shown in Table 1.
The welding test platform consisted of a self-developed, five-axis welding robot, a Panasonic YC-400TX4 welding machine (Panasonic, Osaka, Japan), and a multi-station welding test platform. The lap welding diagram used during the study is shown in Figure 1. The two pieces of welding material were overlapped and staggered, the lap length was 20 mm, and the welding method was self-fusing welding. When considering the thickness of the test material, a tungsten electrode with a diameter of 2.4 mm was selected for the welding process; this selection effectively prevented excessive heating and burning of the electrode. The front end of the tungsten electrode was ground into a cone with an angle of approximately 30° before welding; doing so was conducive to arc initiation and stabilization. Before welding, the sample surface was wiped with alcohol to remove oil. During the welding process, argon with a purity of 99.999% was used for protection. The protection gas flow rate was 15 L/min.
According to a preliminary analysis of the experimental results and related literature, the welding parameters of P-GTAW processes are very adjustable. The welding heat input can be effectively adjusted by changing some of the welding parameters, such as the peak current, Ip; the background current, Ib; the duty cycle, dcy; the pulse frequency, f; and the welding speed, v. Changing these parameters enables control of the macroscopic formation process and the joint performance. In this study, the five P-GTAW parameters mentioned above were studied by conducting a total of 25 groups of flat welding tests. The specific welding parameters are listed in Table 2. After a weld was completed, a wire-cutting machine was used to obtain a joint cross-section metallographic sample from the middle of the weld. After a sample was allowed to set, it was polished until the polished portion was free of scratches and had a mirror-like finish; then, the dry, polished surface was wiped with alcohol. Finally, the sample was eroded for approximately 60 s with a prepared Keller reagent (1 mL HF + 5 mL HNO3 + 44 mL H2O). Immediately after the erosion was completed, the residual corrosive agent was washed from the surface of the sample with a large amount of water. Finally, the sample surface was cleaned with anhydrous ethanol and dried.
A LEICA optical microscope (OM) (DM2700 M, LEICA, Solms, Germany), a ZEISS tungsten filament scanning electron microscope (SEM) (EVO18, ZEISS, Oberkochen, Germany), and an energy spectrometer (EDS) (XFlash EDS, ZEISS, Oberkochen, Germany) were used to observe the sample microstructures. The characteristic dimensions of the lap joints were measured using a LEICA ultra-depth-of-field 3D microscope (DVM6A, LEICA, Solms, Germany). The characteristic dimensions of a joint are shown in Figure 2a, where D is the width of the entire weld (referred to as the melting width), La is the width of the weld on the lower plate (referred to as the melting width of the bottom plate), P is the depth of the weld on the lower plate (referred to as the melting depth), and R is the shortest distance between the root of the weld and the surface of the weld—that is, the minimum fusion radius (referred to as the welding throat). Standard documents from GTT outline the clear requirements for the characteristic weld formation dimensions (Table 3), and the back of the weld is not allowed to melt.
X-ray diffraction (XRD) analyses were performed using a Shimadzu X-ray diffractometer (LabX XRD-6100, Shimadzu, Kyoto, Japan). A microhardness tester (HVS-1000ZCM-XY, Suoyan, Shanghai, China) was used for hardness testing, in which a load of 1000 g was applied for 15 s. The distribution of the test points is depicted in Figure 2b. Tensile tests were performed with a universal testing machine (WDW-100KN, Hengrui Gold, Jinan, China) at a loading rate of 2 mm/min. The dimensions of the tensile samples are depicted in Figure 3. The maximum bearing capacity, Fm (maximum load during a tensile test), was used to evaluate the mechanical properties of the joints, because the joints were subjected to tensile shear during the tensile tests. For each group of welding parameters, the average of the maximum bearing capacity values from three tensile specimens was taken as the final test result. Because the thicknesses of the upper and lower plates in the lap joint were different, backing plates were added during the tensile tests so that the vertical axis of the two plates could be parallel to the direction of the loading force.
Room temperature tensile tests were carried out using flat specimens (Figure 3), designed according to GB/T26957-2022 [15], which references the ISO9018:2015 standard. All tensile specimens were clamped with wedge-type grips. To ensure the force was parallel to the axis, 1.2 mm thick 304L subplates were bonded on both sides of the specimens. After the tensile tests, the tensile ratio, fracture location, and maximum force were measured. The fracture surfaces were then analyzed using scanning electron microscopy to investigate the fracture mechanism.

3. Results and Discussion

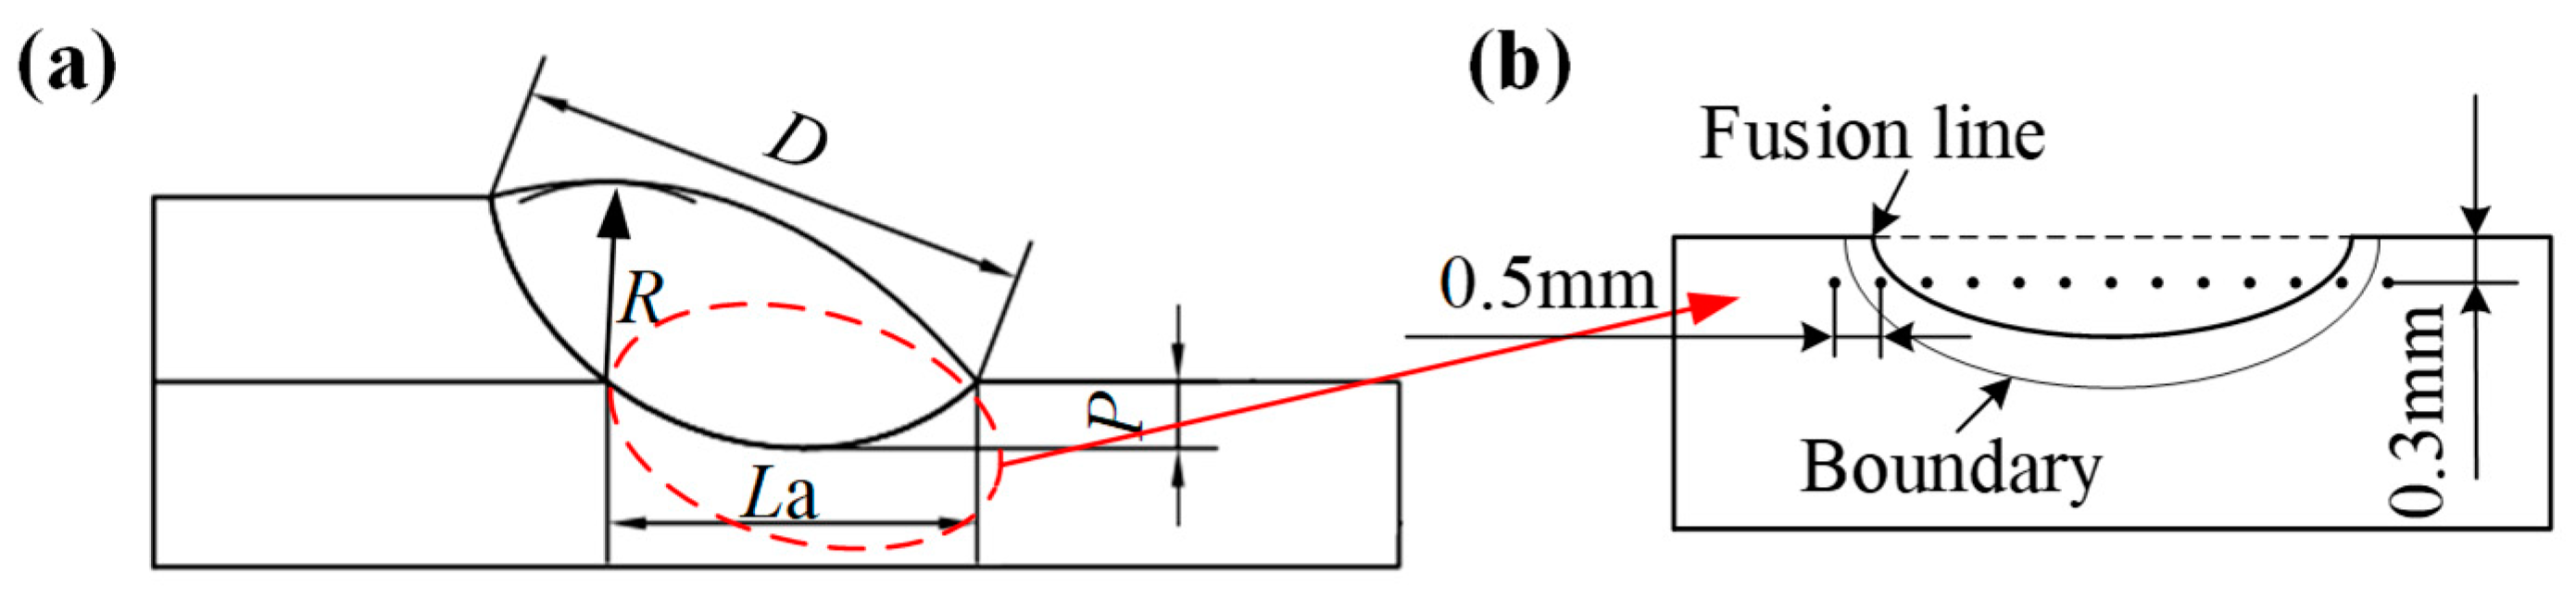
3.1. Macroscopic Morphologies of Welded Joints

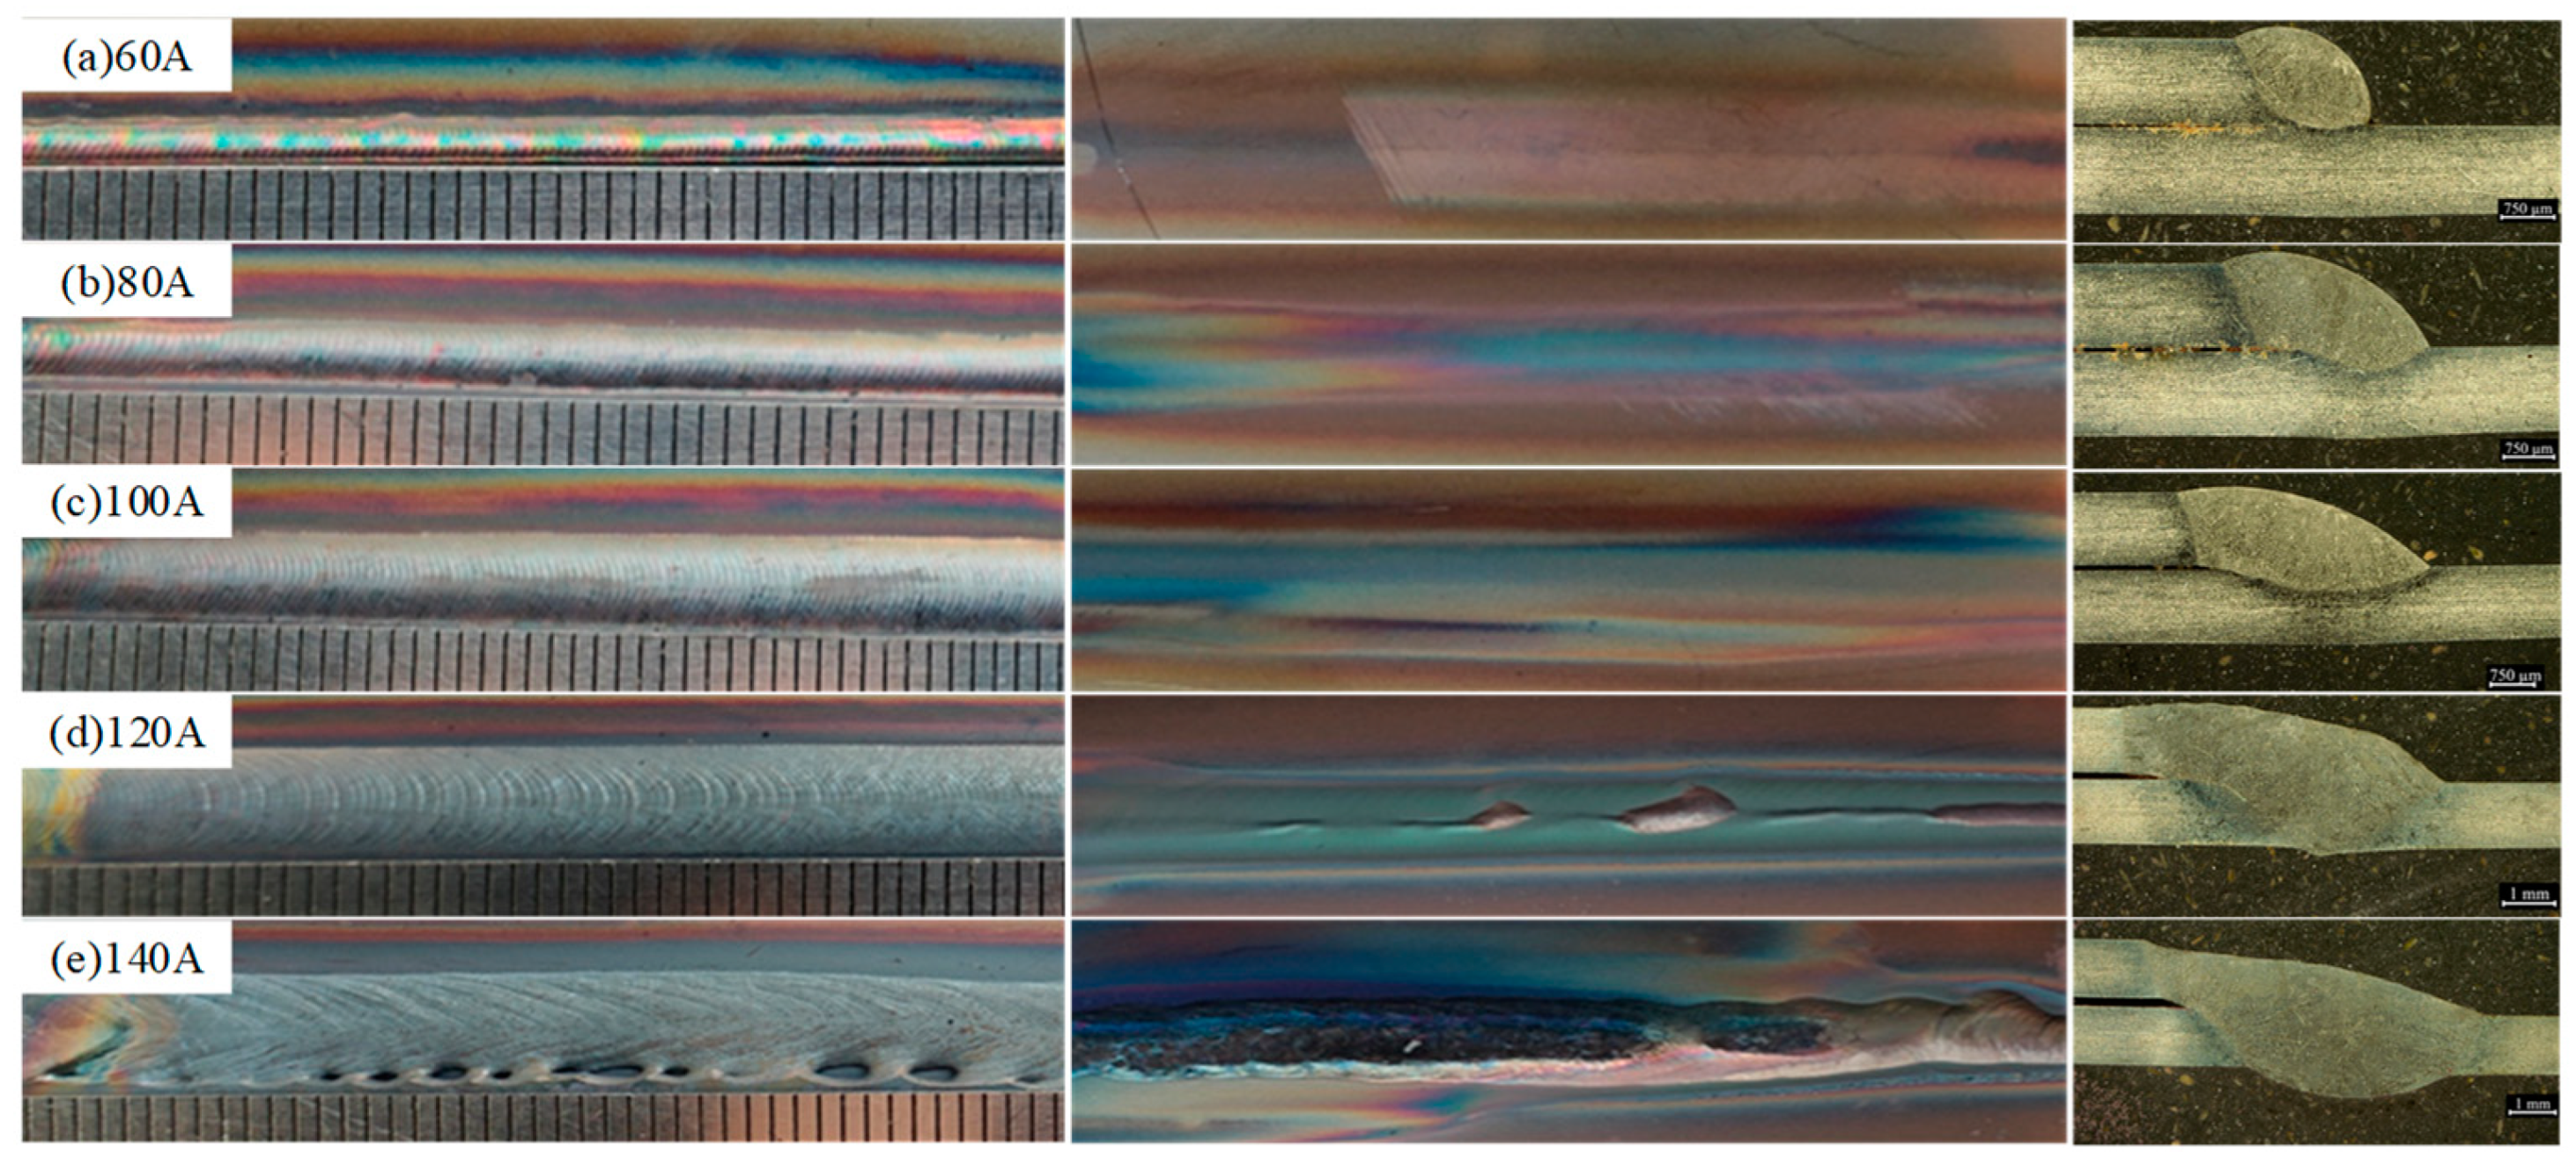
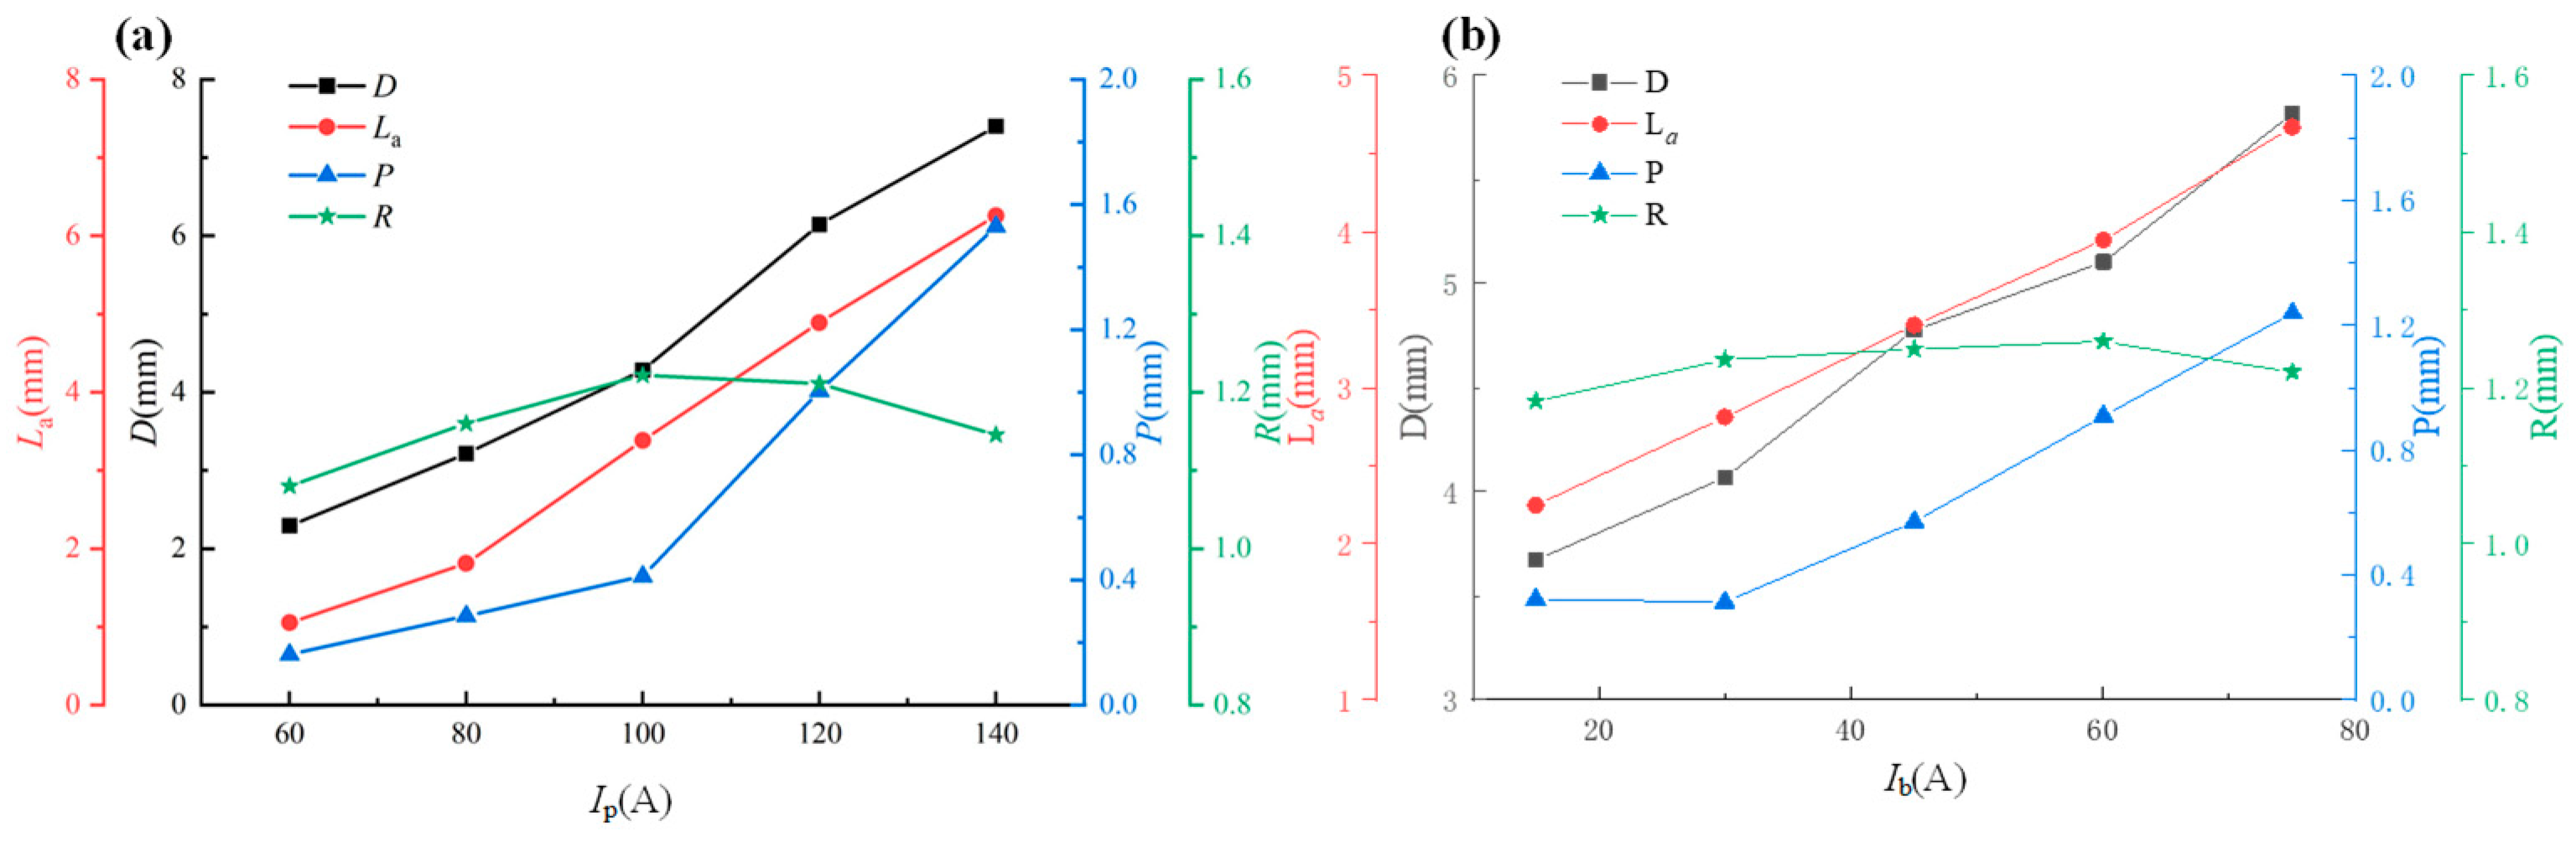
3.1.1. Effects of the Peak Current

During the welding process, the peak current was the primary parameter that affected the arc and weld formation. When the other parameters remained unchanged, the heat input could be altered by adjusting the peak current. Figure 4 depicts the profiles and cross-sections of the fronts and backs of welds formed under different peak currents. The figure shows that, when the peak current was 60 A, the weld had a good formation, an obvious fish scale pattern, and no burn-through or melting defects. However, it was narrow, the transition between the weld metal and the BM of the lower plate was not smooth, and there was poor fusion between the upper and lower plates. Because the heat input was low for this case, the upper plate material did not fully melt and could not form a good melt pool with the lower plate material; thus, an effective welding connection could not be formed. When the peak current increased to 80 A, there were obvious improvements in the macroscopic formation of the lap weld; the weld surface was well formed, there were no crack defects, and the width of the weld was greater. When the peak current was 120 A, the weld surface was well formed, but the backside of the lower plate had begun to melt. When the peak current increased to 140 A, serious local non-fusion phenomena were evident in the weld, the weld formation was poor, and the back of the weld exhibited obvious collapse and poor formation. The shape of the cross-section of the weld pool also reflected the same results. These results occurred because the welding heat input increased with increases in the peak current, and the fluidity of the molten metal increased with increases in the temperature. Because of gravitational effects, the weld metal exhibited serious underflow characteristics. Since the base material of the upper plate was thin, the amount of melted metal per unit length was reduced so that there was not enough molten metal to fill the void formed when the metal flowed down from the molten pool. Thus, local non-fusion phenomena occurred, which increased the biting edge of the upper plate and the amount of metal that flowed down.
Observations of both the metallographic cross-section images presented in Figure 4 and the information presented in Figure 5a indicated that, as the peak current increased, characteristic dimensions D and La of the weld seams increased nearly linearly. When the peak current was 60 A, D and La were 2.29 and 1.05 mm, respectively. When the peak current was 140 A, D and La were 7.40 and 6.25 mm, respectively. Compared to when the peak current was 60 A, D and La increased by approximately 223% and 495%, respectively. For peak current values of 60 and 80 A, characteristic values D, La, and P did not meet the weld formation requirements in the GTT standard; they met the requirements, however, for peak current values of 100–120 A. When the peak current reached 120 A, D exceeded the standard upper limit of 6 mm, and rear melting occurred. When the peak current increased, the welding heat input increased correspondingly, thereby producing gradual increases in P. However, characteristic dimension R changed relatively little as the peak current changed.

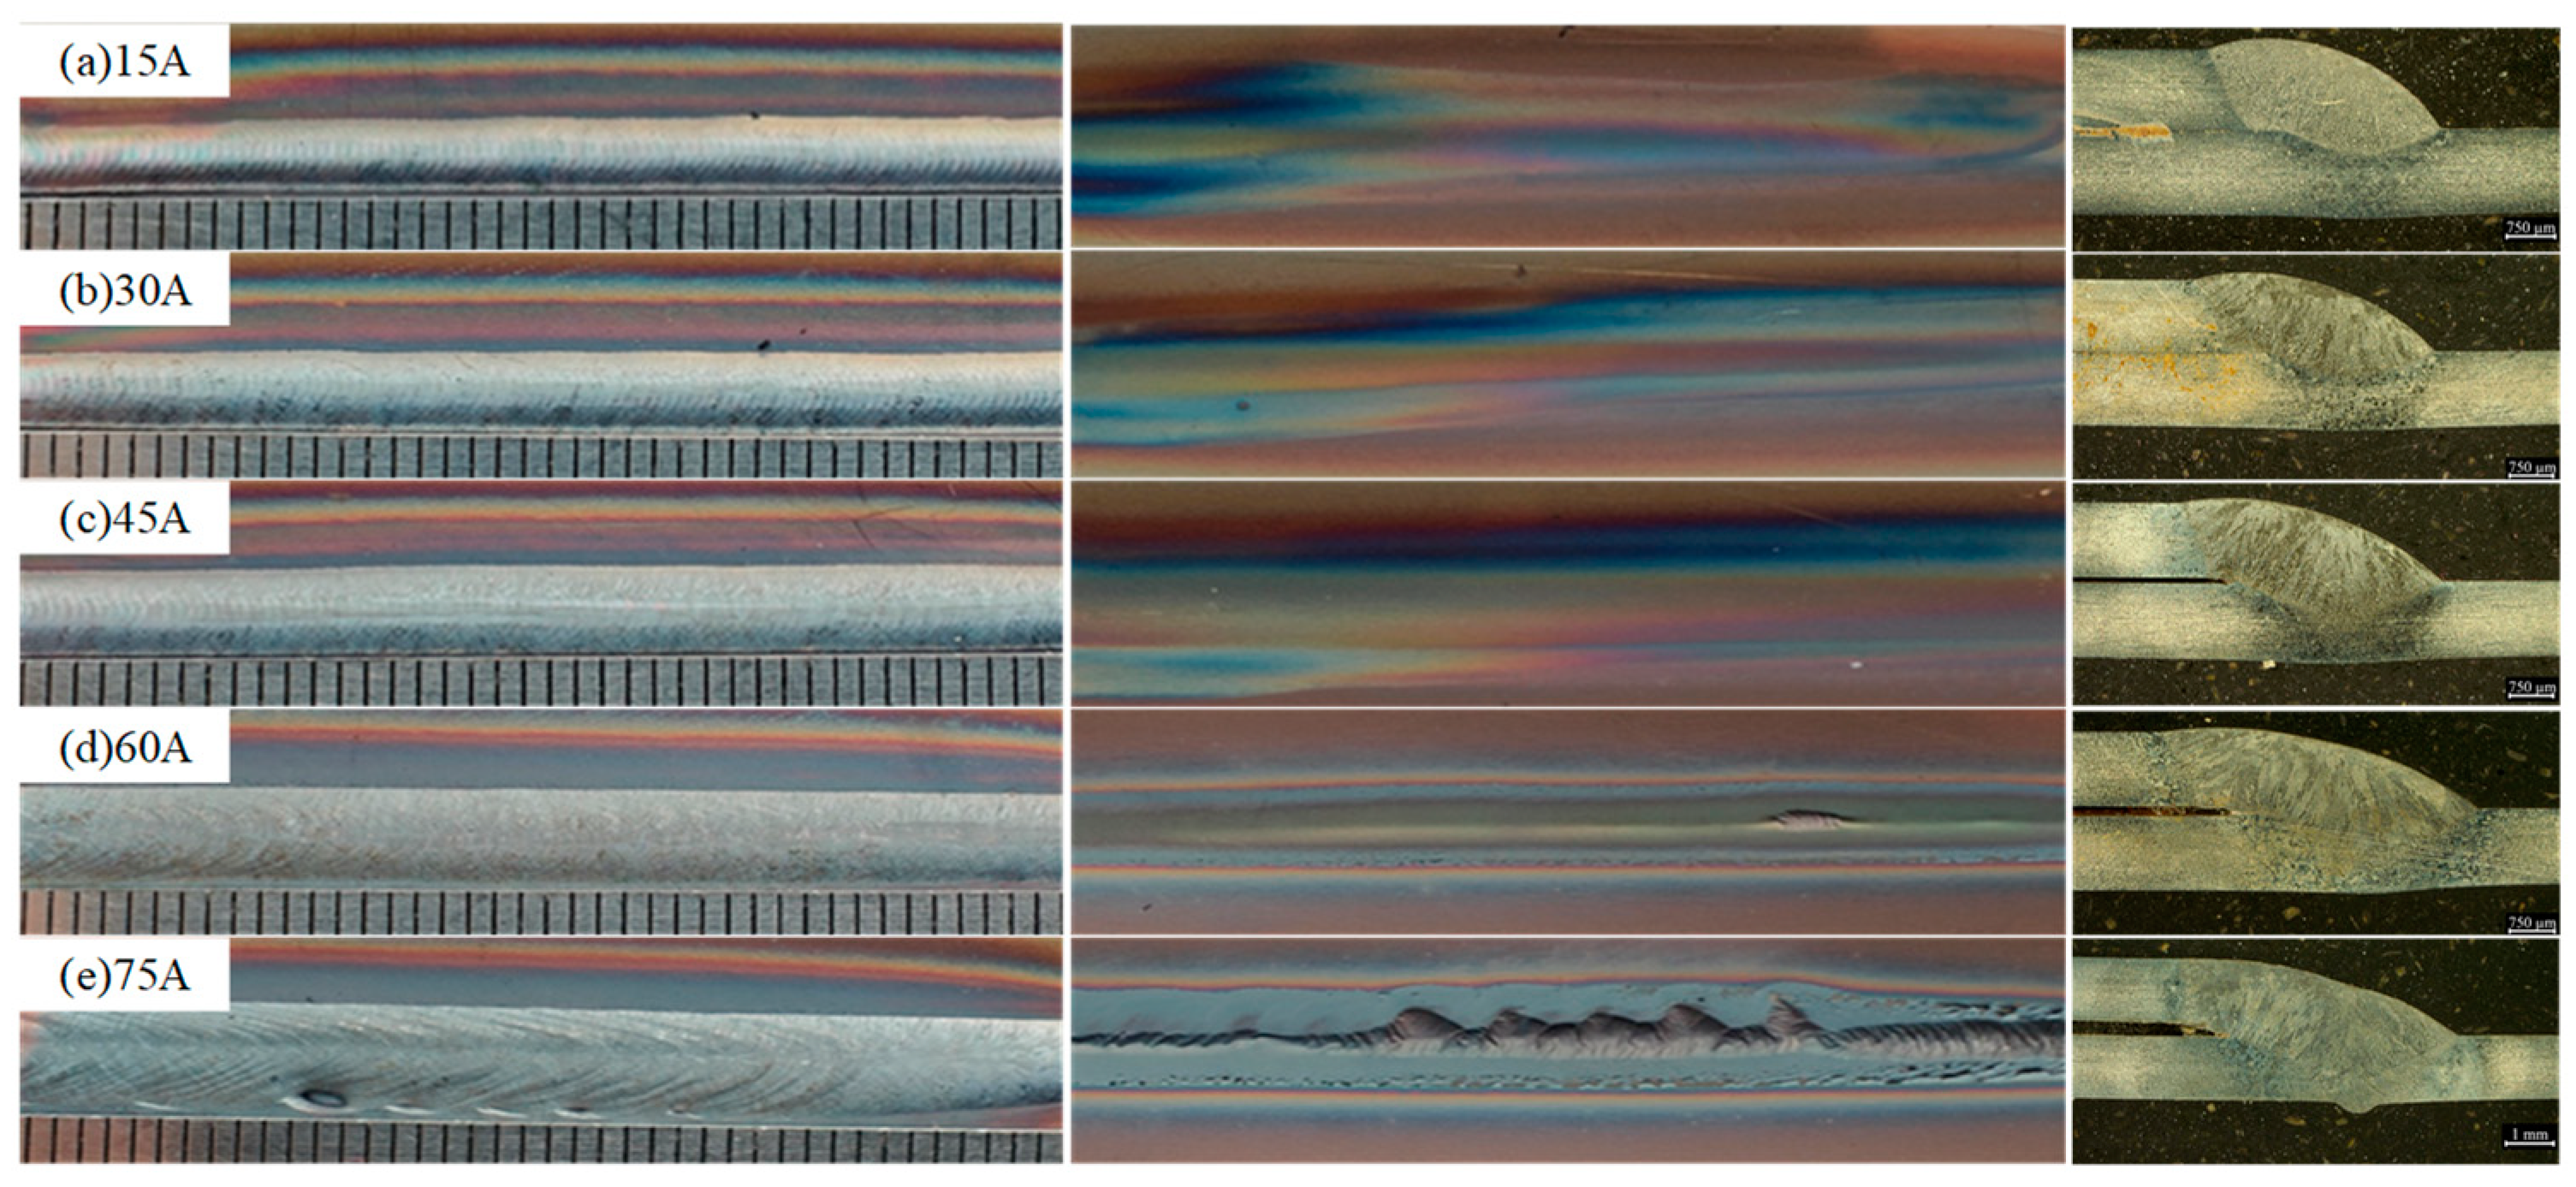
3.1.2. Effects of the Background Current

During the P-GTAW process, the background current is applied between two adjacent pulses. During the welding process, the basic current stage can maintain the arc combustion, reduce the welding heat input, cause the metal in the molten pool to solidify, and adjust the arc energy. When the other parameters remain unchanged, the cooling rate and preheating effect of the molten pool of the workpiece can be adjusted by changing the background current. Figure 6 depicts the macroscopic formations and molten pool morphologies of welds formed with different background currents. The figure shows that, for background currents of 15, 30, and 45 A, the weld surfaces were well formed, with obvious fish scale patterns and no crack defects. As the background current increased, the average welding current and the heat input also increased. When the background current was 60 A, the back of the weld showed signs of penetration. When the background current increased to 75 A, the weld exhibited local non-fusion phenomena, the weld formation was poor, and the back of the weld collapsed. The causes of these results were similar to those for the peak current results that were discussed previously, so they are not repeated here.
Figure 5b demonstrates that, for background currents of 15 and 30 A, D, La, and R all met the requirements of the GTT standard; however, P did not meet the requirements. When the background current increased to 45 A, each characteristic value met the standard requirements. When the other welding parameters remained unchanged, the amount of molten metal increased with increases in the pulsed TIG background current, and D, La, and P all exhibited gradual increasing trends. The changes in R were relatively small, however. If the background current is too low, the heat input to the workpiece is reduced, and the arc is unstable during the welding process. If the background current is too high, however, the weld thermal cycling process is similar to that of DC welding, and the advantages of pulse welding are mitigated.

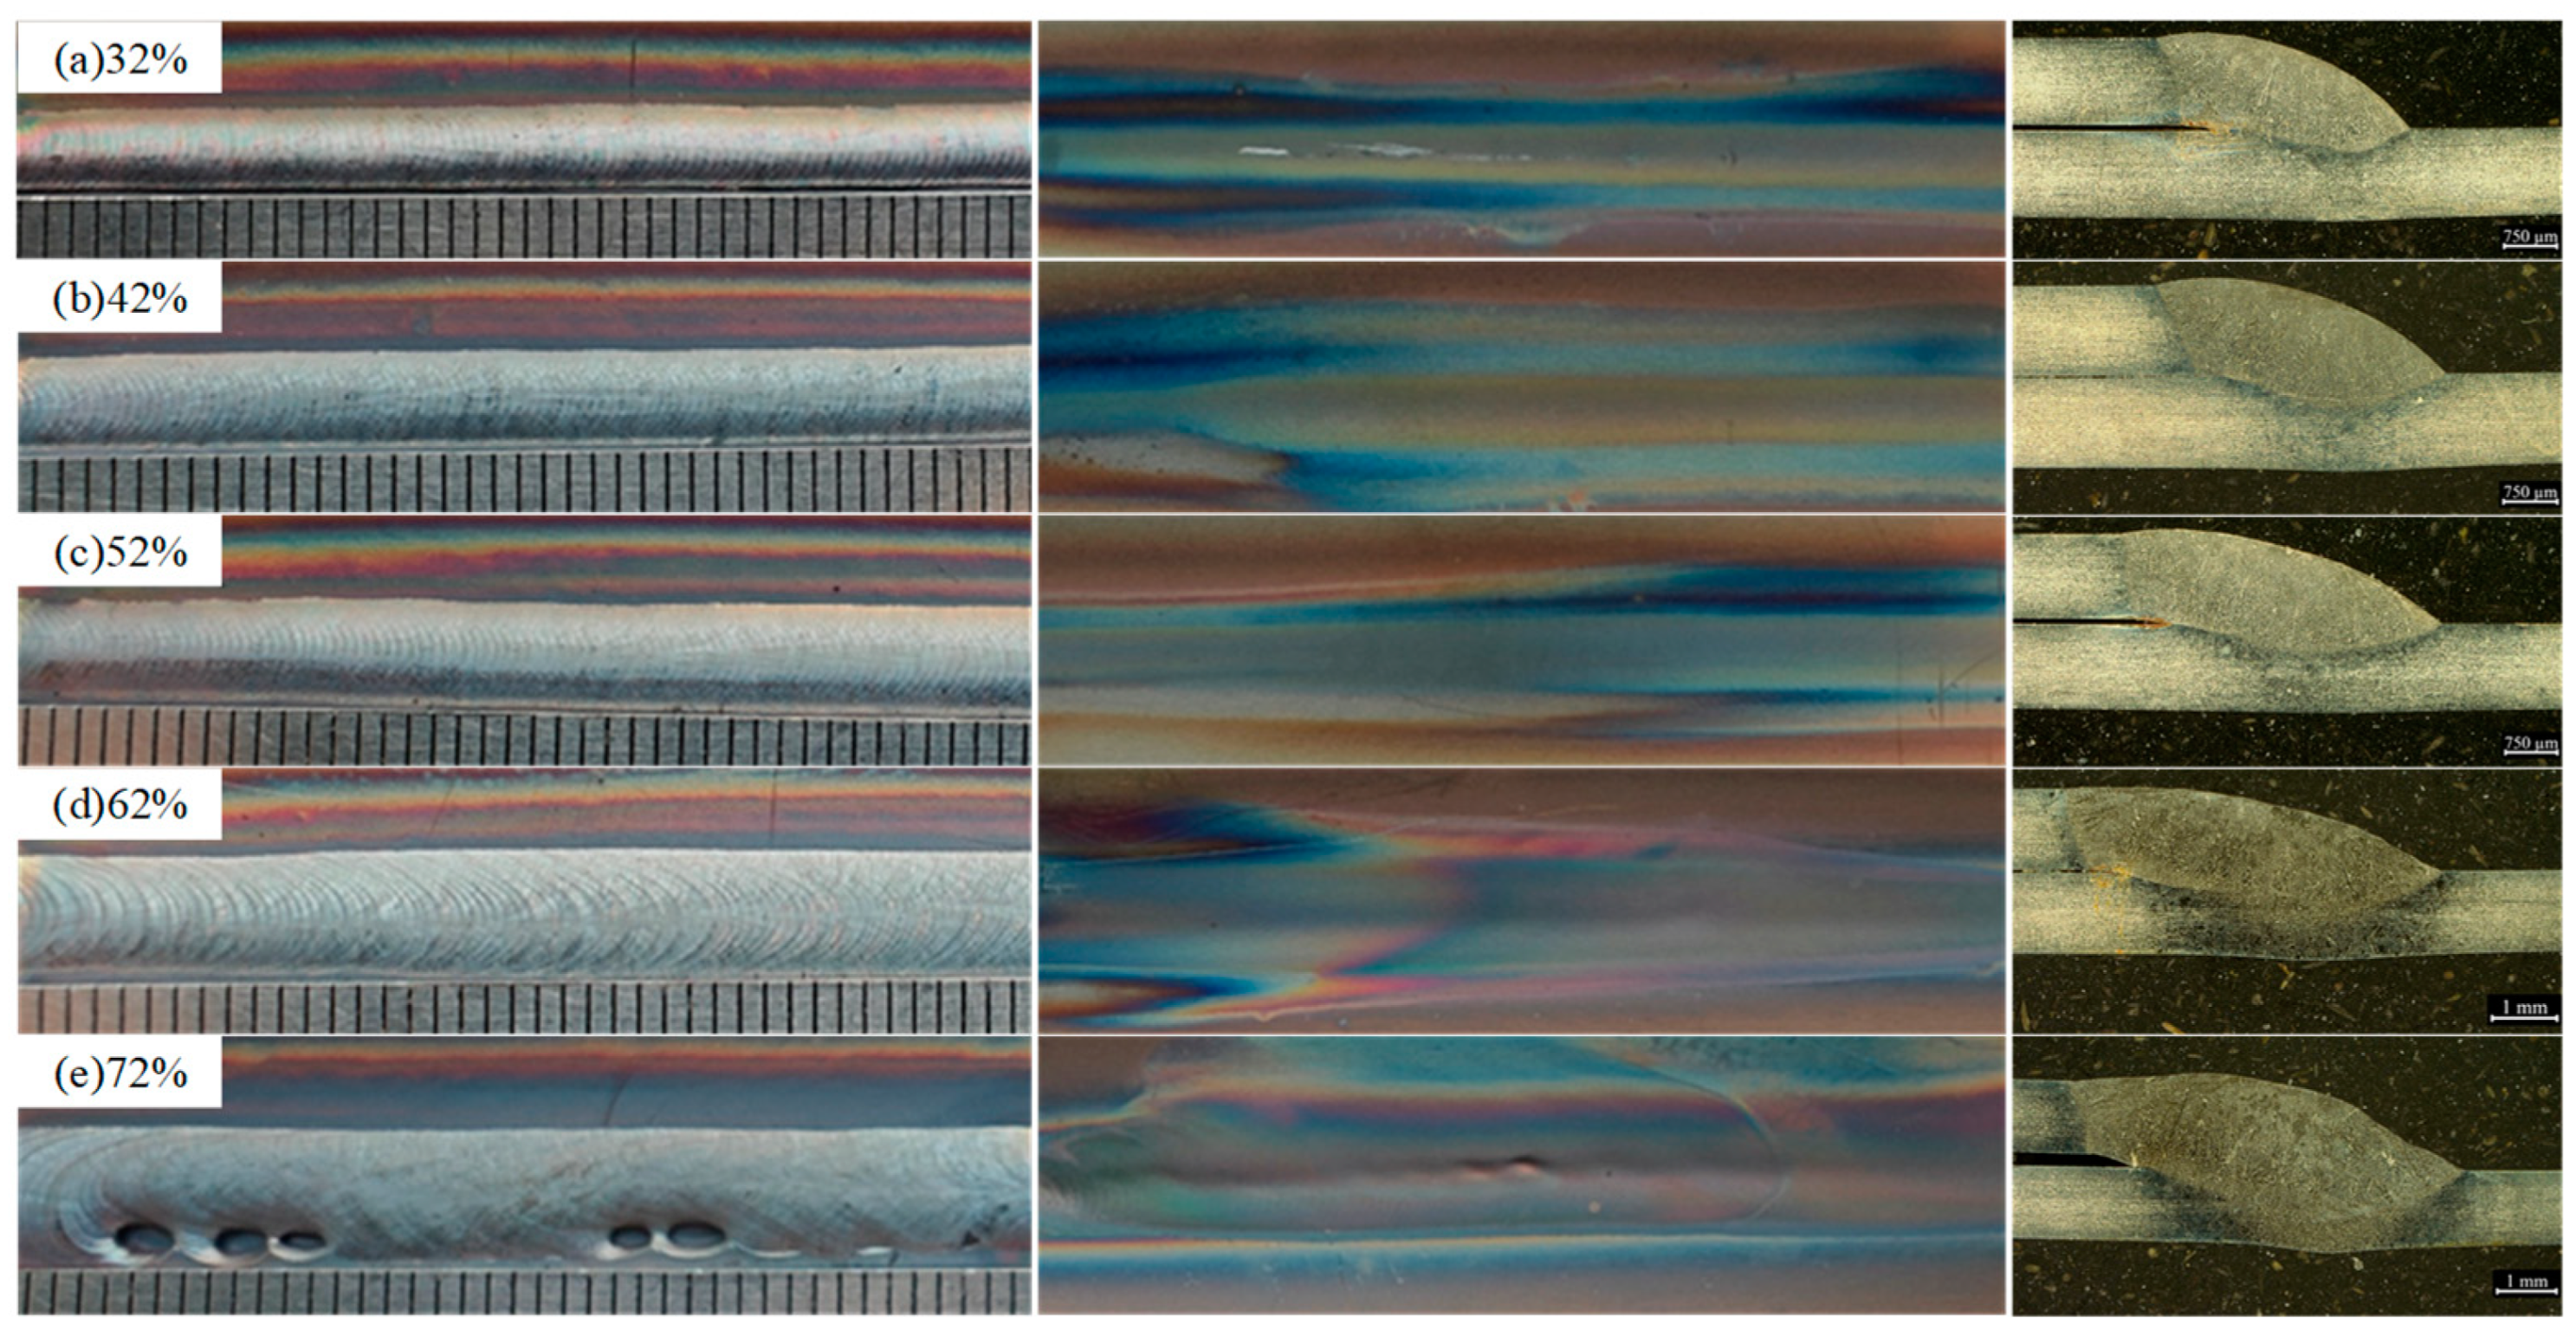
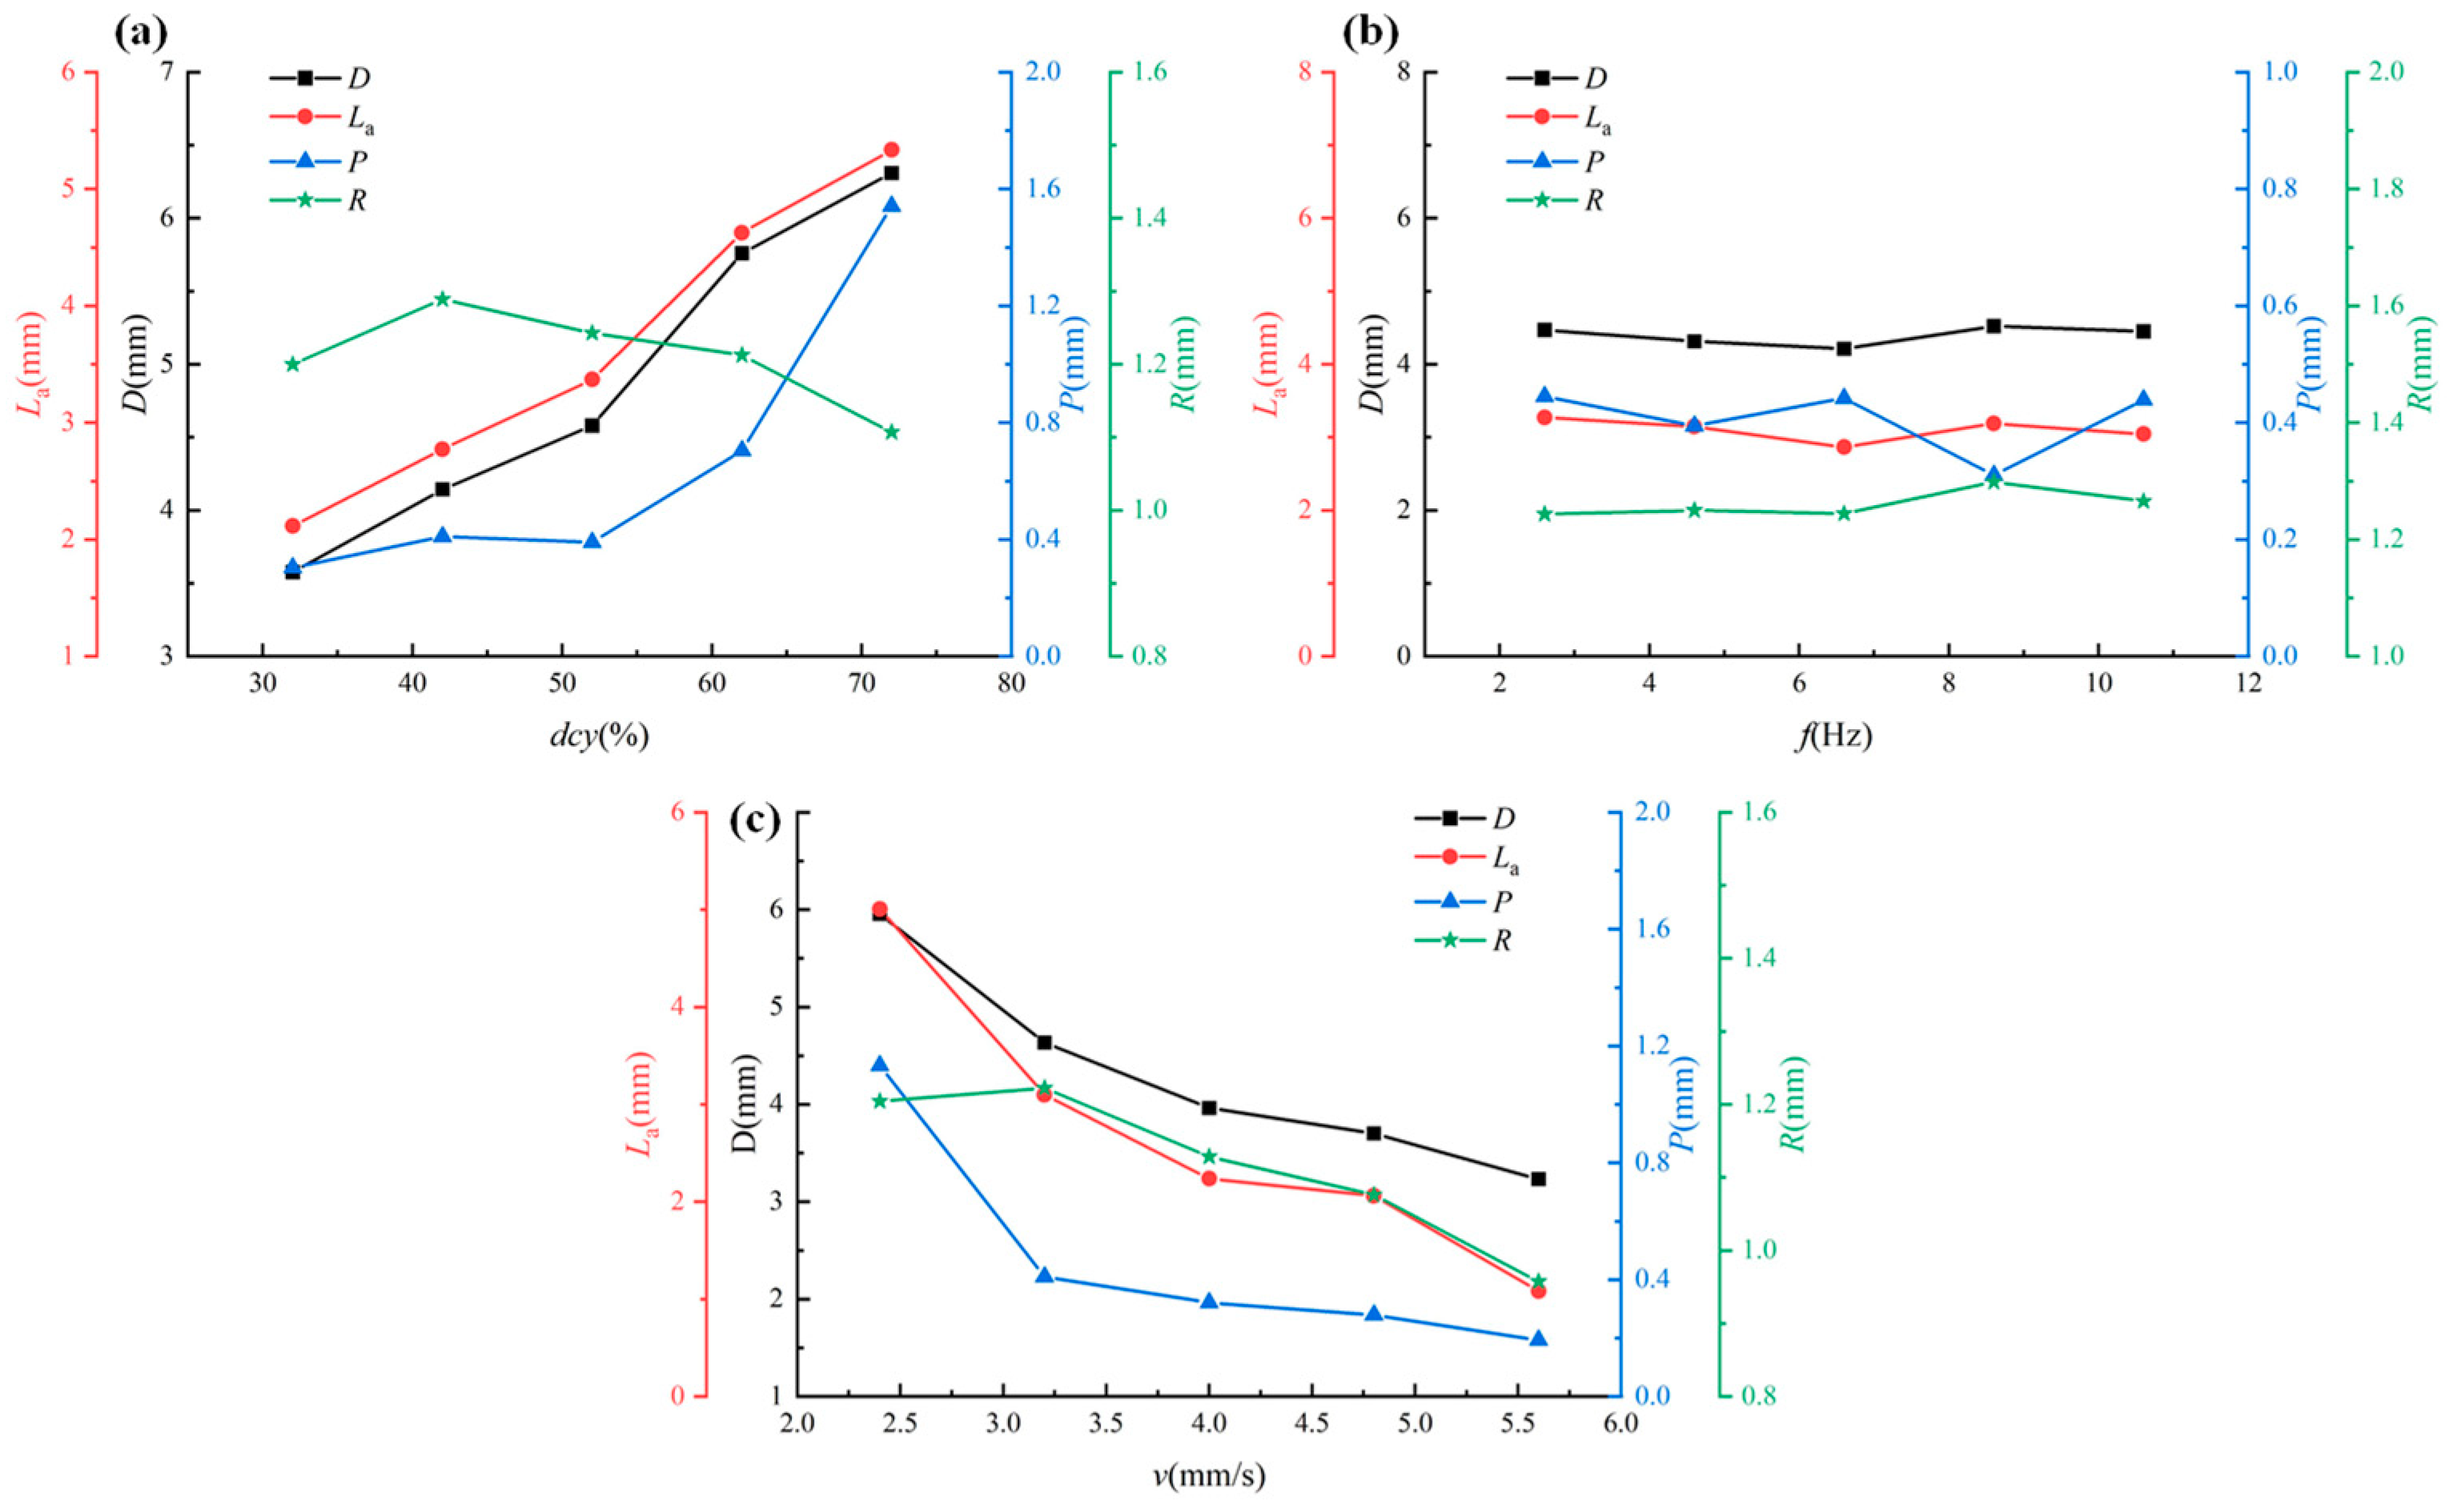
3.1.3. Effects of the Duty Cycle

The P-GTAW pulsed current duty cycle refers to the duration of the peak current as a percentage of the entire cycle. Adjusting the duty cycle can change the average current, thereby affecting the heat input. It also changes the periodicity of the welding heat input, which then affects the melting and solidification process of the molten pool. Thus, the duty cycle is also an important welding parameter in P-GTAW. Figure 7 depicts the cross-sections of the macroscopic formations of welds formed under different duty cycles. The figure shows that, when the pulsed current duty cycle was 32–62%, the welds had surfaces that were well formed, with obvious fish scale patterns, no crack defects, no penetration, and backs that were well formed. As the duty cycle increased, the weld width also increased significantly. When the duty cycle reached 72%, the amount of melted weld metal increased so much that the metal in the molten pool exhibited underflowing characteristics. Furthermore, there were defects in the biting edges, and there was melting through the back of the weld.
When the peak current and base current remained unchanged while the duty ratio increased, the average value of the pulsed current also increased, thereby increasing the heat input. Figure 8a demonstrates that, when the other welding parameters remained unchanged, as the pulsed current duty cycle increased, D and La both exhibited gradual increasing trends, P remained constant and then increased, and R first increased and then decreased over a small range. When the duty cycle was 32%, P was 0.31 mm, which was lower than the value in the GTT standard. As the duty cycle increased, the value of this weld formation characteristic increased gradually, eventually meeting the requirements of the GTT standard. When the duty cycle was 72%, the melting width reached 6.31 mm, which exceeded the upper limit in the standard.

3.1.4. Effects of the Pulse Frequency

The pulse frequency of P-GTAW refers to the number of times per second that the current pulses during the welding process. It also reflects the length of the pulse period. Each time a current pulse passes through the workpiece, a point-like molten pool is generated. When the background current is applied, the molten pool is cooled to obtain a pulse weld that consists of many solder joints that are continuously lapped. Figure 9 depicts the macroscopic morphologies of lap joints obtained under different pulse frequencies. The figure shows that the welds had good appearances, with no oxidation characteristics or visible cracks, and that melting did not occur on the backside. When the welding pulse frequency changed while the other parameters remained unchanged, the spacing of the fish scale patterns of the welds changed. For a frequency of 2.6 Hz, the distance between the fish scales was large, and the surface was relatively rough. As the pulse frequency increased, the distance between the fish scales decreased, thereby densifying the fish scale pattern and causing a continuous and dense weld to form. However, the pulse frequency should not be too high. For a certain speed, a too-high pulse frequency would cause overlap between the solder joints, thereby resulting in excessive heat input. This excessive heat input would therefore cause burn-through or would produce a molten pool with excessive liquidity, which would result in the formation of hump weld defects. When the pulse frequency is too high, the pulse effect is not obvious; thus, the weld shape gradually tends toward that produced by DC TIG welding, and the advantages of pulse welding are mitigated.
Figure 8b demonstrates that, as the pulse frequency increased, the variation ranges of D, La, P, and R were small. This result occurred because the heat input remained nearly constant for different pulse frequencies. The average values of D, La, P, and R were 4.39, 3.11, 0.41, and 1.26 mm, respectively. When the pulse frequency was in the 2.6–10.6 Hz range, all these weld characteristic dimensions met the requirements in the GTT standard, though P fluctuated around the lower limit in the standard, which is 0.4 mm.

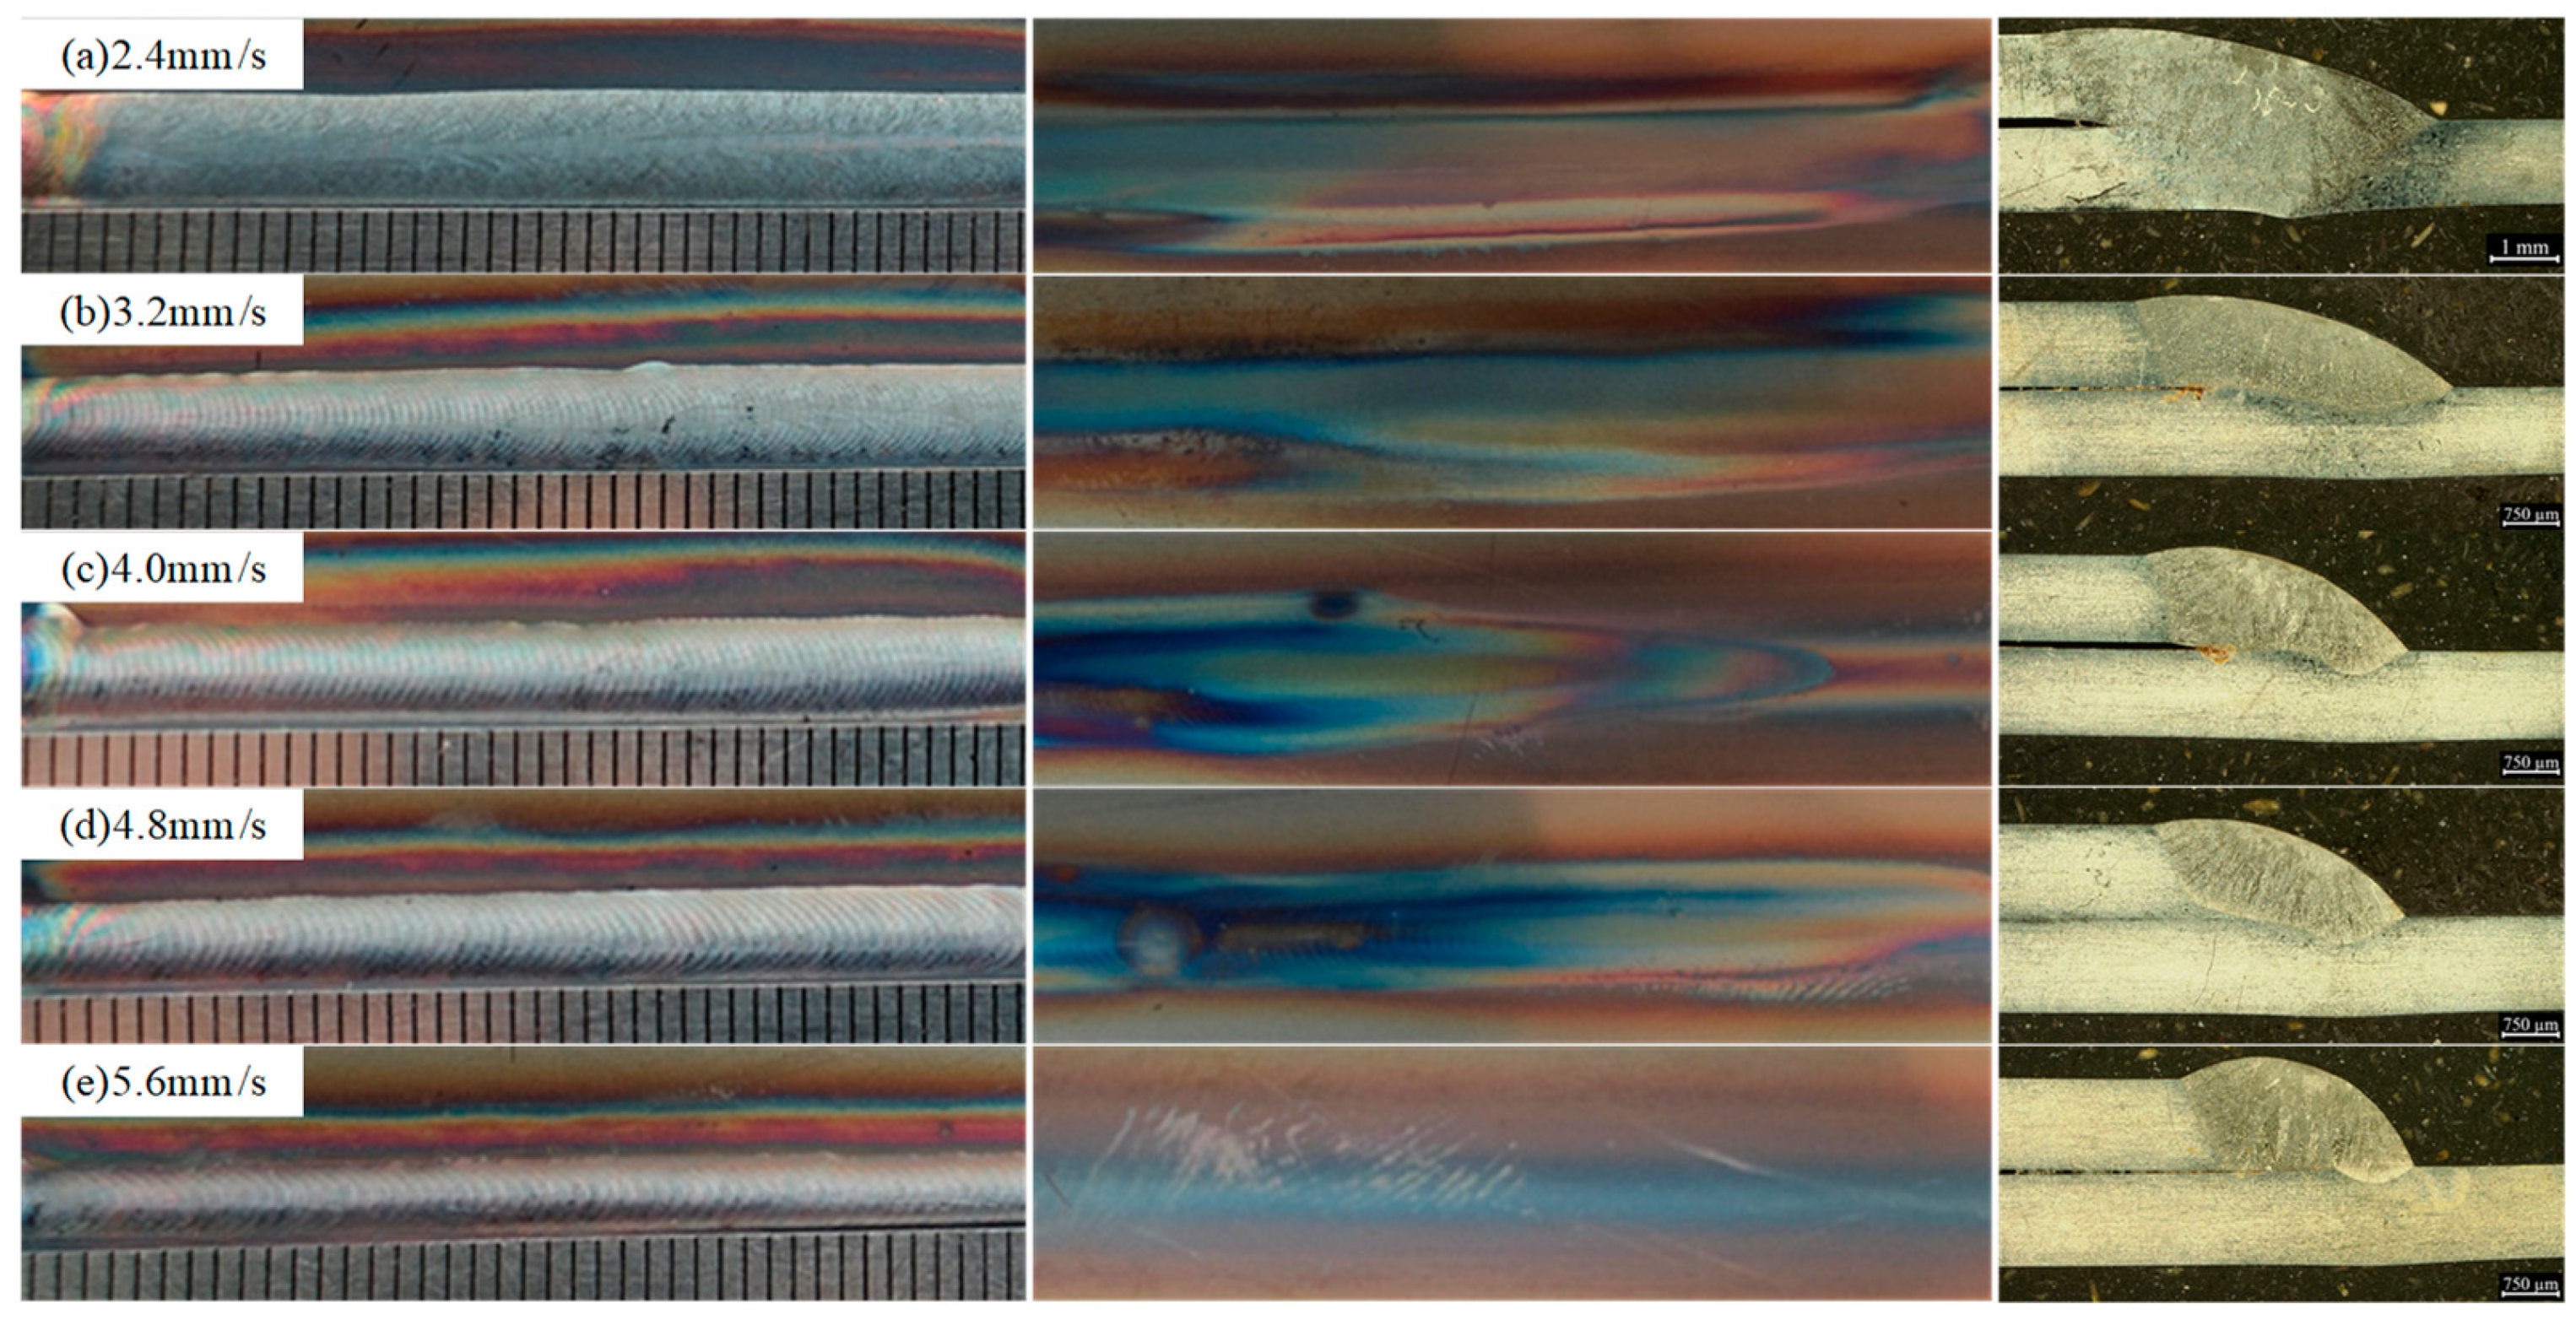
3.1.5. Effects of the Welding Speed

The welding speed is an important parameter that affects the welding heat input; thus, it also has an important effect on the weld formation. The macroscopic morphologies and cross-sections of welds formed at different welding speeds are presented in Figure 10. The figure shows that, when the welding speed was 2.4 mm/s, the width of the weld surface was uniform, with no cracks, local non-fusion phenomena, or other welding defects. In addition, the surface had a good shape, but there was a tendency for melt-through to occur on the back of the weld. When the welding speed was in the 3.2–5.6 mm/s range, the welds contained no cracks, and their surfaces and backs were well formed. As the welding speed increased, the widths of the welds gradually decreased, and the transition between the welding metal and the BM of the lower plate was not smooth. These results are also consistent with the metallographic measurement results of the weld characteristic sizes. These results were produced because, as the welding speed increased, the welding heat input decreased, thereby resulting in a short time during which the molten pool was at a high temperature and a decrease in the peak temperature of the molten pool, which produced poor fluidity in the molten metal from the upper plate. In addition to altering the heating of the molten metal from the upper plate, the heat from the arc also reduced the heating and melting heat for the lower plate; thus, an effective connection with the lower plate could not be achieved, and the weld possessed poor formation quality. Based on the results presented previously, it was surmised that the melting depth was also smaller for this case. In contrast, as the welding speed decreased, the time during which the molten pool was at a high temperature and the fluidity of the molten pool both increased, thereby enabling the molten metal from the upper plate to be spread over the lower plate, which is conducive to improvements in the weld formation quality.
The weld pools from the joint cross-sections depicted in Figure 10 did not exhibit any obvious defects, such as pores or cracks. Figure 8c shows the variation trends of the weld characteristic dimensions at different welding speeds. When the welding speed increased while other welding parameters remained unchanged, the heat input decreased. A combination of Figure 10 and Figure 8c indicates that the volume of the weld pool decreased significantly as the welding speed increased, thereby resulting in decreases in D, La, and P and a slight decrease in R; however, the variation ranges were small. When the welding speed increased from 2.4 to 3.2 mm/s, P experienced its largest change, which was a decrease from 1.075 to 0.41 mm. However, P changed only slightly when the welding speed was in the 3.2–5.6 mm/s range. For welding speeds of 2.4 and 3.2 mm/s, the weld characteristic dimensions met the requirements in the GTT standard; however, for welding speeds of 4.0 and 5.6 mm/s, D and P were less than 2.0 and 0.4 mm, respectively, which are the limits specified in the standard.

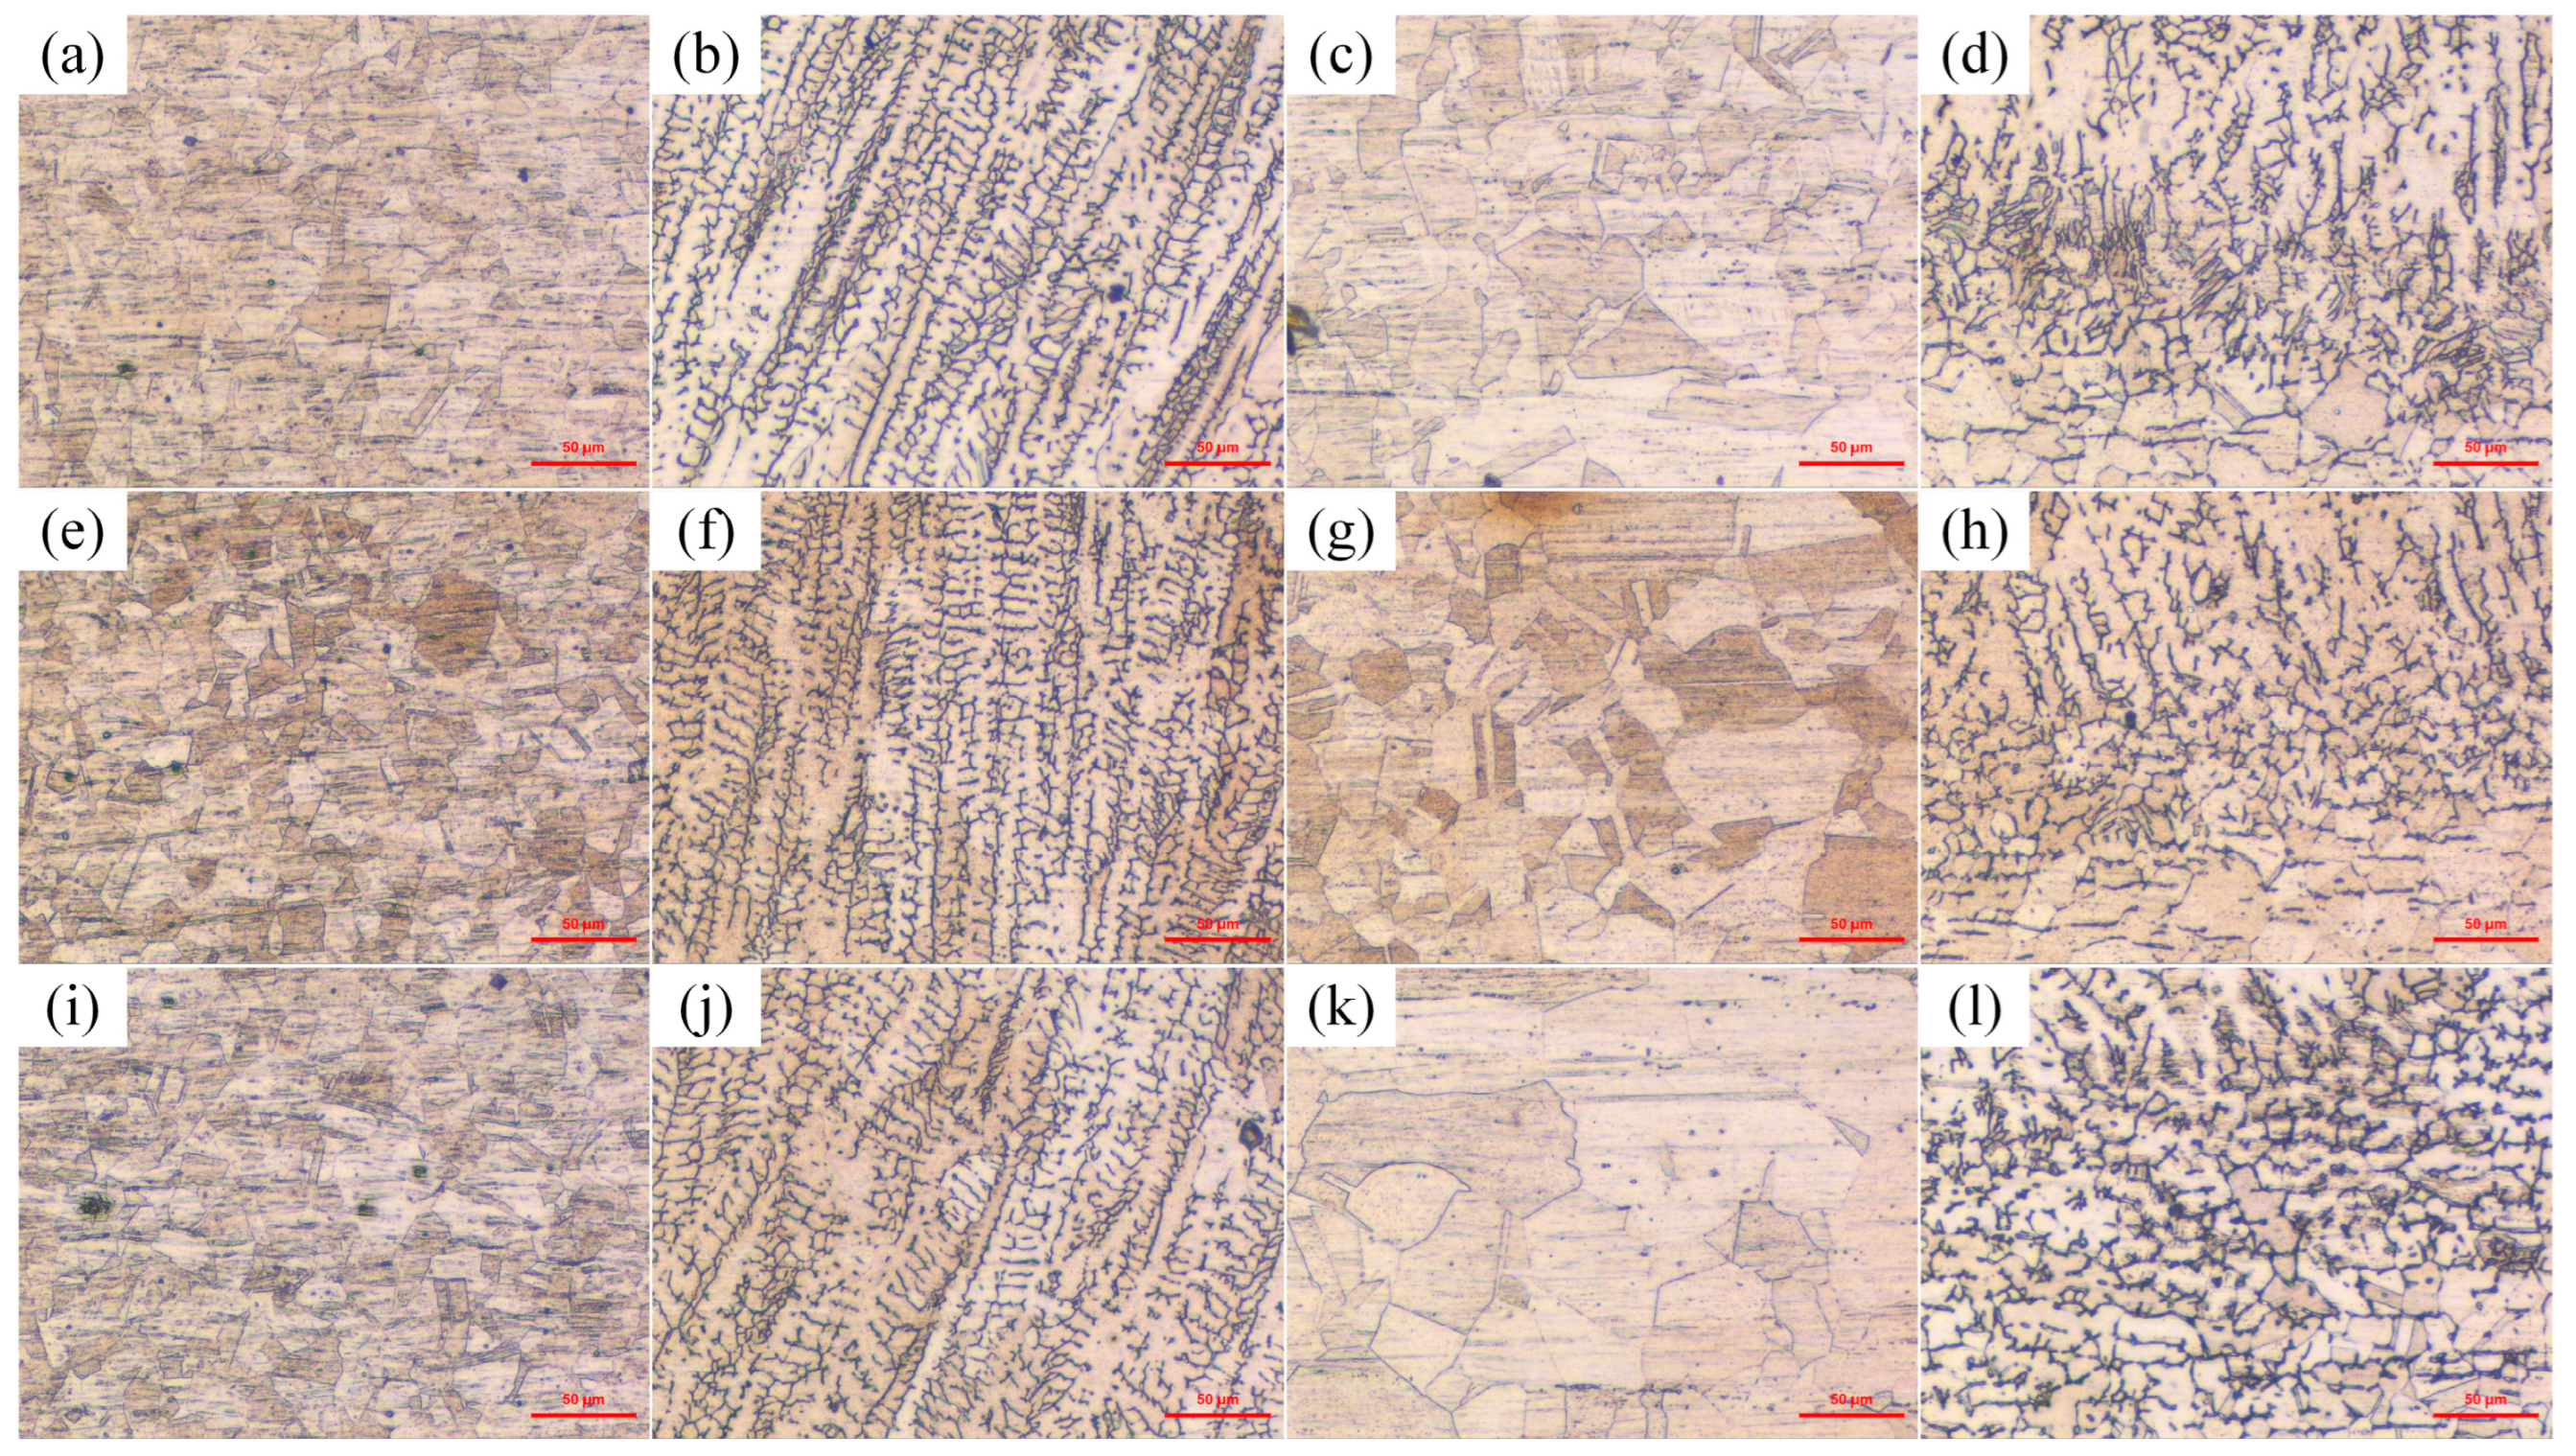
3.2. Microstructure Analyses of Welded Joints

3.2.1. Analysis of a Typical Lap Joint Structure

Figure 11 presents a metallographic structural diagram of a typical 304L stainless steel P-GTAW lap joint. There are significant variations between the structural morphologies of the different regions of the joint, and the regional divisions are obvious. According to the joint morphological characteristics shown in the diagram, the joint was divided into four zones: a BM zone, a weld zone (FZ), a heat-affected zone (HAZ), and a fusion zone (PMZ).
High-magnification metallographic structures for the four characteristic regions of the joint were obtained for test No. 8 (i.e., a background current of 45 A) and are shown in Figure 12. The HAZ was composed of coarse equiaxed crystals, and the grain size was larger close to the near-weld zone and gradually decreased toward the background material, as shown in Figure 12c. A comparison of Figure 12a,c indicated that the grains in the HAZ of the welded joint were thicker than those in the base material. This phenomenon occurred because 304L stainless steel is a typical austenitic stainless steel, and its unique single-phase microstructure exhibits specific thermal response characteristics during the welding process. These materials do not usually undergo the traditional grain recrystallization process during the welding thermal cycling process, because, especially in the cooling stage, the grain size is not significantly refined by thermodynamic driving forces.
Figure 12b demonstrates that the light regions (austenite) were evenly distributed among the black dendrites (ferrite); this structure was primarily caused by the continuous formation and expansion process of the austenite structure. During this process, austenite growth was achieved by the constant consumption of ferrite. As the transformation process approached its completion, the ferrite was gradually consumed, leaving only a chromium-rich ferrite skeleton structure, which revealed the microscopic mechanisms that governed the interactions between the austenite and ferrite during the solidification process.
Figure 13 depicts high-magnification images of the metallographic structures of the four characteristic regions of welds formed under different background currents (30, 45, and 60 A). Of these microstructures, those in the BM regions contained typical equiaxed austenite grains. The fusion zones primarily consisted of vermicular ferrite, skeletal ferrite, and isaural austenite, and they exhibited large microstructural variations. There was a small columnar dendrite region near the fusion line in Figure 13h, and the columnar crystals grew perpendicular to the fusion line. This result was produced because the temperature gradient in the material near the weld fusion line was high due to the cooling effect of the base material. During cooling, the crystal nuclei that were attached to the surface of the base material in the fusion zone preferentially grew in the direction of the maximum temperature gradient, forming columnar crystals. A comparative analysis of Figure 13d,h,l indicated that, as the background current increased, the size of the fusion zone also increased slightly. The weld zones were primarily composed of austenite matrices and skeletal ferrite. The crystal form in these zones was dominated by cylindrical dendrites, which essentially grew from the weld fusion line to the weld center in a direction perpendicular to the fusion boundary. The crystalline form of a weld is mainly determined by the combined action of the solute concentration in the alloy, the crystallization rate, and the liquid-phase temperature gradient [16]. According to the crystal growth theory, the crystal always grows in the direction of the maximum temperature gradient within the welding pool, and the crystal growth direction is thus perpendicular to the fusion line [17,18,19]. The results presented above are consistent with this theory.
The heat-affected zones, which had coarse equiaxed grains, lay between the BMs and PMZs. They still had austenitic structures; however, their grain sizes were significantly larger than those in the base material regions, because the austenite grains became coarse during overheating and regrew during cooling. This phenomenon occurred because 304L stainless steel has a single-phase austenitic structure, and because of the thermal cycling process that occurs during welding, grain recrystallization will not occur in this material; thus, it lacks a grain refinement mechanism. In addition, the migration activation energy of austenite grain boundaries is relatively low at high temperatures, which causes the grains to readily grow larger during welding. Khan et al. [20] noted that the low thermal conductivity of invar steel causes the portion of the HAZ near the FZ to be sensitive to overheating and that an increase in the duty cycle enables the peak pulse time to be maintained past the duration of a single pulse cycle (i.e., the time that the HAZ spends at a high-temperature increase). Similarly, the thermal conductivity of 304L stainless steel is relatively low, only about 25–33% that of 45 steel, which causes the HAZ near the weld to be more prone to overheating and thus further promotes grain coarsening.
Figure 14 presents low-magnification metallographic structural images of two typical fusion zones (the upper and lower fusion zones) of welded joints formed under background currents of 30, 45, and 60 A. The fusion dividing lines are obvious in these images, and the structural characteristics of each zone varied significantly. As the background current increased, the grain sizes in the HAZs gradually increased, and the overall sizes of the HAZs also gradually increased. This result occurred because, as the background current increased, the welding heat input increased, the temperature gradient decreased, the high-temperature residence time of the HAZ increased during the thermal cycling process, and the grain growth increased. The non-overheating cycle was affected by the combined temperature and holding time effects.

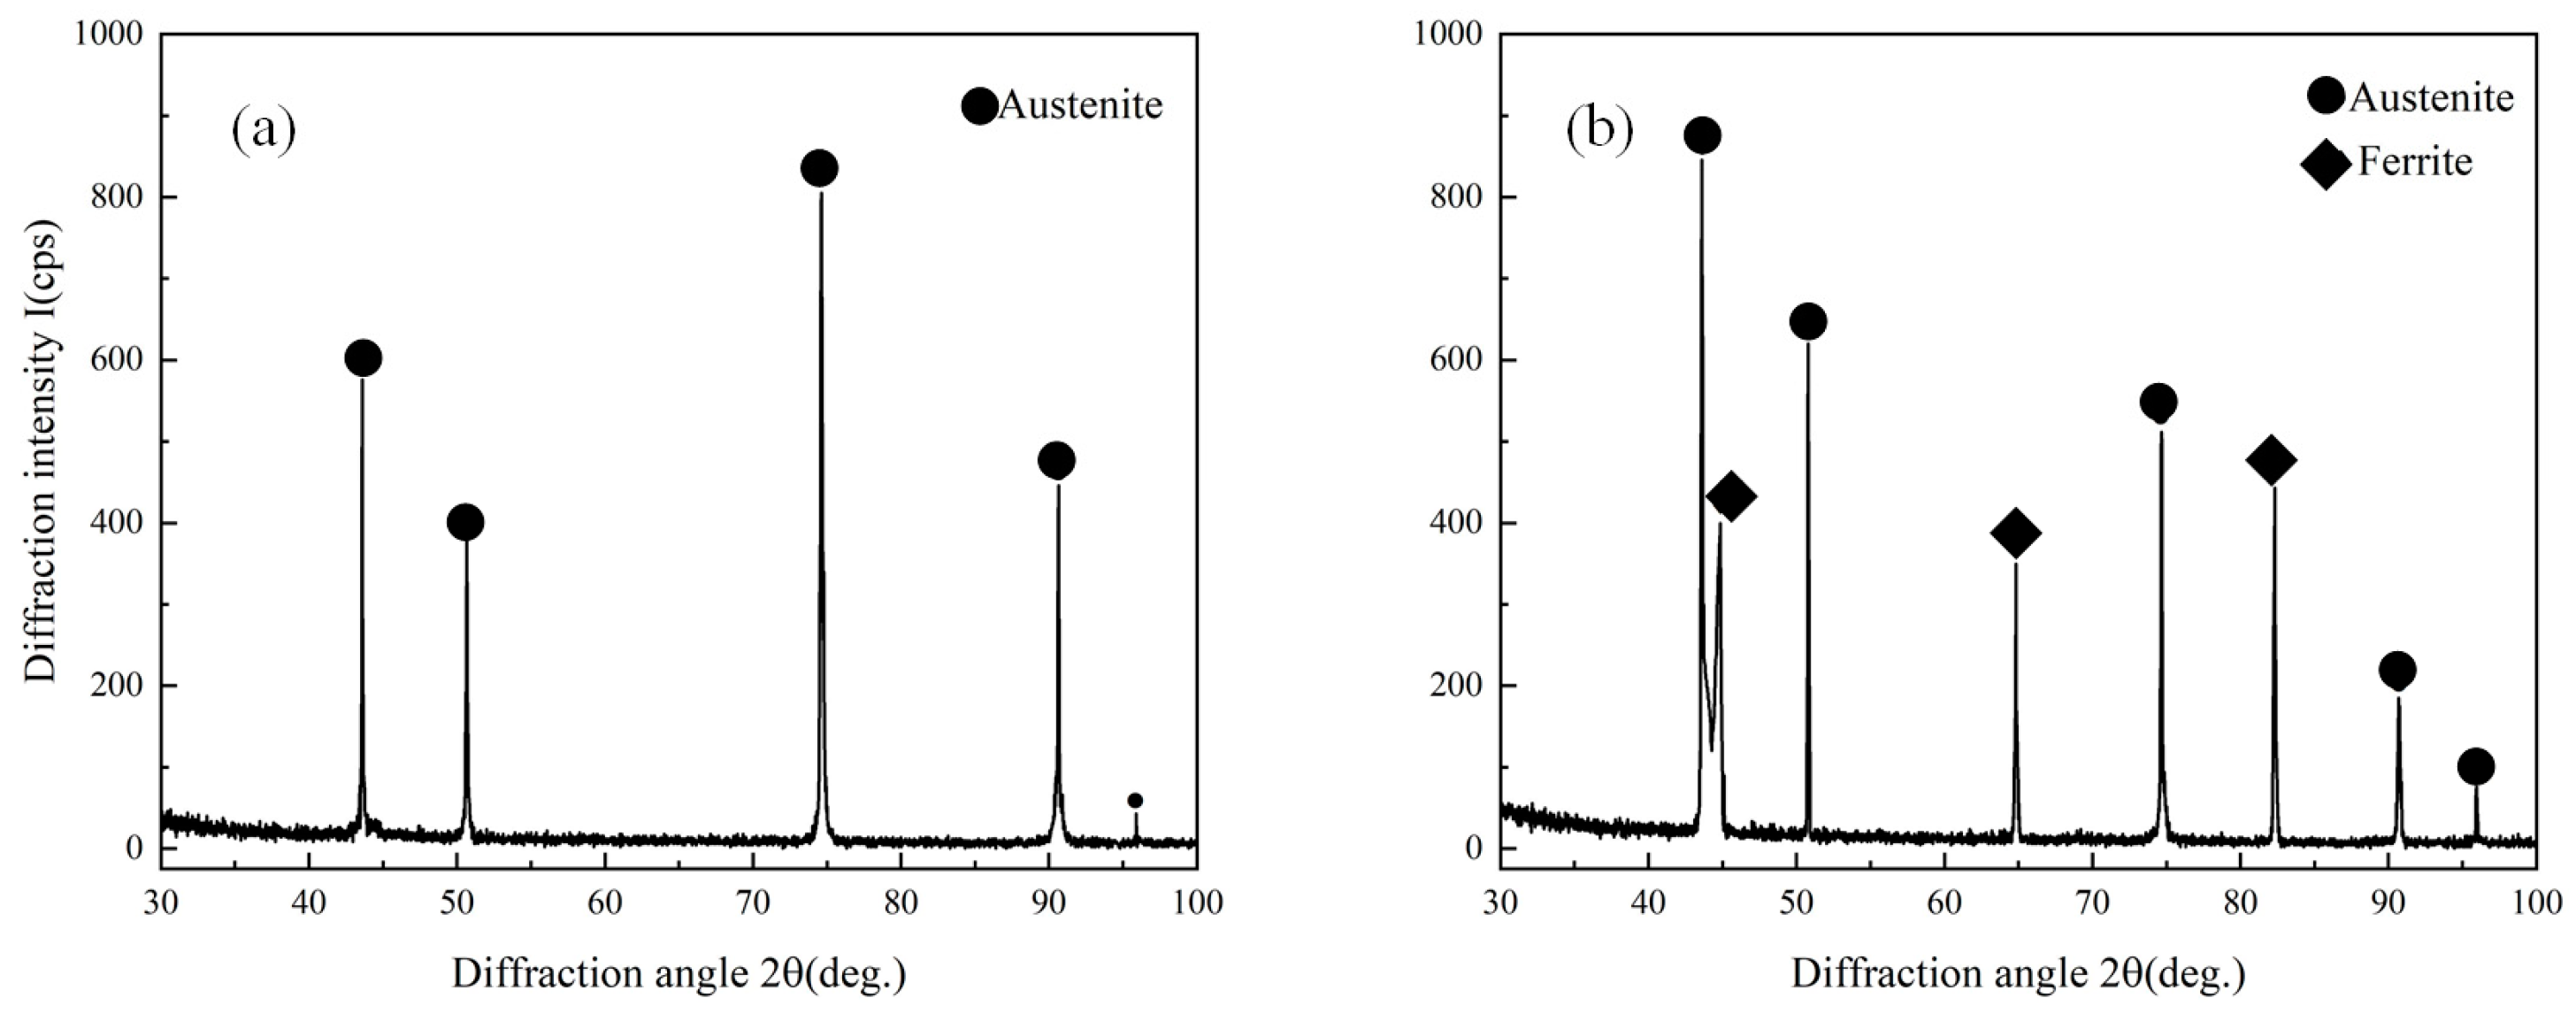
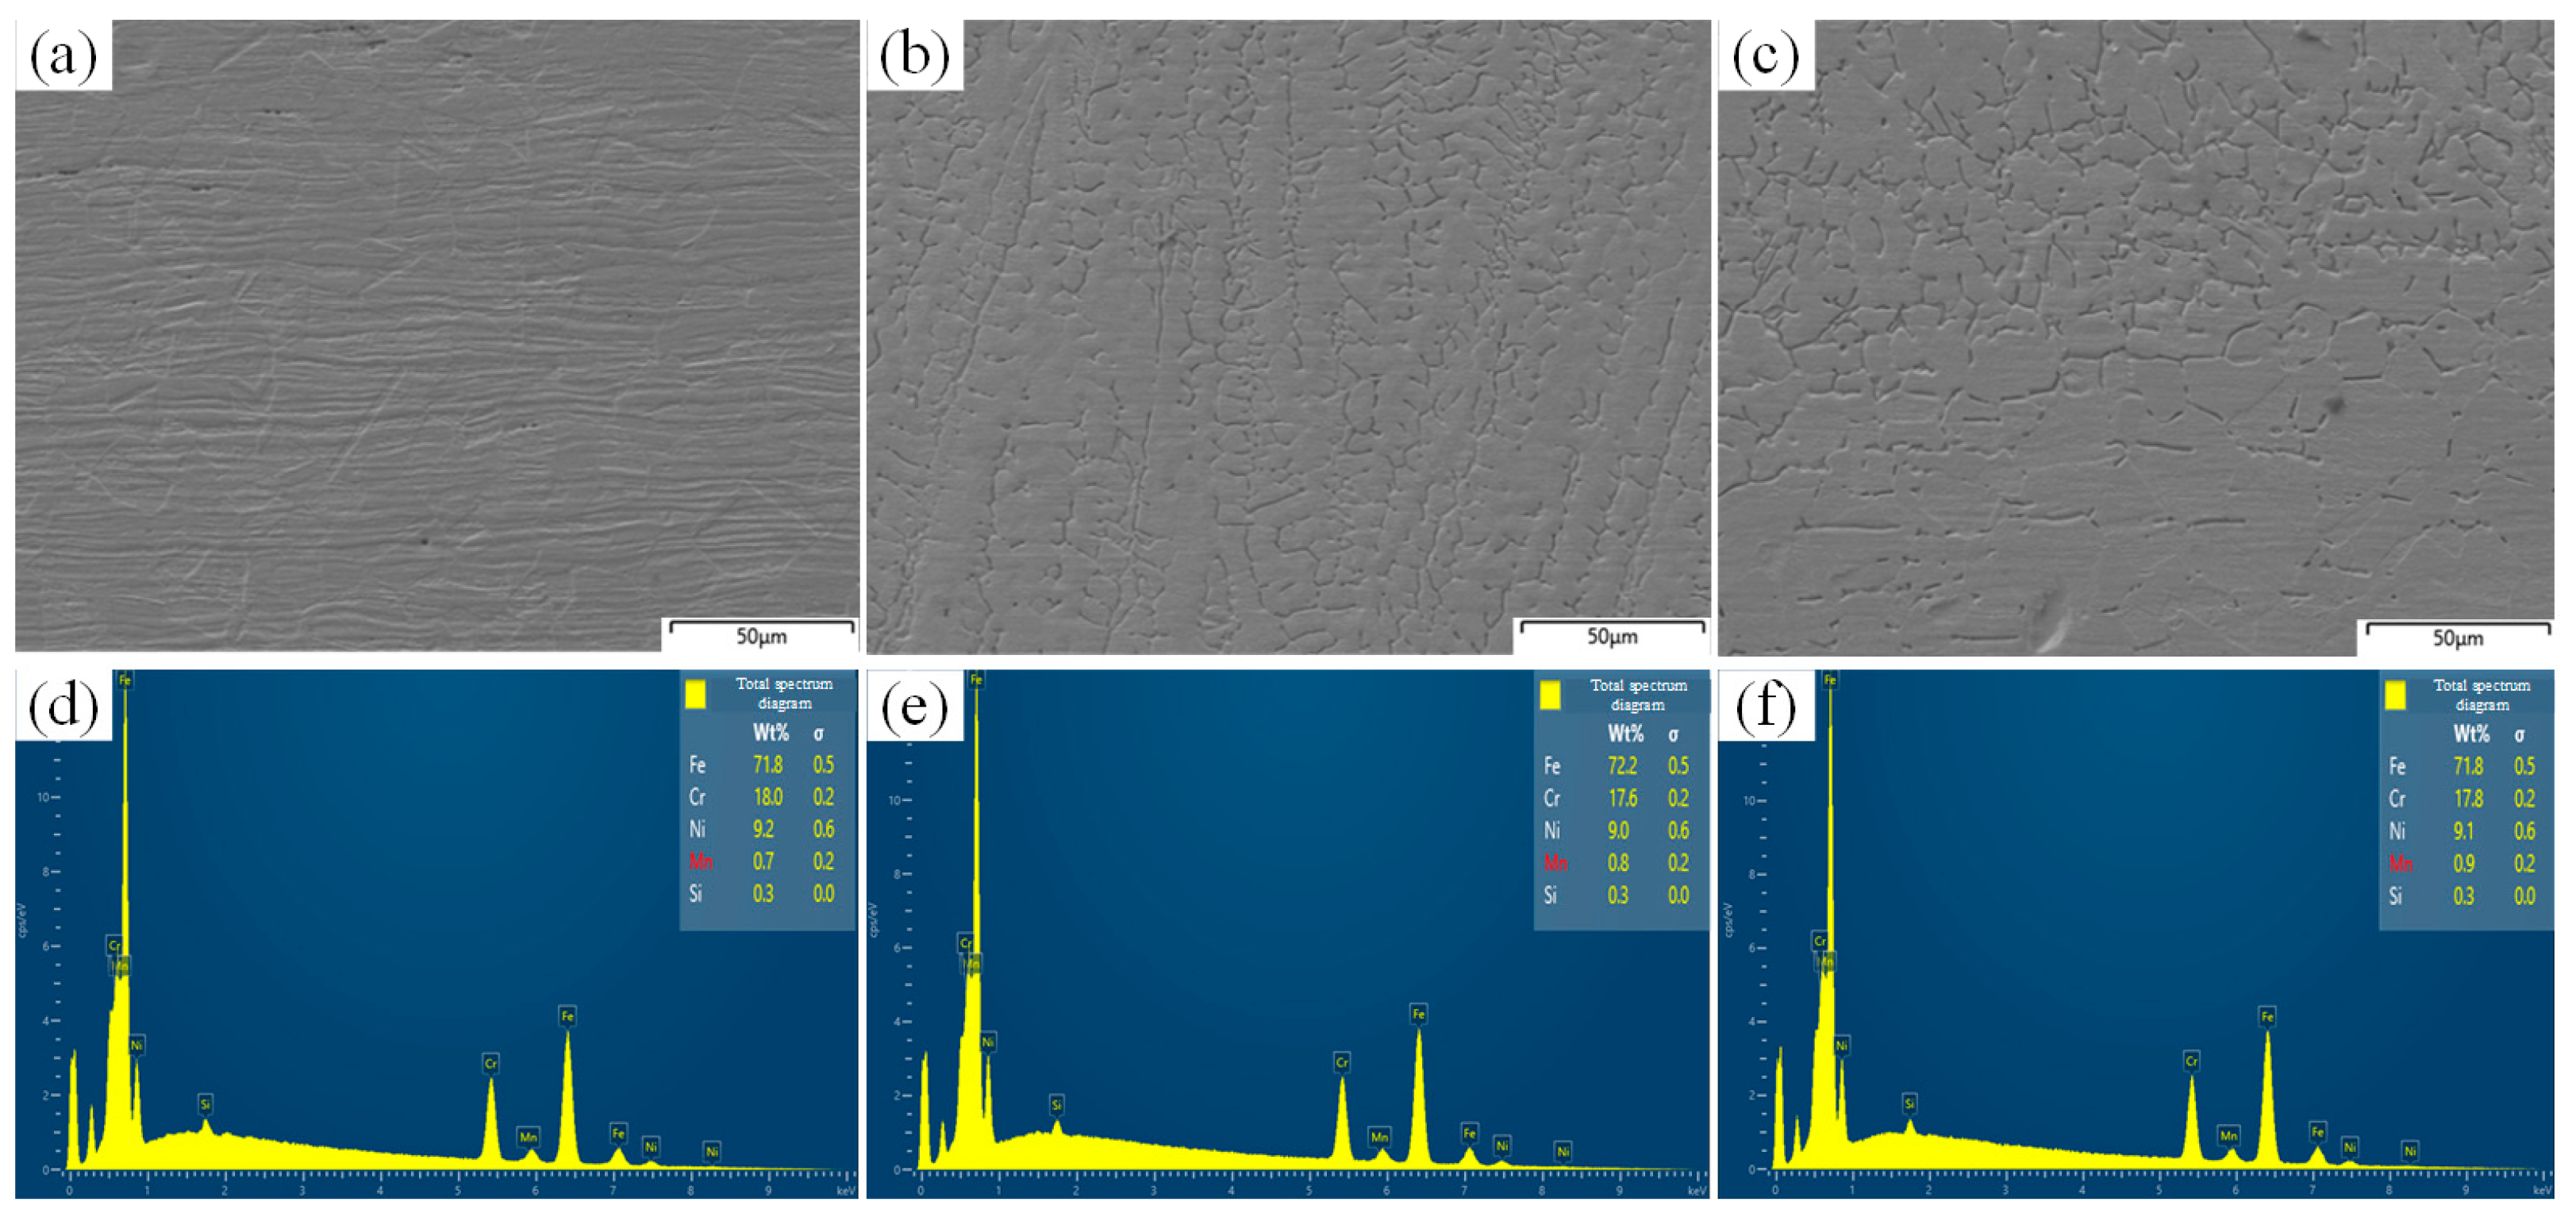
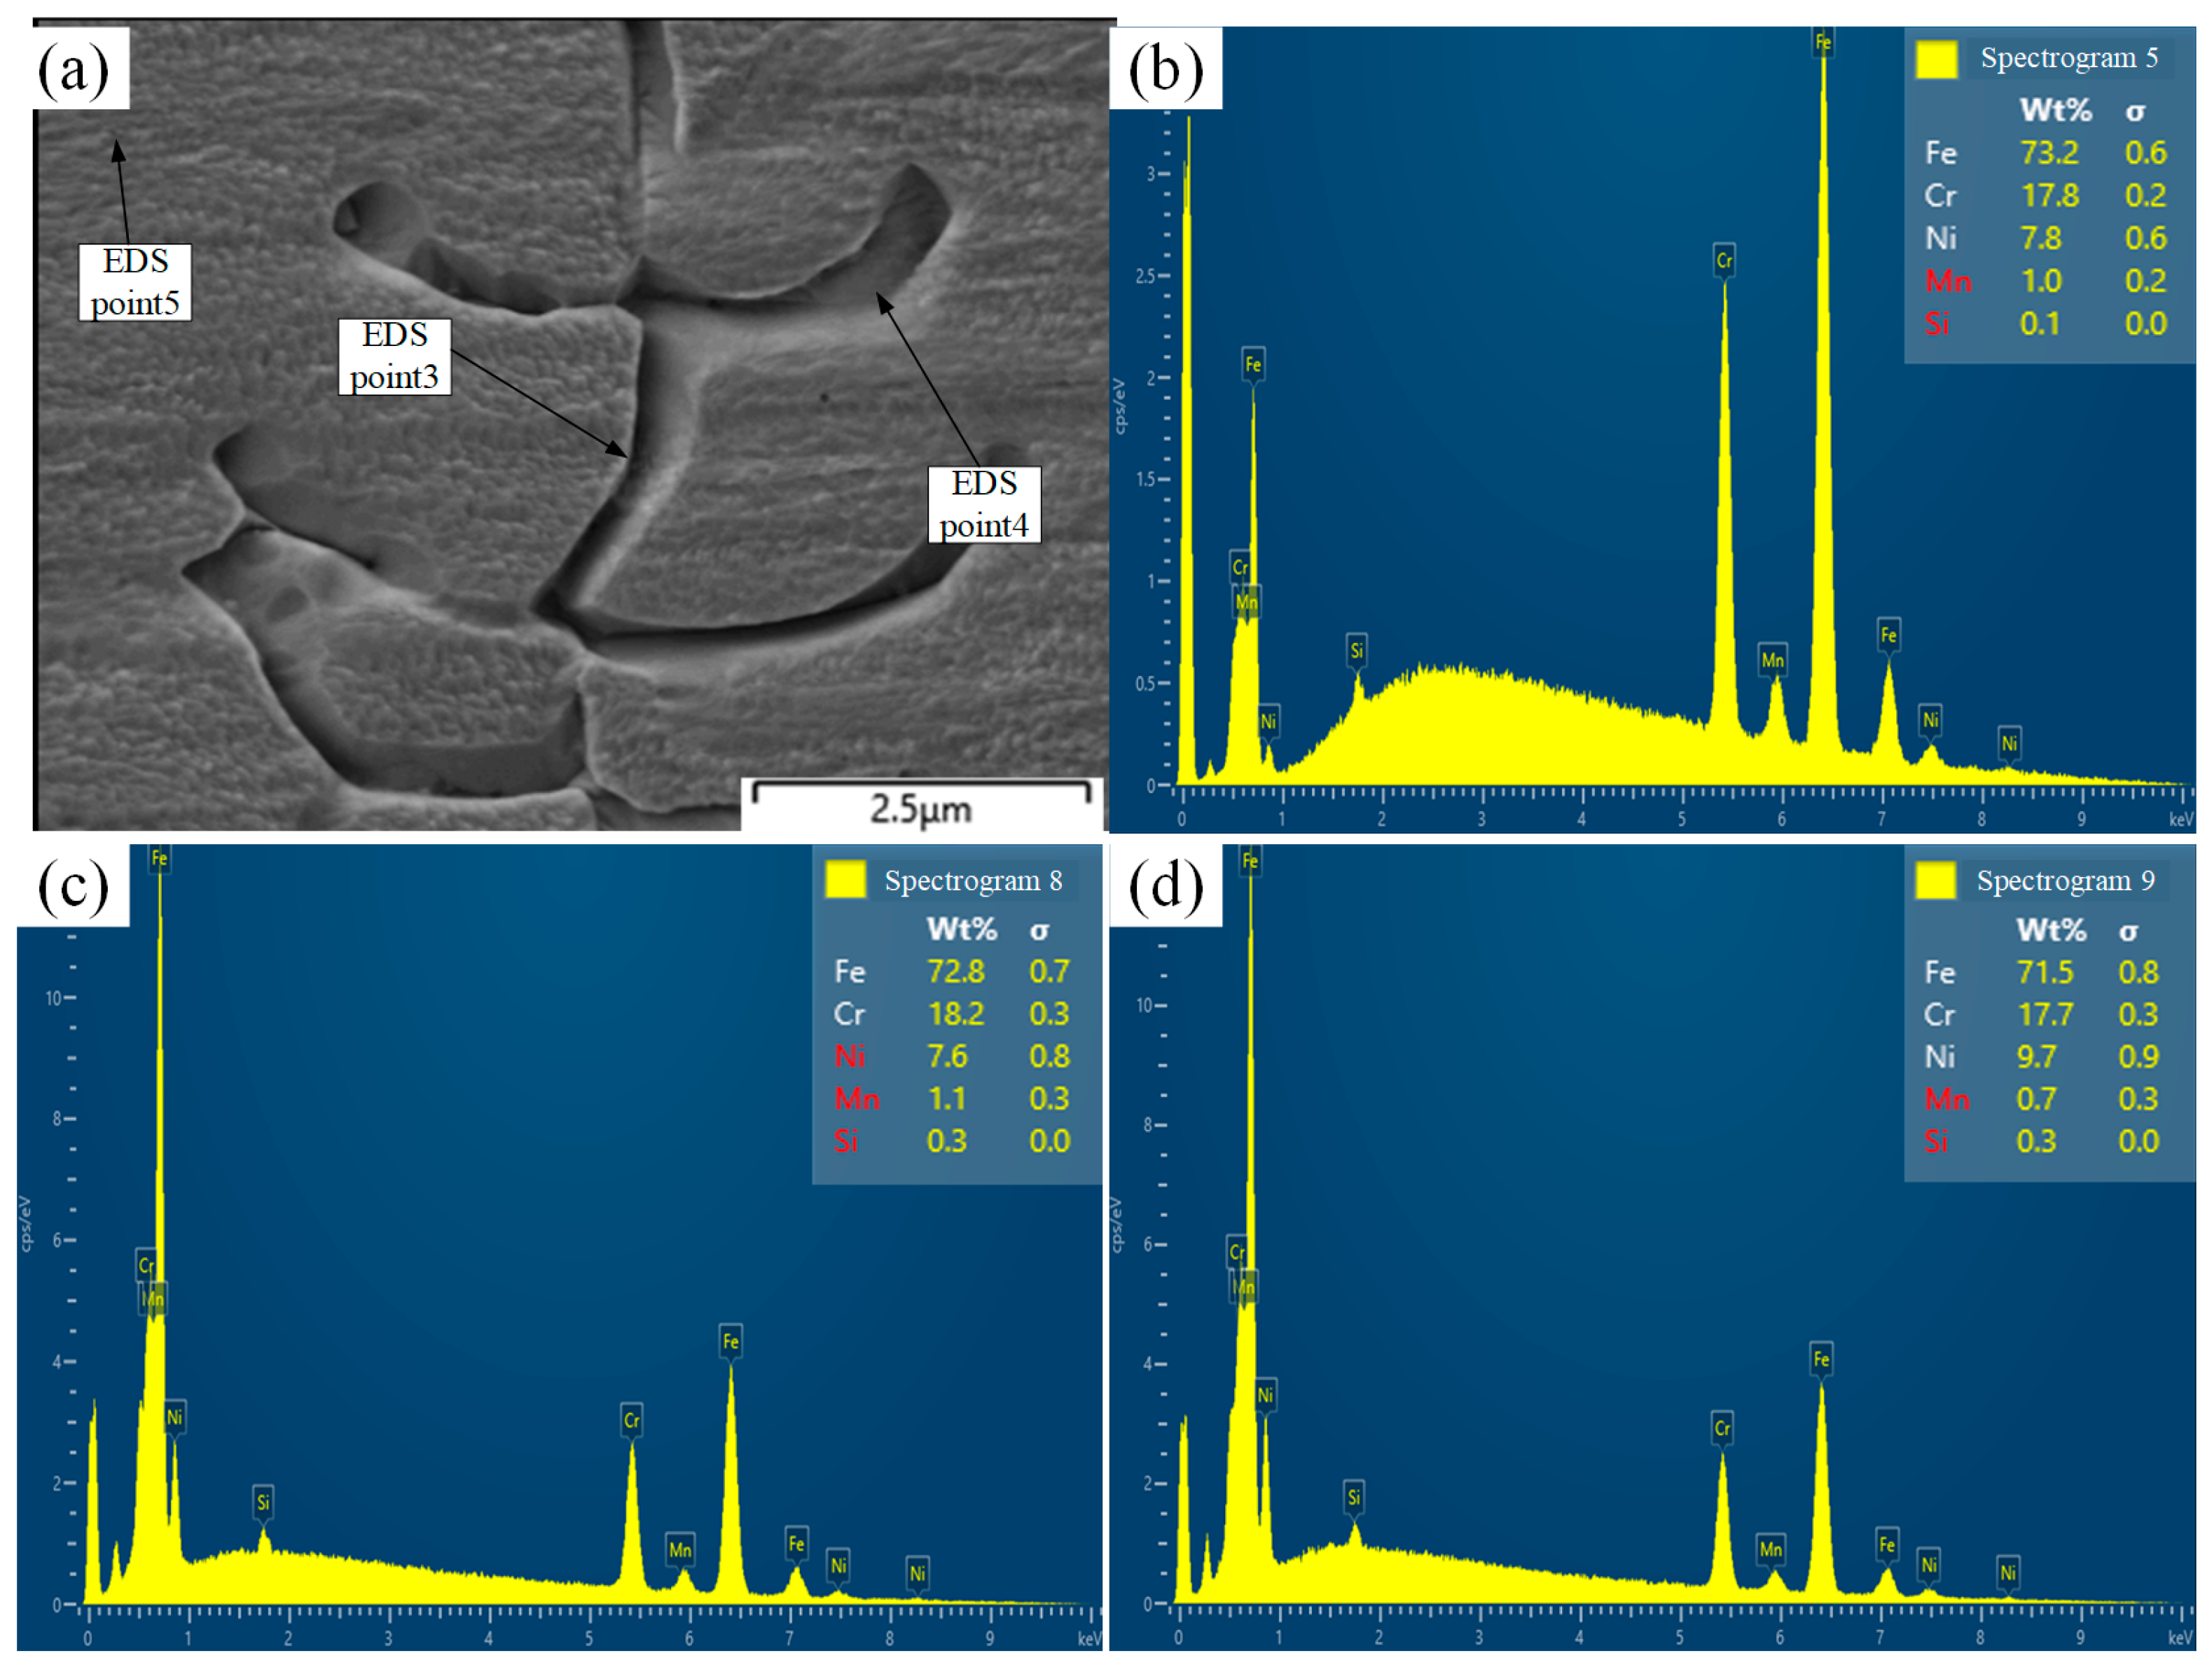
3.2.2. Phase Analyses and Element Distributions of Welded Joints

To further determine the phase composition of a 304L stainless steel lapped joint and to explore the phase structures of different weld regions, XRD analyses were conducted for the BM and weld zones of a welded joint. The welding parameters of the selected joints are shown in Table 2. XRD patterns for the 304L austenitic stainless steel base material and welding zones measured at diffraction angles of 30–100° are shown in Figure 15a,b, respectively. The results indicated that a single austenite phase existed in the base material, while the weld zone was composed of austenite and ferrite. The intensity of the austenite diffraction peak was higher than that of the ferrite diffraction peak, which indicates that phase transformation occurred during the welding solidification process. Due to the cooling of the weld metal, the transformation from δ (ferrite) to γ (austenite) occurred during the primary ferritic solidification process. This transition process was diffusion-controlled, but the higher cooling rate that was present during the welding did not provide enough time for the δ (ferrite) to complete the phase transition. Thus, ferrite remained on the austenite matrix in a wormlike or skeletal form. The austenite phase generally possesses higher toughness, ductility, and corrosion resistance, whereas the ferrite phase exhibits higher hardness and brittleness. The wormlike or skeletal distribution of the ferrite phase (Figure 16) in the weld can create stress concentration points, which may reduce the fatigue performance and impact resistance of the material and increase the risk of a brittle fracture. As a result, the tensile strength of the welded joint is lower than that of the base material, and the fracture occurs at the weld.
The comprehensive properties of welded materials are affected by many factors; among these, the microstructure and surface conditions are the key determinants. The morphology, size, and distribution of the microstructure are shaped by the chemical composition of the material itself and the thermal cycling conditions experienced during the welding process. Rapid heating and cooling during welding can cause significant structural and compositional changes in the local areas of the weld. To understand these changes, a welded joint was observed and analyzed using both SEM and EDS.
The BM, weld, and fusion zones of a welded joint were analyzed using SEM and EDS. The welded joint under investigation was formed with good welding parameters—that is, the welding parameters used for test No. 7. The SEM and EDS results for each zone are presented in Figure 16, and the specific elemental compositions and contents are listed in Table 4. The SEM results in Figure 16a show that the microstructure of the base material was composed of austenite grains. The corresponding EDS spectra are provided in Figure 16d. The weld zone of the joint was primarily composed of austenite and skeletal ferrite, as shown in Figure 16b. Its corresponding EDS spectra are shown in Figure 16e. The fusion region of the joint was mainly composed of wormlike ferrite and austenite, as shown in Figure 16c. Its corresponding EDS spectra are depicted in Figure 16f. These SEM results are consistent with those observed using a metallographic microscope, which indicates that the microstructure in each region was consistent. The EDS results further confirmed that the elemental composition and content in each region remained relatively stable during the welding process and that no significant element migration or transformation occurred.
It can be observed that the Cr content decreases slightly in the weld zone. This reduction in Cr may lead to the formation of undesirable chromium carbides at the grain boundaries, which can impair corrosion resistance and significantly affect tensile strength and toughness.
To thoroughly understand the specific effects of the welding process on the element distributions in the material, three micro-regions were selected for study: austenite grains, vermicular ferrite, and skeletal ferrite. Figure 17a shows that the austenite matrix surface in the weld zone had a uniform and fine texture. Compared with BM, an EDS analysis revealed that the nickel content in the austenitic matrix increased, while the chromium content decreased. The results showed that the elemental distribution changed somewhat during the welding process. Figure 18a presents an image of the vermicular ferrite, which surface exhibited obvious uneven features. An EDS analysis of the depressions and protrusions demonstrated that the chromium content in the depressions was higher than that in the protrusions, while the nickel content was significantly lower. In contrast, the protrusions had a nickel content that was slightly increased and an elemental composition that was more similar to that of the austenite matrix.
Figure 19a presents a SEM image of the skeleton-like ferrite in the weld zone. The skeleton-like ferrite had a more regular shape than the vermicular ferrite, and its element variation trend was similar to that of the vermicular ferrite. The dendrite phase was primarily composed of austenite (which is rich in nickel), while the inter-dendrite phase was mainly composed of δ-ferrite (which is rich in chromium). The elemental compositions and contents of the local micro-region test points for the vermicular and skeletal ferrite are listed in Table 5.

3.3. Mechanical Properties of Welded Joints

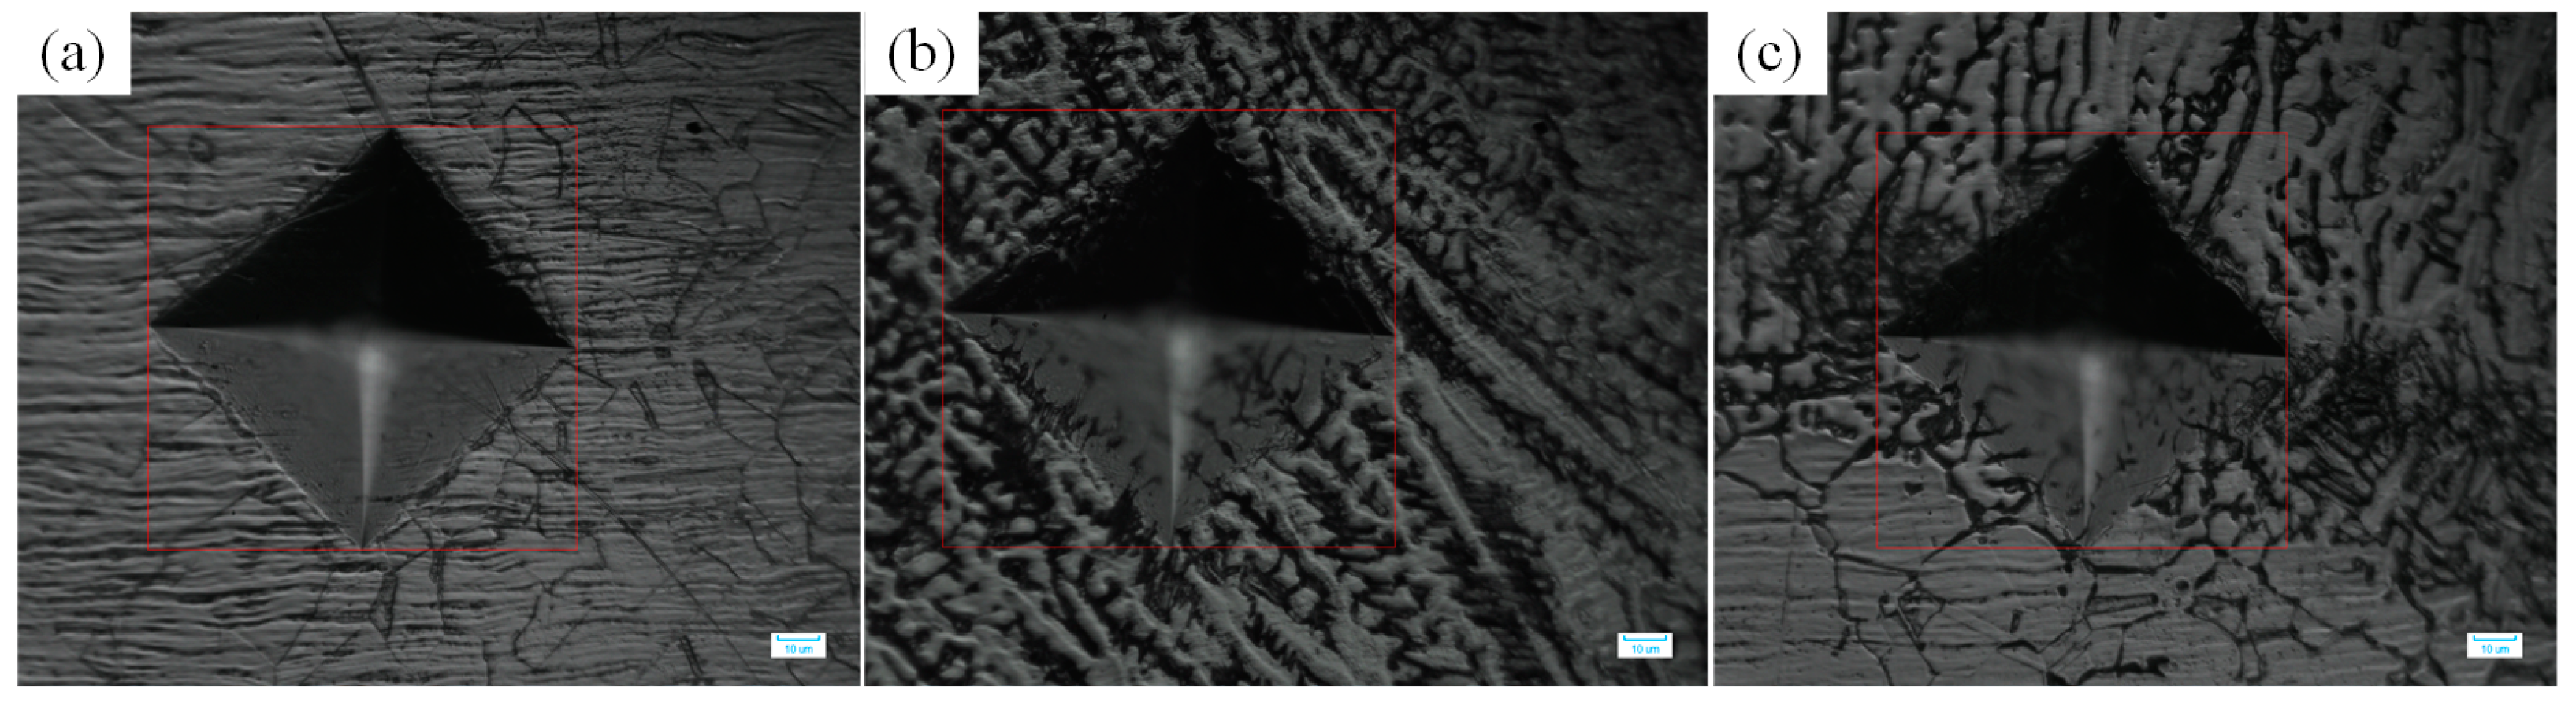
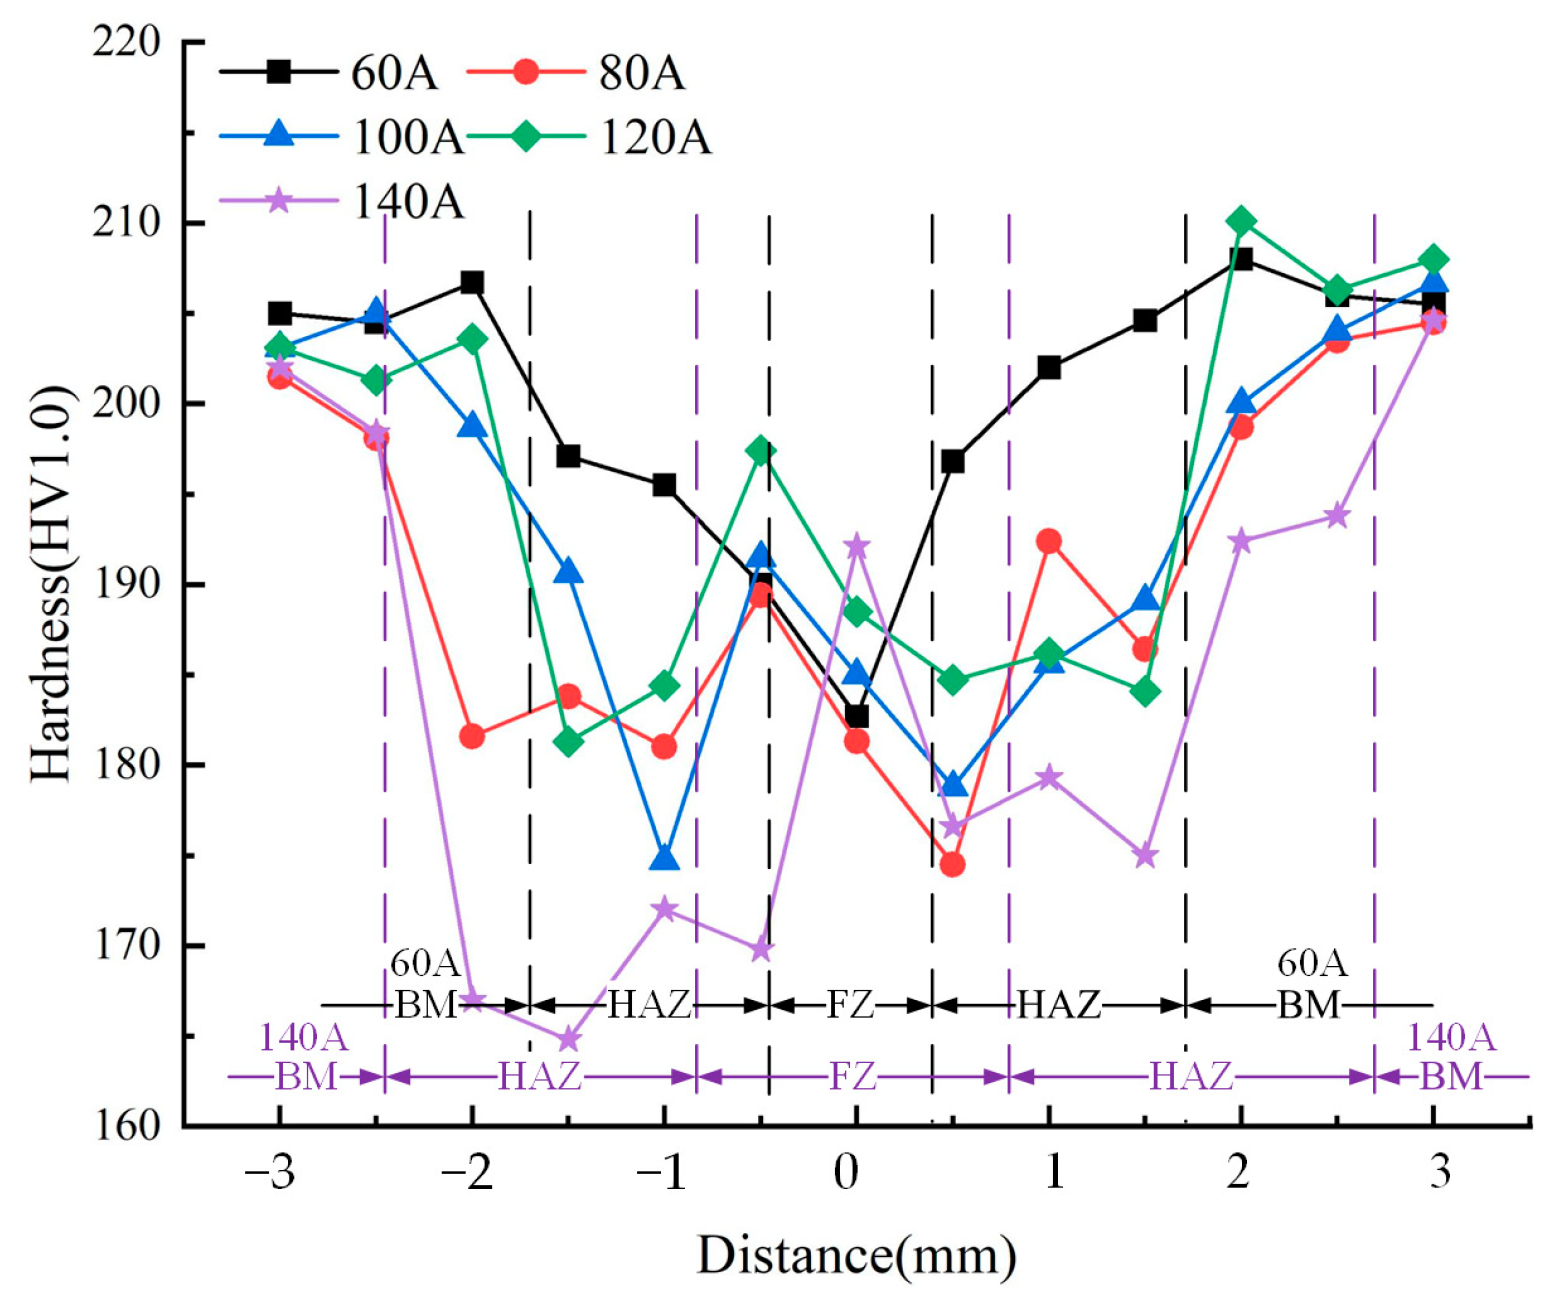
3.3.1. Microhardness

Microhardness testing evaluates a material’s resistance to deformation at the microscopic level, reflecting its strength, plasticity, and toughness. In this study, the Vickers hardness measurement method was used to test the microhardness values of welded joints. Figure 20 depicts the typical test indentation shapes for this study, and Figure 21 presents the microhardness test results for welded joints formed under different peak currents.
The results indicated that the hardness was the greatest in the base material zone, averaging 204.5 HV, while the weld zone had lower hardness. This phenomenon may be due to the welding thermal cycling process, which can cause grain growth. Larger grain sizes indicate a reduction in the number of grain boundaries, which are crucial for hindering the dislocation motion; therefore, fewer grain boundaries result in decreased material hardness.
As the peak current increased, both the penetration depth and the weld width increased, resulting in more test points in the weld zone and the heat-affected zone. When the peak current was 60 A, the average microhardness was 200.3 HV, with the weld zone hardness at 182.7 HV, indicating less thermal cycling and less pronounced grain growth. However, when the current was increased to 140 A, the average microhardness decreased to 183.6 HV, with a larger area of low hardness.
Notably, as the current increased, some test points with higher hardness values began to appear in the center area of the weld. This was primarily due to small, densely distributed vermicular δ-ferrite in the austenite matrix, which strengthened the material and improved its microhardness. In a related study, Shakil et al. [21] found that the hardness near the 304L stainless steel base material did not decrease during electron beam welding of the dissimilar 690 and 304L stainless steel alloys. When studying the mechanical properties and microstructure of a TGAW joint that combined the dissimilar 800ht chromium alloy and 304L austenitic stainless steel materials, Rogalski et al. [22] observed that the hardness in the HAZ near the 304L stainless steel material decreased. This result was caused by a transformation of the structure to ferrite. In the current study, a hardness reduction in the HAZ was also observed when the heat input was high.

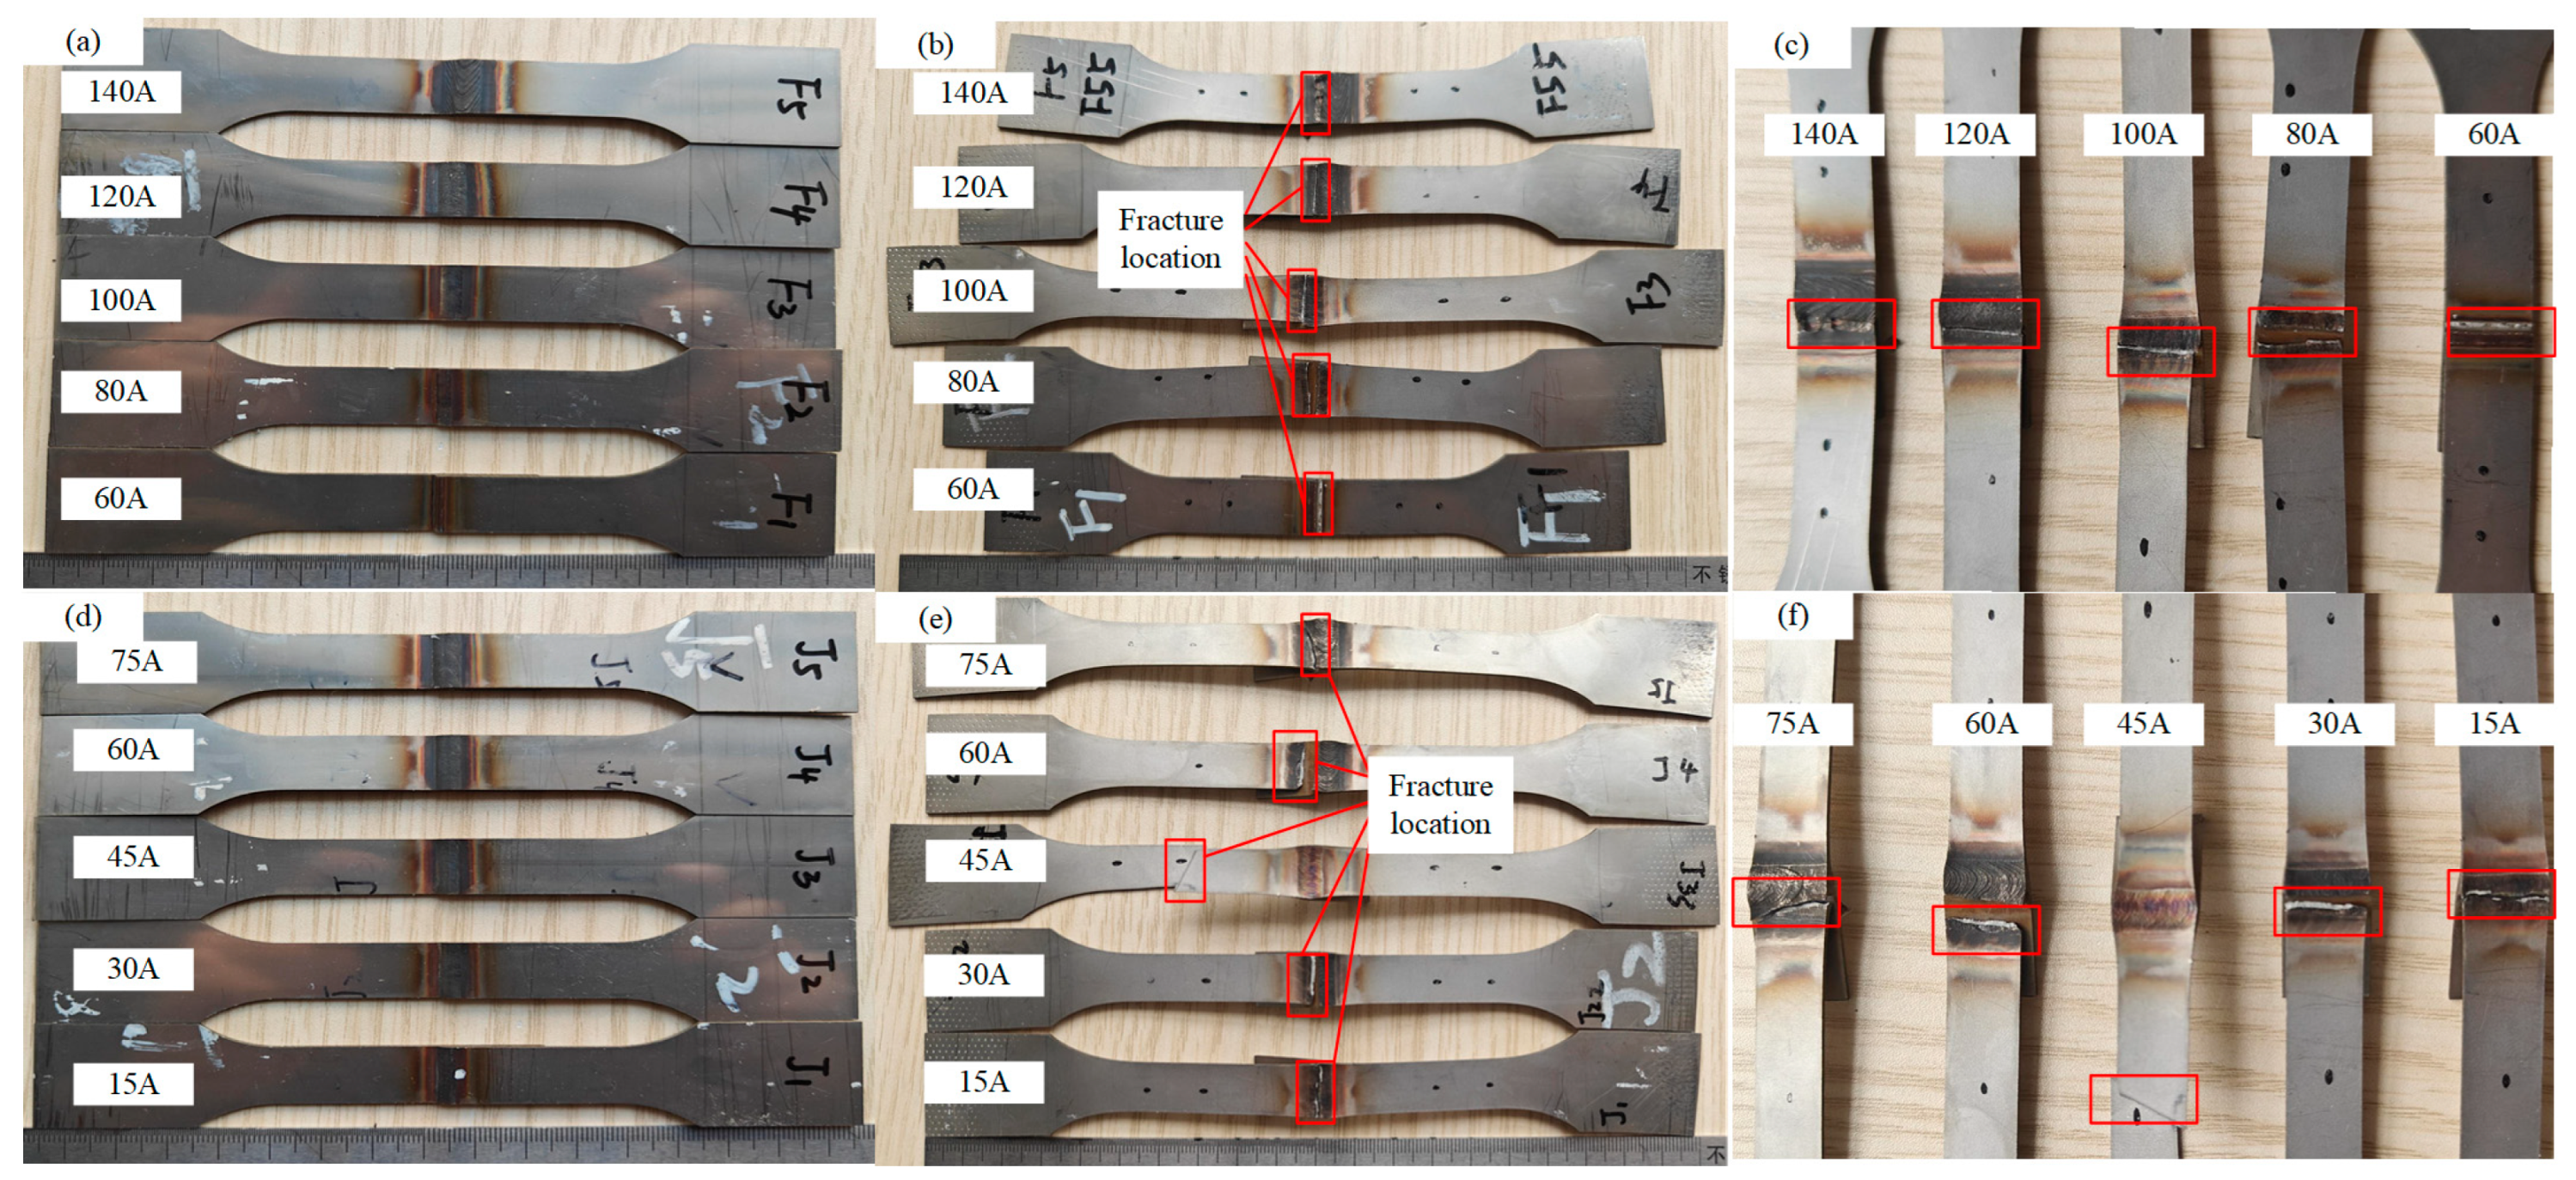
3.3.2. Tensile Properties

The tensile properties of a welded joint, including the yield strength, the tensile strength, the elongation at breakage, and the fracture mode, are crucial indicators of the joint quality. Ductile fractures suggest a good welding quality, while brittle fractures may indicate defects. The tensile properties of welded joints are affected by factors such as the type of welding material, the welding process parameters, the microstructure, and the subsequent heat treatment process.
Figure 22 shows the macroscopic morphologies of some welded joints before and after tensile testing. Figure 22b shows that, when the peak current was in the 60–140 A range, fractures occurred in all the joints at the weld location due to the stress concentrations and the coarse austenite grains, which caused deteriorations in the joint performance. Although the fracture locations were all at the weld, the specimen’s elongation varied significantly, affecting the maximum tensile force, which correlates with the macroscopic formation and microstructure. Figure 22e and Figure 23 indicate that the tensile fracture locations were different for different background currents. When the background current was 45 A, the sample broke in the BM zone, indicating excellent quality. As the background current increased, the welding heat input increased, there was better fusion between the upper and lower plates, and the quality of the weld formation was improved. However, excessive heat input caused defects, affecting the tensile properties of the joint.
For duty cycles of 42, 52, and 62%, the welded joint broke at the BM zone rather than at the weld or the heat-affected zone. This fracture mode had an obvious feature—that is, the fracture direction was approximately 45° from the direction of the applied tensile load. This result is consistent with the fracture characteristics of the material, which cause the fracture to occur in the direction of the maximum shear stress. For duty cycles of 32 and 72%, the fracture occurred at the weld position. Figure 23 shows that, when the duty cycle was 72%, the maximum tensile force was 8.63 kN, which was significantly smaller than the values for the other samples in the same group. This result occurred because an excessive heat input produced defects in the weld, which directly affected the tensile properties of the sample.
Figure 23 shows that there was a strong correlation between R and the maximum tensile force, Fm, which indicates that R was the primary factor that determined the maximum tensile force of the lap joint. Observations of the maximum tensile force and the length after breakage demonstrated that these two parameters were strongly correlated. Combining Figure 7 with the effect of heat input on joint formation, it was therefore concluded that the tensile properties of welded joints are primarily related to the welding heat input and the weld formation.
Figure 24 depicts the fracture morphologies of test joints No. 2 and No. 4, formed under peak currents of 80 and 120 A, respectively. Fractures occurred at the weld position, consistent with Figure 22d. The fractures, shown in Figure 24c,d,g,h, exhibited dimples and tearing edges, indicating good plasticity and typical ductile fractures. Inclusions and second-phase particles, visible in the dimples, were linked to crack formation and expansion, significantly affecting the weld’s mechanical properties [23]. Inclusions and second-phase particles significantly affect the mechanical properties of welds. When tensile stresses are applied, these particles separate from the matrix metal, forming tiny cracks. As loading continues, these cracks expand and form fracture holes, eventually leading to failure.

4. Conclusions

This paper discussed the effects of the welding parameters on the weld formation, microstructure, and mechanical properties of a 304L stainless steel lap joint for a LNG cargo tank. The study produced three primary conclusions:
(1)
Under different combinations of welding parameter values, 304L stainless steel welds with good appearance, and no defects can be formed.
(2)
The degree of fusion in the weld joint improves, and certain weld feature sizes (D, La, and P) increase as the heat input increases, while changes in another feature size (R) fluctuate within a small range. However, excessive heat input can lead to issues such as craters and undercutting, which can affect the quality of the joint.
(3)
The structure of a welded joint is different for different amounts of heat input, and the microhardness of the HAZ is smaller than the FZ and BM. As the welding heat input increases, the average hardness of the welded joint decreases.
(4)
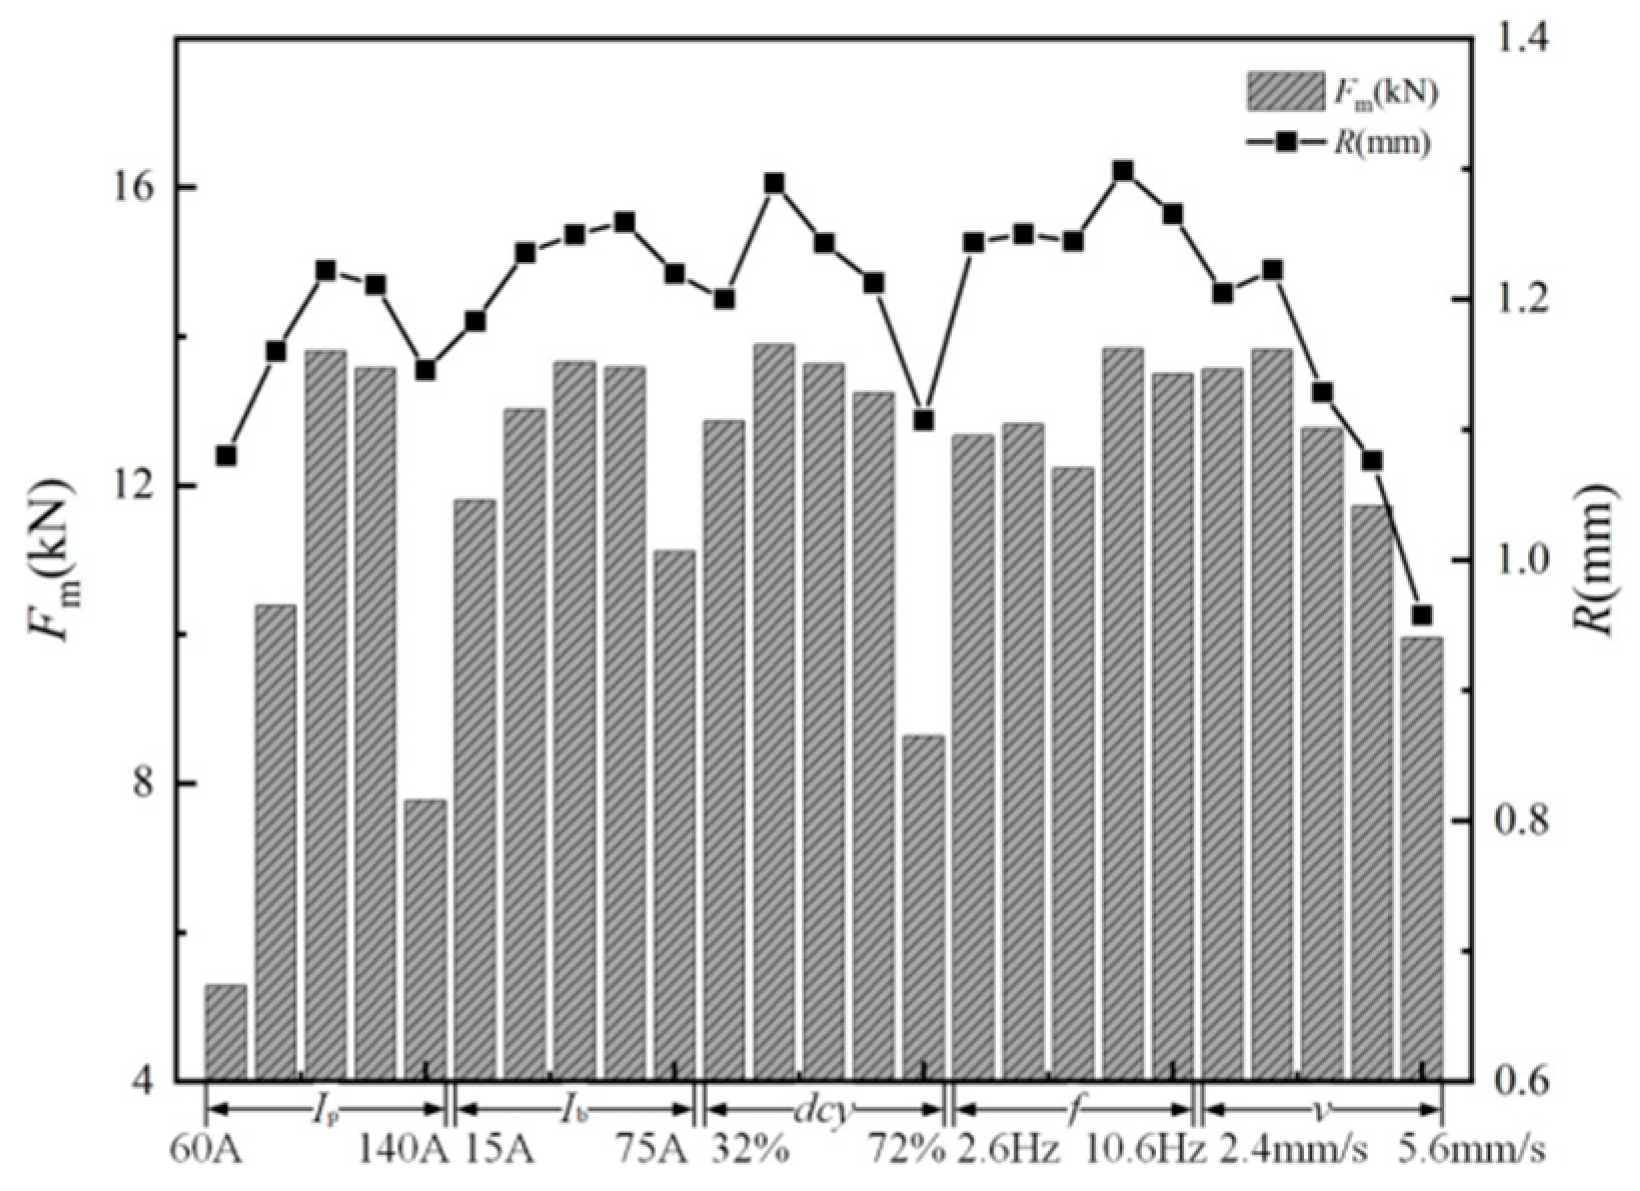
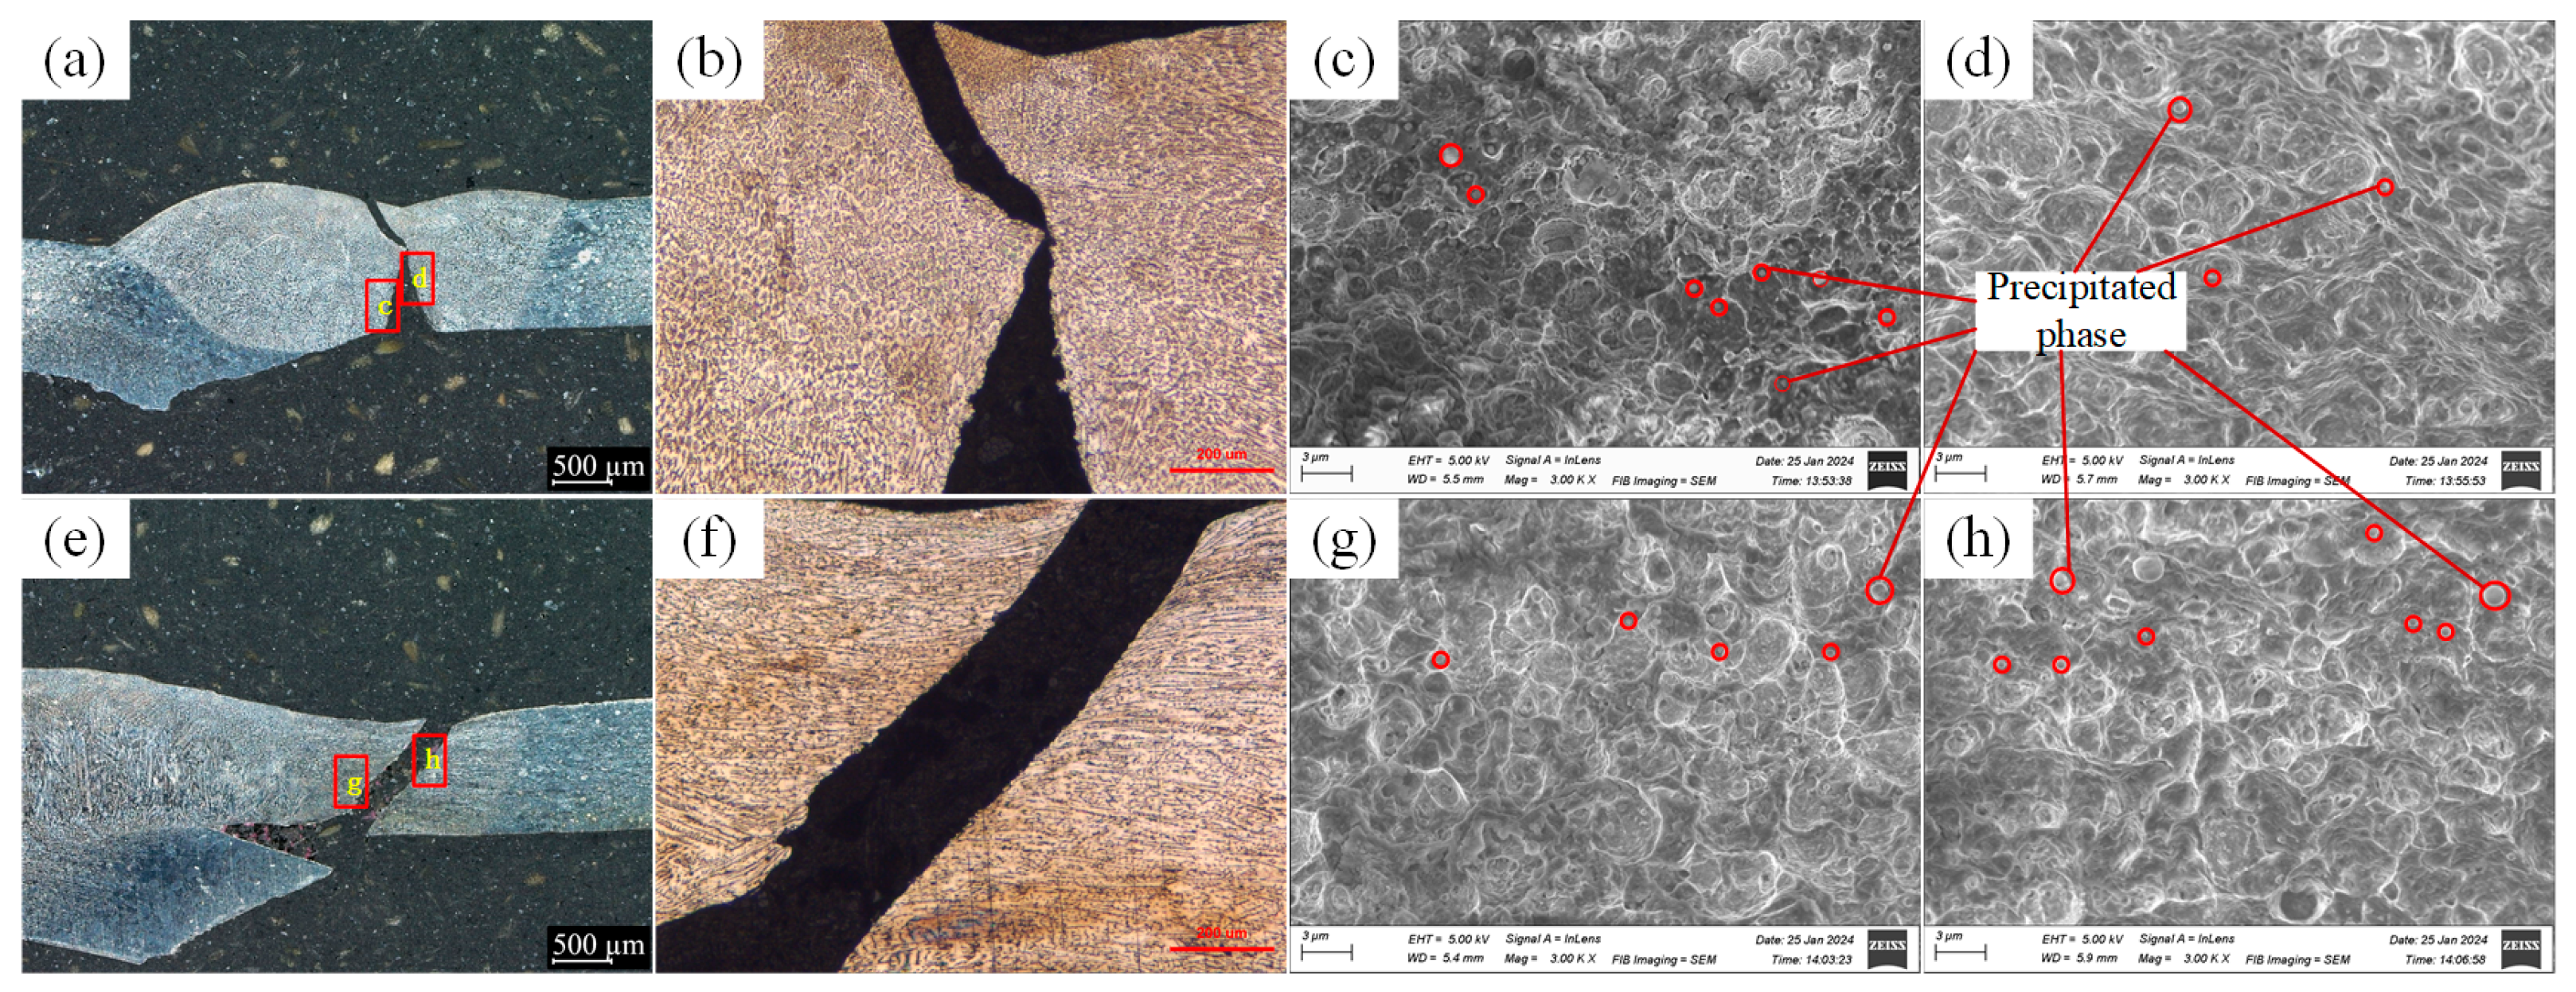
The tensile strength initially increases and then decreases as the heat input rises. The maximum tensile force in a welded joint is positively correlated with the characteristic size, R. The fracture surface exhibits typical ductile fracture characteristics.
(5)
No obvious welding defects, precipitation, phase changes, or element migration are present throughout the welding process.
(6)
The influences of various welding parameters on the forming quality, characteristic size, microstructure, and mechanical properties of the 304L stainless steel lapping joint used in the film chamber were studied.

Author Contributions

All authors contributed to the study conception and design. Material preparation, data collection, and analysis were performed by J.W. and C.Z. Q.H. and C.H. are responsible for the visualization of the data. The first draft of the manuscript was written by Y.J., and all authors commented on previous versions of the manuscript. All authors have read and agreed to the published version of the manuscript.

Funding

This work was supported by the Natural Science Foundation of China (No. 51675233).

Data Availability Statement

The data presented in this study are available on request from the corresponding author (Some of the data will be used by the authors for further research.).

Acknowledgments

We thank Jing Li for its linguistic assistance during the preparation of this manuscript.

Conflicts of Interest

The authors declare no competing interests.

References

  1. Zhang, N.; Lior, N. A novel near-zero CO2 emission thermal cycle with LNG cryogenic exergy utilization. Energy 2006, 31, 1666–1679. [Google Scholar] [CrossRef]
  2. Lee, D.H.; Ha, M.K.; Kim, S.Y.; Shin, S.C. Research of design challenges and new technologies for floating LNG. Int. J. Nav. Archit. Ocean. Eng. 2014, 6, 307–322. [Google Scholar] [CrossRef]
  3. Wang, J.; Xiong, J.; Peng, Q.; Fan, H.; Wang, Y.; Li, G.; Shen, B. Effects of DC plasma nitriding parameters on microstructure and properties of 304L stainless steel. Mater. Charact. 2009, 60, 197–203. [Google Scholar] [CrossRef]
  4. Karcı, F.; Kacar, R.; Gündüz, S. The effect of process parameter on the properties of spot welded cold deformed AISI304 grade austenitic stainless steel. J. Mater. Process. Technol. 2009, 209, 4011–4019. [Google Scholar] [CrossRef]
  5. Kumar, S.; Shahi, A.S. On the influence of welding stainless steel on microstructural development and mechanical performance. Mater. Manuf. Process. 2014, 29, 894–902. [Google Scholar] [CrossRef]
  6. Wang, H.; Hu, S.; Shen, J.; Li, D.; Lu, J. Effect of duty cycle on microstructure and mechanical properties of pulsed GTAW lap joint of Invar. J. Mater. Process. Technol. 2017, 243, 481–488. [Google Scholar] [CrossRef]
  7. Arivarasu, M.; Ramkumar Kasinath, D.; Natarajan, A. Effect of continuous and pulsed current on the metallurgical and mechanical properties of gas tungsten arc welded AISI 4340 aeronautical and AISI 304 L austenitic stainless steel dissimilar joints. Mater. Res. 2015, 18, 59–77. [Google Scholar] [CrossRef]
  8. Mohandas, T.; Madhusudhan, R.G. A comparison of continuous and pulse current gas tungsten arc welds of an ultra high strength steel. J. Mater. Process. Technol. 1997, 69, 222–226. [Google Scholar] [CrossRef]
  9. Saluja, R.; Moeed, K. Effects of process parameters and alloying elements on micro-hardness distributi- on in pulse arc 304l austenitic stainless steel welded plates. J. Eng. Sci. Technol. 2019, 14, 2271–2291. [Google Scholar]
  10. Kumar, S.; Vimal, K.E.K.; Khan, M.A.; Kumar, Y. A hybrid learning approach for modelling the fabrication of super duplex stainless steel thin joints using GTAW process. Int. J. Interact. Des. Manuf. 2023, 18, 3001–3014. [Google Scholar] [CrossRef]
  11. Wang, Q.; Shen, J.; Hu, S.; Zhao, G.; Zhou, J. Microstructure and Mechanical Properties of Fe-36Ni and 304L Dissimilar Alloy Lap Joints by Pulsed Gas Tungsten Arc Welding. Materials 2020, 13, 4016. [Google Scholar] [CrossRef] [PubMed]
  12. Lee, H.; Ji, C.; Yu, J. Effects of welding current and torch position parameters on bead geometry in cold metal transfer welding. J. Mech. Sci. Technol. 2018, 32, 4335–4343. [Google Scholar] [CrossRef]
  13. Salgado Lopez, J.M.; López Monroy, F.; Ojeda Elizarráraz, J.L.; Preud homme, M. Microstructure and mechanical properties of AISI 439 ferritic stainless steel welds without filler metal. Acta Univ. 2019, 29, 1–12. [Google Scholar] [CrossRef]
  14. Jawad, M.; Jahanzaib, M.; Ilyas, M. Evaluation of welded joints of dissimilar titanium alloy Ti-5Al-2.5 Sn and stainless-steel 304 at different multi-interlayer modes. Mater. Res. Express 2022, 9, 106501. [Google Scholar] [CrossRef]
  15. GB/T 26957-2022; Destructive Testing of Metal Materials—Tensile Test Methods for Cruciform and Lap Joints. Standardization Administration of China: Beijing, China, 2022.
  16. Lippold, J.C. Welding Metallurgy and Weldability; John Wiley & Sons: Hoboken, NJ, USA, 2014. [Google Scholar]
  17. Lippold, J.C.; Kotecki, D.J. Welding Metallurgy and Weldability of Stainless Steels; China Machine Press: Beijing, China, 2008. [Google Scholar]
  18. Vashishtha, H.; Taiwade, R.V.; Sharma, S. Effect of electrodes and post weld solution annealing treatment on microstructures, mechanical properties and corrosion resistance of dissimilar high nitrogen austenitic and conventional austenitic stainless steel weldments. Mater. Trans. 2017, 58, 182–185. [Google Scholar] [CrossRef]
  19. Ramkumar, K.D.; Abraham, W.S.; Viyash, V.; Arivazhagan, N.; Rabel, A.M. Investigations on the microstructure, tensile strength and high temperature corrosion behavior of Inconel 625 and Inconel 718 dissimilar joints. J. Manuf. Process. 2017, 25, 306–322. [Google Scholar] [CrossRef]
  20. Khan, S.A.; Ziya, A.B.; Ibrahim, A.; Atiq, S.; Ahmad, N.; Bashir, F. The enhanced range of temperature for coefficient of low thermal expansion, electrical and thermal conductivities of Cu substituted Fe–Ni invar alloys. Phys. Scr. 2016, 91, 035701. [Google Scholar] [CrossRef]
  21. Shakil, M.; Ahmad, M.; Tariq, N.H.; Hasan, B.A.; Akhter, J.I.; Ahmed, E.; Mehmood, M.; Choudhry, M.A.; Iqbal, M. Microstructure and hardness studies of electron beam welded Inconel 625 and stainless steel 304L. Vacuum 2014, 110, 121–126. [Google Scholar] [CrossRef]
  22. Rogalski, G.; Świerczyńska, A.; Landowski, M.; Fydrych, D. Mechanical and microstructural characterization of TIG welded dissimilar joints between 304l austenitic stainless steel and incoloy 800HT nickel alloy. Metals 2020, 10, 559. [Google Scholar] [CrossRef]
  23. Chen, X. Evolution of the Second-Phase Particles and Their Effect on Tensile Fracture Behavior of 2219 Al-xCu Alloys. Metals 2020, 10, 197. [Google Scholar] [CrossRef]
Figure 1. Welding lap and tungsten electrode orientations: (a) vertical welding direction and (b) along the welding direction.
Crystals 14 00715 g001
Figure 2. Schematic of a lap joint: (a) feature dimensions and (b) microhardness test point distribution.
Crystals 14 00715 g002
Figure 3. Schematics of the tensile specimens.
Crystals 14 00715 g003
Figure 4. Surface characteristics of the fronts (left), backs (middle), and joint profiles (right) of welds formed under different peak currents. Note: The scale bar represents 750 μm for (ac) and 1 mm for (d,e).
Crystals 14 00715 g004
Figure 5. Feature sizes for welding parameter variations: (a) peak current and (b) background current.
Crystals 14 00715 g005
Figure 6. Surface characteristics of the fronts (left), backs (middle), and joint profiles (right) of welds formed under different background currents. Note: The scale bar represents 750 μm for (ad) and 1 mm for (e).
Crystals 14 00715 g006
Figure 7. Surface characteristics of the fronts (left), backs (middle), and joint profiles (right) of welds formed under different duty cycles. Note: The scale bar represents 750 μm for (ac) and 1 mm for (d,e).
Crystals 14 00715 g007
Figure 8. Feature sizes for different welding parameter variations: (a) duty cycle, (b) pulse frequency, and (c) welding speed.
Crystals 14 00715 g008
Figure 9. Surface characteristics of the fronts (left), backs (middle), and joint profiles (right) of welds formed under different pulse frequencies. Note: The scale bar in the last column represents 750 μm.
Crystals 14 00715 g009
Figure 10. Surface characteristics of the fronts (left), backs (middle), and joint profiles (right) of welds formed under different welding speeds. Note: The scale bar represents 1 mm for (a) and 750 μm for (be).
Crystals 14 00715 g010
Figure 11. Metallographic structural diagram of a lap joint.
Crystals 14 00715 g011
Figure 12. Metallographic structures in the four characteristic regions of the lap joint: (a) BM, (b) FZ, (c) HAZ, and (d) PMZ.
Crystals 14 00715 g012
Figure 13. Metallographic structures of the four characteristic regions in lap joints formed under three different background currents: (a) BM at 30 A, (b) FZ at 30 A, (c) HAZ at 30 A, (d) PMZ at 30 A, (e) BM at 45 A, (f) FZ at 45 A, (g) HAZ at 45 A, (h) PMZ at 45 A, (i) BM at 60 A, (j) FZ at 60 A, (k) HAZ at 60 A, and (l) PMZ at 60 A. Note: The scale bar in the last column represents 50 μm.
Crystals 14 00715 g013
Figure 14. Metallographic structures of lower-plate and upper-plate fusion zones of welds formed under different background currents: (a) lower plate at 30 A, (b) lower plate at 45 A, (c) lower plate at 60 A, (d) upper plate at 30 A, (e) upper plate at 45 A, and (f) upper plate at 60 A. Note: The scale bar in the last column represents 200 μm.
Crystals 14 00715 g014
Figure 15. Diffraction spectra for a 304L stainless steel welded joint: (a) BM and (b) FZ.
Crystals 14 00715 g015
Figure 16. SEM and EDS analysis results for the base material, weld, and fusion zones of a welded joint: (a) SEM results for the BM zone, (b) SEM results for the weld zone, (c) SEM results for the fusion zone, (d) EDS results for the BM zone, (e) EDS results for the weld zone, and (f) EDS results for the fusion zone.
Crystals 14 00715 g016
Figure 17. SEM and EDS results for austenite grains in the weld zone: (a) high-magnification image of the austenite grains and (b) the corresponding EDS spectra.
Crystals 14 00715 g017
Figure 18. SEM and EDS results of vermicular ferrite in the weld zone: (a) high-magnification image of the vermicular ferrite, (b) EDS spectra for point 1, and (c) EDS spectra for point 2.
Crystals 14 00715 g018
Figure 19. SEM and EDS results for the skeletal ferrite in the weld zone: (a) high-magnification image of the skeletal ferrite, (b) EDS spectra for point 3, (c) EDS spectra for point 4, and (d) EDS spectra for point 5.
Crystals 14 00715 g019
Figure 20. Microhardness indentation shapes: (a) HAZ, (b) FZ, and (c) PMZ. Note: The scale bar in the last column represents 10 μm.
Crystals 14 00715 g020
Figure 21. Microhardness distributions for 304L stainless steel lap joints formed under different peak currents.
Crystals 14 00715 g021
Figure 22. Macroscopic features of the tensile samples (a) formed under different peak currents before testing, (b) samples formed under different peak currents after testing, (c) enlarged view of the fraction locations of different peak currents, (d) samples formed under different background currents before testing, (e) samples formed under different background currents after testing, and (f) enlarged view of the fraction locations of different background currents.
Crystals 14 00715 g022
Figure 23. Fm and R for the samples formed under different welding parameters.
Crystals 14 00715 g023
Figure 24. Weld fracture metallographic images and fracture morphologies: (a) fracture cross-section for joint No. 2, (b) high-magnification image of the fracture morphology of the left side of the fracture in joint No. 2, (c) high-magnification image of the fracture morphology of the right side of the fracture in joint No. 2, (d) fracture cross-section for joint No. 4, (e) high-magnification image of the fracture morphology of the left side of the fracture in joint No. 4, and (f) high-magnification image of the fracture morphology of the right side of the fracture in joint No. 4. Note: The scale bar represents 200 μm for (b,f) and 3 μm for (c,d,g,h).
Crystals 14 00715 g024
Table 1. Chemical composition of the 304L stainless steel used (wt.%).
Materials/ElementsCPSSiMnCrNiFe
304L0.020.0120.0020.480.9518.839.89Bal
Table 2. Welding parameters.
Test No.Peak Current (A)Background Current (A)Duty Cycle (%)Pulse Frequency (Hz)Welding Speed (mm/s)
1, 2, 3, 4, 560, 80, 100,
120, 140
25628.63.2
6, 7, 8, 9, 1010015, 30, 45,
60, 75
528.63.6
11, 12, 13, 14, 151154032, 42, 52,
62, 72
8.63.6
16, 17, 18, 19, 2011525522.6, 4.6, 6.6,
8.6, 10.6
3.6
21, 22, 23, 24, 2511515528.62.4, 3.2, 4,
4.8, 5.6
Table 3. GTT standard weld dimension requirements.
D (mm)La (mm)P (mm)R (mm)
3.5–6≥2.0≥0.4≥0.7
Table 4. Chemical compositions of the characteristic zones of a lap joint.
ZoneFe (wt.%)Cr (wt.%)Ni (wt.%)Mn (wt.%)Si (wt.%)
Base metal zone71.818.09.20.70.3
Weld zone72.217.69.00.80.3
Fusion zone71.817.89.10.90.3
Table 5. Chemical compositions of the local micro-region test points for the vermicular and skeletal ferrite.
Test PointTissueFe (wt.%)Cr (wt.%)Ni (wt.%)Mn (wt.%)Si (wt.%)
Point 1Vermicular ferrite73.619.45.90.80.2
Point 273.717.38.20.50.3
Point 3Skeletal ferrite73.217.87.81.00.1
Point 472.818.27.61.10.3
Point 571.517.79.70.70.3
Disclaimer/Publisher’s Note: The statements, opinions and data contained in all publications are solely those of the individual author(s) and contributor(s) and not of MDPI and/or the editor(s). MDPI and/or the editor(s) disclaim responsibility for any injury to people or property resulting from any ideas, methods, instructions or products referred to in the content.

