Abstract
During the ice flood period of the Yellow River, the fracture and destruction of river ice can easily lead to the formation of ice jams and ice dams in the curved and narrow reaches. However, the occurrence and development mechanism of river ice fracture remain incompletely understood in the Yellow River. Therefore, based on the three-point bending physical test of the Yellow River ice, a three-point bending fracture numerical model of the Yellow River ice was constructed. The fracture failure process of the Yellow River ice under three-point bending was simulated, and the effects of the crack-to-height ratio and ice grain size on the fracture properties of the river ice were analyzed. By comparing the results with those of physical tests on river ice, it is evident that the fracture model can effectively simulate the cracking process of river ice. Within the confines of the simulated sample size spectrum, as the crack-to-height ratio varies from 0.2 to 0.8, the fracture toughness value of the Yellow River ice spans a range from 115.01 to 143.37 KPa·m1/2. Correspondingly, within the simulated calculation values ranging from 5.38 mm to 24.07 mm for ice crystal size, the fracture toughness value of the Yellow River ice exhibits a range from 116.89 to 143.37 KPa·m1/2. The findings reveal that an increase in the crack-to-depth ratio leads to a decrement in the fracture toughness of river ice. Within the scale range encompassed by the model calculations, as the average size of the ice crystal grains augments, the fracture toughness of the river ice exhibits a gradual ascending trend. The research results provide a parameter basis for studying the fracture performance of the Yellow River ice using a numerical simulation method and lays a foundation for investigating the cracking process of river ice from macro and micro multi-scales.
1. Introduction
The ice disaster in the Yellow River is a complex physical process, affected by many factors such as hydraulics, thermodynamics, and river topography. Most ice disasters occur during the ice break-up period, which is a phenomenon that the ice cover melts and breaks in the frozen river, resulting in ice flow [1]. The ice blocks produced by the fracture and destruction of river ice flow downstream with the water and are prone to form ice jams and ice dams in curved and narrow river sections. This result further threatens the safety of the embankment, and even leads to the occurrence of ice flood disasters. Currently, the mechanism of ice break-up in the Yellow River during spring is not yet fully understood, and the physical and mechanical properties of the river ice fracture and failure process still need to be further explored.
Yellow River ice, characterized as a quasi-brittle and crystalline material, presents one of the most formidable challenges within the domain of river ice research. Investigations into matters pertaining to Yellow River ice can be retrospectively traced to the 1950s. Among these early contributions, Chen Zanting [2] provided a seminal overview of the observational theory concerning Yellow River ice. Subsequently, Sun Zhaochu, Sui Jueyi, and their colleagues [3,4,5], through meticulous observations of river ice during the ice-jam period in the Hequ section of the Yellow River, formulated the inaugural mathematical model that correlates ice jam thickness with ice flow volume and hydraulic conditions. Furthermore, Wang Jun and his team [6,7,8,9], based on rigorous flume experiments, deduced the intricate relationship between initial ice jam thickness and various factors, including flow conditions and ice discharge. In another noteworthy study, Gu Lihua [10], utilizing a multiple exponential regression model, discovered that the refined cumulative negative air temperature method can predict ice cover thickness with remarkable accuracy. Additionally, Gao Guoming et al. [11] devised calculations for sub-ice flow and conducted a thorough analysis of the variation patterns of sub-ice velocity.
With the relentless progression of technology, significant milestones have been achieved in the realms of Yellow River ice monitoring [12,13,14], ice forecasting [15,16,17], and ice disaster prevention and mitigation [18,19,20]. Moreover, a steady stream of outcomes pertaining to river ice reviews has emerged [21,22]. However, research delving into fundamental issues, such as the physical and mechanical properties of the fracture and failure processes of Yellow River ice, remains in its nascent stages, primarily hindered by the challenges associated with ice sample collection and experimental conditions. Given that alterations in the internal microstructure of river ice are pivotal factors that lead to its intricate macroscopic manifestations, an in-depth exploration of the internal microstructure and material properties of river ice is imperative to unravel the macroscopic fracture mechanical behavior of river ice break-up from its fundamental essence [23].
The fracture process of Yellow River ice is a multi-scale problem that combines macroscopic and microscopic perspectives. The study of the mechanism underlying the initiation and propagation of microscopic cracks within river ice will contribute to explaining its macroscopic fracture mechanical behavior [24]. However, due to multiple factors such as ice sample collection and experimental conditions, studying the fracture mechanical properties of Yellow River ice through physical experiments still faces objective limitations. On the other hand, numerical simulation methods combined with the mesoscopic mechanics theory have continuously produced research results in simulating and analyzing the fracture process of river ice [25,26,27].
The finite element method is one of the commonly employed calculation methods. For instance, Kendall put forward a novel crushing failure criterion grounded in fracture energy balance theory [28]. Evans et al. revealed the changing trends of crack location, crack propagation load, and spallation that occur during the fracture process [29]. Xiao et al. provided a damage calculation model specific to ice [30]. Han Lei et al. conducted a systematic analysis of the entire process of destruction in ice–cone interaction using Ansys and obtained the variation law of the ice force–deflection relationship curve with respect to failure modes [31].
Another frequently used calculation method is the discrete element method. Cundall previously introduced a discrete element model for damage and fracture [32]. Jirasek et al. simulated and analyzed the collision process between floating ice moving at varying speeds and rigid obstacles [33,34]. Korlie applied the principles of particle mechanics to analyze the generation, propagation, and fracture process of three-dimensional ice plate cracks under pressure [27].
Furthermore, Li Zhijun et al. performed numerical simulation analysis on the issue of sea ice fracture [35], Wang Jun et al. investigated the formation and evolution mechanism of ice jams [36], Yang Kailin and Fu Hui et al. delved into channel ice problems [37,38], and Mao Zeyu et al. studied the variation of water flow movement under ice cover [39]. These researchers have achieved notable outcomes in their respective fields. However, despite utilizing numerical simulation methods to explore the macroscopic cracking of river ice from a mesoscopic scale based on mesoscopic ice mechanics theory, the existing research results still require further enrichment.
For the basis of this study, the experimental data from the existing research results presented in reference [40] were utilized. Based on the parametric programming language of Ansys software 12.0 (ANSYS Parametric Design Language, APDL), a meso-scale numerical model of river ice was developed to simulate the three-point bending fracture of Yellow River ice. The model considers two influencing factors: crack to height ratio and grain size and simulates the three-point bending fracture process of river ice. The model construction mainly includes the establishment of the meso-structure of Yellow River ice, the determination of constitutive relation and failure criterion, and the selection of model parameters. The numerical model and calculation analysis results simulate and demonstrate the cracking process of river ice and provide a theoretical basis for grasping the fracture properties of Yellow River ice and revealing the fracture failure mechanism of Yellow River ice from a macro and meso multi-scale perspective.
2. Establishment of a Numerical Model for River Ice Fracture
With the aim of delving deeper into the influence of mesoscale crystal alterations on the macro-mechanical attributes of river ice, and surmounting the constraints imposed by physical testing environments, a mesoscale numerical simulation method was adopted to analyze the fracture process of river ice. At the mesoscale, Yellow River ice can be considered as consisting of ice crystals, ice crystal boundaries, and initial defects. The development of the mesoscale model for Yellow River ice mainly involves the generation of ice crystals and the formation of grain boundaries and initial defects, constitutive relationships, and failure criteria.
2.1. Generation of Ice Crystals
Taking into account the irregular nature of river ice crystals, the Voronoi polygon method is adopted to simulate the river ice grains. Based on the observational results obtained from the mesostructure experiments conducted on Yellow River ice [40] and by incorporating the characteristics of the Voronoi polygon method, the ice grains of the Yellow River were simulated. Ice crystal specimens were generated randomly, and their structure is depicted in Figure 1. Within this figure, Figure 1a is a typical sample image of the crystal structure of Yellow River ice, and Figure 1b is the numerical model diagram of the crystal structure of Yellow River ice.
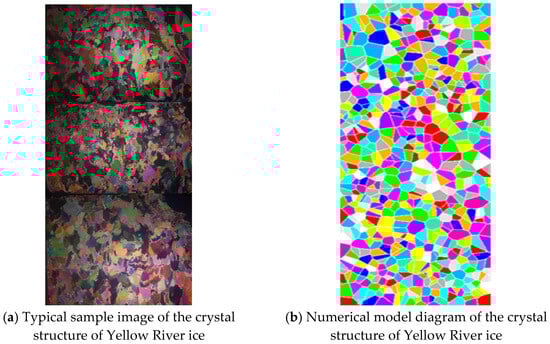
Figure 1.
Structure distribution figure of Yellow River ice grains.
2.2. Generation of Ice Grain Boundaries and Initial Defects
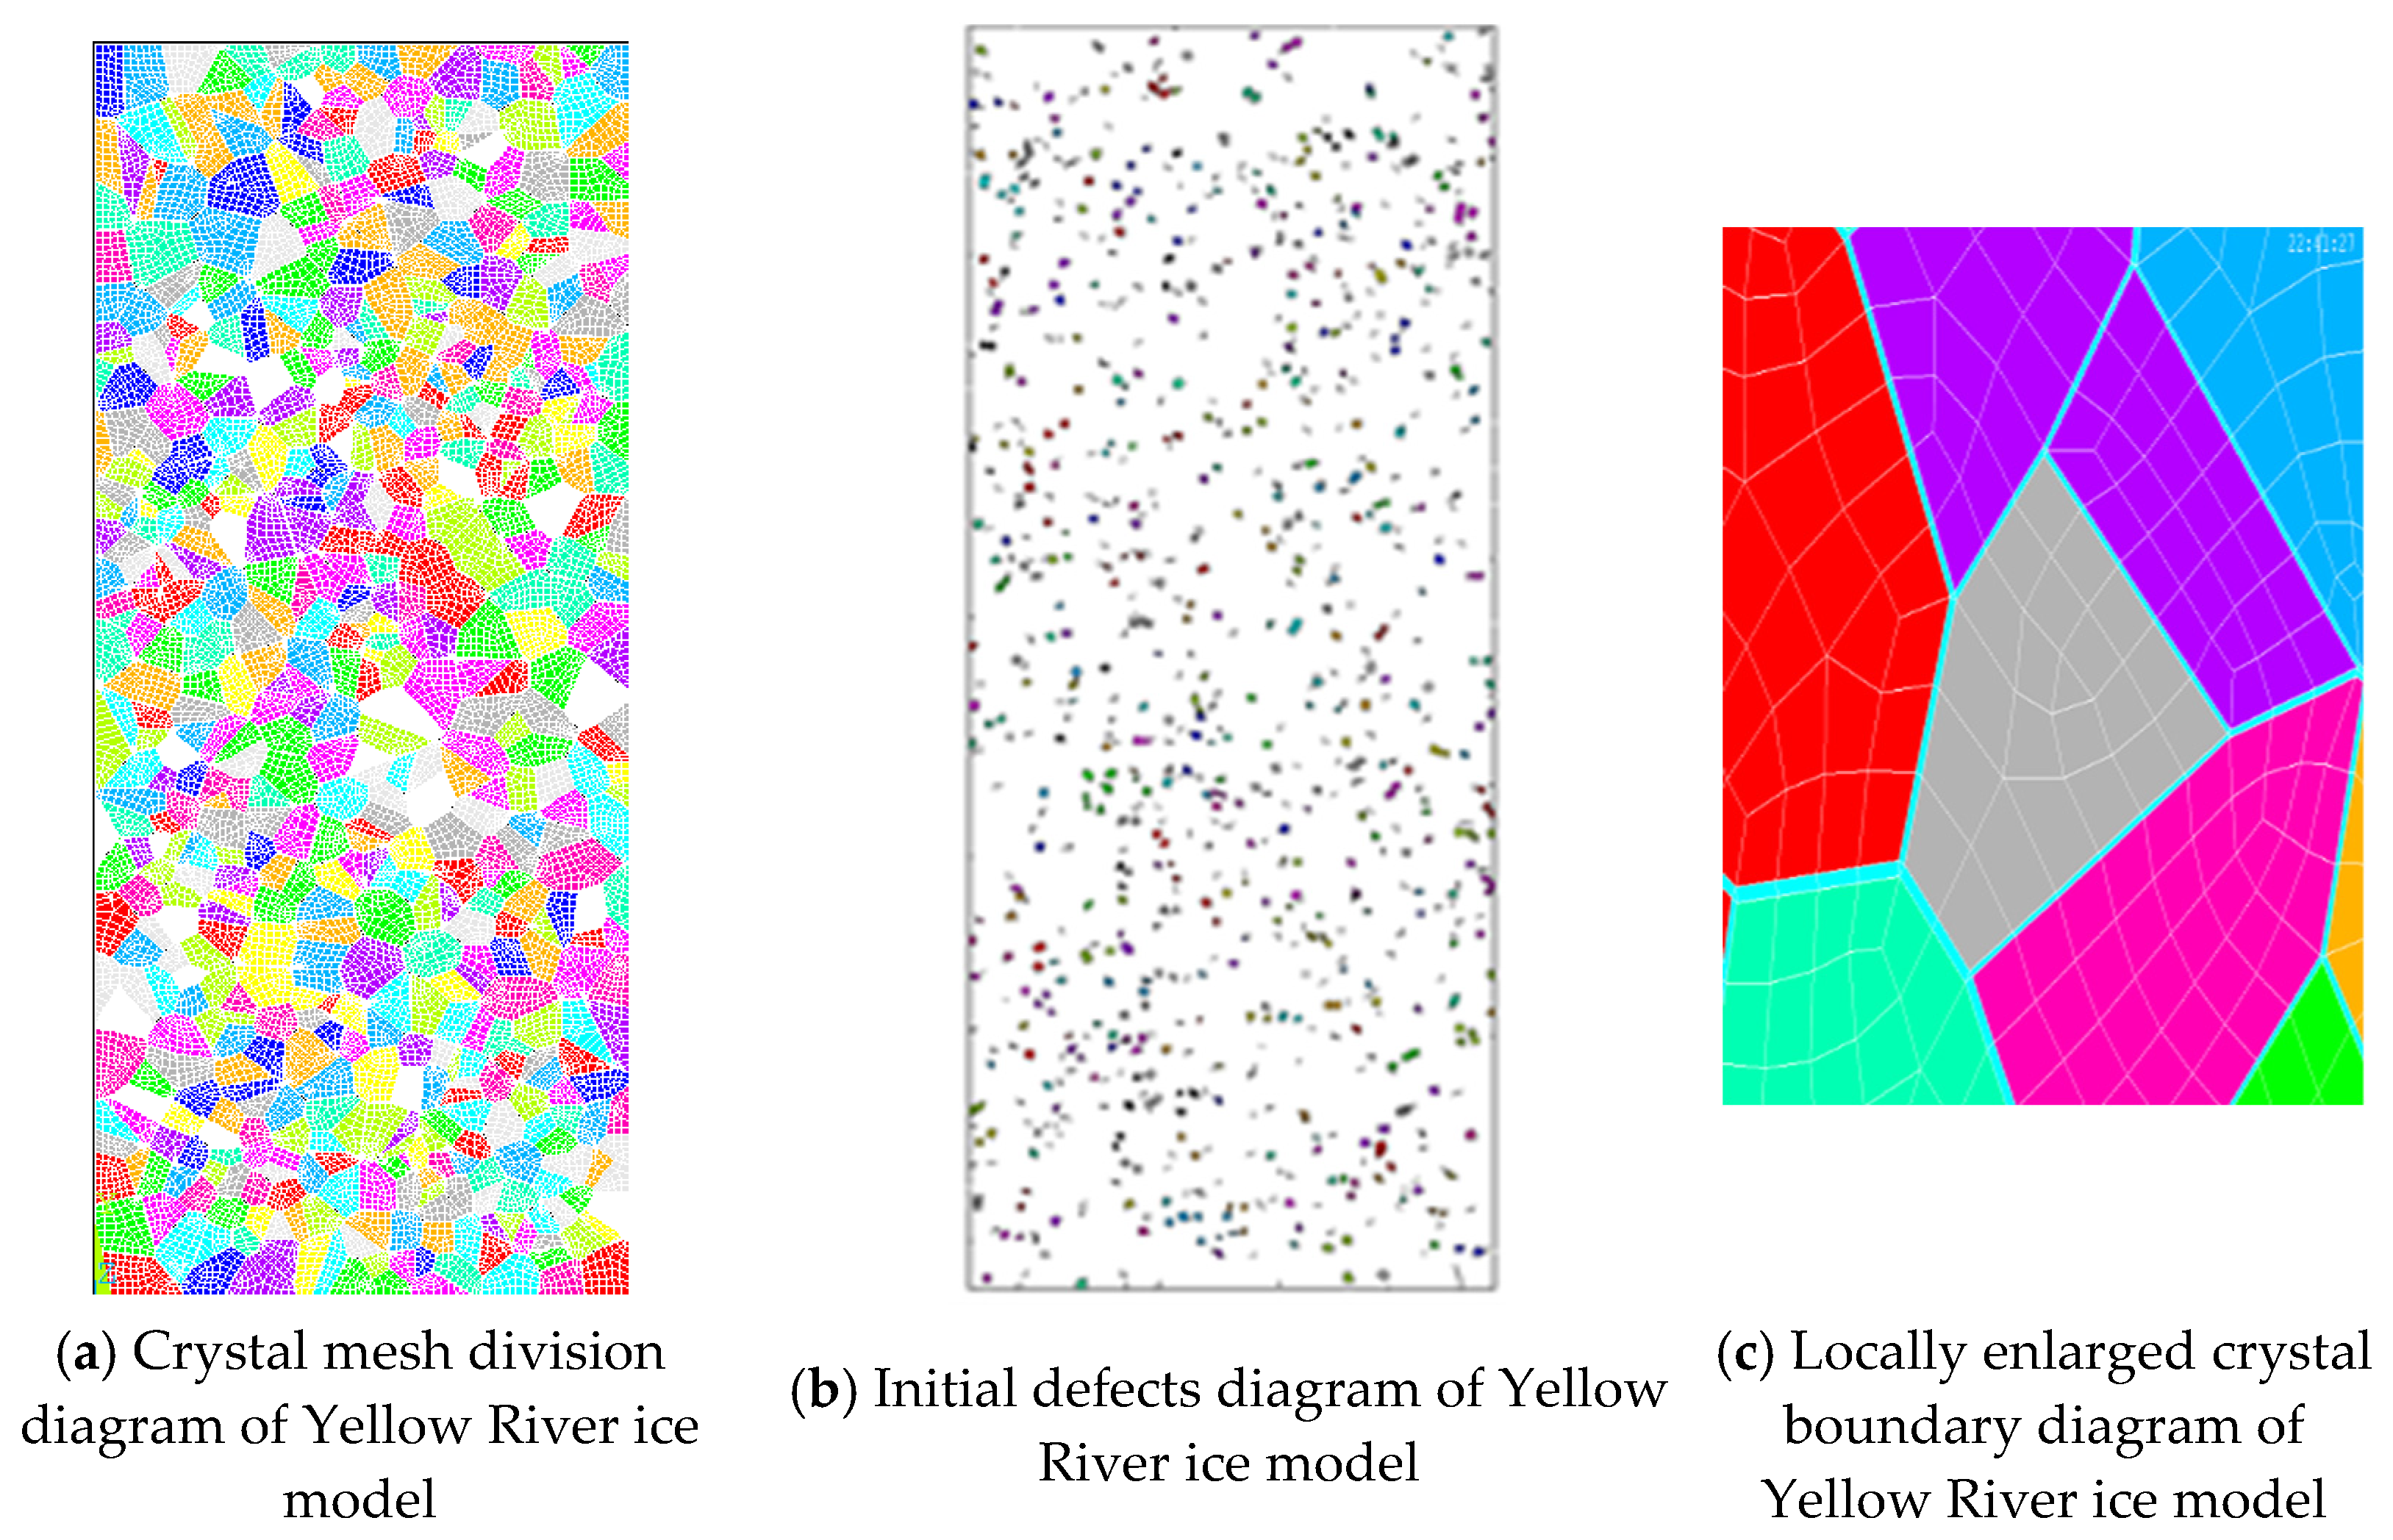
The destruction of river ice structures is usually caused by the evolution of dislocation and slip at the ice crystal interface. Therefore, the influence of ice grain boundaries cannot be ignored in the numerical model. In the model, a thin solid element is used to simulate the ice crystal boundary. The initial defects inside the Yellow River ice include bubbles, impurities, micro-cracks, and sediment particles, among which bubbles are the most common and account for the largest proportion. In this paper, various initial defects in Yellow River ice are assumed to be a unified substance and randomly distributed in river ice grains and grain boundaries. In the numerical model, equivalent initial damage elements are used for simulation. Based on the measured initial defect content from the physics experiment results [40,41,42], the number of equivalent crack elements is determined. The performance of equivalent initial damage elements is determined according to the size of initial defects and grid size. The methods and steps employed in this study are outlined as follows: (a) It is assumed that the initial defect takes a circular shape, and its diameter is considered equivalent to the diameter of the bubble, denoted as d. (b) A further assumption is made that each equivalent initial damage unit contains only a single initial defect. (c) The number of initial defects, denoted as N, is estimated based on the initial defect content and the defect size d. (d) Subsequently, N units are randomly selected from the grain and boundary units, and these are designated as equivalent initial damage units. (e) The unit properties of the equivalent initial damage units are then modified accordingly. The specific performance parameters of these units are set as described in Section 2.4. The finite element model of river ice with initial defects is shown in Figure 2. Within this figure, Figure 2a is the crystal mesh division diagram of the Yellow River ice model, Figure 2b is the initial defects diagram of the Yellow River ice model, and Figure 2c is the locally enlarged crystal boundary diagram of the Yellow River ice model.

Figure 2.
Schematic figure of the finite element model of Yellow River ice.
2.3. Constitutive Relation and Failure Criterion
River ice exhibits strong brittleness during failure. The mesoscopic components of river ice are regarded as homogeneous linear elastic materials, where both grains and grain boundaries are elastic-brittle materials and isotropic within the same cross-section. Through an analysis of the four commonly used failure criteria for fracture problems–maximum tensile stress theory, maximum linear strain theory, maximum shear stress theory, and shape change ratio energy theory, it can be seen that the maximum tensile stress theory is more suitable for analyzing the river ice fracture process [30,43]. Therefore, the maximum tensile stress criterion is adopted as the failure criterion for river ice [30,43]. For elements with an initial defect, the corresponding failure criteria for grains and grain boundaries are adopted according to the location of the element. It is assumed that the element loses its bearing capacity after failure, and its material properties are modified [44]. The elastic modulus of the failed element is taken as a very small value (10−5 to 10−4 of the original value), ignoring its contribution to the stiffness matrix [44].
2.4. Determination of Mesoscopic Parameters
There are two types of parameters that need to be determined in the river ice calculation model: mesoscopic structural parameters and mesoscopic material parameters. The selection of river ice parameters has been discussed in detail in the literature [44]. Among them, the mesoscopic structural parameters mainly include the size and distribution of ice crystal grains, the composition of boundaries, and the determination of initial defects. The mesoscopic material parameters mainly include the grain anisotropy, elastic modulus of ice grains, fracture strength, mechanical properties of ice grain boundaries, etc. The main calculation parameter values for the analysis of the three-point bending fracture process of river ice are shown in Table 1.

Table 1.
Values of main parameters for mesoscopic calculation of river ice.
3. Simulation Analysis of Three-Point Bending Fracture Process of River Ice
3.1. Analysis of Simulation Results
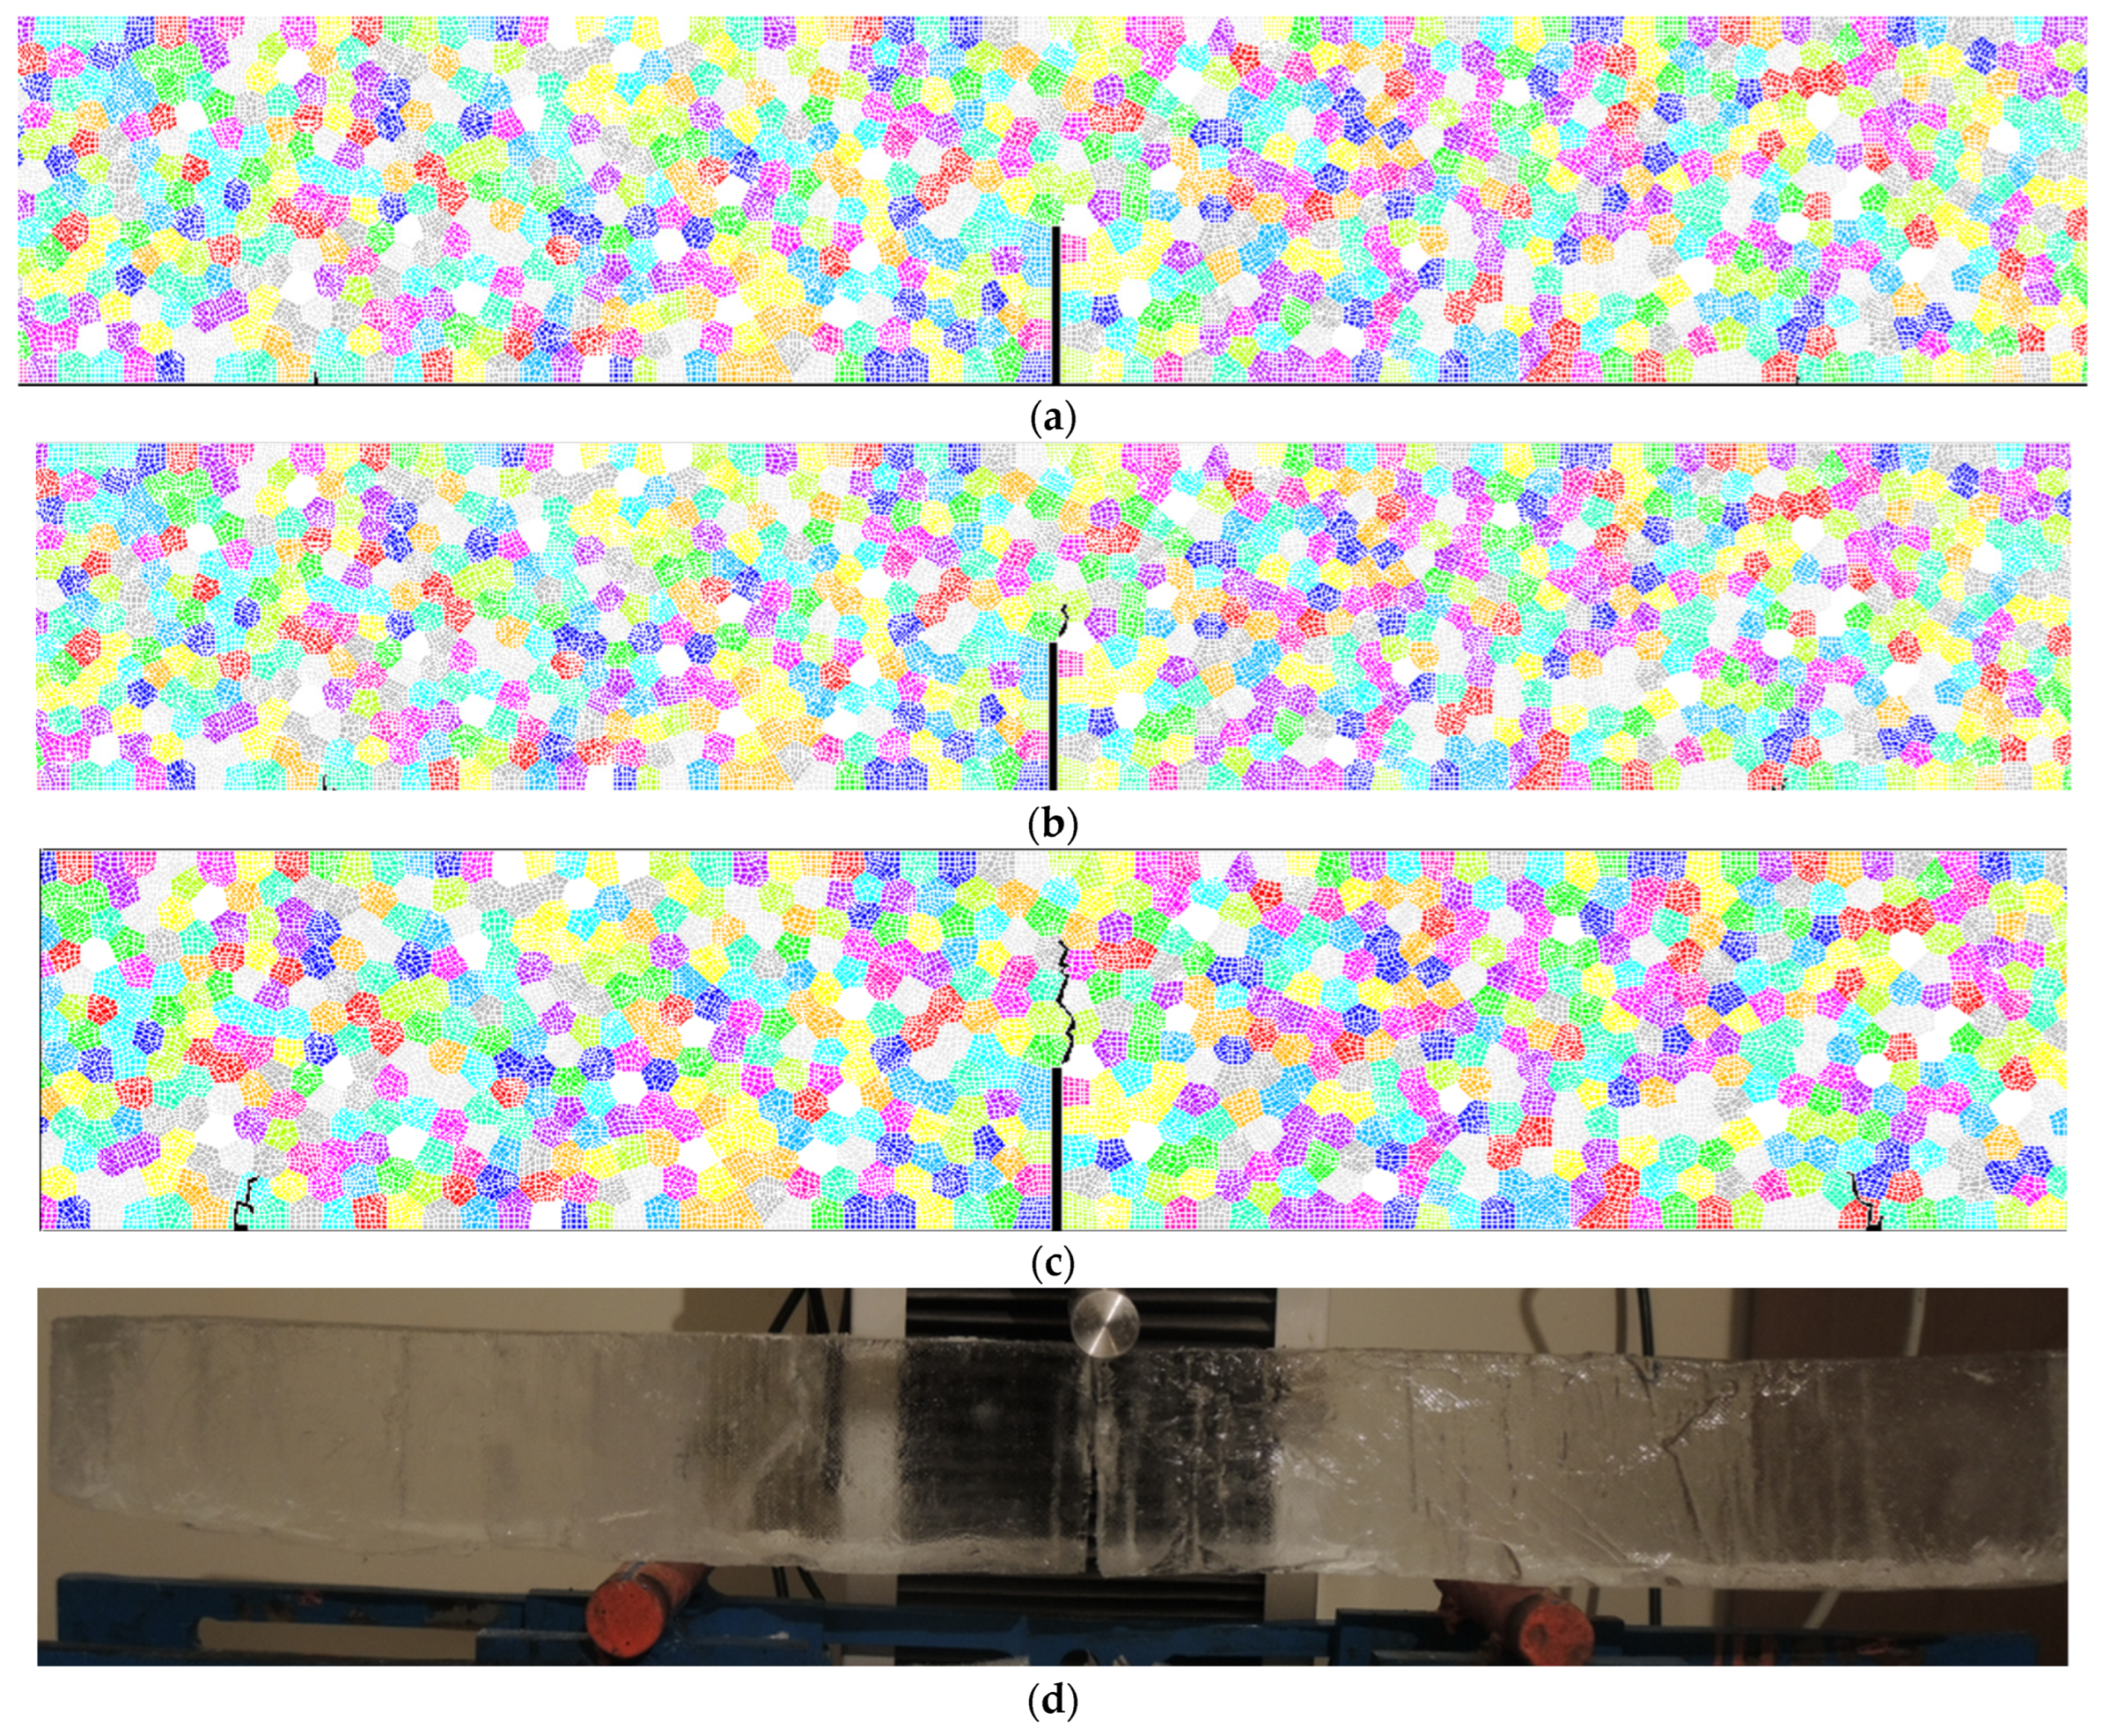
Based on the physical experiments of the three-point bending of Yellow River ice, a numerical model for the three-point bending fracture of Yellow River ice was constructed. Figure 3 shows the typical failure mode during the model calculation process. As can be seen from Figure 3a, during the initial cracking stage of the ice sample, the crack at the central notch commences its slow upward progression. Simultaneously, displacement begins to manifest at the support positions on the left and right sides of the lower interface of the beam, as well as at the loading position on the upper interface of the beam. Figure 3b illustrates that, as the load increases, the crack at the central notch of the beam gradually propagates upwards, ultimately forming a macroscopically visible crack. As can be further seen from Figure 3b, with a continued increase in load, the crack at the central notch of the beam stabilizes, accompanied by the emergence of macro cracks at the loading position on the upper interface and the support positions on the lower interface of the beam. As can be seen from Figure 3c, the final fracture form of the river ice is characterized by a main crack formed in the center of the specimen, along with typical wing-shaped cracks developing in the connection areas between the two supports and the loading point. Lastly, Figure 3d presents a representative image of a failed sample from the physical experiment of the three-point bending of the river ice, with its failure mode resembling the one obtained from the simulation calculation.
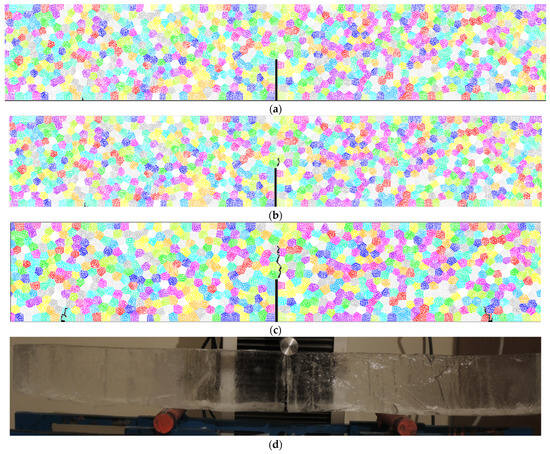
Figure 3.
Diagram of the cracking process and physical experiment failure modes of river ice under three-point bending load: (a) initial crack initiation; (b) development of the macroscopic main crack; (c) final failure mode; (d) physical experimental failure mode.
3.2. Analysis of the Impact of Crack-to-Height Ratio on the Three-Point Bending Fracture
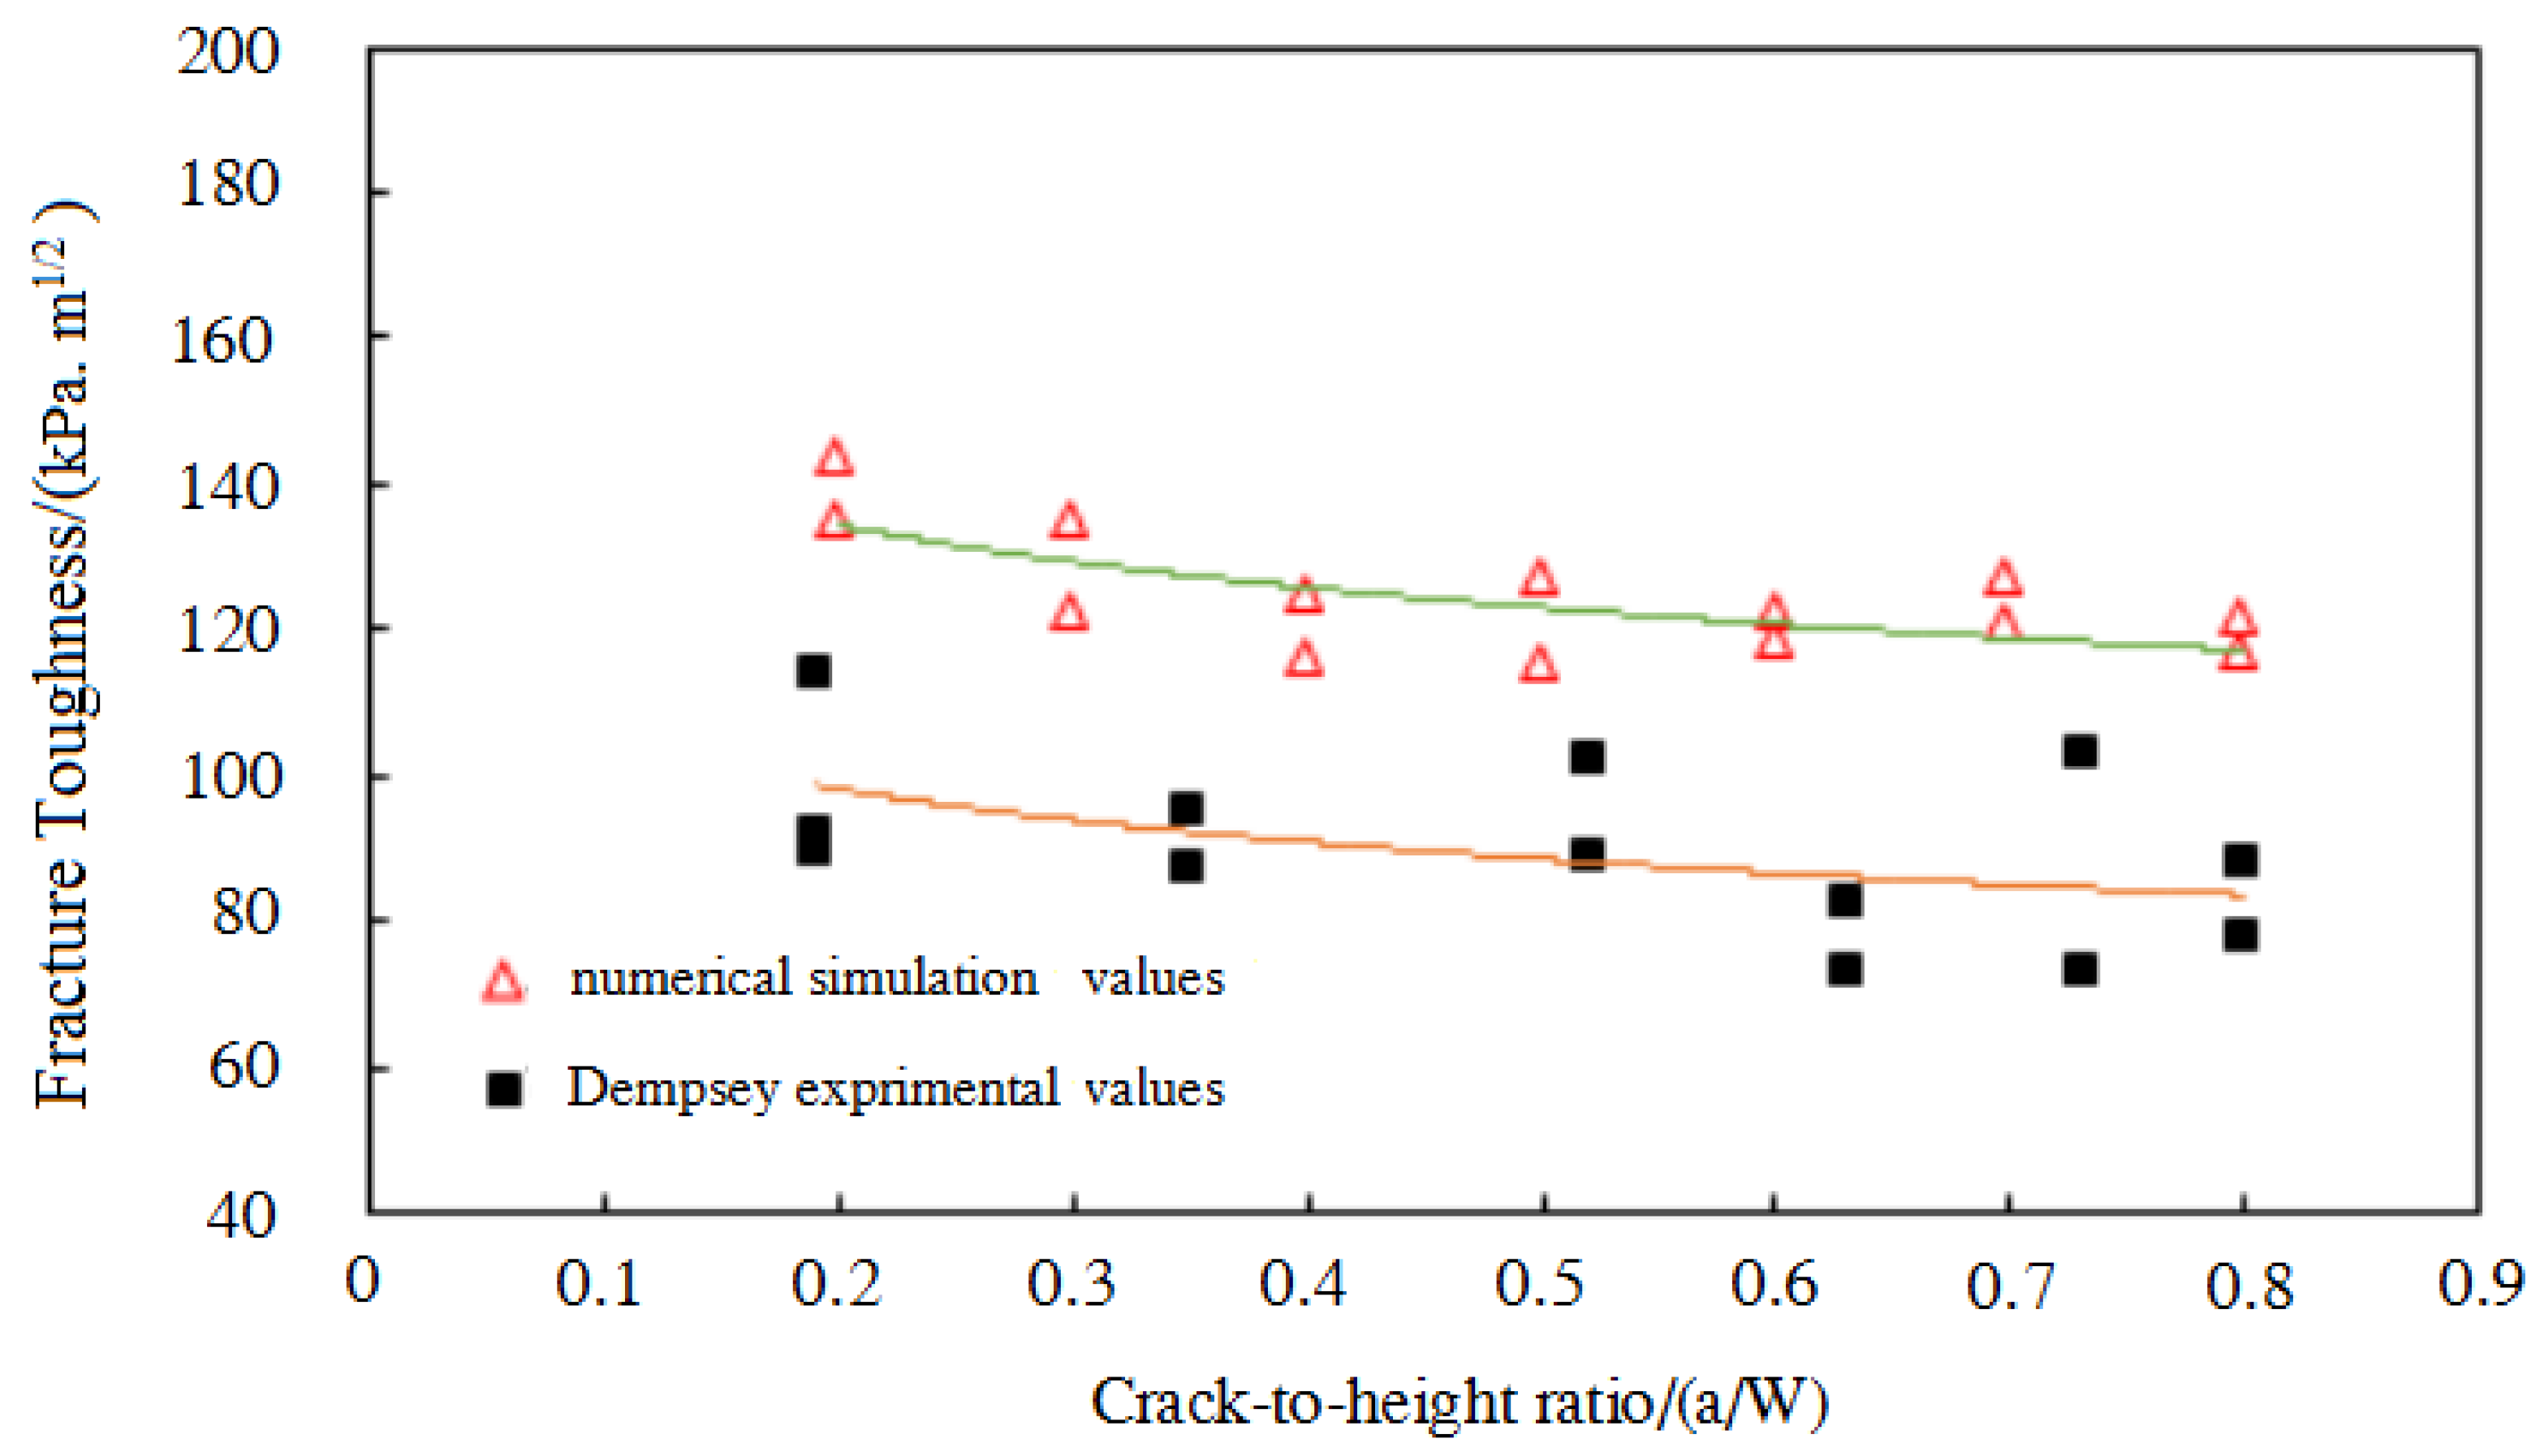
Due to objective factors, the fracture toughness calculation results derived from physical experiments on Yellow River ice exhibit considerable scattering. Among these factors, the prefabricated crack length of the incision is one of the more sensitive factors when measuring the fracture toughness of river ice through fracture toughness tests. The crack length, the remaining propagation zone length, and the distance from the crack tip to the loading point must all conform to the precise description of linear elastic fracture theory. If the crack is too short or too long, the incision’s sensitivity will decrease. Consequently, this paper puts forward a constructed numerical model of river ice fracture to simulate ice samples with varying incision lengths. It then analyzes the river ice fracture toughness calculated for different crack-to-height ratios (i.e., crack incision length/beam height) based on the simulation results. As shown in Figure 4, the sample height is 70 mm, the thickness is 70 mm, the span-to-depth ratio S/W is 4, and the crack-to-height ratios are 0.2, 0.3, 0.4, 0.5, 0.6, 0.7, and 0.8. Among Figure 4, the green line represents the trend line of fracture toughness change for simulated values, while the yellow line represents the trend line of fracture toughness change for experimental values. According to the analysis of Figure 4, the fracture toughness value of Yellow River ice is the highest when the crack-to-height ratio is 0.2. As the crack-to-height ratio increases, the fracture toughness value of Yellow River ice decreases slightly, but the overall decrease is not substantial. Within the simulated sample size range, as the crack-to-height ratio varies from 0.2 to 0.8, the fracture toughness value of Yellow River ice ranges from 115.01 to 143.37 KPa·m1/2. At the same time, to validate the model calculation results, similar experimental data from Dempsey’s literature [45] are introduced in Figure 4 for comparison. The dimensions (W × h × L) of the three-point bending beam ice sample in the literature [45] are 102 mm × 45 mm × 306 mm. Through comparative analysis, it can be seen that, although there are differences in fracture toughness results due to different experimental influencing factors, the trend of change in the fracture toughness of ice is consistent as the crack-to-height ratio increases.
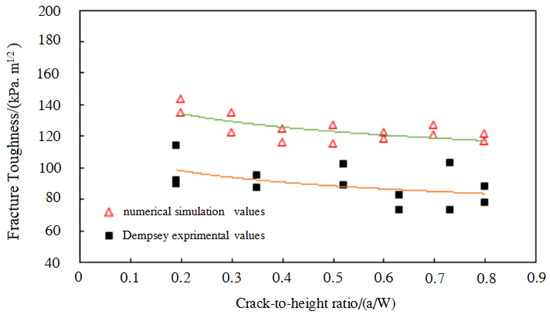
Figure 4.
Impact of initial defects on the failure mode of river ice.
3.3. Analysis of the Ice Crystal Size on the Three-Point Bending Fracture
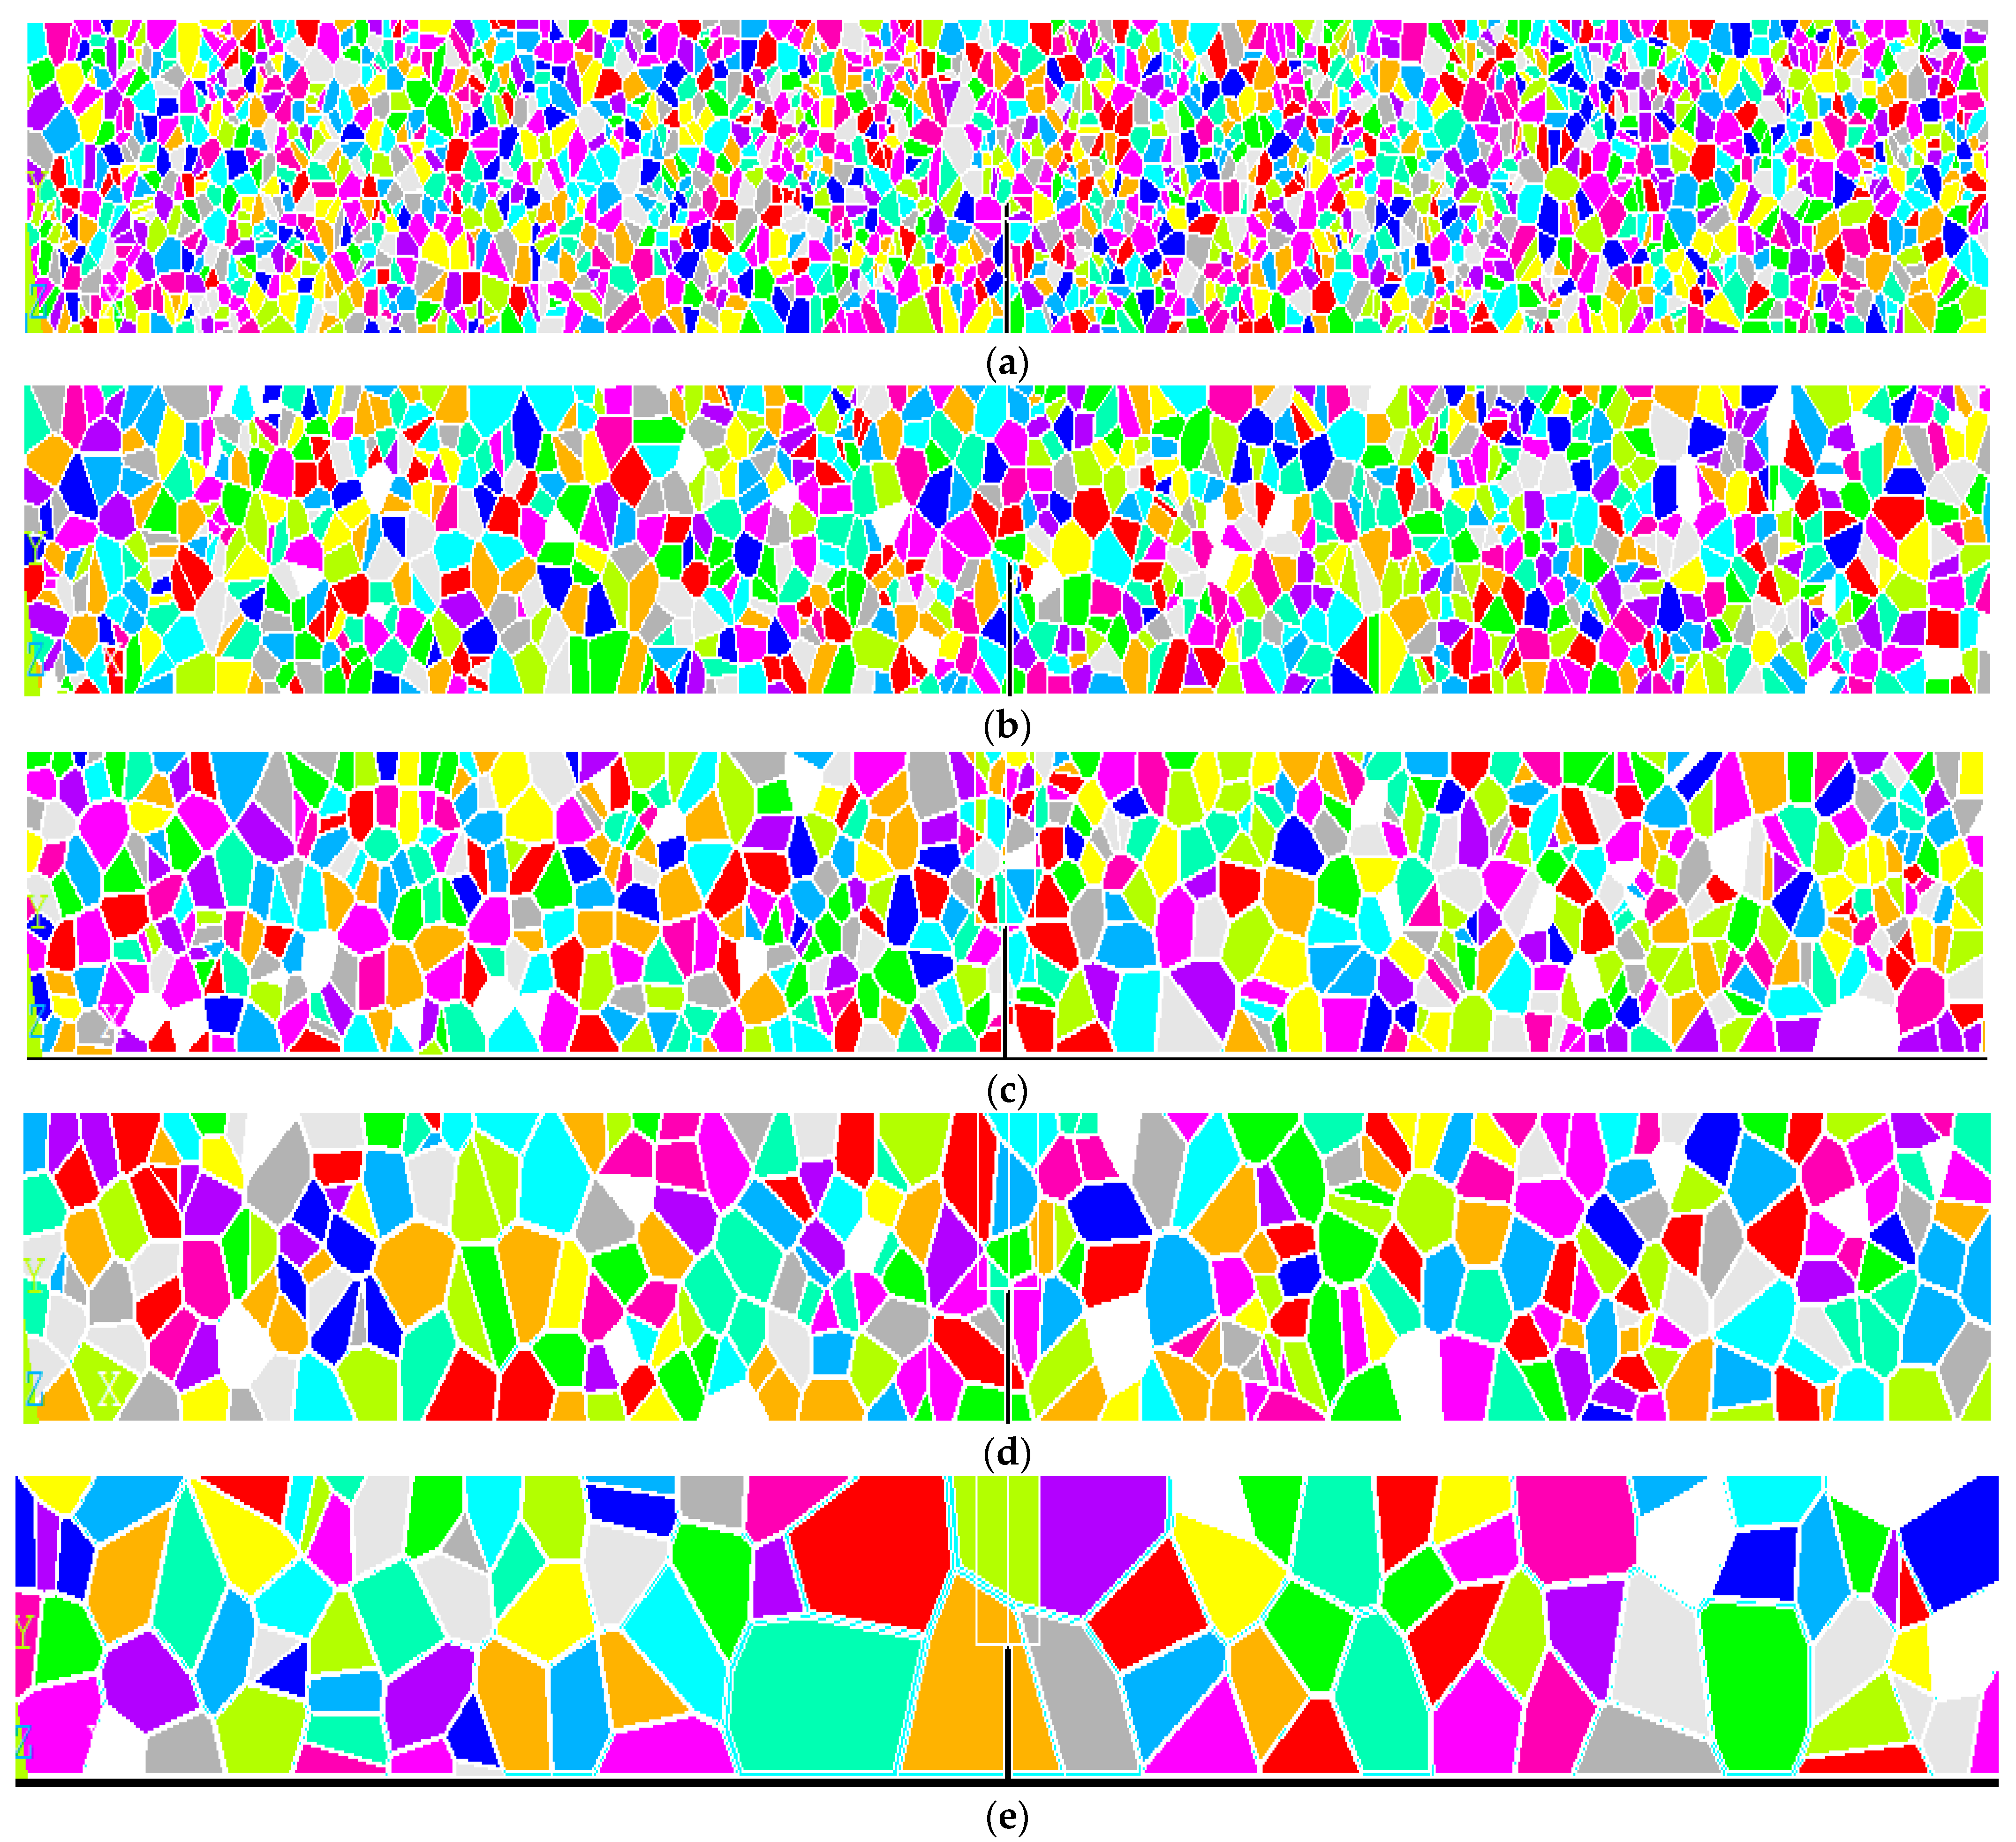
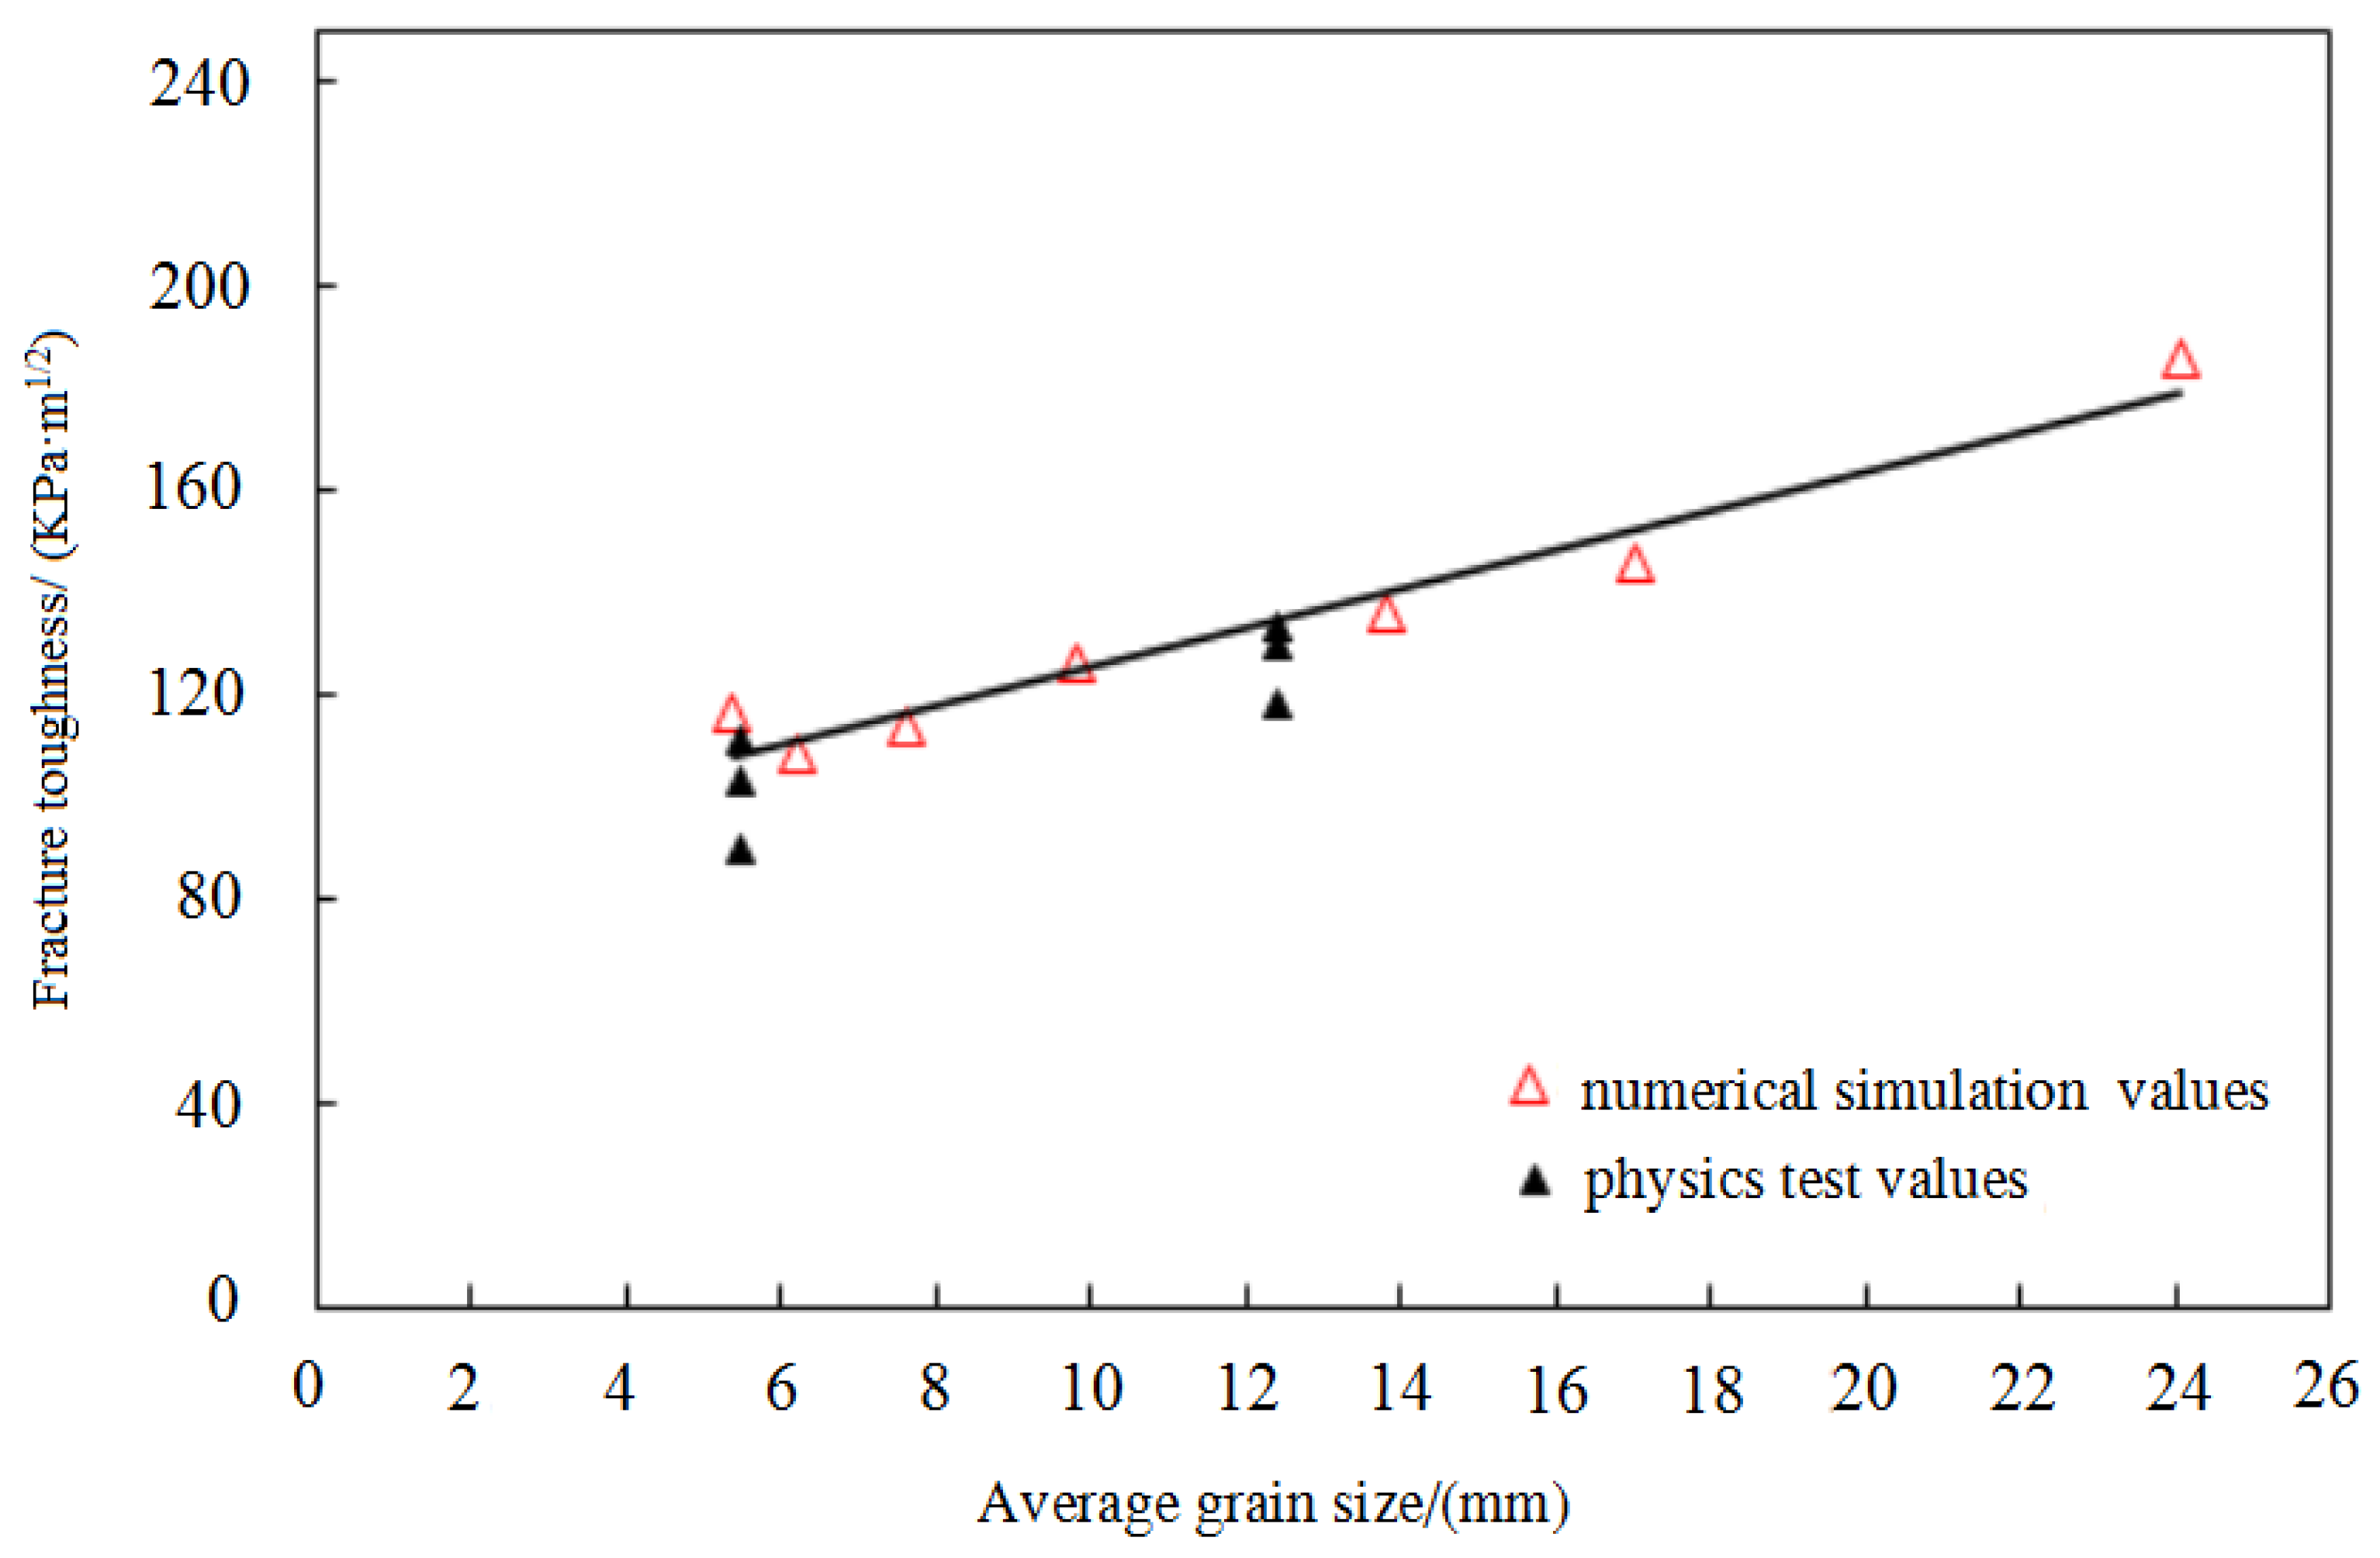
Based on the established numerical model of Yellow River ice fracture, a simulation analysis was conducted to examine the three-point bending fracture process of Yellow River ice under varying ice crystal sizes. Figure 5 illustrates a typical grain size distribution diagram, with average ice crystal sizes (dav) of 4.8 mm, 7.2 mm, 10.6 mm, 13 mm, and 24 mm. Specifically, Figure 5a,b depict the mechanical properties of granular ice, Figure 5d,e portray the mechanical properties of columnar ice, and Figure 5c represents the mechanical properties of the transitional layer between these two ice types. The outcomes of computational analyses conducted on models with different ice crystal size distributions are organized and presented in Figure 6. In Figure 6, the ice crystal sizes for physical tests are derived from the average particle sizes obtained through statistical analyses of granular and columnar ice, while the simulated calculation values range from 5.38 mm to 24.07 mm for ice crystal size. The fracture toughness value of Yellow River ice exhibits a range from 116.89 to 185.54 KPa·m1/2. The simulated fracture toughness values of river ice under different ice crystal sizes align well with the experimental values, with an average error of approximately 5% between the two datasets. As the average size of ice crystals increases, the simulated calculation values exhibit a gradual upward trend. This trend can be attributed to the following factors: granular ice from the Yellow River contains more internal bubbles and impurities, which objectively reduces its hardness and strength, ultimately leading to a decrease in its fracture toughness value. This objective reality is accounted for in the calculation model by incorporating increased initial defects. On the other hand, columnar ice from the Yellow River is primarily formed through thermodynamic growth, with relatively fewer internal bubbles and impurities, resulting in a slight enhancement of its strength and brittleness. Overall, the calculated fracture toughness of columnar ice in the Yellow River is slightly larger than that of granular ice. When the average size of ice crystals further increases (dav = 24.07 m), the simulated fracture toughness value rises to 185.54 kPa.m1/2. This specific working condition surpasses the size range of the naturally occurring columnar ice samples collected from the Yellow River.
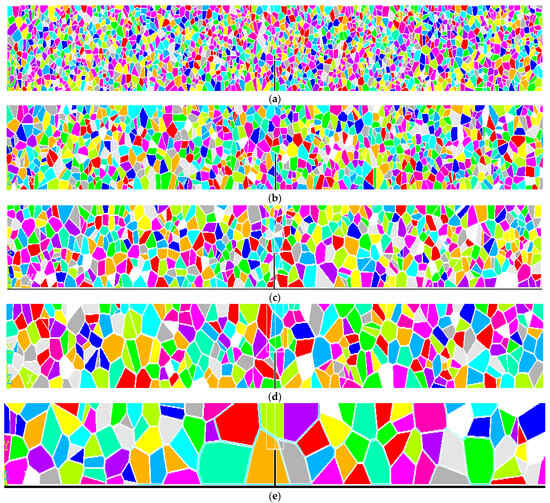
Figure 5.
Three-point bending beam model figure of river ice with different ice crystal grain distributions: (a) average grain size dav = 4.8 mm; (b) average grain size dav = 7.2 mm; (c) average grain size dav = 10.6 mm; (d) average grain size dav = 13 mm; (e) average grain size dav = 24 mm.
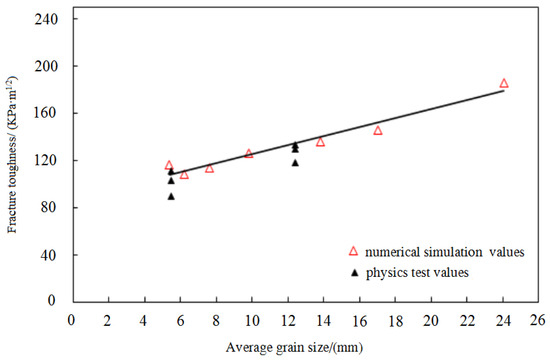
Figure 6.
Comparison of simulated and experimental values of three-point bending fracture toughness of river ice with different ice crystal sizes.
4. Conclusions
This paper develops a numerical model for simulating the fracture of river ice, incorporating considerations of ice crystal grains, ice crystal boundaries, and initial defects. It simulates the cracking process of river ice under three-point bending conditions and analyzes the impact of factors such as the crack-to-depth ratio and ice crystal size on the fracture behavior of river ice subject to various loads. The primary conclusions are summarized as follows:
- (1)
- Voronoi polygons are utilized to represent ice crystal grains, and a numerical model for simulating the fracture of river ice, accounting for initial defects, is established through secondary development using ANSYS software.
- (2)
- The cracking process of river ice under diverse loads is simulated. The three-point bending failure of river ice exhibits a typical wing-shaped crack, with an average error between simulated and experimentally obtained values of approximately 5%.
- (3)
- Based on the outcomes derived from the numerical simulations, an analysis is conducted to elucidate the impact of two pivotal factors—the crack-to-depth ratio and the size of ice crystals—on the fracture behavior of river ice. Within the confines of the simulated sample size spectrum, as the crack-to-height ratio varies from 0.2 to 0.8, the fracture toughness value of Yellow River ice spans a range from 115.01 to 143.37 KPa·m1/2. Correspondingly, within the simulated calculation values ranging from 5.38 mm to 24.07 mm for ice crystal size, the fracture toughness value of Yellow River ice exhibits a range from 116.89 to 185.54 KPa·m1/2.
- (4)
- The findings reveal that an increase in the crack-to-depth ratio leads to a decrement in the fracture toughness of river ice. Within the scale range encompassed by the model calculations, as the average size of ice crystal grains augments, the fracture toughness of river ice exhibits a gradual ascending trend.
The results presented in this paper provide numerical calculations for the fracture behavior of Yellow River ice under specific conditions. Further research is necessary to investigate the fracture process under more complex loading conditions.
Author Contributions
Conceptualization, Y.D. and J.W.; methodology, Y.D.; software, J.W.; data curation, Y.M. and Y.Z.; writing—original draft preparation, Y.D. and J.W. All authors have read and agreed to the published version of the manuscript.
Funding
This research was supported by the National Natural Science Foundation of China (Grant Nos. U23A2012) and the Special Funds for Basic Scientific Research of the Yellow River Institute of Hydraulic Research (HKY-JBYW-2022-08).
Data Availability Statement
The original contributions presented in the study are included in the article.
Conflicts of Interest
The authors declare no conflicts of interest.
References
- Chen, Z.T. Research on ice conditions of rivers, lakes, and seas in China. J. Glaciol. Geocryol. 1988, 10, 279–283. [Google Scholar]
- Chen, Z. Overview of the development of research on Yellow River ice observation. Yellow River Sci. Technol. Inf. 1989, 1, 15. [Google Scholar]
- Sun, Z.; Sui, J. Research on river ice jam and its significance. Adv. Earth Sci. 1990, 3, 51–54. [Google Scholar]
- Sui, J. Riverbed evolution during the freeze-up period in the Longkou-Tianqiao section of the middle Yellow River. Acta Geogr. Sin. 1992, 5, 209–219. [Google Scholar]
- Sui, J.; Fang, D.; Zhou, Y. Analysis and calculation of ice jam water level in the Hequ section of the Yellow River. Hydrology 1994, 63, 18–24. [Google Scholar]
- Wang, J. Experimental study on the incipient velocity of granular sediment under ice cover. J. Water Resour. Water Transp. Res. 1998, 2, 164–169. [Google Scholar]
- Wang, J. Experimental study on ice transport in balanced ice jam. J. Hydroelectr. Eng. 2002, 1, 61–67. [Google Scholar]
- Wang, J. Experimental study on the relationship between the thickness of balanced ice jam and flow conditions and ice discharge. J. Lanzhou Univ. (Nat. Sci.) 2002, 38, 117–121. [Google Scholar]
- Wang, J.; Fu, H.; Yi, M.; Yin, Y.; Gao, Y. Analysis of ice jam water level. Adv. Water Sci. 2007, 18, 102–107. [Google Scholar]
- Gu, L. Analysis of Ice Thickness during the Stable Freeze-Up Period and the Water Level during Ice Break-Up. Master’s Thesis, Hefei University of Technology, Hefei, China, 2007. [Google Scholar]
- Gao, G.; Ma, Z.; Li, S.; Deng, Y. Study on the influence of ice cover on the vertical velocity distribution of laminar flow. Yellow River 2018, 40, 15–17. [Google Scholar]
- Qin, J.; Shen, B. A new type of ice thickness sensor based on the electrical conductivity of ice and water. Sens. Technol. 2004, 23, 55–56. [Google Scholar]
- Qin, J. Theoretical and applied research on ice thickness detection based on the conductivity of air, ice, and water. Master’s Thesis, Xi’an University of Technology, Xi’an, China, 2005. [Google Scholar]
- Qin, J.; Cheng, P.; Qin, M. Ice thickness sensor and its detection method. Adv. Water Sci. 2008, 3, 418–421. [Google Scholar]
- Ji, H. Analysis of the Causes of Ice Jam Flooding in the Inner Mongolia section of the Yellow River and Research on the Forecast Model of Freeze-Up and Break-Up Dates. Ph.D. Thesis, Inner Mongolia Agricultural University, Hohhot, China, 2002. [Google Scholar]
- Wang, L.; Liu, J.; Xie, W. Research progress on ice jam forecast models in the Ningxia-Inner Mongolia section of the Yellow River. Yellow River 2014, 36, 8–10. [Google Scholar]
- Liu, J.; Huo, S.; Wang, C. Research on ice jam forecast and demand for ice prevention on the Yellow River. China Flood Drought Manag. 2017, 6, 10–13. [Google Scholar]
- Meng, W.; Liu, X.; Hu, J. Numerical simulation and experimental study on ice jam blasting based on cumulative penetration technology. J. North China Inst. Water Conserv. Hydroelectr. Power 2013, 3, 44–47. [Google Scholar]
- Yang, X.; Tong, Z.; Song, C. Research on blasting ice-breaking technology for disaster reduction during the ice jam period of the Yellow River. In Proceedings of the 125th Forum on Engineering Sciences and Technologies in China-Explosion Synthesis of New Materials and Key Science and Engineering Technologies for Efficient and Safe Blasting, Nanjing, China, 19 September 2011; pp. 297–303. [Google Scholar]
- Song, C.; Yang, X.; Yan, J.; Liang, Q.; Tong, Z. Research on ice-breaking technology using vehicle-mounted rocket explosion belt. Eng. Blasting 2013, 8, 50–53. [Google Scholar]
- Gao, G.; Deng, Y.; Tian, Z.; Li, S.; Zhang, B. Brief review and prospects of recent research on Yellow River ice jam. Yellow River 2019, 41, 77–81. [Google Scholar]
- Wang, E.; Xu, C.; Yu, J. Research progress on mechanical properties of freshwater ice in China. Water Resour. Sci. Cold Reg. Eng. 2019, 2, 37–43. [Google Scholar]
- Schulson, E.M. An analysis of the brittle to ductile transition in polycrystalline ice under tension. Cold Reg. Sci. Technol. 1979, 1, 87–91. [Google Scholar] [CrossRef]
- Nemat, S.; Horii, H. Rock failure in compression. Int. J. Eng. Sci. 1984, 22, 999–1011. [Google Scholar] [CrossRef]
- Wu, M.S.; Juan, N. Micromechanical prediction of the compressive failure of ice: Model development. Mech. Mater. 1995, 20, 9–32. [Google Scholar] [CrossRef]
- Wu, M.S.; Niu, J. Micromechanical prediction of the compressive failure of ice: Numerical simulations. Mech. Mater. 1995, 20, 33–58. [Google Scholar] [CrossRef]
- Korlie, M.S. 3D simulation of cracks and fractures in a molecular solid under stress and compression. Comput. Math. Appl. 2007, 54, 638–650. [Google Scholar] [CrossRef]
- Kendall, K. Complexities of compression failure. Proc. R. Soc. A Math. Phys. Eng. Sci. Lond. 1978, 361, 245–263. [Google Scholar]
- Evans, A.G.; Palmer, A.C.; Goodman, D.J.; Ashby, M.F.; Williams, G.J. Indentation spalling of edge loaded ice sheets. In Proceedings of the 7th IAHR Ice Symposium, Hamburg, Germany, 27–31 August 1984; Volume 1, pp. 113–121. [Google Scholar]
- Xiao, J.; Jordaan, I.J. Application of damage mechanics to ice failure in compression. Cold Reg. Sci. Technol. 1996, 24, 305–322. [Google Scholar] [CrossRef]
- Han, L.; Li, F.; Yue, Q.J. Finite element simulation of the entire process of ice cone interaction damage. China Offshore Platf. 2007, 22, 22–27. [Google Scholar]
- Cundall, P.A. A computer model for simulating progressive large-scale movements in block rock systems. In Proceedings of the International Symposium on Rock Fracture, Nancy, France, 4–6 October 1971; Volume 1, pp. 8–11. [Google Scholar]
- Jirasek, M.; Bazant, Z.P. Macroscopic fracture characteristics of random particle systems. J. Eng. Mech. 1995, 69, 201–228. [Google Scholar] [CrossRef]
- Jirasek, M.; Bazant, Z.P. Particle model for quasibrittle fracture and application to sea ice. J. Eng. Mech. 1995, 121, 1016–1025. [Google Scholar] [CrossRef]
- Lu, P.; Li, Z.J.; Han, H.W. Introduction of parameterized sea ice drag coefficients into ice free-drift modeling. J. Oceanol. 2016, 35, 53–59. [Google Scholar] [CrossRef]
- Wang, J.; He, L.; Chen, P.; Sui, J. Numerical simulation of mechanical breakup of river ice-cover. J. Hydrodyn. Ser. B 2013, 25, 415–421. [Google Scholar] [CrossRef]
- Yang, K. Research progress on river and canal ice hydraulics, ice observation, and forecasting. J. Hydraul. Eng. 2018, 49, 81–91. [Google Scholar]
- Fu, H.; Yang, K.; Guo, X.L.; Guo, Y.X.; Wang, T. Safe operation of inverted siphon during ice period. J. Hydrodyn. Ser. B 2015, 27, 204–209. [Google Scholar] [CrossRef]
- Mao, Z.; Ma, J.; She, Y.; Wu, J.J. Research on resistance of frozen rivers. J. Hydraul. Eng. 2002, 5, 59–64. [Google Scholar]
- Wang, J.; Huang, Y.; Deng, Y.; Zhijun, L.; Yaodan, Z. Research on ice fracture of the Yellow River performance based on digital image correlation method. J. Hydrol. 2021, 52, 1036–1045. [Google Scholar]
- Yaodan, Z.; Zhijun, L.; Yuanren, X.; Chunjiang, L.; Baosen, Z.; Yu, D. Microstructural characteristics of frazil particles and the physical properties of frazil ice in the Yellow River, China. Crystals 2021, 11, 617. [Google Scholar] [CrossRef]
- Yu, D.; Zongkun, L.; Juan, W.; Lukai, X. The microstructure of Yellow River ice in the freezing period. Crystals 2019, 9, 484. [Google Scholar] [CrossRef]
- Zou, B.; Xiao, J.; Jordaan, I.J. Ice fracture and spalling in ice structure interaction. Cold Reg. Sci. Technol. 1996, 24, 213–220. [Google Scholar] [CrossRef]
- Deng, Y.; Wang, J.; Xiao, Z. Selection of meso-parameters in the construction of a meso-model for river ice. Yellow River 2017, 10, 27–31. [Google Scholar]
- Dempsey, J.P.; Wei, Y.; Defranco, S.J. Notch sensitivity and brittleness in fracture testing of S2 columnar freshwater ice. Int. J. Fract. 1992, 53, 101–120. [Google Scholar] [CrossRef]

Disclaimer/Publisher’s Note: The statements, opinions and data contained in all publications are solely those of the individual author(s) and contributor(s) and not of MDPI and/or the editor(s). MDPI and/or the editor(s) disclaim responsibility for any injury to people or property resulting from any ideas, methods, instructions or products referred to in the content. |
© 2024 by the authors. Licensee MDPI, Basel, Switzerland. This article is an open access article distributed under the terms and conditions of the Creative Commons Attribution (CC BY) license (https://creativecommons.org/licenses/by/4.0/).