Article

Enhanced Corrosion Resistance of CuAl/BN Coatings through the Addition of Rare Earth Elements and High-Temperature Oxidation Treatment

1
Ganjiang Innovation Academy, Chinese Academy of Sciences, Ganzhou 341119, China
2
School of Rare Earths, University of Science and Technology of China, Hefei 230026, China
3
Institute of Process Engineering, Chinese Academy of Sciences, Beijing 100190, China
*
Author to whom correspondence should be addressed.
Crystals 2024, 14(9), 808; https://doi.org/10.3390/cryst14090808
Submission received: 31 July 2024 / Revised: 28 August 2024 / Accepted: 29 August 2024 / Published: 12 September 2024
(This article belongs to the Section Crystalline Metals and Alloys)

Abstract

:
Abradable seal coatings represent a critical technology within the realm of advanced power systems, designed to minimize airflow channel leakage, thereby reducing energy consumption and enhancing overall efficiency. In the present study, CuAl/BN, CuAlLaF3/BN, and CuAlY/BN abradable seal coatings were prepared using plasma spraying technology. Both the as-deposited coatings and high-temperature oxidation-treated coatings were comprehensively investigated by means of scanning electron microscopy (SEM), open-circuit potentials (OCP), potentiodynamic polarization, electrochemical impedance spectroscopy (EIS), salt-spray corrosion testing, and bond strength evaluations. The results show that the addition of rare earth elements to the CuAl/BN coatings does not enhance the corrosion resistance of the coatings and even leads to a decrease in the corrosion resistance of the coatings. In contrast, the CuAlY/BN coatings exhibited a significant improvement in corrosion resistance following an oxidation treatment at 550 °C. This enhancement is attributed to the yttrium (Y) element, which facilitates the formation of passivation films and confers a resistance effect, thereby bolstering the coatings’ resistance to corrosion. The bond strength of the high-temperature oxidation-treated CuAlY/BN coating was improved by about 30% after 960 h of salt-spray corrosion.

1. Introduction

Abradable seal coating is a key technology of advanced power systems to decrease the leakage loss from airflow channels, reduce energy consumption, and improve efficiency, and it is the most advanced seal technology for airways [1,2,3,4,5,6]. These coatings represent the state-of-the-art in sealing technology for various applications, including aviation, aerospace, heavy-duty terrestrial gas turbines, turbocompressors, and supercritical thermal power units. Despite their widespread adoption, the existing sealing materials, such as Ni/C and Al/BN, have exhibited inadequate corrosion resistance, often succumbing to failure and delamination when exposed to salt-spray corrosion environments [7,8,9,10]. In contrast, CuAl-based coatings have demonstrated superior corrosion resistance compared to both nickel-based and aluminum-based counterparts [11,12,13,14], so development of marine corrosion-resistant CuAl-based seal coatings has a very important strategic value. Recent studies have suggested that the incorporation of rare earth elements can refine grain boundaries [15], reduce grain size [15,16,17], and facilitate the formation of passivation films [18,19,20], thereby augmenting the mechanical integrity and corrosion resistance of the material [21,22,23,24]. To date, numerous studies have concentrated on elucidating the role of rare earth elements in enhancing the corrosion resistance of both alloys and coatings, and a variety of studies have been carried out to address the technical challenges in the field of corrosion protection in the development and manufacture of cutting-edge power units. The inclusion of rare earth elements has been shown to induce the formation of insoluble corrosion products during the corrosion process. These products become embedded within the material’s pores, effectively achieving self-sealing and thus preventing the ingress of corrosive agents into the material’s interior, which significantly bolsters its corrosion resistance [25,26,27,28]. Furthermore, the addition of rare earth elements has been observed to promote the development of passivation films, which are crucial for improving the corrosion resistance of materials [29]. Concurrently, the introduction of rare earth elements can also refine the material’s microstructure, facilitate the nucleation of secondary phase particles [30,31], and enhance grain refinement [32]. This is complemented by the promotion of diffusion processes [33] and the reduction in point defects [34,35], all of which contribute to the enhancement of both the corrosion resistance and the mechanical properties of the material. In this study, we aimed to enhance the corrosion resistance of CuAl/BN coatings by incorporating a low concentration of rare earth elements, with the objective of developing a coating material that not only possesses superior corrosion resistance but also retains effective sealing capabilities. The primary focus of our research was to assess the impact of rare earth additions on the corrosion resistance of CuAl/BN coatings. To achieve this, CuAl/BN, CuAlLaF3/BN, and CuAlY/BN were prepared using plasma spraying technology. Subsequently, we conducted a series of electrochemical tests and salt-spray corrosion tests to evaluate the influence of rare earth additions on the microstructural, mechanical, and corrosion-resistant properties of the coatings.

2. Experimental Procedure

2.1. Materials

These investigations were designed to reveal the underlying mechanisms by which rare earth elements affect the performance of CuAl/BN coatings. The raw materials used in the experiment were high-purity raw materials, including aluminum and copper particles with a minimum purity of 99.85%, and yttrium hydride, lanthanum fluoride, and boron nitride particles with a minimum purity of 99.9%. In order to obtain fully solid-phase alloyed powders, the particle sizes were meticulously chosen to range from 45 to 86 μm for the aluminum powder, 8 to 15 μm for the copper powder, and 15 to 30 μm for the rare earth (RE) powders. First, we determined the particle size of copper, and then through the calculation of the surface area of copper particles and a desired copper to aluminum mass ratio of 10:1, we calculated the ratio of copper and aluminum particle size to provide a ratio of 6:1. We then derived from the particle size of aluminum a particle size design that would lead to the aluminum easily and completely wrapped in the top of the copper-particles solid-phase. These materials were then mixed in a predetermined ratio using ball milling for ten hours to ensure homogeneity; argon was used as a protective atmosphere during the mixing process, and XRD tests were carried out on the materials after mixing, and no other impurities were found. Then, for thermal diffusion treatment, the mixed powders were placed in a tube furnace for 6 h in a hydrogen atmosphere at 520 °C. After crushing, sieving, and drying treatment, the mixed powders were coated by hexagonal boron nitride powder with an inorganic binder to obtain the seal-coating composite powders. The chemical compositions of the derived powders are shown in Table 1. For the plasma spraying process, a TC4 titanium alloy was chosen as the substrate material. The substrate’s surface was initially prepared by grinding to remove the native oxide layer, followed by sandblasting to achieve a uniform surface texture. This pretreatment is essential for enhancing the adhesion of the subsequent layers. Following the surface preparation, a bonding layer of CuNi12Al2 copper alloy was applied to the preheated substrate via plasma spraying, ensuring a robust foundation for the subsequent application of the seal coatings.

2.2. Preparation and Material Testing

2.2.1. Preparation Method for the Coating

Abradable seal coatings are prepared by plasma spraying in which various process parameters are used, such as spray power current and voltage (controlled by hydrogen flow), spray distance, powder feed rate, gas pressure, and air flow. Parameters such as spraying power, spraying distance, and powder feed rate are essential in the optimization of the spraying process. Every aspect of the spraying process must be carefully considered when controlling the parameters of the spraying process. By accurately adjusting these parameters, the overall performance of the sprayed coating can be effectively improved to meet the high standards of coating performance required in industrial production.
The titanium alloy substrate specimen (Ø 25 mm × 5 mm) was utilized for the application of the abradable seal coating. Prior to coating, the substrate underwent a rigorous surface preparation process, which included cleaning, sandblasting, and preheating. Subsequently, a CuNi12Al2 bonding primer was applied, followed by the application of the abradable seal coating material described in Table 1. Both the primer and the abradable seal coating were prepared using atmospheric plasma spraying (APS) technology with the APS 2000K equipment (Beijing Aeronautical Manufacturing Technology Research Institut, Beijing, China). Argon (Ar) and hydrogen (H2) were employed as the working gases, with purities of 99.99% and 99.5%, respectively. The specific plasma spraying parameters, optimized through a series of orthogonal experiments, are presented in Table 2.

2.2.2. Microstructure and Composition Characterization

The microstructure of the coating, corrosion products, and other samples were characterized by scanning electron microscopy (SEM), the instrument model is Zeiss Gemini 300 (Zeiss, Oberkochen, Germany). To prepare the samples for SEM analysis, the surface of each specimen was initially polished to achieve a uniform finish. This was followed by a sputter coating process, where the surface was coated with a thin layer of gold for 60 s at a current of 20 mA, to enhance the secondary electron emission and improve the quality of the SEM images. Through SEM examination, the overall morphology of the powder materials and the coatings was assessed, including the distribution of different phases and the elemental composition of both the powders and the coatings.
The physical phases and crystal structures of the coating and associated corrosion products were analyzed using an X-ray diffractometer (Rigaku Smart Lab 9 kW model, Rigaku Co., Tokyo, Japan), utilizing Cu K-alpha (Cu Kα) radiation as the excitation source. The operating conditions were set at a voltage of 45 kV and a current of 200 mA. The X-ray diffraction (XRD) analysis was performed with a scanning speed of 10 degrees per minute, a step size of 0.01 degrees, and a scanning range from 10° to 90° (2θ).

2.2.3. Coating Hardness and Bonding Strength

The hardness of the coating was measured by a MODEL 600MRD-S Rockwell hardness tester (Wilson Rockwell materials testing, Tianjin, China) with a 12.7 mm steel ball and a 150 N load, with a hardness reading of HRY15. Prior to the hardness testing, the coating surface was meticulously prepared by sanding with progressively finer grits of sandpaper, starting with 200# and finishing with 1000#, to ensure cleanliness and uniform smoothness. This procedure was essential to control the surface roughness within the range of 6 to 9 μm.
The bonding strength of the coating was tested using a universal testing machine (WDW-100E) (Better United, Tianjin, China) with a tensile speed of 1 mm/min. The coating specimens, along with the connecting pieces featuring a pin hole at one end of the tensile rod, were 25 mm in diameter. An EA-9658-TDS bonding agent (Tianjin, China) was utilized to join the specimen to the connecting piece. The bonded assembly was secured using an abrasive medium and then subjected to a curing process in an oven (202-1AB) at a temperature of 177 °C for 1 h. The oven was made in China by Tianjin Tester Instrument Co., (Tianjin, China).

2.2.4. Salt-Spray Corrosion Test

The coating was exposed to a salt-spray corrosion (SSC) test within a JST-60 salt-spray corrosion chamber. The chamber utilized a 5 wt.% NaCl aqueous solution as the corrosive medium, maintained at a pH value ranging from 6.5 to 7.2. The test conditions were strictly controlled, with the internal chamber temperature set at 35 ± 1 °C and the relative humidity adjusted to remain between 95% and 98%. The salt-spray deposition rate was consistently maintained within the range of 125 to 250 mL·h−1·m−2. Specimens with a diameter of Ø 25 mm were positioned at an angle of 15 to 30° relative to the vertical, in accordance with the plumb line, and securely placed in the specimen rack.
The SSC test was conducted at time intervals of 0, 120, 240, 480, and 960 h. Upon completion of the exposure periods, the specimens were carefully removed and subjected to ultrasonic cleaning using a low-power ultrasonic bath to remove surface deposits. Subsequently, the specimens were immersed in water to facilitate the removal of any residual electrolyte from the coating’s pores. For the purpose of ensuring the reliability of the results, each test group included three parallel specimens.

2.2.5. Electrochemical Testing

Electrochemical characterization of the coatings was performed using a CHI660E workstation from Shanghai Chenhua Instrument Co., Ltd., Shanghai, China, within a 5 wt.% NaCl aqueous solution. The testing was conducted using a conventional three-electrode system, comprising a working electrode (WE), which was the coating sample under investigation, and fixed by epoxy encapsulation to isolate the nonworking surface. A platinum electrode served as the auxiliary electrode, while a saturated calomel electrode (SCE) was employed as the reference electrode. Before the dynamic potential polarization curve test, the sample to be tested was immersed in the solution, and the open-circuit potential (OCP) test time was 10,800 s to ensure the stability of the test system. Impedance spectroscopy test conditions were a scanning frequency range 0.1~105 Hz, AC sinusoidal amplitude of 5 mV, and voltage scanning rate of 10 mV/s for polarization curve testing. In this study, the electrochemical impedance spectra of the materials were analyzed by fitting them using Zsimpwin software. Microregion localized electrochemical impedance spectroscopy (LEIS) data for the samples were acquired using an NCMS0507 workstation, and the scanning was carried out in the form of an x–y planar grating, using Origin software to create a 3D image, where the x–y coordinates were the scanning area. The z coordinates were used as the impedance values.

3. Results and Discussions

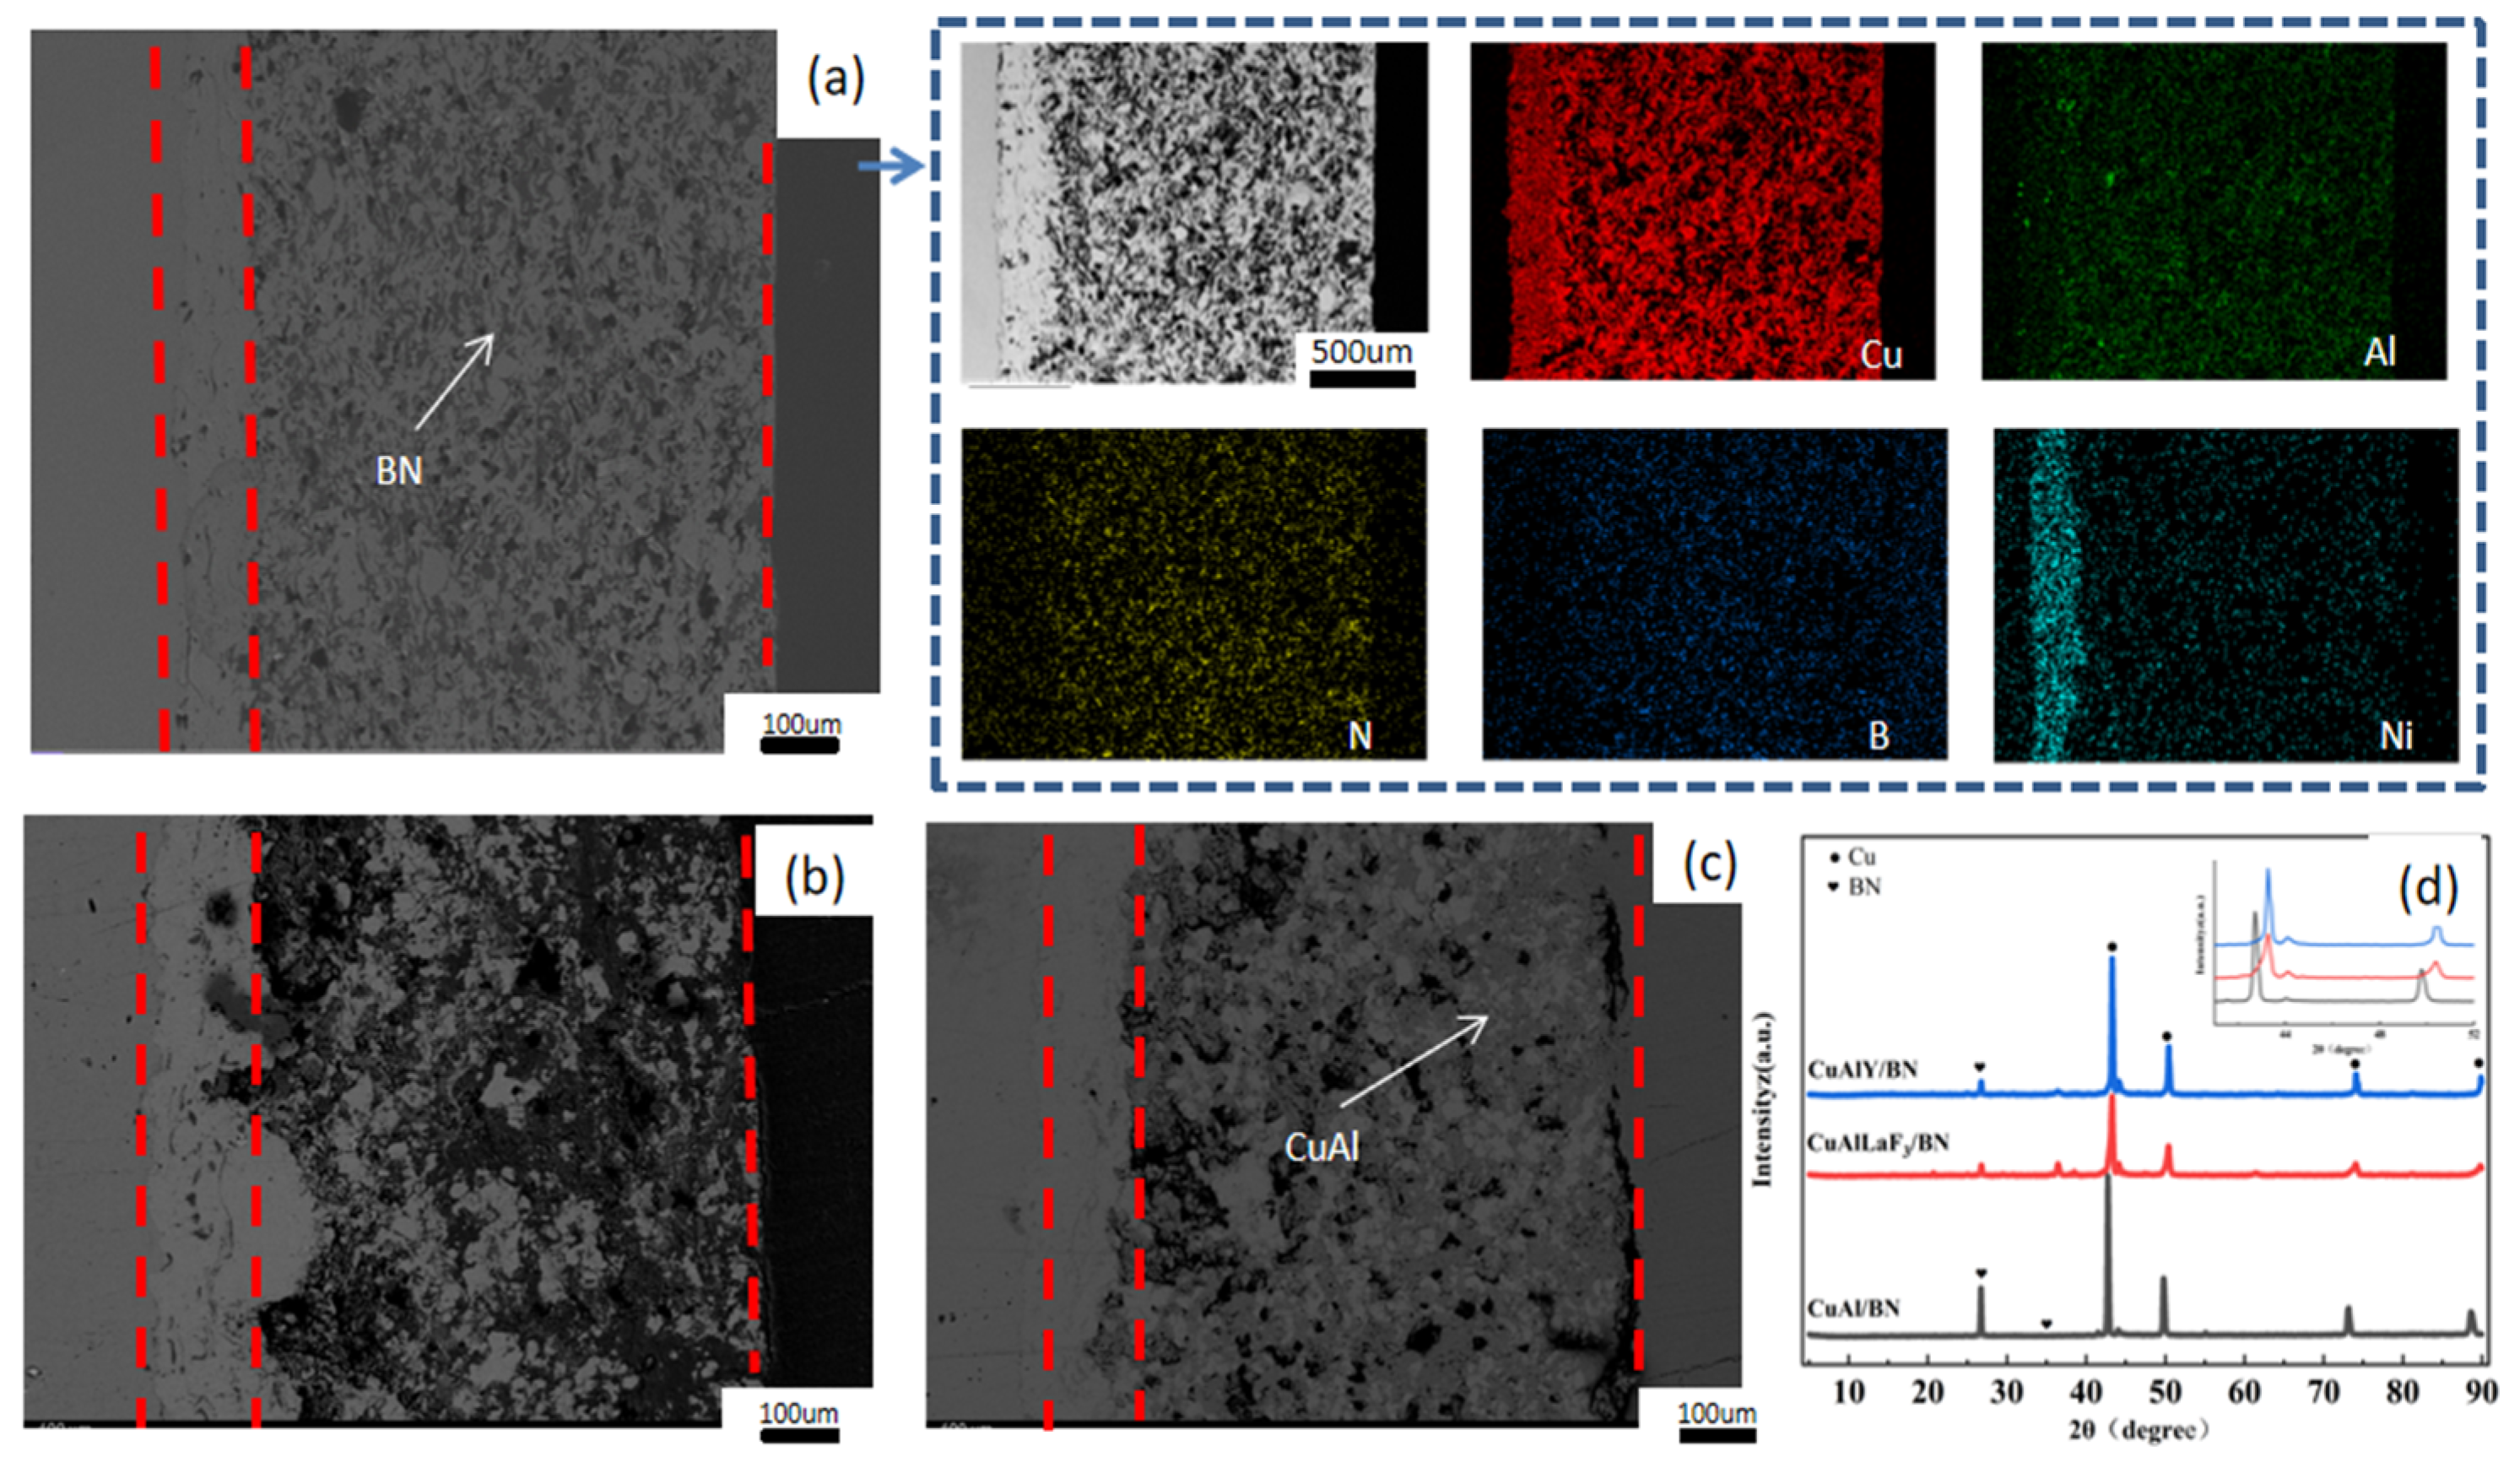
3.1. Morphology and Microstructure Results

The cross-sectional morphology of the abradable seal coatings is shown in Figure 1. It can be clearly seen that the CuAl/BN coating has a typical multilayer structure. The cross-sectional view of the coating from left to right shows the TC4 titanium alloy substrate, CuNi12Al2 primer, and abradable seal coating. The CuAl/BN coating’s surface layer was measured at approximately 1.5 mm in thickness, whereas the CuNi12Al2 bonding layer was approximately 0.2 mm thick. Notably, the absence of gaps or delamination between the layers suggests a robust bond had been achieved. During the thermal spraying process, the metallic phase of the composite powder coalesced to form an interconnected metal matrix framework; the nonmetallic phase boron nitride is uniformly embedded in the metal matrix in a granular state. The boron nitride particles were largely preserved in their original particulate state from the composite powder and were not dispersed by the high-pressure, high-velocity air stream during spraying. Additionally, the metal matrix contained a notable number of pores, which were clearly observable. In the provided micrograph, the bright white regions correspond to the metallic phase, the dark gray regions represent the boron nitride, and the black regions indicate the pores.
Abradable seal coatings need to have both good erosion resistance and abradability, so the hardness values of the coatings range from 50 to 80 HR15Y, and the thicknesses are 1–2 mm, and the hardness values of all three types of coatings are within the desired range. The X-ray diffraction (XRD) analysis of the three coatings, as illustrated in Figure 1d, indicates that the predominant phases present are Cu(Al) and hexagonal boron nitride (hBN). From the XRD diffraction pattern in Figure 1d, it can be seen that compared with the CuAl/BN coating, the diffraction peaks of the CuAlY/BN and CuAlLaF3/BN coatings at a diffraction angle of 43.2° are stronger, while the diffraction peaks at 50.4° are weaker, and the diffraction peaks are shifted to the right. These observations suggest that the incorporation of yttrium and lanthanum fluoride (LaF3) did not alter the fundamental grain structure of the coatings. Instead, it resulted in modifications to the lattice parameters, leading to the systematic shift of the diffraction peaks to the right.

3.2. Effect of Rare Earth Additions on the Electrochemistry of CuAl/BN Coatings

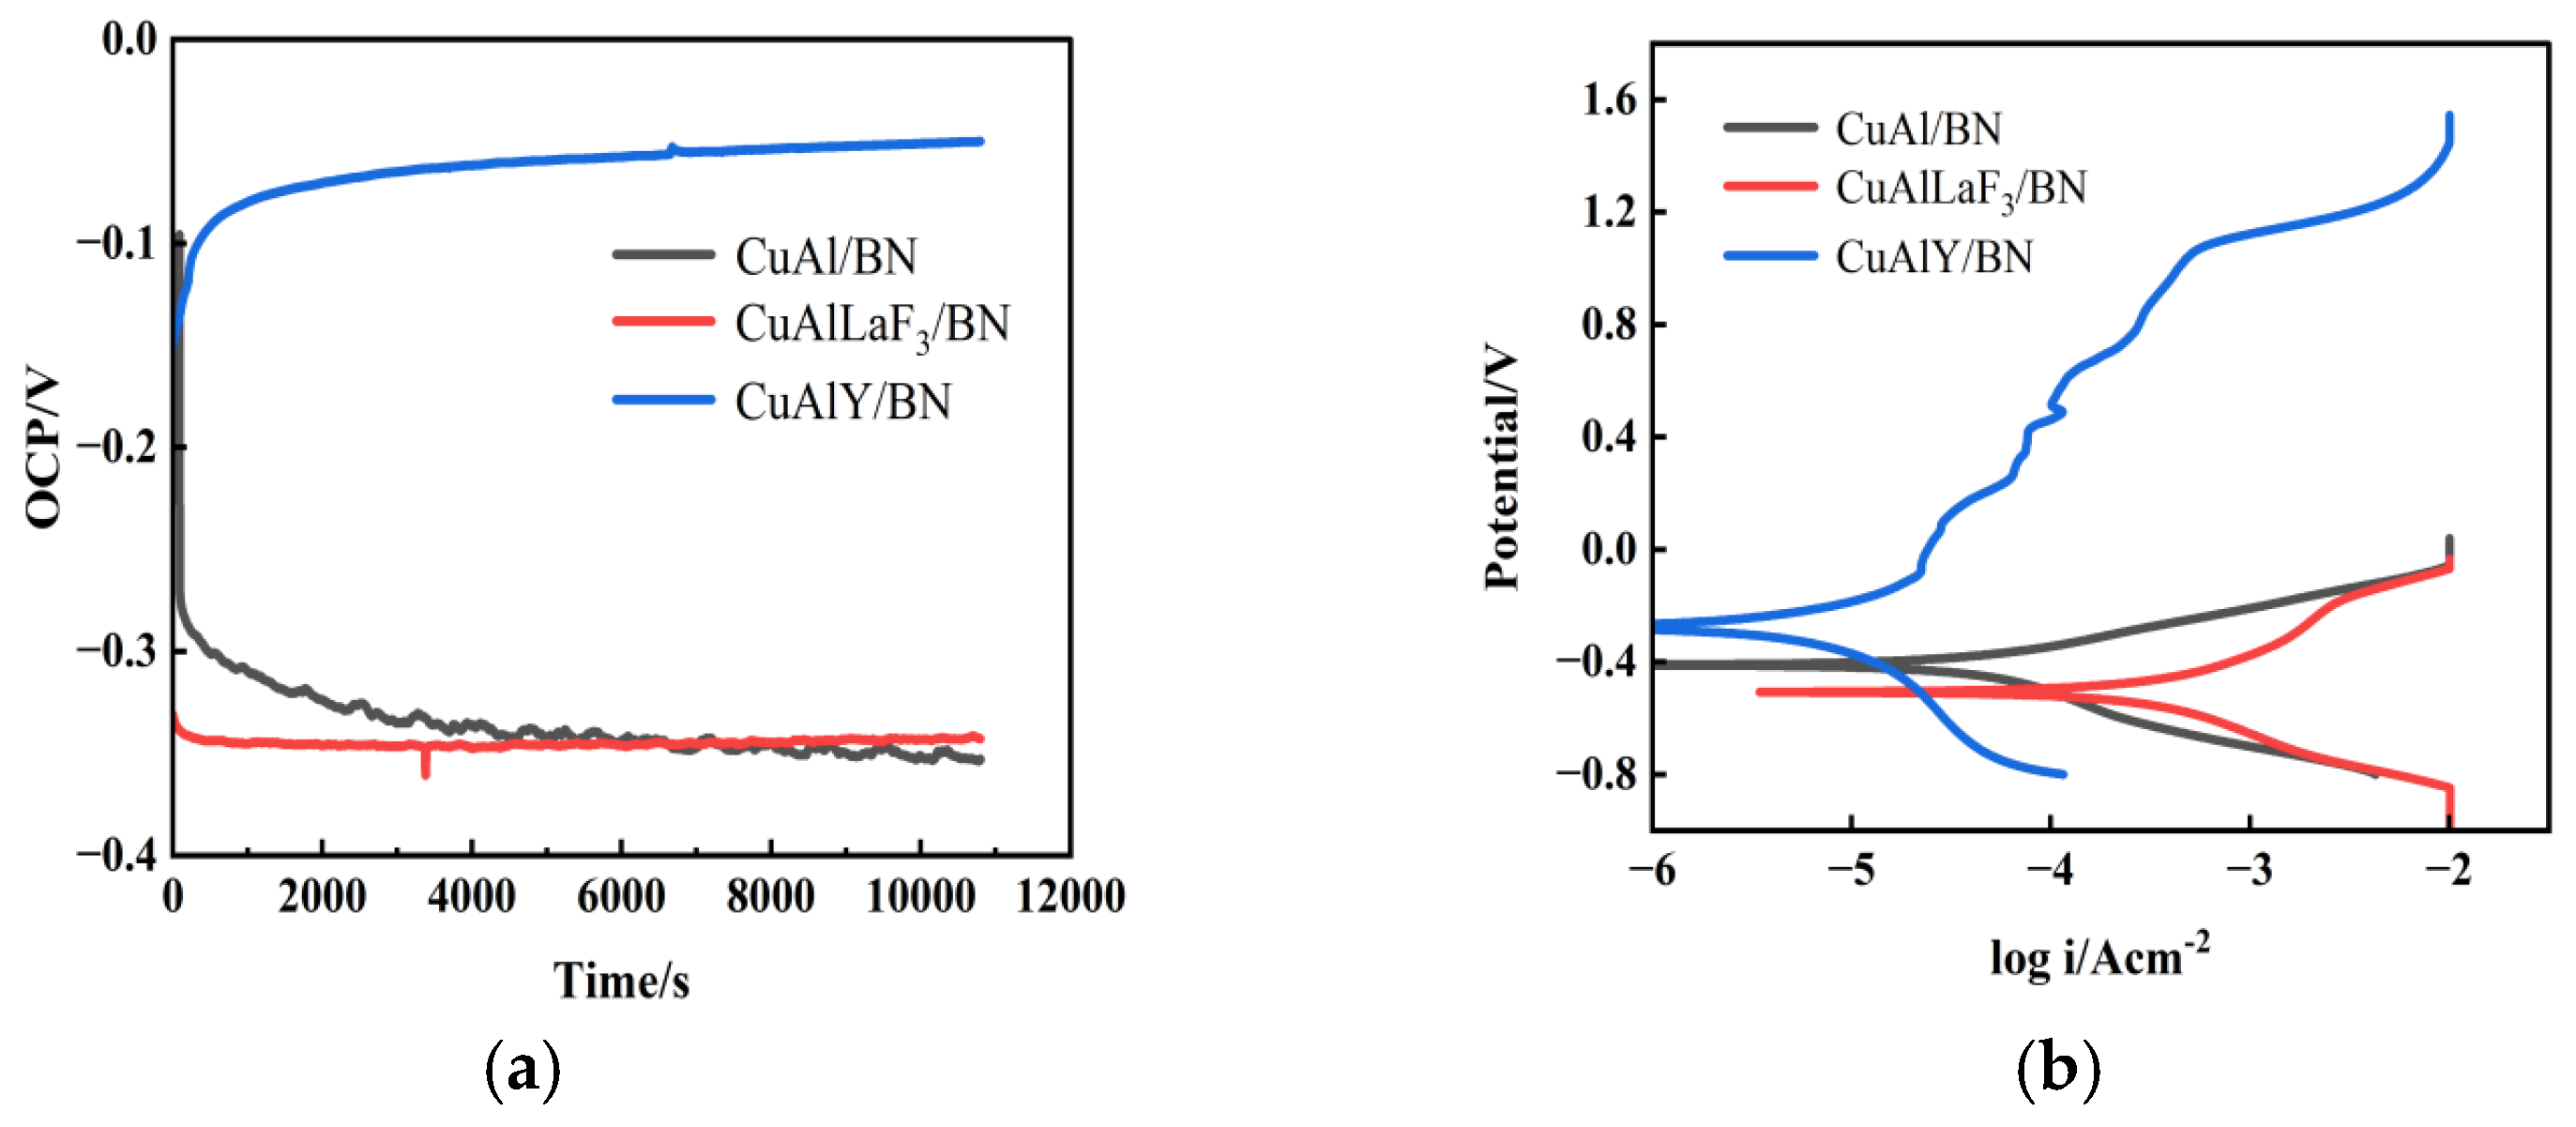
3.2.1. Open-Circuit Potential and Polarization Curve Testing
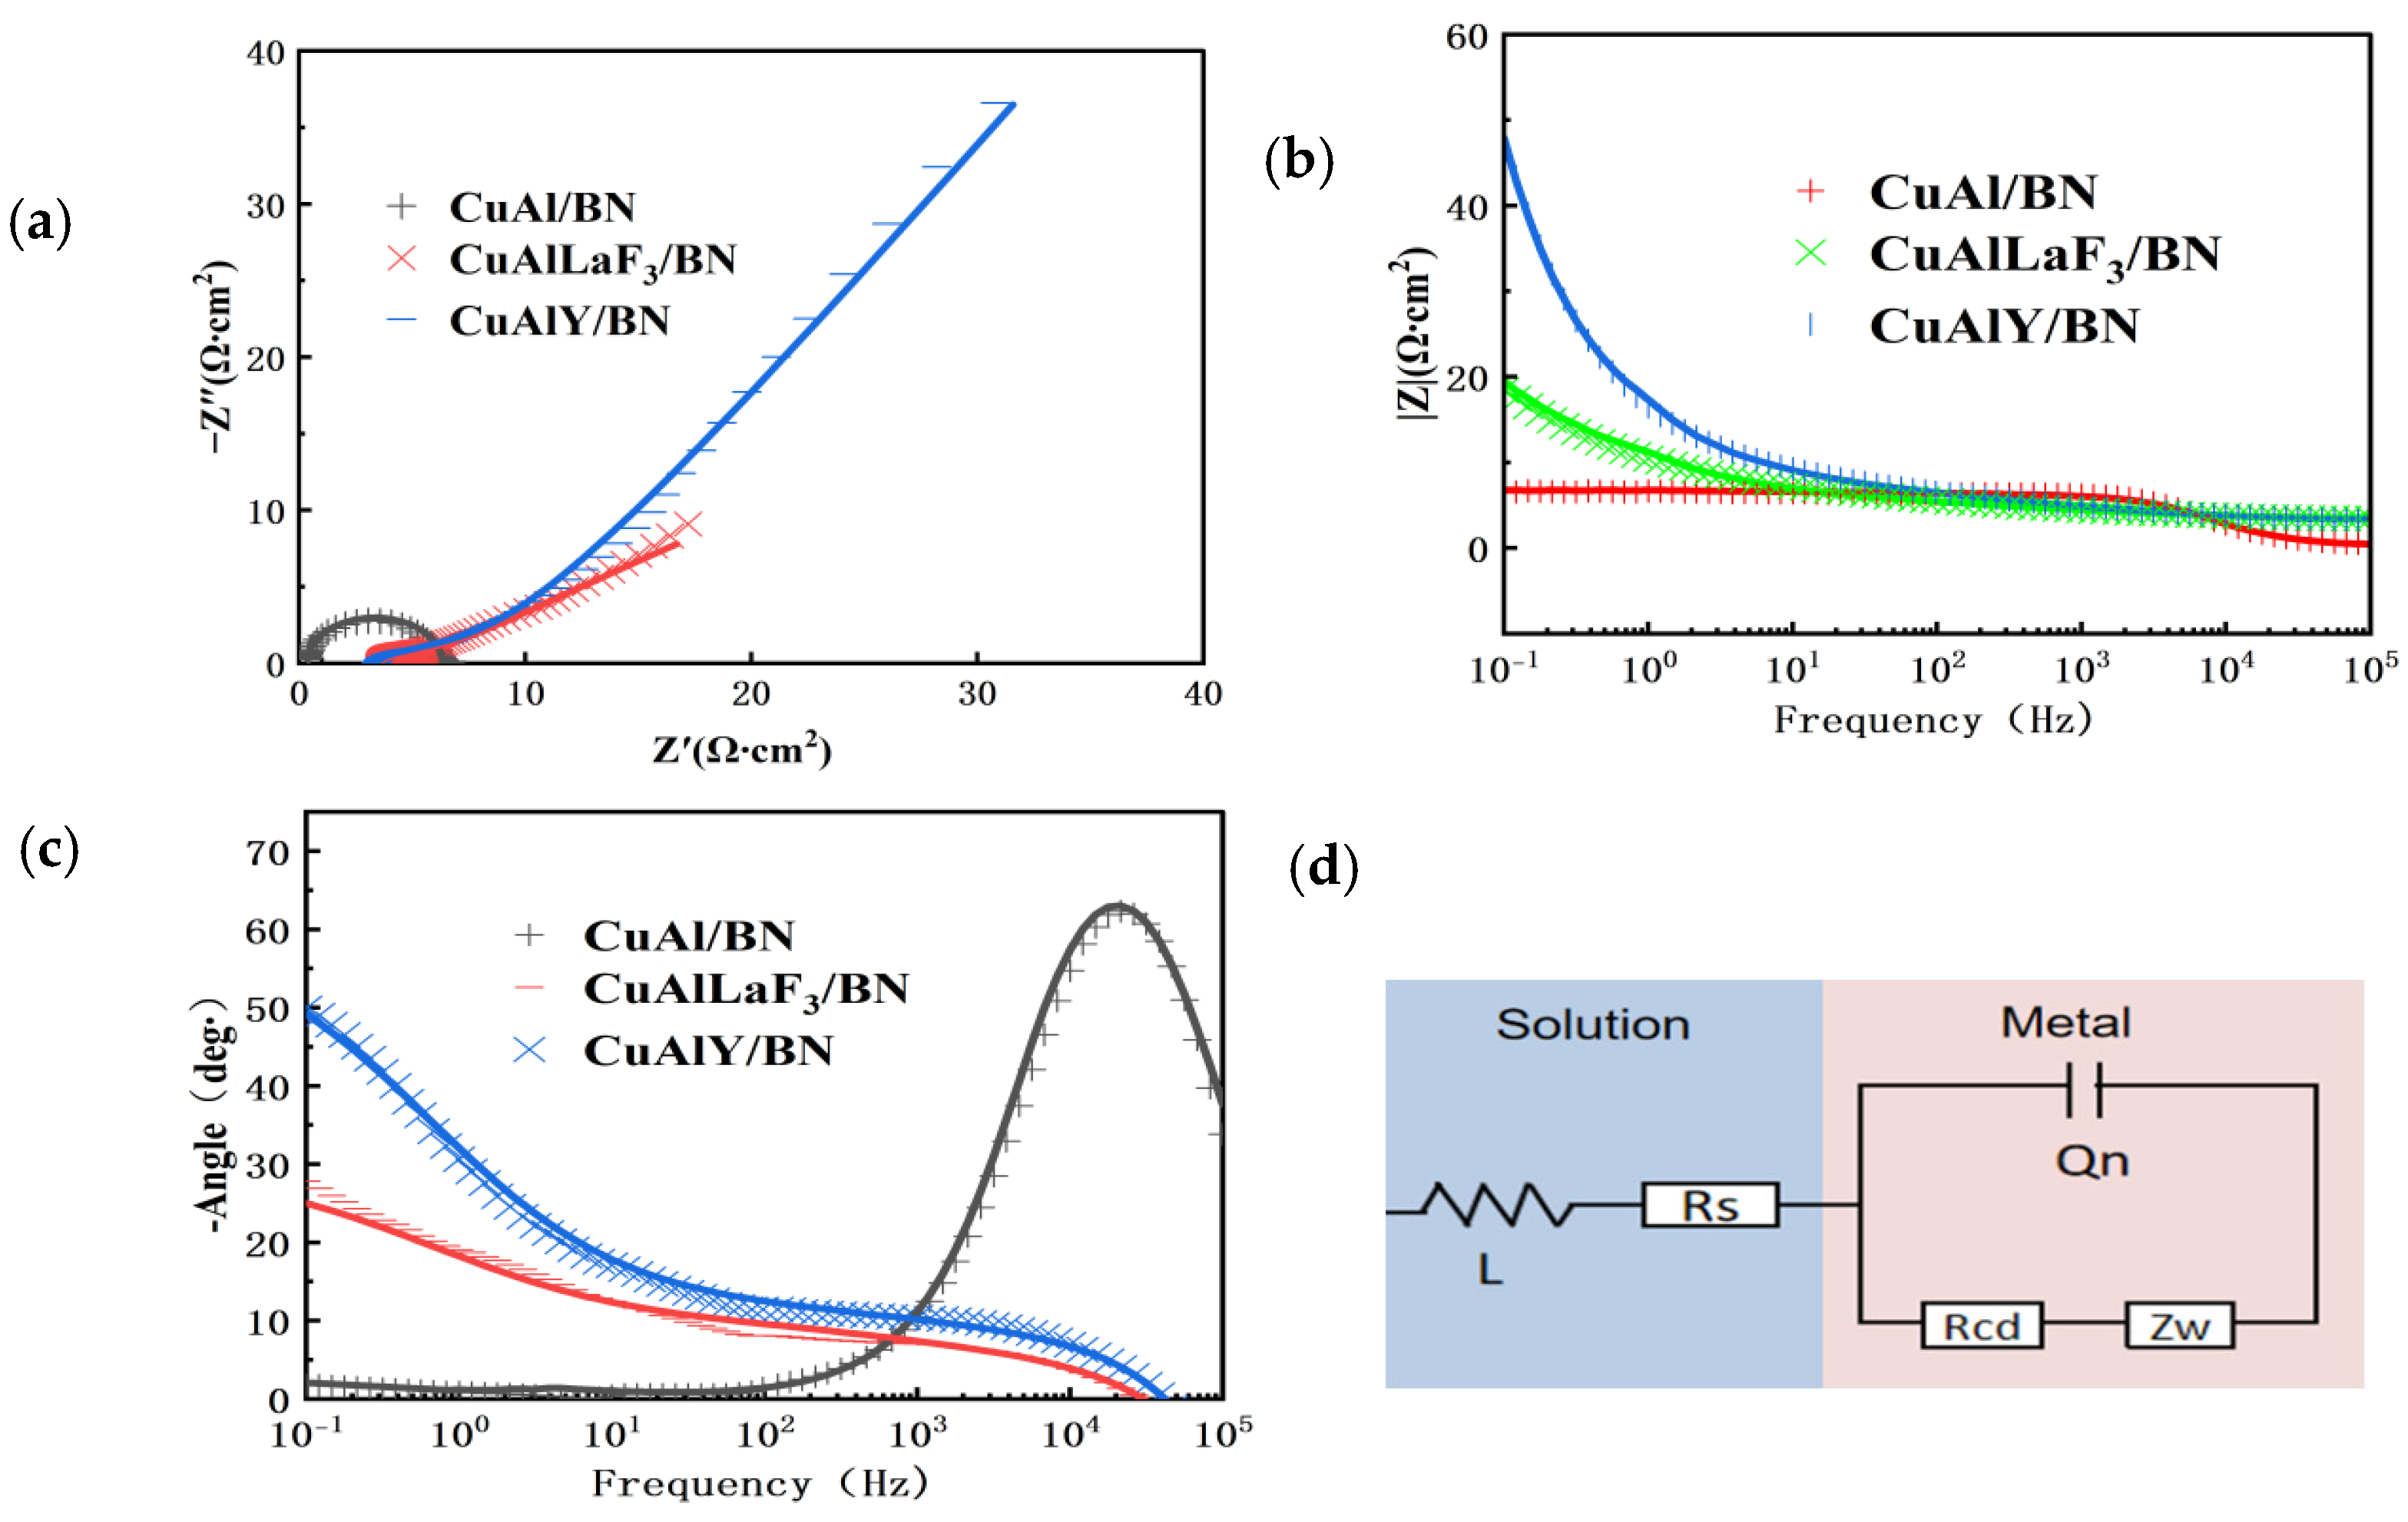
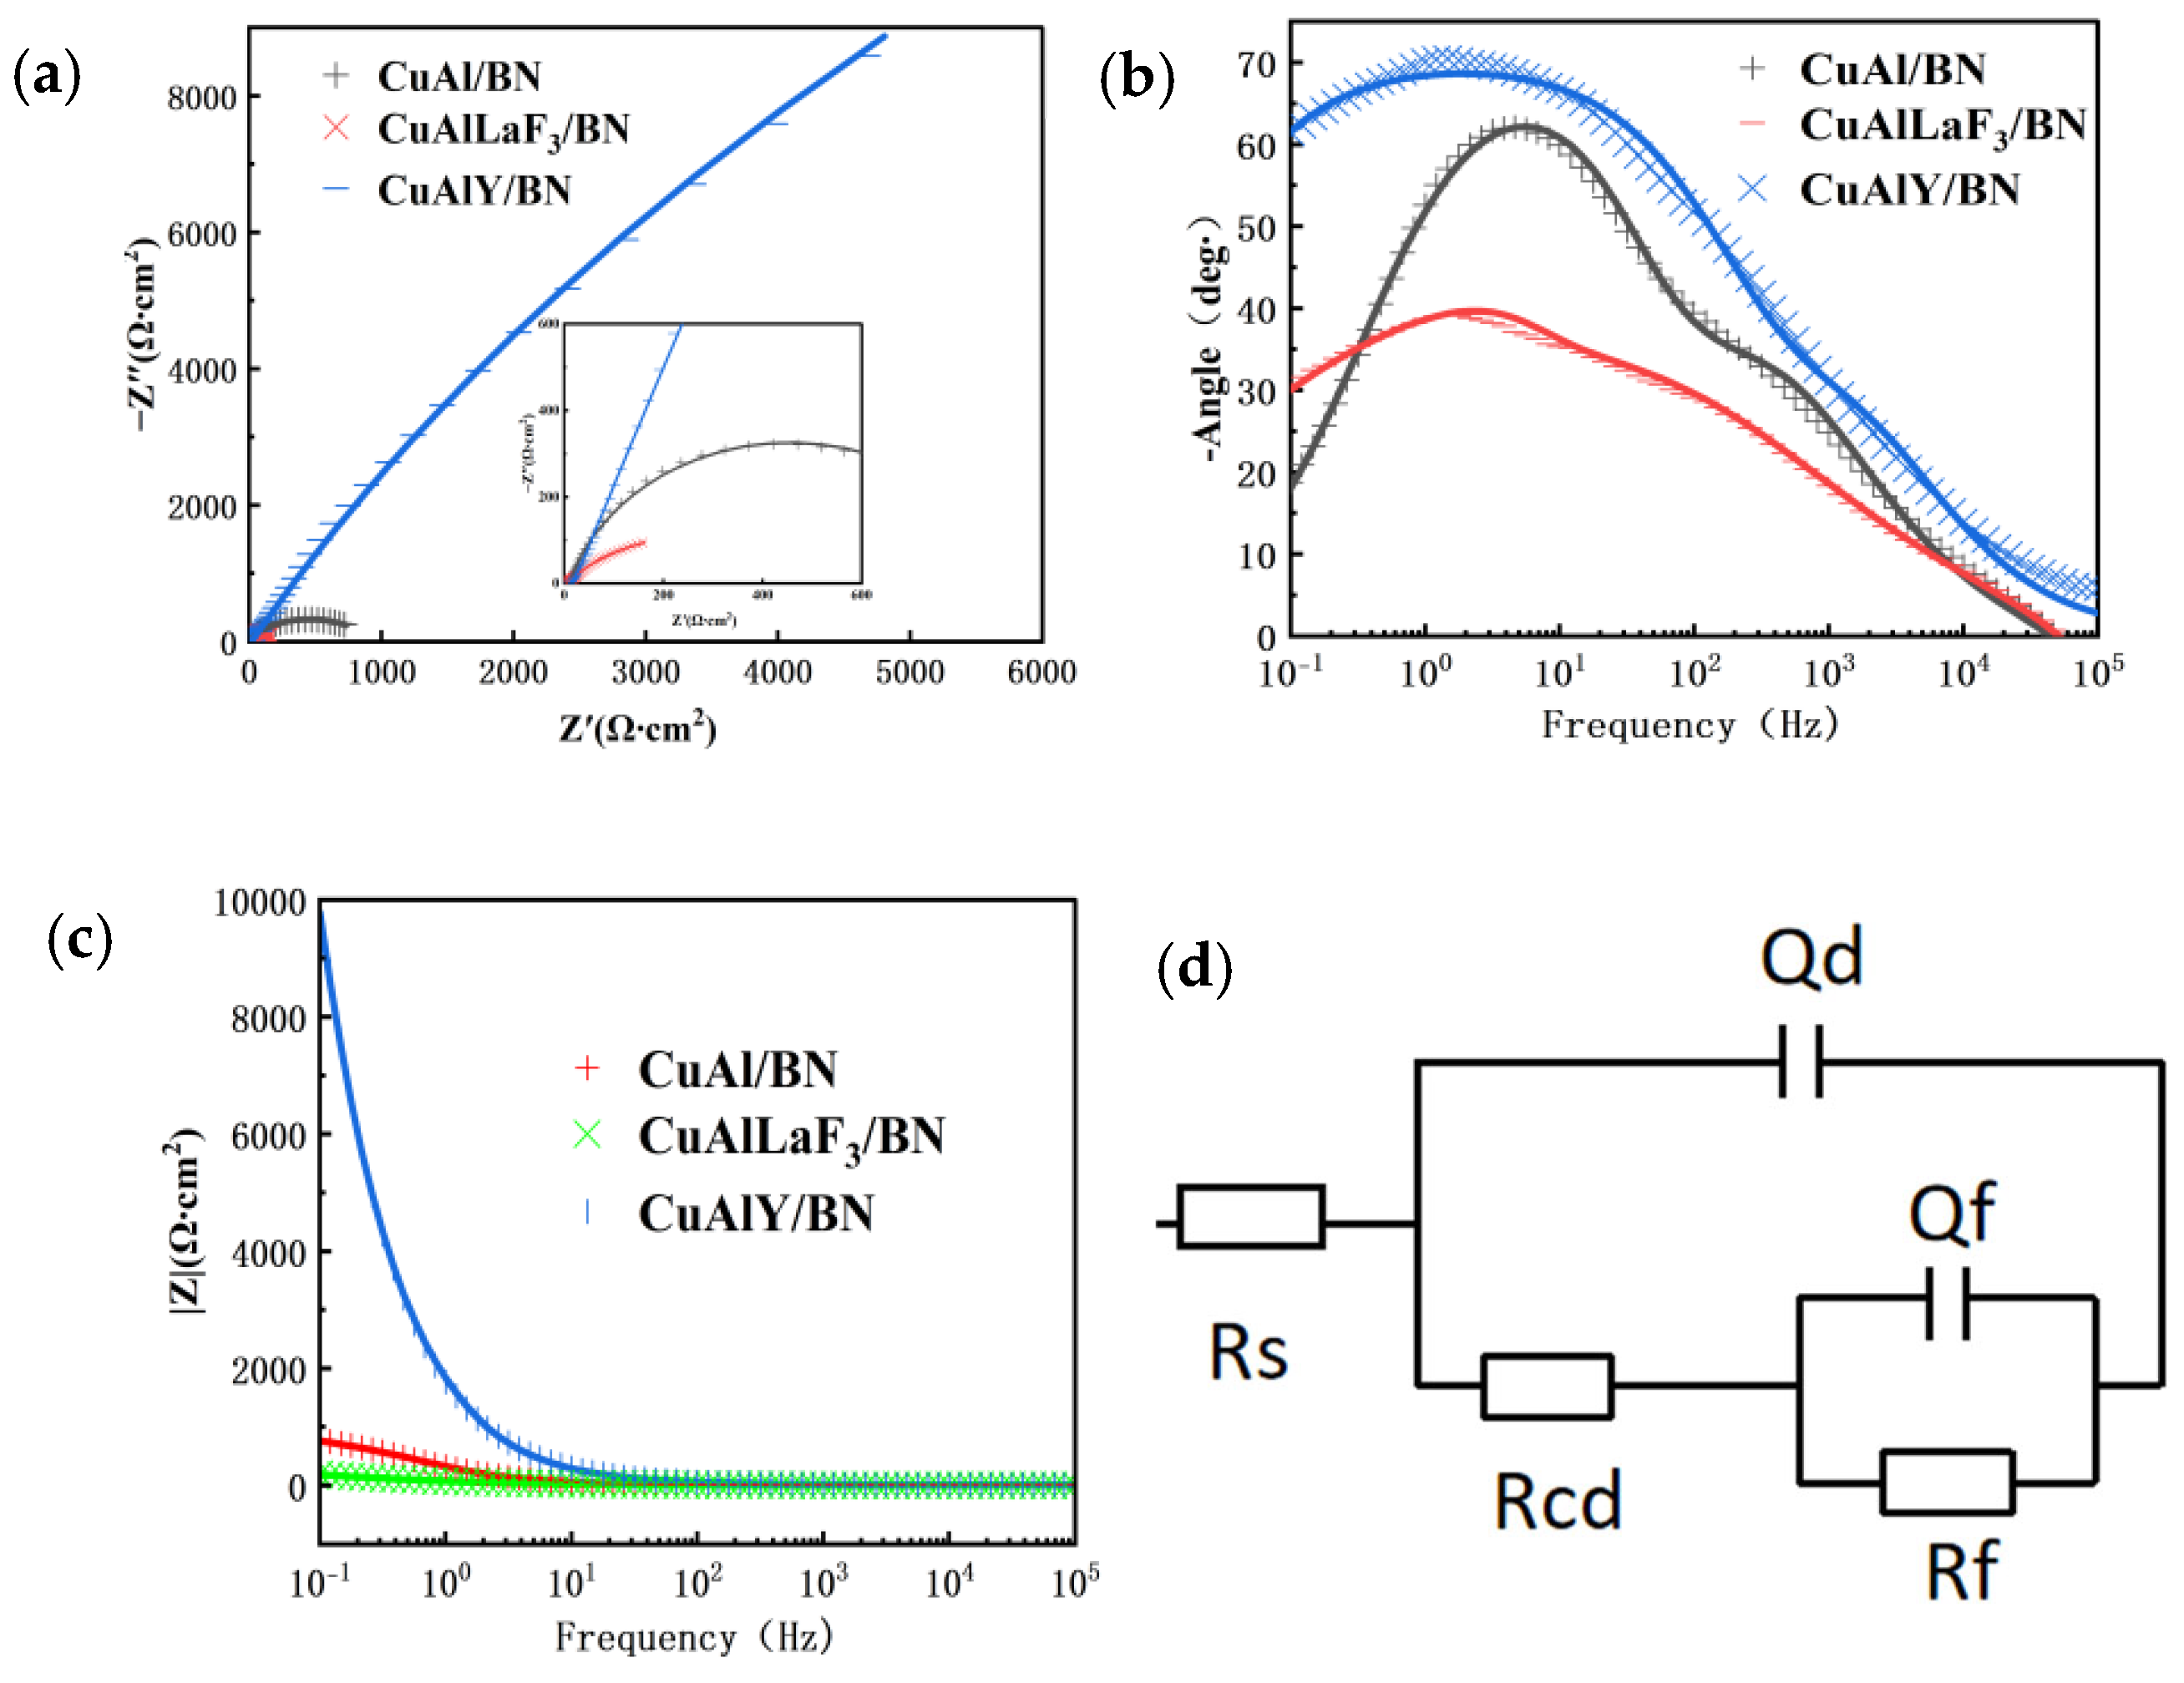
Coatings in oceanic environments predominantly undergo electrochemical corrosion, a process that adheres to the established principles of electrochemical corrosion science. To simulate these conditions, CuAl/BN, CuAlLaF3/BN, and CuAlY/BN coatings were subjected to corrosion testing in a 5 wt.% NaCl aqueous solution at a temperature of 35 °C. The open-circuit potential test results for the coatings are shown in Figure 2a. It is evident that the CuAl/BN coating exhibited the highest OCP (−442 mV) among the tested samples. The CuAlLaF3/BN and CuAlY/BN coatings followed in sequence, with respective OCP values of −501 mV and −528 mV after a testing duration of 180 min. The temporal fluctuations in the OCP values for all three coatings are indicative of localized corrosion events, as noted in [36]. The polarization curves of the three coatings in 5 wt.% NaCl aqueous solution are shown in Figure 2b. It can be seen that none of the three coatings underwent significant passivation during the test. The self-corrosion potential (Ecorr) and self-corrosion current (Icorr) values for each coating were determined utilizing the Tafel extrapolation method. The CuAl/BN coating demonstrated superior corrosion resistance compared to the CuAlLaF3/BN and CuAlY/BN coatings, as evidenced by its more positive self-corrosion potential and lower self-corrosion current. Specifically, the self-corrosion potentials for the CuAl/BN, CuAlLaF3/BN, and CuAlY/BN coatings were measured at −638 mV, −696 mV, and −818 mV, respectively. Correspondingly, the self-corrosion currents were 192 µA for CuAl/BN, 438 µA for CuAlLaF3/BN, and 418 µA for CuAlY/BN, indicating the progressive susceptibility to corrosion in the given order.
Based on the open-circuit potential (OCP) and polarization curve tests conducted, the CuAl/BN coating demonstrated the most favorable electrochemical behavior, with the highest OCP and self-corrosion potential (Ecorr), as well as the lowest self-corrosion current (Icorr), indicating superior corrosion resistance. In contrast, the CuAlY/BN coating exhibited the poorest corrosion resistance among the three. The introduction of LaF3 and yttrium into the CuAl/BN coating appears to have a detrimental effect on its corrosion resistance, particularly in the case of the CuAlY/BN coating. This reduction in corrosion resistance is predominantly attributed to the high chemical reactivity of the rare earth element yttrium. The reactivity of yttrium, which is intermediate between that of sodium and magnesium, when doped into the coating material, significantly elevates the chemical activity of the material. Consequently, electron transfer is facilitated, rendering the material more susceptible to corrosion in a saline environment.

3.2.2. EIS Testing

Electrochemical impedance spectroscopy (EIS) measurements were conducted on the three distinct seal coatings immersed in a 5 wt.% NaCl aqueous solution. The resulting Nyquist plots are shown in Figure 3a. Typically, the impedance spectrum exhibits a high-frequency capacitive arc and a low-frequency linear region. The radius of the capacitive arc in the Nyquist diagram is indicative of the coating’s corrosion resistance; a larger radius corresponds to better resistance. In this case, the CuAl/BN coating demonstrates the largest capacitive arc, signifying its superior corrosion resistance. The high-frequency region in the Bode plot reflects the interfacial corrosion characteristics between the material and the corrosive solution, while the low-frequency region is indicative of the material’s inherent properties. Specifically, the impedance modulus (|Z|) at low frequencies can be directly associated with the material’s corrosion resistance; a higher impedance modulus implies enhanced resistance. As illustrated in Figure 3b,c, the impedance modulus and phase angle of the materials in the low-frequency region decrease in the order of CuAl/BN, CuAlLaF3/BN, and CuAlY/BN, with the CuAl/BN coating showing the best corrosion resistance and the CuAlY/BN coating the worst. The Nyquist plots suggest that the corrosion process for these coatings is governed by electron transfer at high frequencies and material transfer at low frequencies.
The equivalent circuit depicted in Figure 3d was utilized to model the EIS data, which were fitted using Zsimpwin software. In the Bode plot, the curves for all three coatings exhibit a peak in the angle-lgf (angular frequency) representation, signifying the presence of a time-constant in the corrosion process. The constant phase element Q, known as the CPE, is employed to represent the nonideal capacitive behavior observed in the system. The equivalent circuit model is formulated as LR(Q(RW)), where L denotes the inductive resistance, Rs represents the electrolyte resistance, Qn refers to the double-layer capacitance, Rcd is the charge-transfer resistance, and Wz signifies the Warburg impedance. The fitting error value (s2) for the electrochemical impedance, as detailed in the accompanying table, is on the order of 10−3, which is considered acceptable and confirms that the chosen equivalent circuit model is adequate for the data.
Furthermore, the table includes parameters for the constant phase element, denoted by n, which is related to the surface roughness of the specimen. An increased value of n corresponds to a denser passivation film on the specimen’s surface, which more effectively impedes the corrosive medium and consequently reduces the corrosion rate.
The results in Table 3 show that the CuAl/BN coating has the largest charge-transfer resistance, which is nearly two times higher than the other two coatings. This coating also exhibits the largest Warburg impedance (Wz) and the constant phase element parameter (n), thereby demonstrating superior corrosion resistance. Research on the AC impedance spectra of metal oxides and hydroxides has established that a value of n less than 1 is indicative of dispersion effects. These effects are attributed to various physicochemical phenomena, including atomic-scale inhomogeneities, variations in crystal structures or the presence of defects, and surface adsorption properties. Such factors result in local variations in the interfacial capacitance of the electrodes, leading to the characteristic n < 1 behavior observed [37]. In 5% NaCl solution, a nonuniformly distributed dense passivation film layer was formed on the surface of the specimen under the combined effect of various factors such as Cl, dissolved oxygen, and temperature, which caused changes in the electrochemical processes on the surface of the aluminum alloy in contact with seawater. The CuAl/BN coatings have the largest n and Rct values, the former indicating that the smooth surface of the coatings has fewer corrosion products, and the latter positively correlating with the corrosion resistance, which can indicate that the CuAl/BN coatings have the largest n and Rct values. The latter is positively correlated with the corrosion resistance, which indicates that the CuAl/BN coating has better corrosion resistance than the other two coatings, which is consistent with the result that the CuAl/BN coating has the lowest corrosion current density in the polarization curve test.

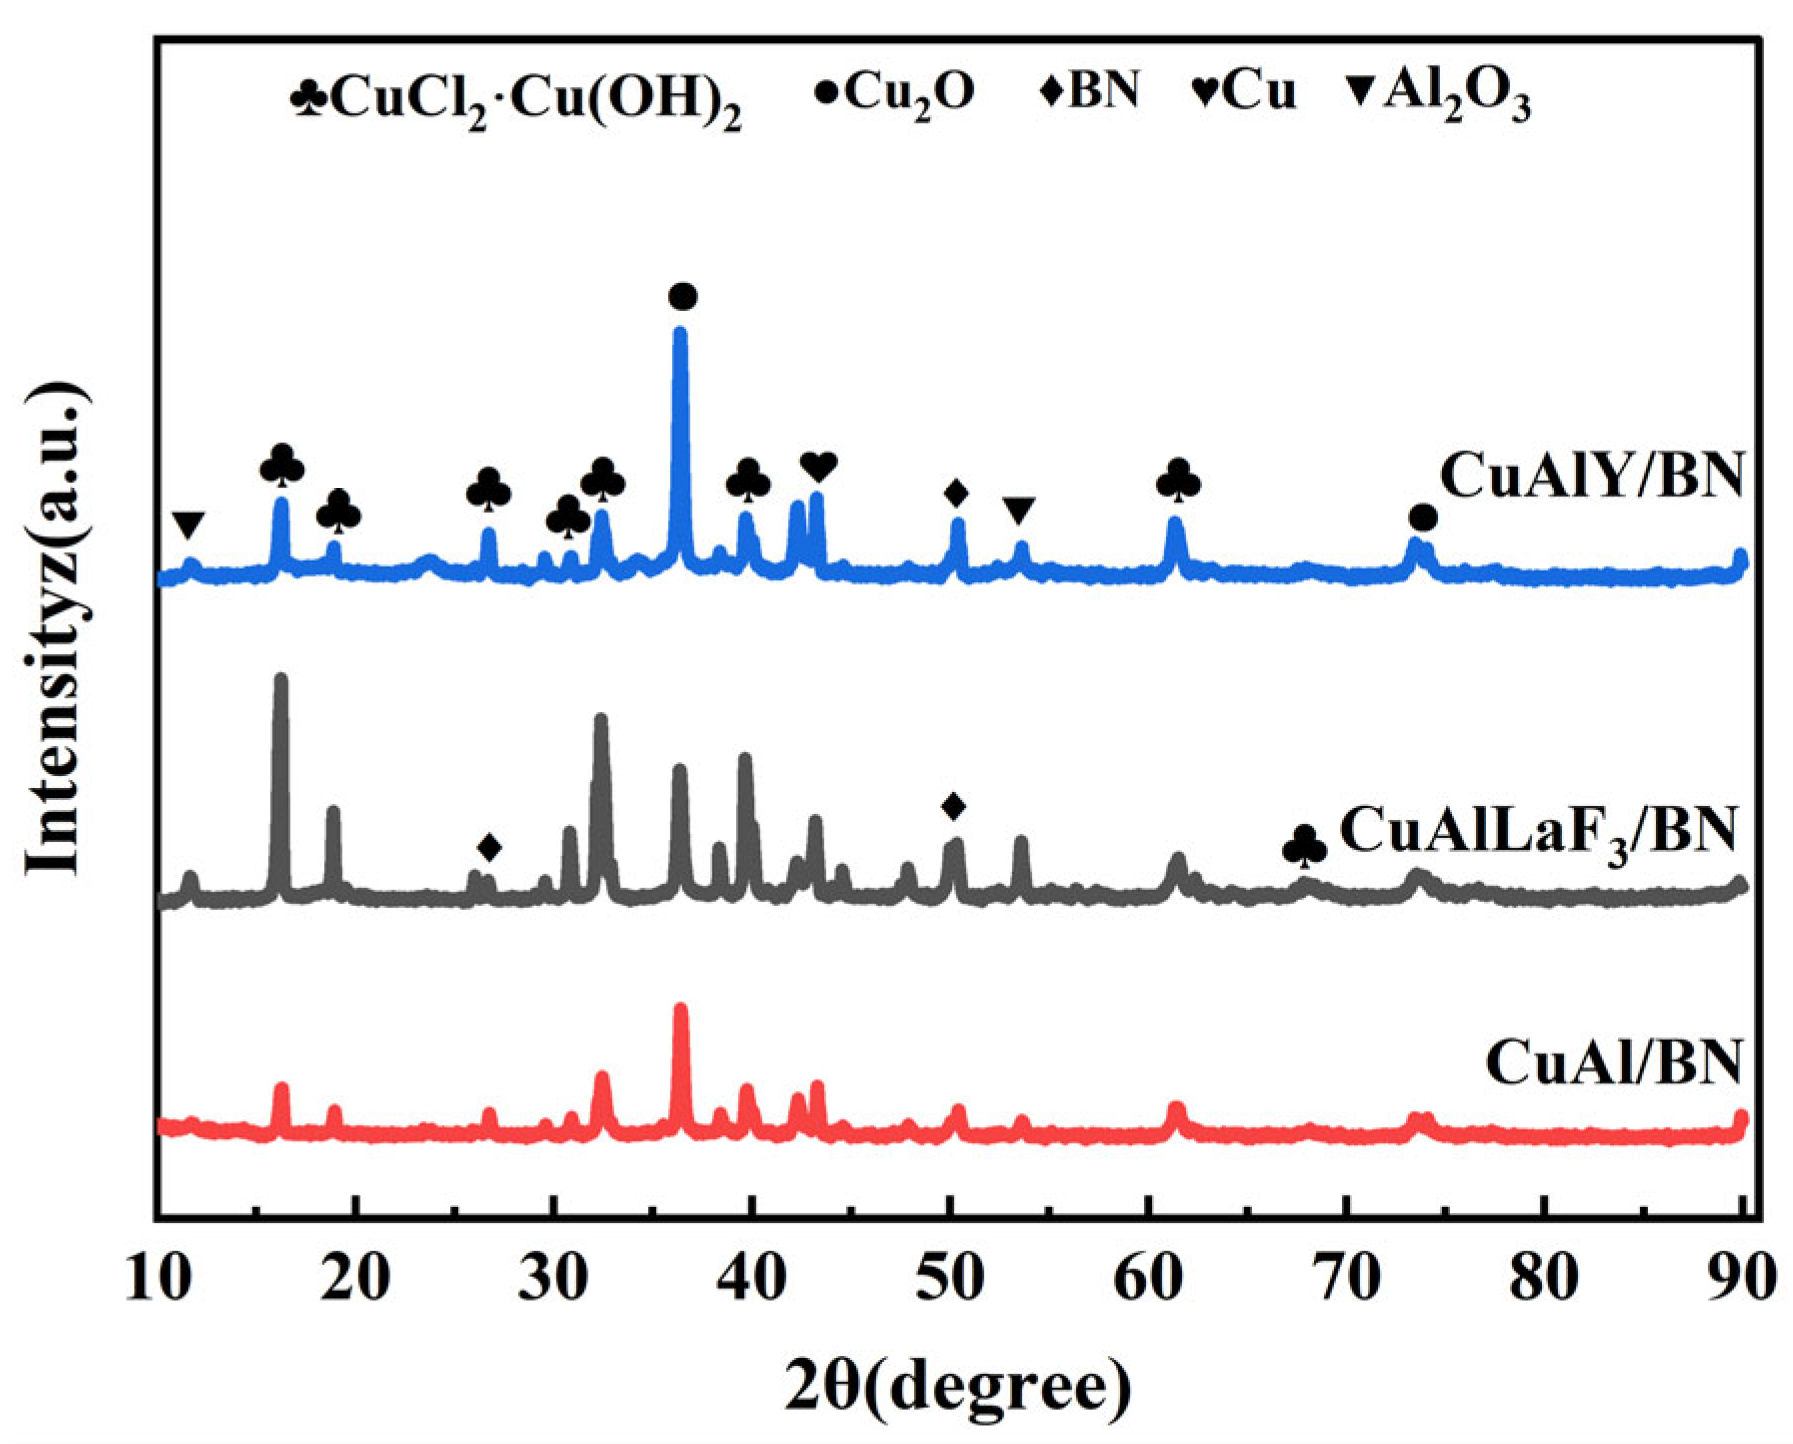
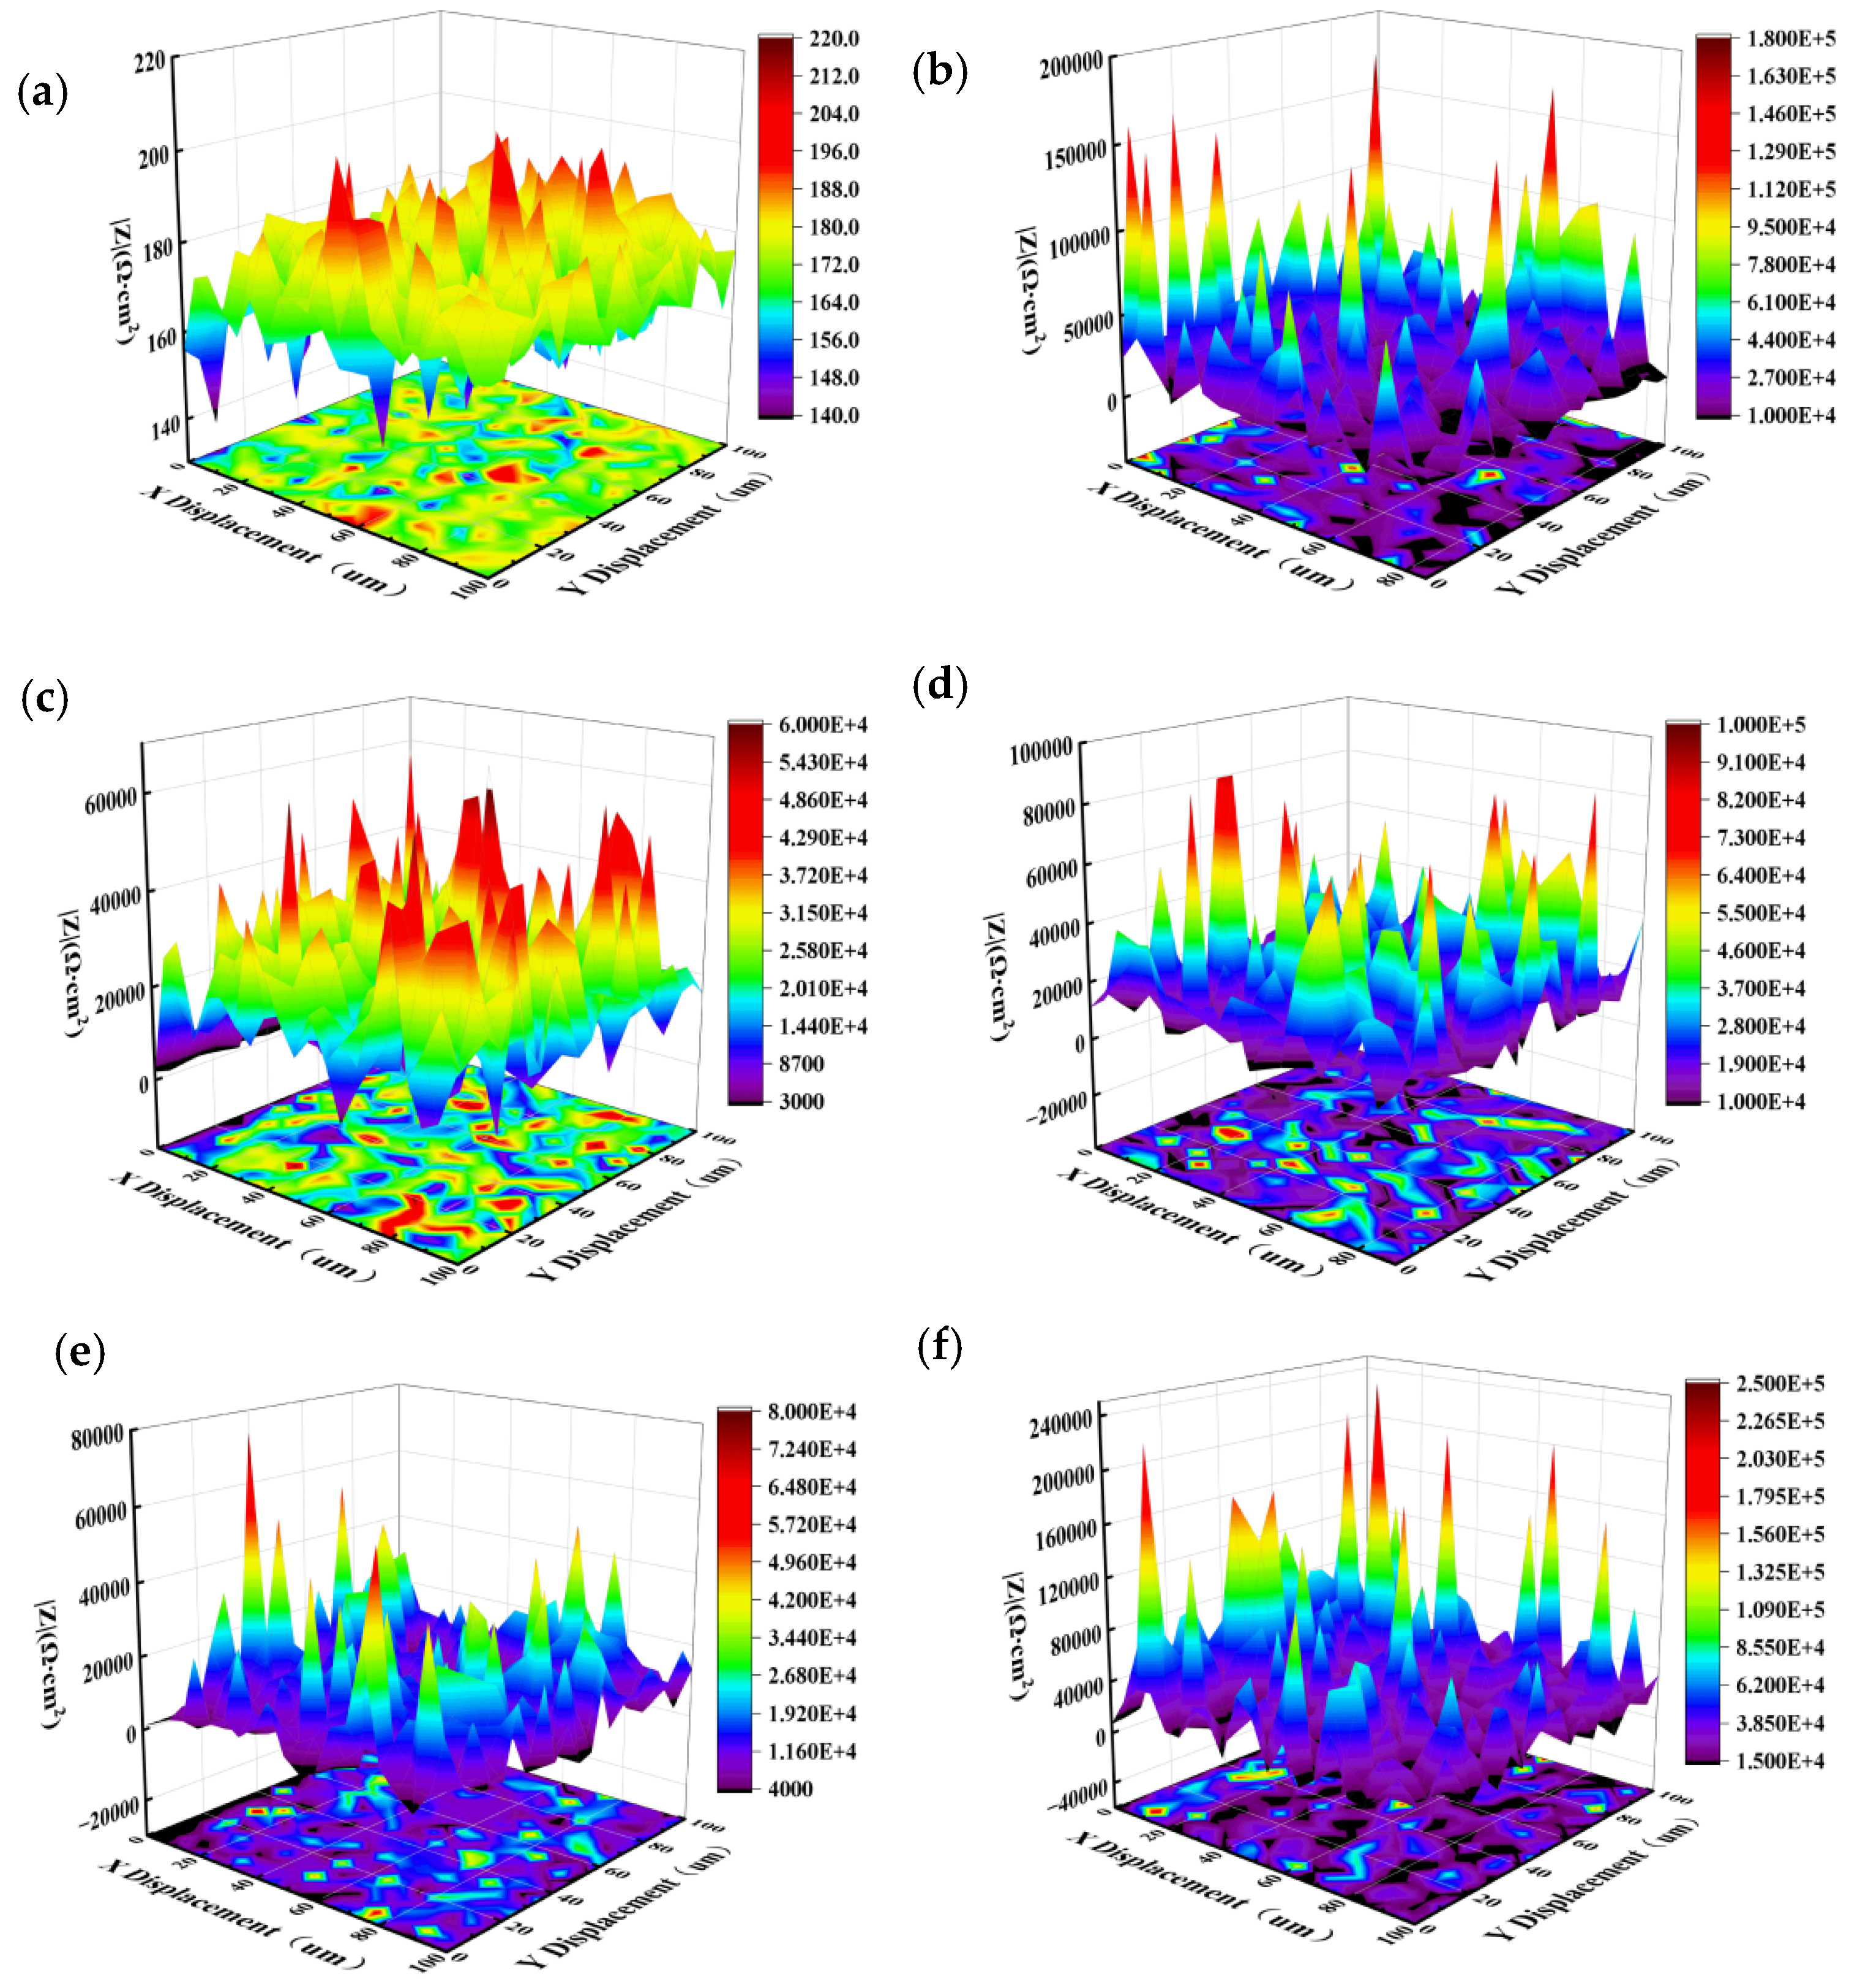
3.3. Changes in the Organization and Morphology of the Coatings after Salt-Spray Corrosion

The encapsulated coating specimens were put into the salt-spray box for the corrosion test according to the requirements, and the effect of corrosion time on the organization and properties of the coating was investigated. Initial observations after 24 h exposure revealed the formation of green corrosion products on the coating surfaces. Prolonging the corrosion period led to a progressive accumulation of these products. The CuAl/BN coatings exhibited a particularly thick layer of green corrosion products after 960 h of exposure. During the testing, it was observed that as the corrosion time extended, green corrosion products consistently dripped from the coating surfaces onto the chamber floor. After 960 h salt-spray corrosion, the CuAlLaF3/BN and CuAlY/BN coatings displayed severe degradation. The ongoing corrosion process resulted in a continuous buildup of surface corrosion products, accompanied by the emergence of blue-green deposits. As depicted in Figure 4b, the CuAlLaF3/BN coating showed signs of erosion that penetrated through to the coating’s interior layer, resulting in the formation of numerous cracks.
The X-ray diffraction (XRD) spectra for the three coatings are presented in Figure 5. Analysis of these spectra reveals that the predominant corrosion products formed on all three coatings are CuCl2·Cu(OH)2 and Cu2O. A comparative assessment of the diffraction peak intensities corresponding to these phases indicates that the CuAlLaF3/BN and CuAlY/BN coatings exhibit higher intensities for the CuCl2·Cu(OH)2 phase than the CuAl/BN coating. This disparity suggests that the CuAlLaF3/BN and CuAlY/BN coatings have undergone more severe corrosion compared to the CuAl/BN coating. The salt-spray environment primarily affects the copper component of the material. Initially, a Cu2O product film forms on the coating surface. Subsequently, the chloride ions (Cl) present in the solution act to degrade the Cu2O film, facilitating its transformation into CuCl2·Cu(OH)2 and CuCl2. The proposed reaction sequence is as follows:
2Cu + H2O → Cu2O + 2H+ + 2e
Cu2O + H2O + 2Cl → CuCl2Cu(OH)2 + 2e
Cu2O + 4Cl + H2O → 2CuCl2 + 2OH + 2e

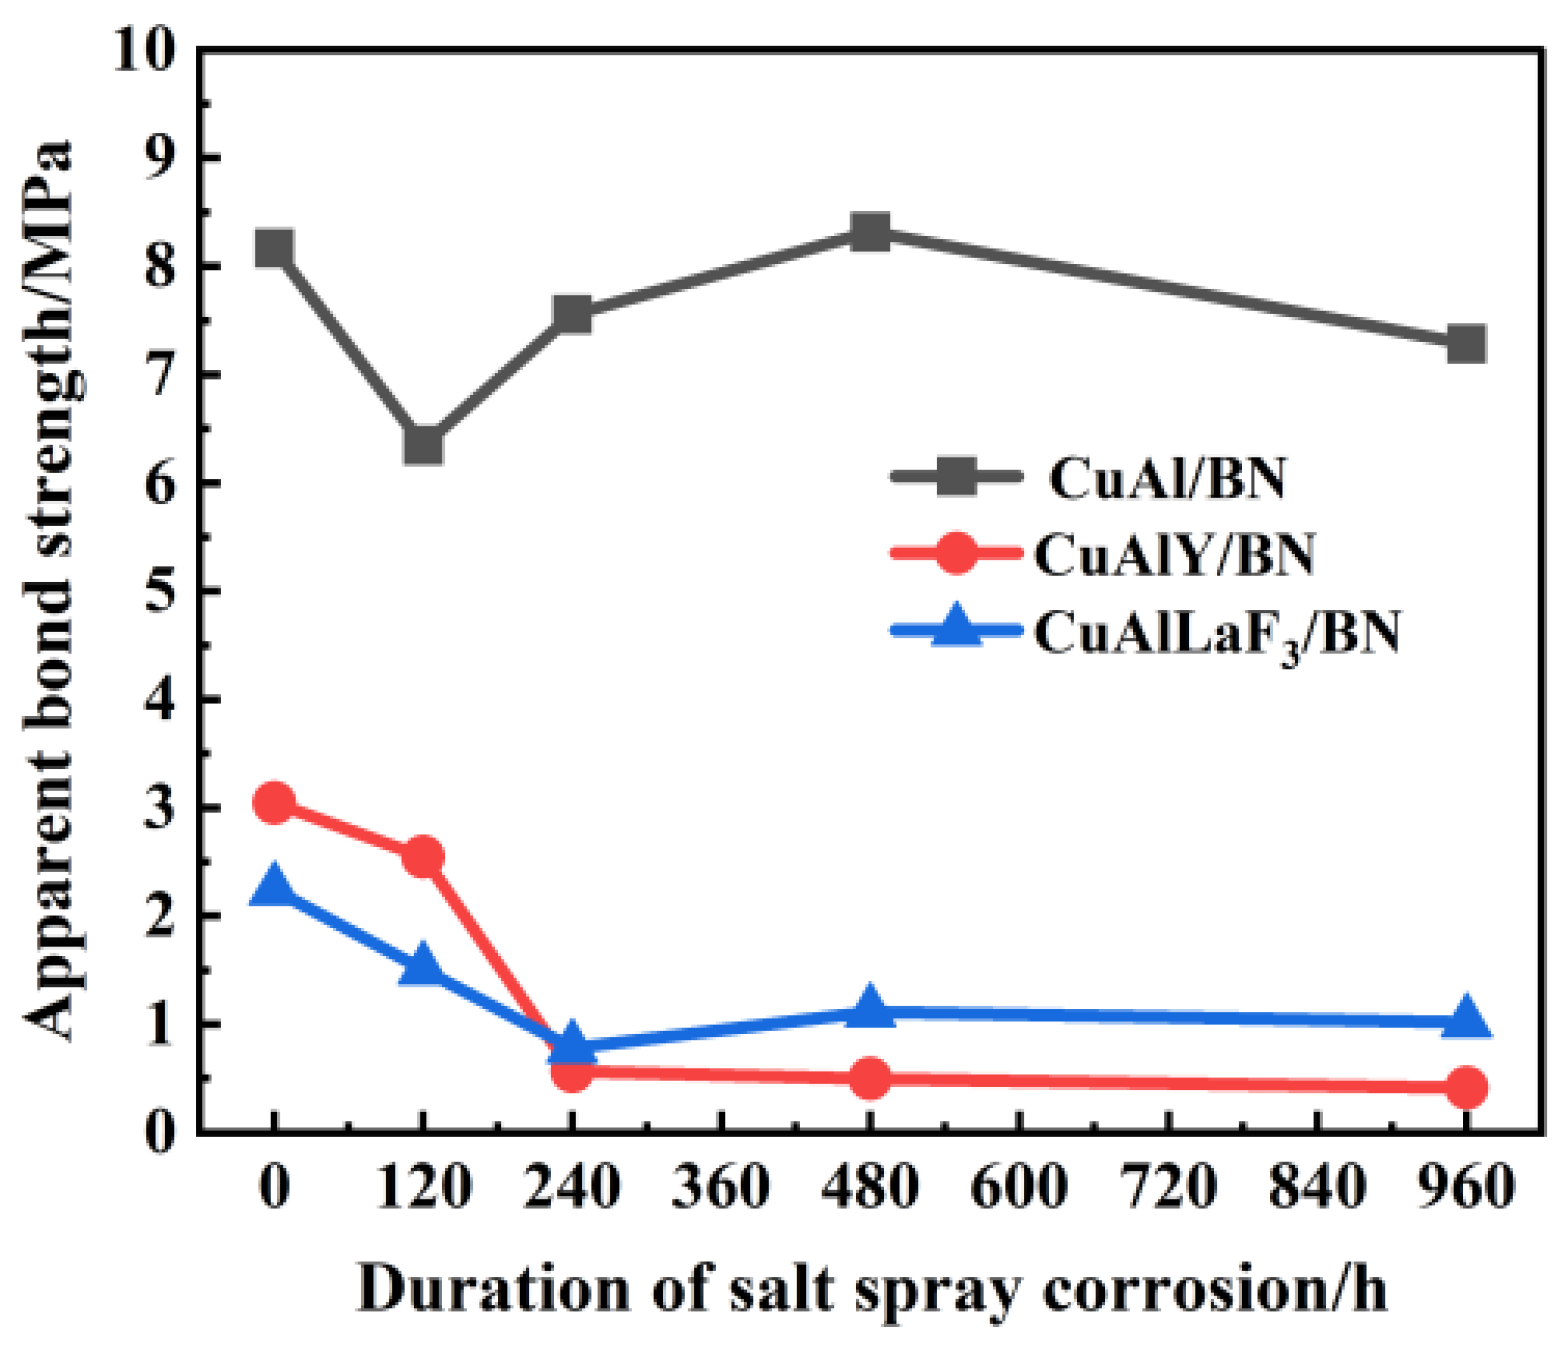
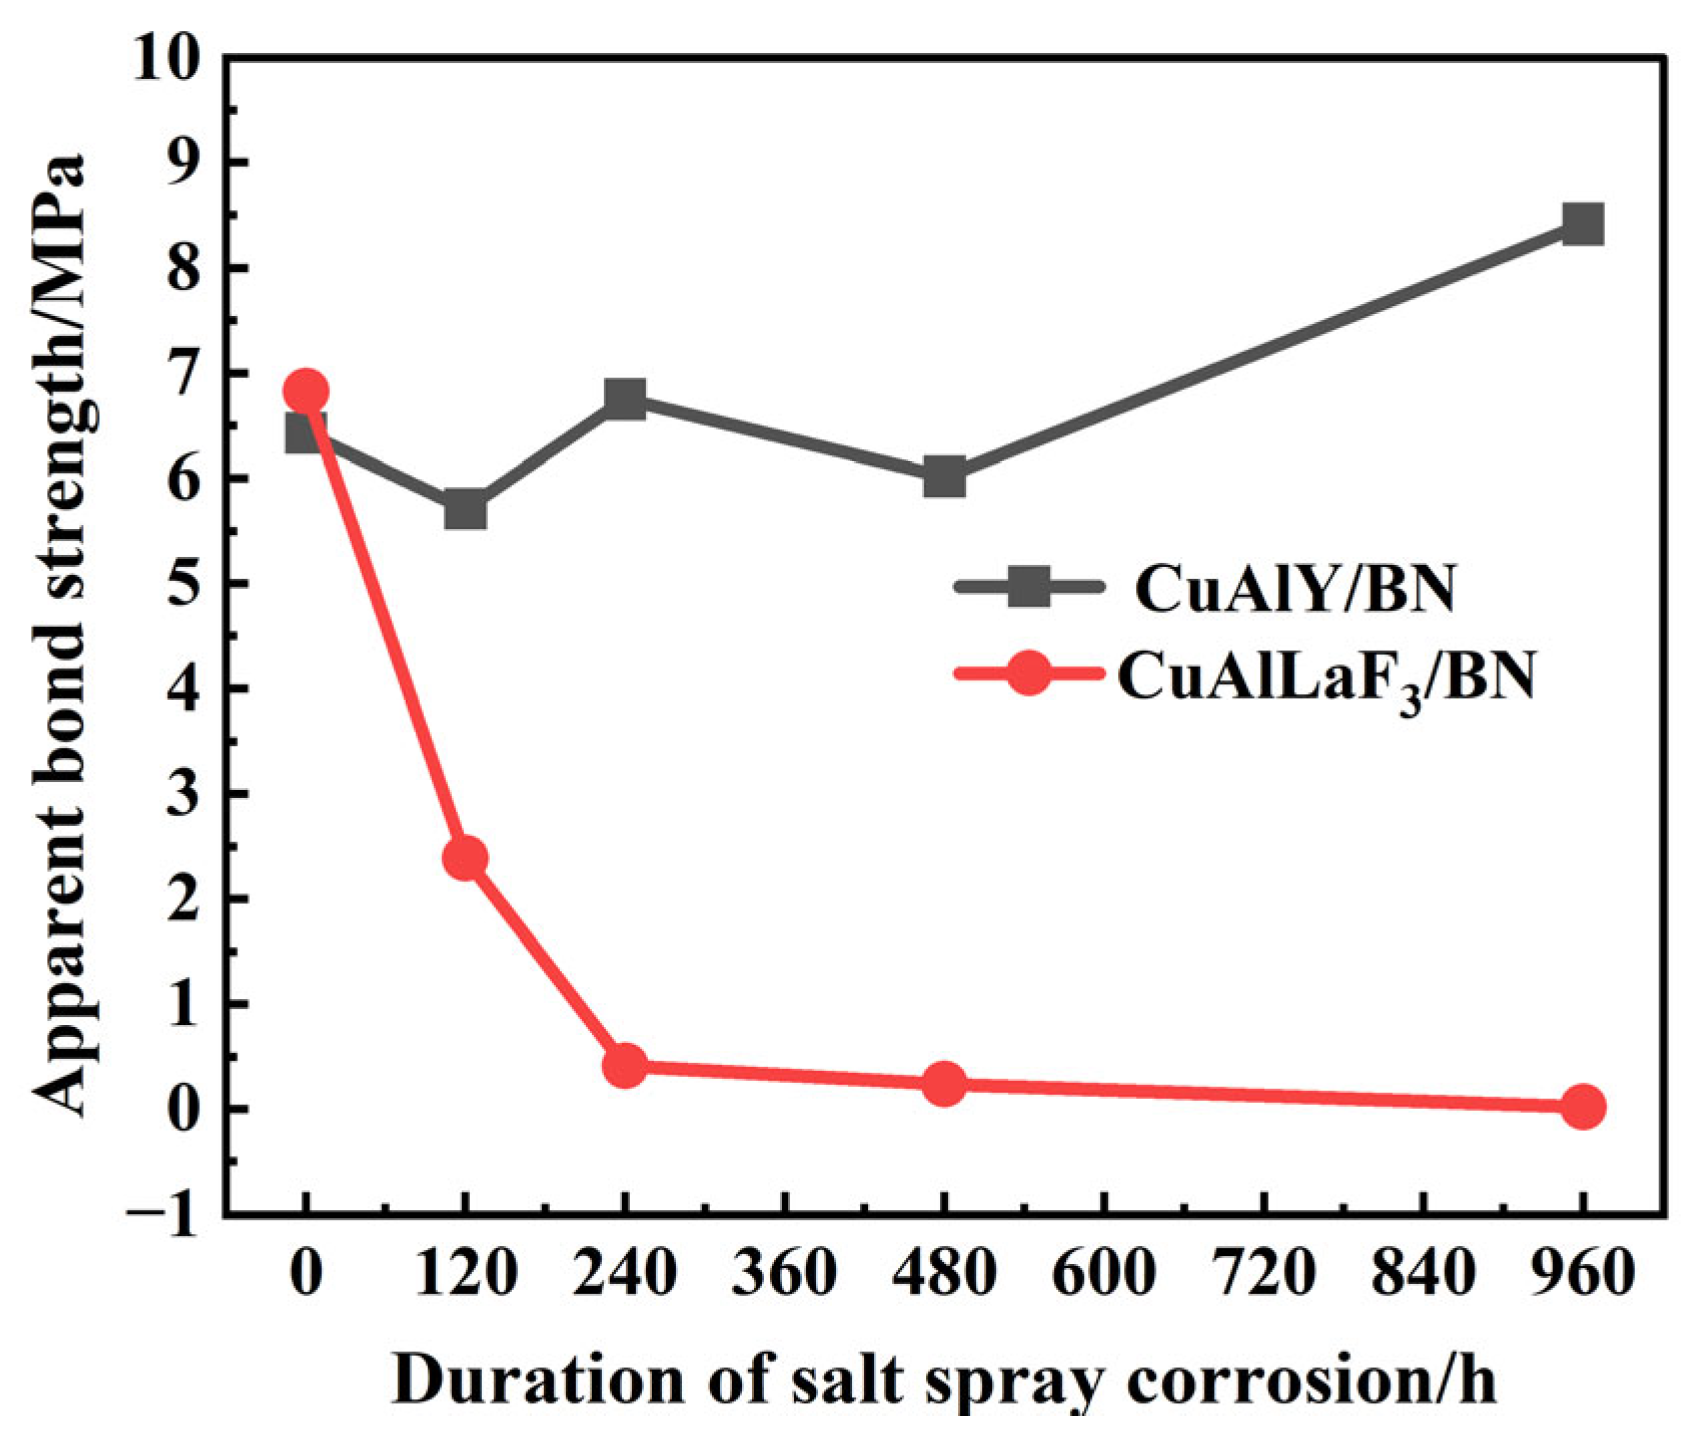
3.4. Coating Bond Strength

Adequate adhesion between the coating and the substrate is essential for the proper functioning of seal coatings. Figure 6 presents the test results for the bonding strength of CuAl/BN, CuAlLaF3/BN, and CuAlY/BN coatings after exposure to various durations of corrosion, as well as the correlation between bonding strength and corrosion exposure time. The data indicate that the bonding strength of the CuAl/BN coating remains largely unaffected by salt-spray corrosion. Specifically, the bonding strength for specimens from the same batch, prepared by spray and subjected to corrosion for 120 h, 240 h, 480 h, and 960 h, was consistently measured at approximately 7.5 ± 1.2 MPa, with no notable decline observed over time. In contrast, the bonding strength of the CuAlLaF3/BN and CuAlY/BN coatings exhibited a significant decline after 240 h of corrosion testing, with a reduction exceeding 60%. This substantial decrease in bond strength is indicative of severe corrosion effects. The internal corrosion of these coatings following salt-spray exposure leads to the formation of cracks, which compromise the structural integrity and performance of the coatings. The formula for bond strength is
F = G/S
where F is the bonding strength of the coating (N/m2), G is the maximum load in the coating tensile cracking process (N), and S is the area of the coating section (m2).

3.5. 550 °C Oxidation Pretreatment of the Coating

3.5.1. Electrochemical Characterization of the Coatings after Oxidation Pretreatment

The experimental outcomes demonstrate that the incorporation of low concentrations of rare earth elements does not initially enhance the formation of a passivation film on the coatings, nor does it significantly augment their inherent corrosion resistance. However, considering the coatings are designed for use in high-temperature aerobic environments subject to thermal cycling, a subsequent oxidative pretreatment at 550 °C in a muffle furnace was applied. This treatment induces the rare earth elements to catalyze the formation of a more substantial passivation layer composed of copper and aluminum oxides, thereby enhancing the coating’s corrosion resistance. Figure 7 illustrates the open-circuit potential (OCP) and potentiodynamic polarization curves for the three coatings, while Table 4 details the pertinent corrosion parameters. When compared to coatings without this high-temperature oxidative pretreatment, the corrosion resistance of all three coatings is observed to improve. Notably, the CuAlY/BN coating exhibits a marked improvement in corrosion resistance and more pronounced passivation behavior, evidenced by an extended passivation region in the polarization curves.
Furthermore, the CuAlY/BN coating displays the most favorable electrochemical properties: the highest OCP (−50.4 mV), the lowest self-corrosion potential (Ecorr = −269.9 mV), and the lowest self-corrosion current (Icorr = 4.11 mA). The self-corrosion current of this coating is nearly 100 times less than that of a coating without high-temperature oxidative pretreatment. These electrochemical parameters substantiate that the addition of low levels of the rare earth element yttrium effectively improved the corrosion resistance of the coatings, corroborating the enhancement of the CuAl/BN coating’s corrosion resistance achieved in our study.
The electrochemical impedance spectra for the three coatings subjected to high-temperature oxidation pretreatment were analyzed. The resulting data were processed using ZsimpWin software to generate the AC impedance diagrams, which are presented in Figure 8. The corresponding impedance parameters derived from the equivalent circuits are detailed in Table 5. The equivalent circuit model applied for the impedance spectroscopy, depicted in Figure 8, accounts for the inhomogeneous nature of the oxide film by incorporating a constant phase element (CPE), represented by the symbol Q. The circuit model is formulated as R(Q(R(R(RQ)))), where Rs denotes the electrolyte resistance, Qf represents the capacitance of the oxide film, Rf is the resistance of the oxide film, Qd signifies the bilayer capacitance, and Rcd is the charge-transfer resistance. Analysis of the AC impedance (Figure 8) reveals a substantial increase in the capacitive arc resistance for the CuAlY/BN coating following the high-temperature oxidation pretreatment, with the polarization resistance increasing to an order of magnitude of 104. The Bode plot further illustrates that the CuAlY/BN coating exhibits a phase angle and impedance modulus significantly greater than those of the other two coatings in the low-frequency region. This finding confirms the effectiveness of the oxidation pretreatment in augmenting the corrosion resistance of the CuAlY/BN coating.
The impedance parameters derived from the equivalent circuits are detailed in Table 5. Notably, the polarization resistance (Rp) of the CuAlY/BN coating, calculated as the sum of the charge-transfer resistance (Rcd) and the passivation film resistance (Rf), is observed to be two orders of magnitude higher than those of the CuAl/BN and CuAlLaF3/BN coatings. Specifically, the passivation film resistance (Rf) for the CuAlY/BN coating is significantly greater than its charge-transfer resistance (Rcd). This disparity suggests that the enhanced corrosion resistance of the CuAlY/BN coating is predominantly conferred by the oxidized passivation film, with the contribution from the underlying, more loosely structured material being less significant. Furthermore, the dispersion coefficient (n2) associated with the dense oxide layer on the surface of the CuAlY/BN coating is comparatively higher. This elevated value of n2 indicates a more stable passivation film with superior self-repair capabilities, a finding that aligns with the conclusions drawn from the polarization curve analysis.
Figure 9 shows the LEIS data for the coatings both before and after oxidation treatment. The LEIS analyses reveal that the coatings subjected to an oxidative pretreatment at 550 °C exhibit a substantial variation in corrosion resistance, with an improvement observed across all instances. Specifically, the average impedance value depicted in Figure 9f is the highest when compared to all other coating materials. This indicates that the impedance value of the CuAlY/BN coatings, following oxidation pretreatment, has been markedly elevated. The addition of yttrium (Y) not only enhances the overall impedance of the oxidized CuAlY/BN coatings but also positively influences the impedance at the microscopic level.

3.5.2. Coating Bond Strength after Oxidation Pretreatment

The tensile testing method was employed to evaluate the bond strength of CuAlY/BN and CuAlLaF3/BN coatings following high-temperature oxidation treatment and subsequent exposure to various durations of corrosion. The outcomes of these tests are depicted in Figure 10 Analysis of the data indicates that after 240 h of corrosion, the bond strength of the CuAlLaF3/BN coating diminishes to below 1 MPa, signifying a pronounced decrease and suggesting poor corrosion resistance. Conversely, the bond strength of the CuAlY/BN coating remains largely unaffected even after 960 h of continuous salt-spray corrosion. Interestingly, there is a slight increase in the bond strength observed for the CuAlY/BN coating after this extended period of corrosion.

4. Conclusions

The CuAlY/BN coatings, after oxidation at 550 °C, demonstrated superior corrosion resistance. This was evidenced by the highest open-circuit potential (EOCP = −50.4 mV), the most negative self-corrosion potential (Ecorr = −269.9 mV), and the lowest self-corrosion current (Icorr = 4.11 mA) measured in a 5 wt.% NaCl solution. Notably, the self-corrosion current of these coatings was nearly 100 times lower than that of the coatings without high-temperature oxidative pretreatment. Additionally, a broader passivation zone was observed, indicative of enhanced protective properties. After exposure to 960 h of salt-spray corrosion, there was no significant reduction in the bond strength of these coatings. In contrast, the addition of rare earth elements to CuAl/BN coatings did not improve their corrosion resistance and, in some cases, resulted in a decrease. However, the formation of rare earth oxides following the oxidation treatment was found to be beneficial in enhancing the corrosion resistance. For instance, while the oxidation of CuAlLaF3/BN coatings did improve their corrosion resistance to a certain degree, the improvement was not pronounced. After only 240 h of corrosion exposure, there was a significant reduction in the coating’s integrity. Therefore, the corrosion resistance of CuAl/BN coatings can be enhanced by the addition of rare earth elements and high-temperature oxidation treatment, and the corrosion resistance of CuAlY/BN coatings is significantly improved after high-temperature oxidation.
In this study, the microstructure and corrosion resistance of CuAl/BN, CuAlLaF3/BN and CuAlY/BN coatings were investigated with the starting point of corrosion-resistant and wear-resistant seal coatings, and corrosion-resistant seal coatings with excellent structure and stable performance were finally obtained. Furthermore, the microstructure and corrosion resistance of CuAl/BN, CuAlLaF3/BN, and CuAlY/BN coatings were investigated with the starting point of corrosion-resistant abradable seal coatings. In the future research, superior additive elements and additive quantities will be determined by means of phase diagram calculations and simulation, which will provide optimal corrosion-resistant coatings for the materials.

Author Contributions

Conceptualization, Y.L., C.H., H.Y., X.S., H.Z., Y.S., H.L., S.Y. and W.Z.; Methodology, Y.L., C.H., H.Y., X.S., H.Z., Y.S., H.L., S.Y. and W.Z.; Validation, Y.L.; Data curation, Y.L.; Writing—original draft, Y.L.; Writing—review & editing, C.H. All authors have read and agreed to the published version of the manuscript.

Funding

This research received no external funding.

Data Availability Statement

The original contributions presented in the study are included in the article, further inquiries can be directed to the corresponding author.

Conflicts of Interest

The authors declare no conflict of interest.

References

  1. Ma, R.; Liu, M. Research Progress on Preparation and Performance Evaluation of Seal Coatings in Titanium-Fire Retardant Coatings for Aero Engines. Mater. Prot. 2021, 54, 145–152. [Google Scholar]
  2. Cheng, T.; Wang, Z.; Dai, S.; Ding, K.; Ma, X. Research Progress of Ceramic-based High Temperature Sealing Coating for Aeroengines. J. Mech. Eng. 2021, 57, 126. [Google Scholar]
  3. Huang, W. Study of Preparation and Properties of Abradable Composite Seal Coating used in High Temperature. Master’s Thesis, Wuhan University of Technology, Wuhan, China, 2011. [Google Scholar]
  4. Dai, H.; Wang, L.; Zhang, J.; Wang, L.; Yang, Z.; Zhang, J.; Lin, F. Research and Prospect of Novel High-Temperature Thermal Resistant Abradable Sealing Coating. Mater. Rev. 2008, 22, 18–21. [Google Scholar]
  5. Wang, T.; Chen, S.; Meng, K.; Liu, X. Research Progress on Structural Designs and Preparations of Sealing Coating Between Aero-engine Casing and Blade Tip. China Surf. Eng. 2023, 36, 1–11. [Google Scholar]
  6. Su-Wei, L.U.; Shu, L.I.; Yang, L.U. Seal Coating and Evaluation of Its Abradability. China Surf. Eng. 2009, 22, 12. [Google Scholar]
  7. Zhang, F.; Xu, C.; Lan, H.; Huang, C.; Zhou, Y.; Du, L.; Zhang, W. Corrosion Behavior of an Abradable Seal Coating System. J. Therm. Spray Technol. 2014, 23, 1019–1028. [Google Scholar] [CrossRef]
  8. Xu, C.; Du, L.; Zhang, W.; Yang, B.; Wang, L.; Li, J. Salt Spray Corrosion of Ni/Graphite Abradable Sealing Coatings. J. Aeronaut. Mater. 2010, 30, 53–58. [Google Scholar]
  9. Lei, B.; Li, M.; Zhao, Z.; Wang, L.; Li, Y.; Wang, F. Corrosion Mechanism of an Al-BN abradable Seal Coating System in Chloride Solution. Corros. Sci. 2014, 79, 198–205. [Google Scholar] [CrossRef]
  10. Yu, F.L.; Bai, Y.; Wu, X.Y.; Wang, H.; Wu, J. Corrosion Resistance and Anti-wear Property of Nickel Based Abradable Sealing Coating Deposited by Plasma Spraying. J. Inorg. Mater. 2016, 31, 687–693. [Google Scholar]
  11. Yumeng, N.I.; Yingjie, Y.U.; Hui, Y.A.N.; Wei, W.A.N.G.; Ying, L.I. Finite Element Study on Phase-selective Dissolution Mechanism of CuAl-NiC Abradable Seal Coating. J. Chin. Soc. Corros. Prot. 2023, 43, 855–861. [Google Scholar]
  12. Yan, H.; Yu, Y.; Song, Y.; Lei, B.; Ni, Y.; Tang, A.; Li, Y. An Abradable and Anti-corrosive CuAl-Ni/C Seal Coating for Aero-engine. Chem. Eng. J. 2023, 474, 145665. [Google Scholar] [CrossRef]
  13. Ni, Y.; Zhang, F.; Njoku, D.I.; Yu, Y.; Pan, J.; Meng, M.; Li, Y. Corrosion Mechanism of CuAl-NiC abradable Seal Coating System-The Influence of Porosity, Multiphase, and Multilayer Structure on the Corrosion Failure. J. Mater. Sci. Technol. 2021, 88, 258–269. [Google Scholar] [CrossRef]
  14. Zhang, S.; Sun, W.; Liu, T.; Yang, J.; Liu, J.; Wu, C.; Ouyang, P. Preparation and Performance Evolution of Plasma Sprayed Abradable CuAl/PHB-NiAl Layered Seal Coatings. Materials 2023, 16, 227. [Google Scholar] [CrossRef]
  15. Liu, P.; Li, H.; Zhang, Y. Effect of Rare Earth Element (RE) Oxides on Diffusive Behaviour and Wear Resistance of a Laser Clad TiC/TiB Reinforced Coating on a Ti-3Al-2V Alloy. Materials 2014, 26, 381–390. [Google Scholar]
  16. Wang, S.C.; Chou, C.P. Effect of Adding Sc and Zr on Grain Refinement and Ductility of AZ31 Magnesium Alloy. J. Mater. Process. Technol. 2008, 197, 116–121. [Google Scholar] [CrossRef]
  17. Yang, N.; Long, J. Rare Earth Metal Passivation—A New Green Technology of Surface Treatment for Corrosion Protection. Chin. Rare Earths 2002, 23, 55–62. [Google Scholar]
  18. Chen, D.; Fan, H.; Chen, Z.; Ni, X. The Application and Developments of Rare-earth Elements in Surface Treatments of Aluminum Alloy. Surf. Technol. 2007, 36, 58–60. [Google Scholar]
  19. Lin, D.; Li, Y.; Chen, Y.; Cai, J.; Zheng, Y. Researches on the Application of Rare Earths in Anticorrosion of Aluminum Alloy. Chin. Rare Earths 2016, 37, 121–127. [Google Scholar]
  20. Lei, Z.; Wen, S.; Huang, H.; Wei, W.; Nie, Z. Grain Refinement of Aluminum and Aluminum Alloys by Sc and Zr. Metals 2023, 13, 751. [Google Scholar] [CrossRef]
  21. Tian, W.; Hu, M.; Sun, Y.; Bi, L. Research Progress on Effects of Rare Earth Elements on Properties of Al-Cu alloy. Trans. Mater. Heat Treat. 2019, 40, 12–19. [Google Scholar]
  22. Czerwinski, F. Cerium in Aluminum Alloys. J. Mater. Sci. 2020, 55, 24–72. [Google Scholar] [CrossRef]
  23. Fu, X.M.; Jiang, J.X.; Jiang, X.S. Research Progress in Interfacial Characteristics and Strengthening Mechanisms of Rare Earth Metal Oxide-Reinforced Copper Matrix Composites. Materials 2022, 15, 5350. [Google Scholar] [CrossRef] [PubMed]
  24. Zhu, R.; Zhang, J.; Shi, F.; Shang, X.; Wang, J.; Wang, J.; Tian, Y. Research Progress on Functional Mechanisms of Rare Earth Elements in Copper. Trans. Mater. Heat Treat. 2022, 43, 1–8. [Google Scholar]
  25. Song, J.; Bai, Z.; Li, Z.; Yao, Q.; Zhang, D.; Dong, C.; Xiao, K. Effect of Mg and RE on the Corrosion Resistance of Electric Arc Spraying ZnAl Alloy Coatings. Mater. Prot. 2020, 53, 1–7. [Google Scholar]
  26. Xing, S.; Xiao, K.; Li, L.; Li, X.; Liu, A.; Wang, E. Corrosion Resistance of Zn-Al-Mg-La-Ce Coatings by Electric Arc Spraying. J. Univ. Sci. Technol. Beijing 2012, 34, 1167–1172. [Google Scholar]
  27. Fu, D.X.; Xu, B.S.; Zhang, W.; Li, Q.; Wei, S. Action Mechanism of Self-sealing Behavior of Zn-Al-Mg-RE Coating in a Multilayer Coating. Trans. Mater. Heat Treat. 2007, 28, 98–101. [Google Scholar]
  28. Zhu, Z.X.; Zhang, J.; Xu, B.S. Effect of RE on Anti-corrosion Mechanism of Arc Sprayed Zn-Al-Mg Coatings. In Proceedings of the International Conference on Material Engineering, Shanghai, China, 28–30 October 2011. [Google Scholar]
  29. Deng, T.; Zhong, X.; Zhong, M.; Lai, Y.; Zhu, Z.; Zhang, L.; Ojo, O.A. Effect of Scandium on Microstructure and Corrosion Resistance of Ti64 Alloy in NaCl Solution. Mater. Charact. 2023, 197, 112671. [Google Scholar] [CrossRef]
  30. Batra, I.S.; Singh, R.N.; Khandelwal, H.K.; Mukherjee, A.; Krishnamurthy, N.; Gargi, C.; Shah, B.K. Hydride Embrittlement and Oxidation Resistance of some Zr-Nb-Y Alloys. J. Nucl. Mater. 2013, 434, 389–394. [Google Scholar] [CrossRef]
  31. Liu, X.; Ni, X. Study on Microstructure and Corrosion Resistance of Zr-1Nb-xY Alloys. Hot Work. Technol. 2015, 44, 216–218. [Google Scholar]
  32. Wan, B.; Chen, W.; Liu, L.; Cao, X.; Zhou, L.; Fu, Z. Effect of Trace Yttrium Addition on the Microstructure and Tensile Properties of Recycled Al-7Si-0.3Mg-1.0Fe Casting Alloys. Mater. Sci. Eng. 2016, 666, 165–175. [Google Scholar] [CrossRef]
  33. Liu, L.; Yu, S. Effect of Y Addition on Corrosion Resistance of Pack Cementation Zinc Coating on 42CrMo Steel. Corros. Sci. Prot. Technol. 2018, 30, 475–480. [Google Scholar]
  34. Zhang, P.; Xu, Z.; Meng, G.; Wang, Y.; Wang, J.; Shao, Y.; Wang, F. Efficiently Improved Corrosion Resistance of Electrodeposition Ni-Cu Coatings via Site-Blocking Effect of Ce. Adv. Eng. Mater. 2022, 24, 2200109. [Google Scholar] [CrossRef]
  35. Liu, Y.; Hang, Z.; Chen, H.; Ceng, S.; Gou, G.; Wang, X.; Tu, M.; Wu, X. Erosion-Corrosion Property of CeO2-Modified HVOF WC-Co Coating. J. Therm. Spray Technol. 2016, 25, 815–822. [Google Scholar] [CrossRef]
  36. Alvarez, K.; Hyun, S.K.; Tsuchiya, H.; Fujimoto, S.; Nakajima, H. Corrosion Behaviour of Lotus-type Nickel-free Stainless Porous High Nitrogen Steels. Corros. Sci. 2008, 50, 183–193. [Google Scholar] [CrossRef]
  37. Kerner, Z.; Pajkossy, T. On the Origin of Capacitance Dispersion of Rough Electrodes. Electrochim. Acta 2000, 46, 207–211. [Google Scholar] [CrossRef]
Figure 1. Cross-section images of the (a) CuAl/BN coating, (b) CuAlY/BN coating, and (c) CuAlLaF3/BN coating; (d) X-ray diffraction (XRD) images of the three coatings.
Crystals 14 00808 g001
Figure 2. (a) Open-circuit potential test of the three coatings. (b) Results of the coating polarization curve test.
Crystals 14 00808 g002
Figure 3. Electrochemical impedance spectroscopy (EIS) data for the three coatings: (a) Nyquist plots; (b,c) Bode plots; (d) impedance spectroscopy equivalent circuits.
Crystals 14 00808 g003
Figure 4. (a) Surface scan of CuAl/BN after corrosion for 960 h. (b) Cross-section of CuAlLaF3/BN after corrosion for 960 h. (c) Surface scan of CuAlY/BN after corrosion for 960 h.
Crystals 14 00808 g004
Figure 5. XRD patterns of the as-sprayed coatings.
Crystals 14 00808 g005
Figure 6. Bond strength of the as-sprayed coatings versus salt-spray test time.
Crystals 14 00808 g006
Figure 7. (a) Open-circuit potential test of the three coatings. (b) Results of the coating polarization curve test.
Crystals 14 00808 g007
Figure 8. Electrochemical impedance spectroscopy (EIS) data for the three coatings: (a) Nyquist plots; (b,c) Bode plots; (d) impedance spectroscopy equivalent circuits.
Crystals 14 00808 g008
Figure 9. Localized electrochemical impedance spectroscopy (LEIS): (a) CuAl/BN coating; (b) CuAl/BN coating after oxidation; (c) CuAlLaF3/BN coating; (d) CuAlLaF3/BN coating after oxidation; (e) CuAlY/BN coating; (f) CuAlY/BN coating after oxidation.
Crystals 14 00808 g009
Figure 10. Bond strength of coatings after oxidation pretreatment as a function of salt-spray test time.
Crystals 14 00808 g010
Table 1. Chemical composition (wt.%) of abradable tightly coated composite powders.
MaterialCuAlYLaF3BNWaterglass
CuAl/BN757.5------14.53
CuAlLaF3/BN757.5---0.7514.52.25
CuAlY/BN757.51.5---14.51.5
Table 2. Plasma spray process parameters.
Current/(A)Voltage (V)Number of Shots SpraySpray Distance (mm)Ar Flow (L/min)H2 Flow (L/min)
4005715100402.0
Table 3. The impedance parameters for the equivalent circuit are obtained by fitting the AC impedance experimental results.
MaterialRsol (Ω∙cm2)Rcd (Ω∙cm2)Qn
(F∙cm2)
nZw (Ω∙cm2)Error/%s2
CuAl/BN0.365.965.55 × 10−60.990.8763.761.41 × 10−3
CuAlLaF3/BN2.961.434.52 × 10−20.290.0373.951.57 × 10−3
CuAlY/BN2.401.260.0320.677.238 × 10−52.255.06 × 10−4
Table 4. Open-circuit potential, self-corrosion potential, and self-corrosion current data after high temperature pretreatment of the coatings.
MaterialOCP (mV)Icorr (uA/cm2)Ecorr (mV/cm2)
CuAl/BN−352.444.6−410.1
CuAlLaF3/BN−343.1330.1−507.5
CuAlY/BN−50.44.1−269.9
Table 5. The impedance parameters of the equivalent circuit are obtained by fitting the AC impedance experimental results.
MaterialRsol (Ω∙cm2)Rcd (Ω∙cm2)Qd (F∙cm2)n1Rf (Ω∙cm2)Qf (F∙cm2)n2
CuAl/BN4.2624.254.307 × 10−40.73887.72.09 × 10−40.90
CuAlLaF3/BN3.65148.94.848 × 10−30.49379.52.17 × 10−40.79
CuAlY/BN10.0130.956.421 × 10−50.776.2 E46.91 × 10−50.99
Disclaimer/Publisher’s Note: The statements, opinions and data contained in all publications are solely those of the individual author(s) and contributor(s) and not of MDPI and/or the editor(s). MDPI and/or the editor(s) disclaim responsibility for any injury to people or property resulting from any ideas, methods, instructions or products referred to in the content.

