
Discrimination of Thermoluminescent Signals from Natural Quartz and Carbonate Crystals Mixture


Abstract
1. Introduction
2. Materials and Methods
2.1. Deconvolution Process
3. Results and Discussion
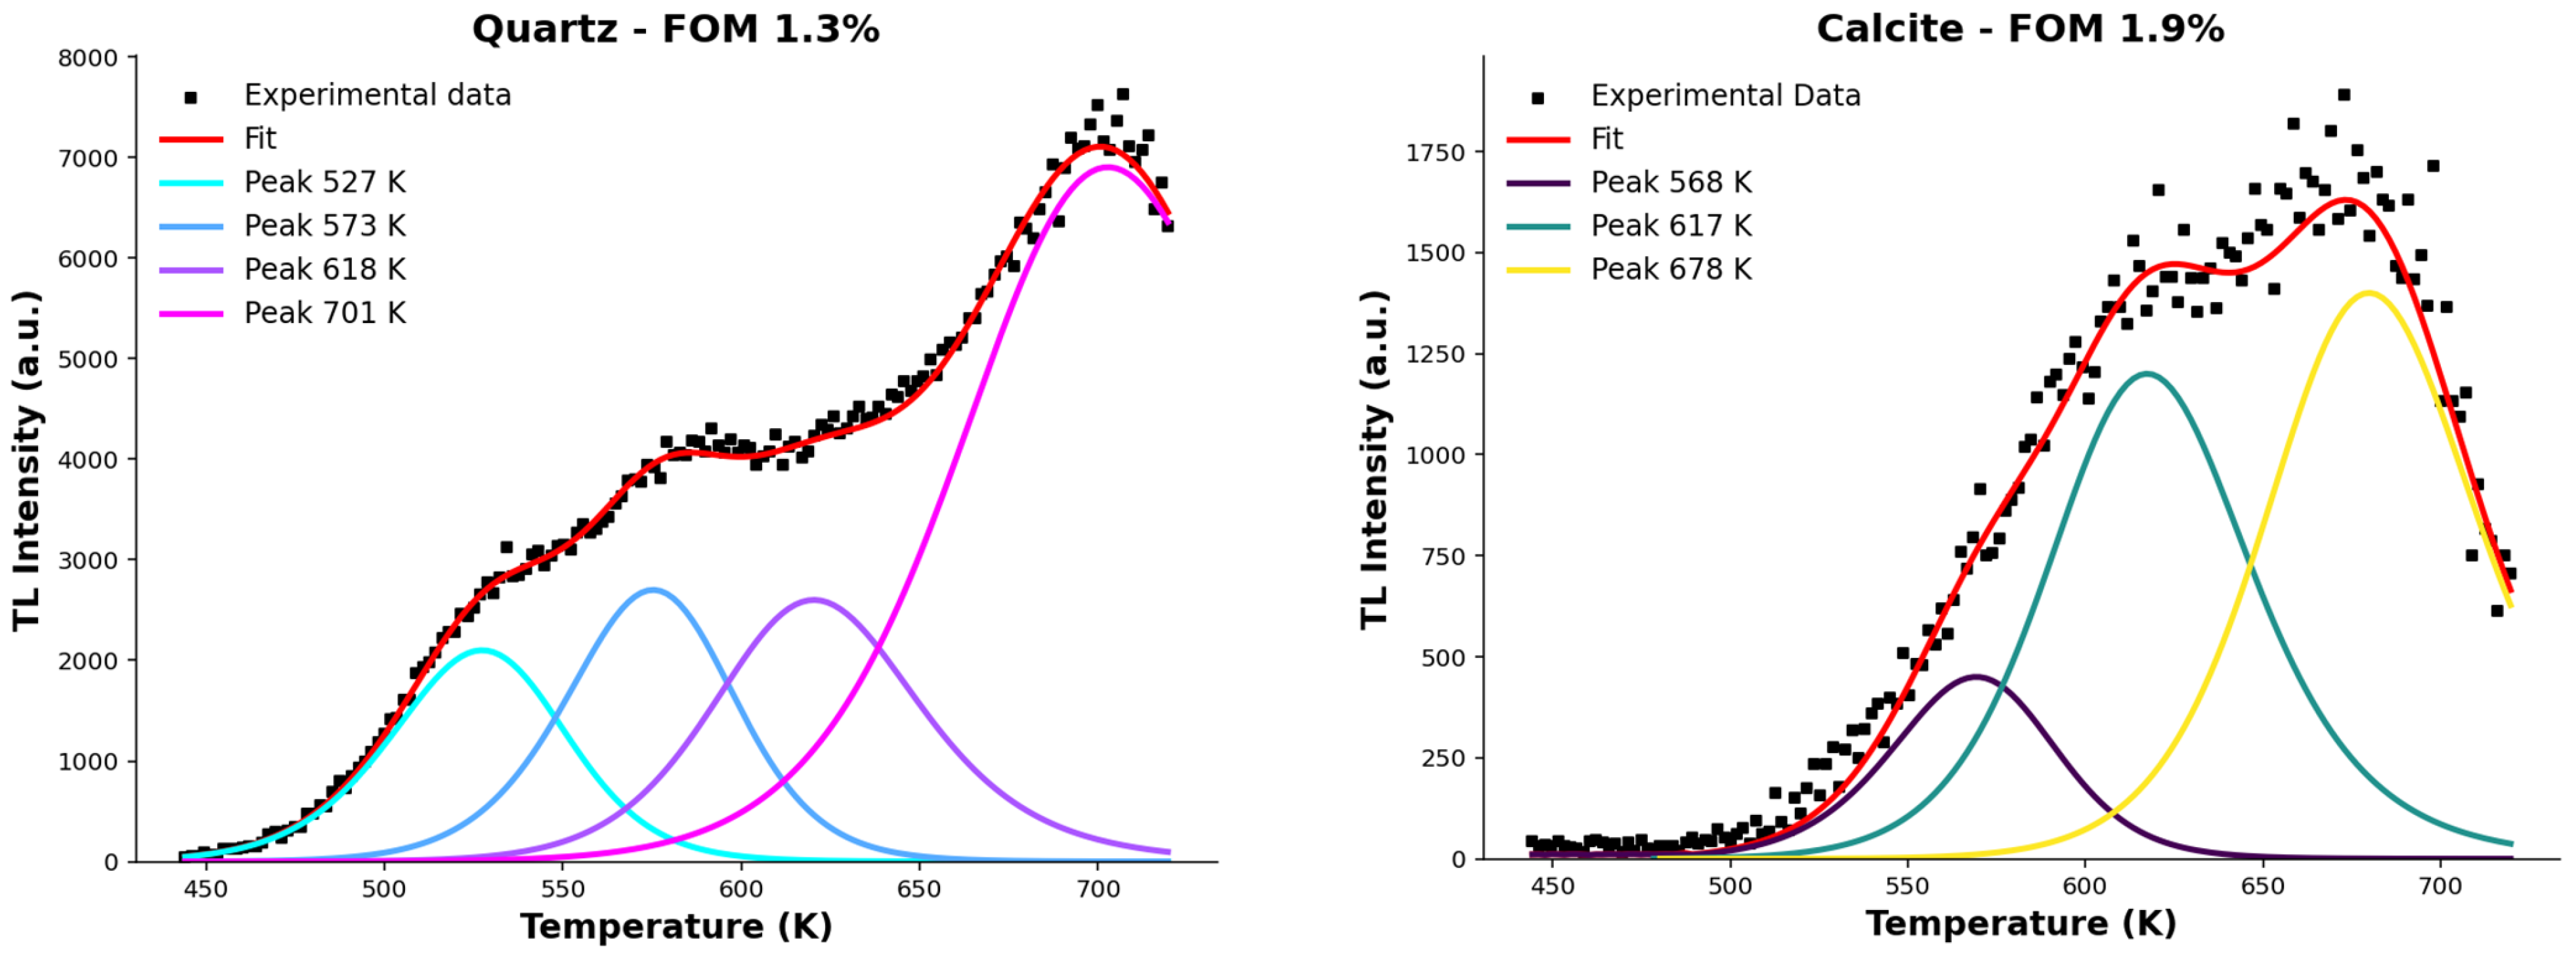
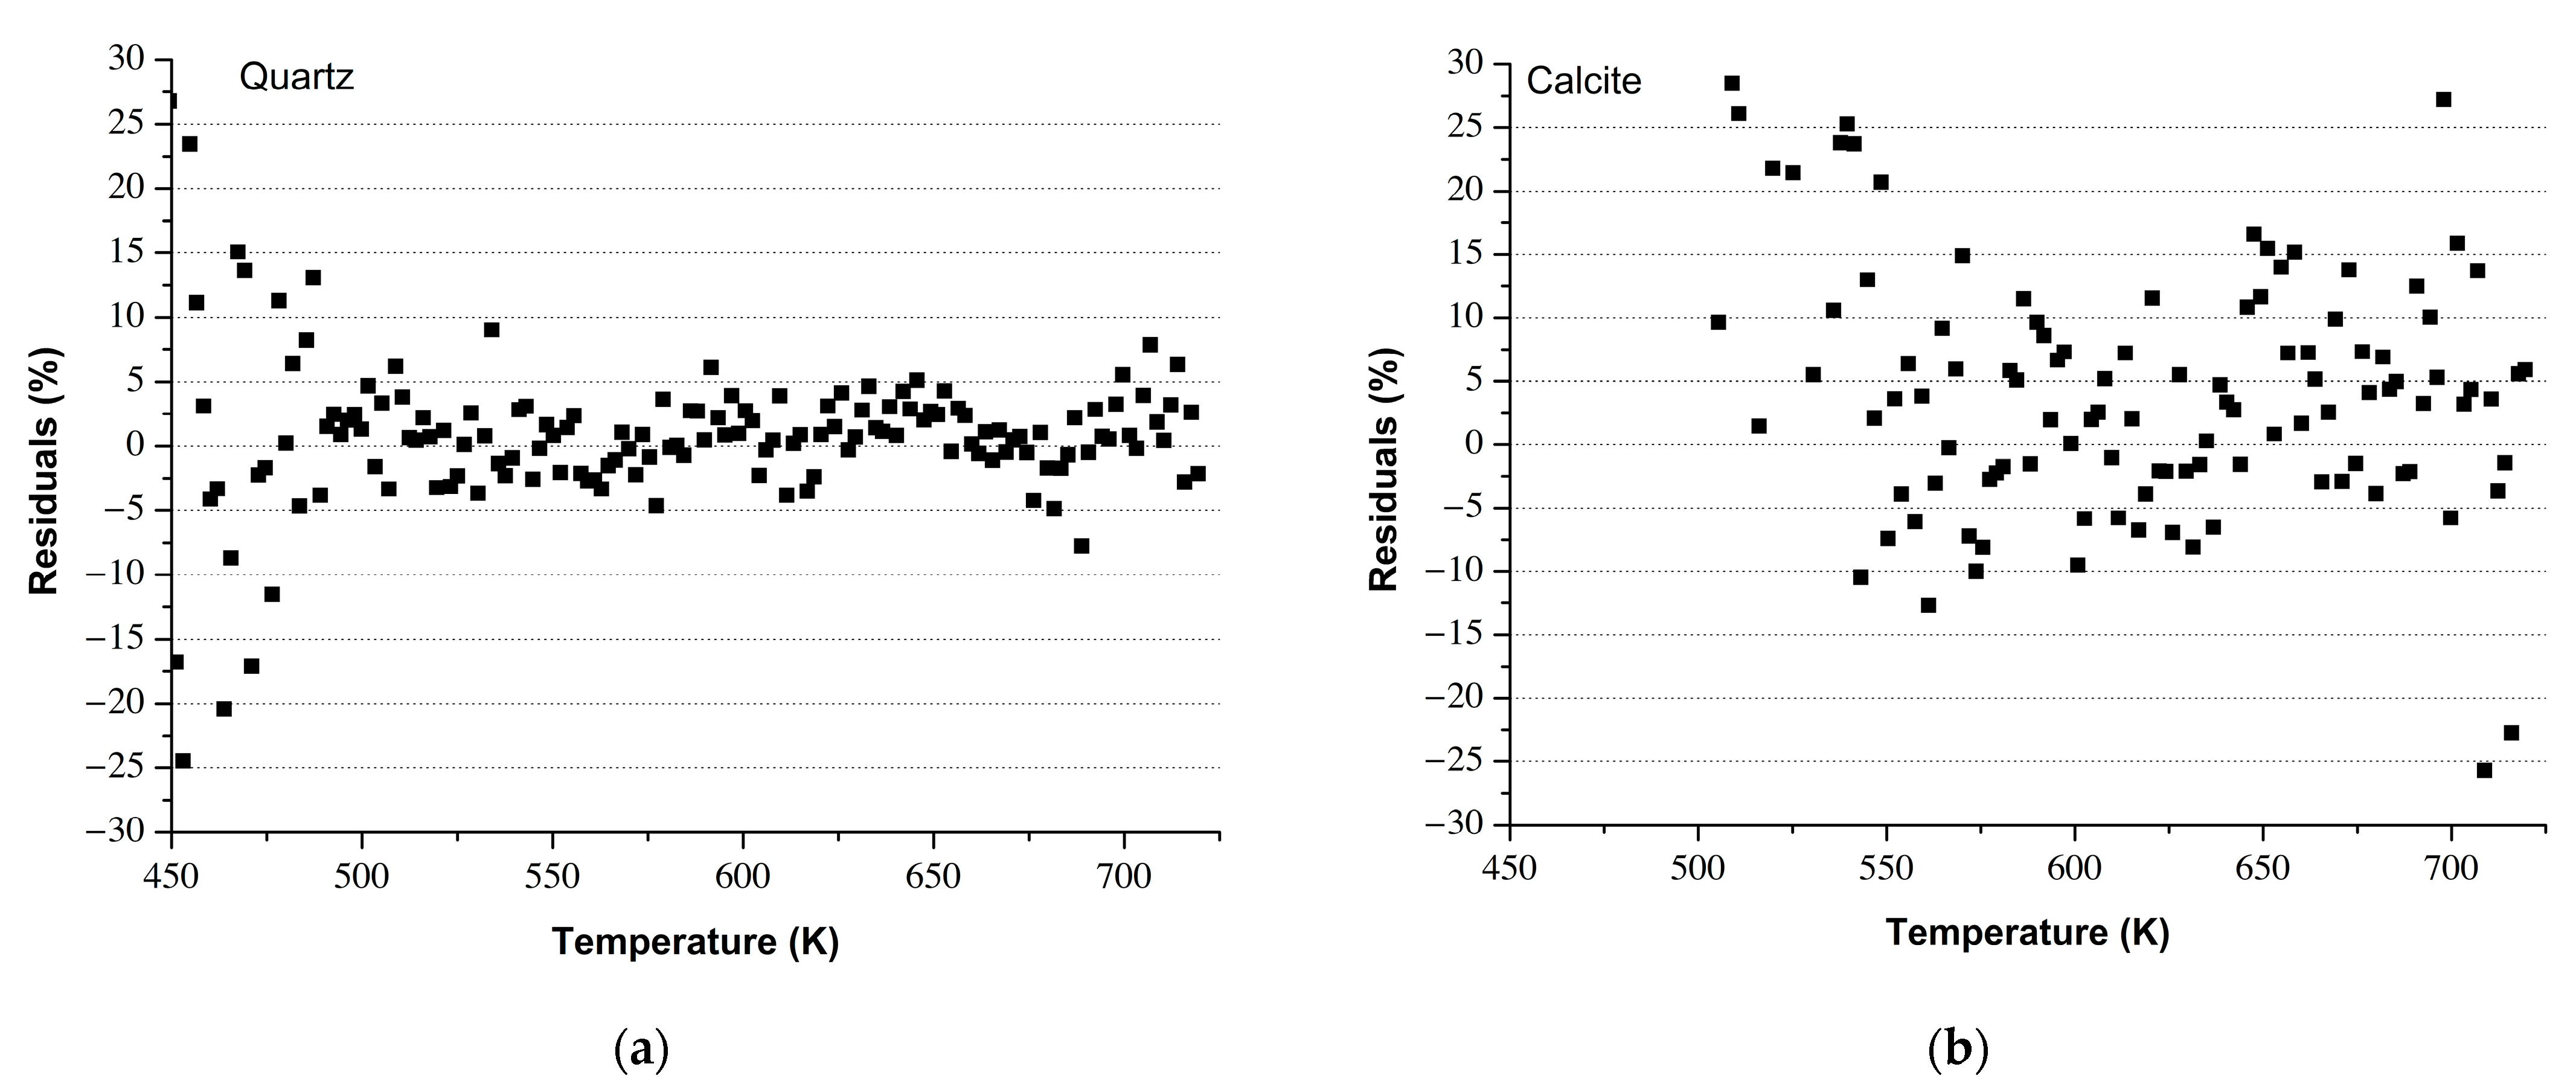
3.1. Analysis of the Individual Thermoluminescent Contributions
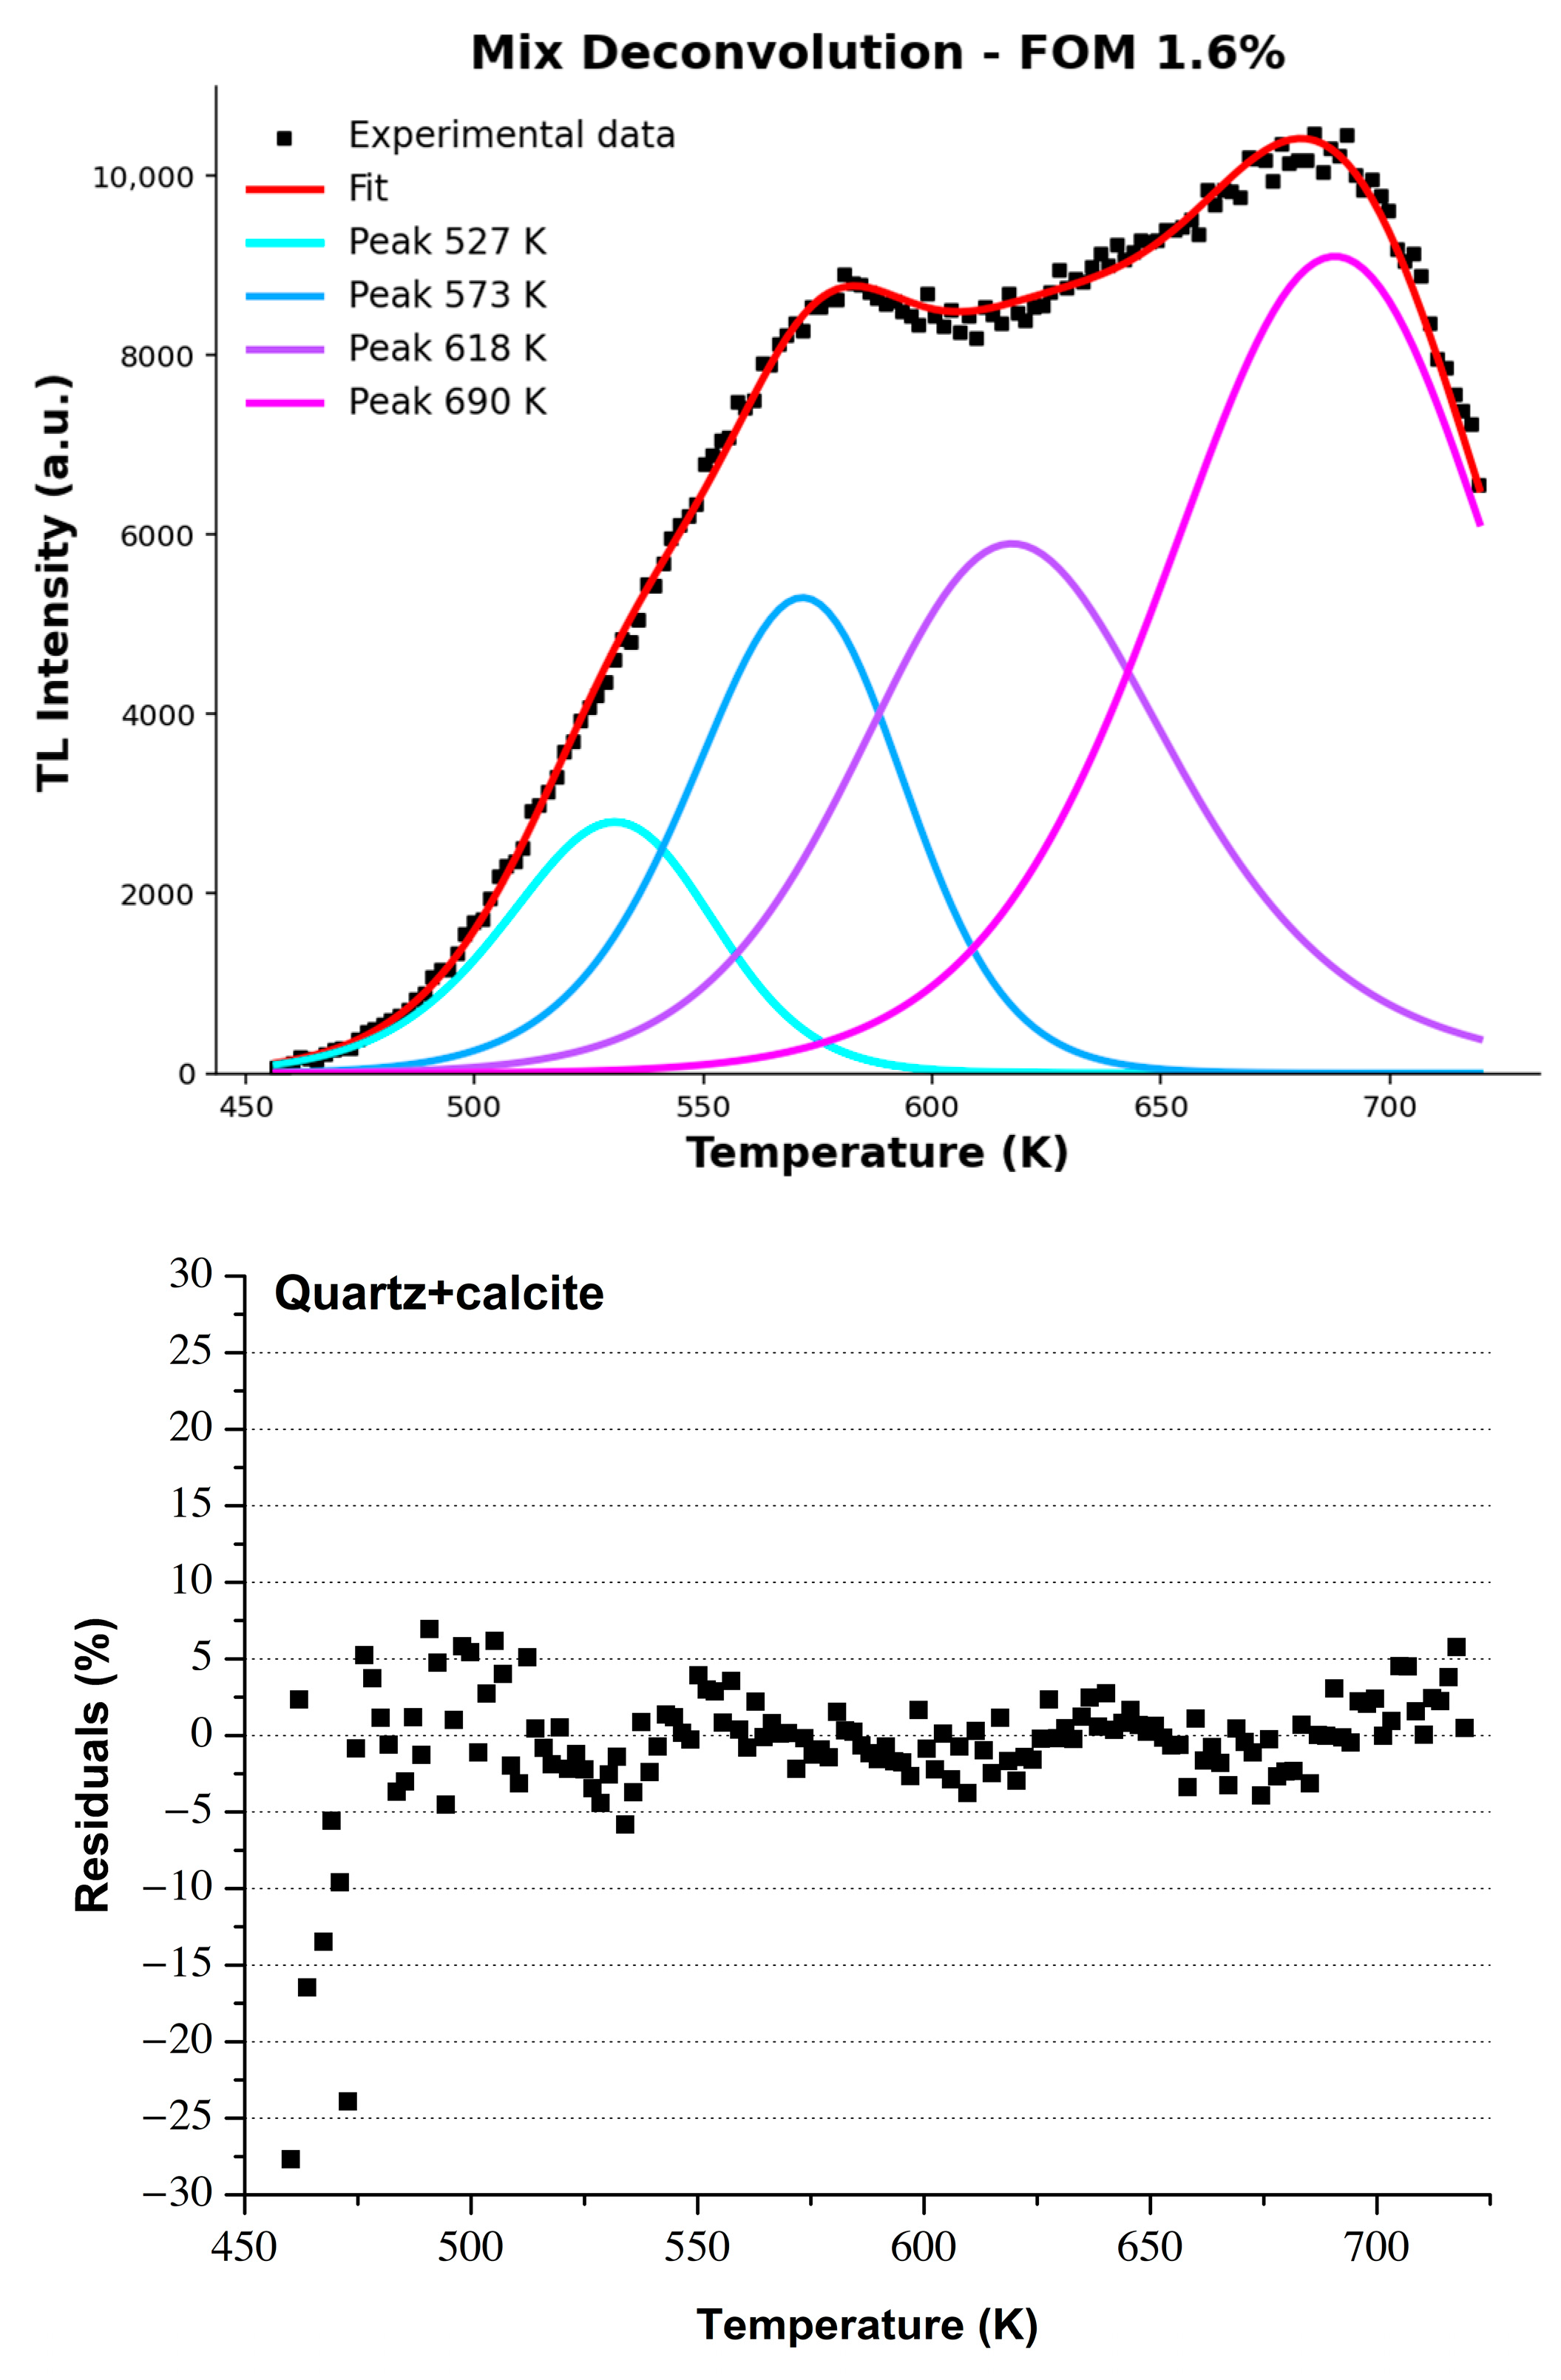
3.2. Analysis of the Thermoluminescent Contribution in the Mixed Phase
4. Conclusions
Author Contributions
Funding
Data Availability Statement
Conflicts of Interest
References
- Bailiff, I.K. Methodological developments in the Luminescence Dating of brick from English late-medieval and post-medieval buildings. Archaeometry 2007, 49, 827–851. [Google Scholar] [CrossRef]
- Galli, A.; Martini, M.; Maspero, F.; Panzeri, L.; Sibilia, E. Surface Dating of Bricks, an Application of Luminescence Techniques. Eur. Phys. J. Plus 2014, 129, 101. [Google Scholar] [CrossRef]
- Guibert, P.; Urbanová, P.; Javel, J.-B.; Guérin, G. Modeling Light Exposure of Quartz Grains During Mortar Making: Consequences for Optically Stimulated Luminescence Dating. Radiocarbon 2020, 62, 693–711. [Google Scholar] [CrossRef]
- Panzeri, L. Mortar and Surface Dating with Optically Stimulated Luminescence (OSL): Innovative Techniques for the Age Determination of Buildings. Nuovo C. Della 2013, 36, 205–216. [Google Scholar] [CrossRef]
- Bøtter-Jensen, L. Luminescence techniques: Instrumentation and methods. Radiat. Meas. 1997, 27, 749–768. [Google Scholar] [CrossRef]
- Bøtter-Jensen, L.; Bulur, E.; Duller, G.A.T.; Murray, A.S. Advances in Luminescence Instrument Systems. Radiat. Meas. 2000, 32, 523–528. [Google Scholar] [CrossRef]
- Zacharias, N.; Mauz, B.; Michael, C.T. Luminescence Quartz Dating of Lime Mortars: A First Research Approach. Radiat. Prot. Dosim. 2002, 101, 379–382. [Google Scholar] [CrossRef]
- Thomsen, K.J.; Murray, A.S.; Bøtter-Jensen, L.; Kinahan, J. Determination of Burial Dose in Incompletely Bleached Fluvial Samples Using Single Grains of Quartz. Radiat. Meas. 2007, 42, 370–379. [Google Scholar] [CrossRef]
- Jain, M.; Thomsen, K.J.; Bøtter-Jensen, L.; Murray, A.S. Thermal Transfer and Apparent-Dose Distributions in Poorly Bleached Mortar Samples: Results from Single Grains and Small Aliquots of Quartz. Radiat. Meas. 2004, 38, 101–109. [Google Scholar] [CrossRef]
- Duller, G.A.T.; Bøtter-Jensen, L.; Murray, A.S.; Truscott, A.J. Single Grain Laser Luminescence (SGLL) Measurements Using a Novel Automated Reader. Nucl. Instrum. Methods Phys. Res. B 1999, 155, 506–514. [Google Scholar] [CrossRef]
- Stella, G.; Fontana, D.; Gueli, A.M.; Troja, S.O. Historical mortars dating from OSL signals of fine grain fraction enriched in quartz. Geochronometria 2013, 40, 153–164. [Google Scholar] [CrossRef]
- Stella, G.; Almeida, L.; Basílio, L.; Pasquale, S.; Dinis, J.; Almeida, M.; Gueli, A.M. Historical Building Dating: A Multidisciplinary Study of the Convento de São Francisco (Coimbra, Portugal). Geochronometria 2018, 45, 119–129. [Google Scholar] [CrossRef]
- Urbanová, P.; Michel, A.; Bouvier, A.; Cantin, N.; Guibert, P.; Lanos, P.; Dufresne, P.; Garnier, L. Novel Interdisciplinary Approach for Building Archaeology: Integration of Mortar Luminescence Dating into Archaeological Research, an Example of Saint Seurin Basilica, Bordeaux. J. Archaeol. Sci. Rep. 2018, 20, 307–323. [Google Scholar] [CrossRef]
- Galbraith, R.F.; Laslett, G.M. Statistical Models for Mixed Fission Track Ages. Nucl. Tracks Radiat. Meas. 1993, 21, 459–470. [Google Scholar] [CrossRef]
- Galbraith, R.F.; Roberts, R.G.; Yoshida, H. Error Variation in OSL Palaeodose Estimates from Single Aliquots of Quartz: A Factorial Experiment. Radiat. Meas. 2005, 39, 289–307. [Google Scholar] [CrossRef]
- Arnold, L.J.; Roberts, R.G.; Galbraith, R.F.; DeLong, S.B. A Revised Burial Dose Estimation Procedure for Optical Dating of Young and Modern-Age Sediments. Quat. Geochronol. 2009, 4, 306–325. [Google Scholar] [CrossRef]
- Thomsen, K.J.; Jain, M.; Bøtter-Jensen, L.; Murray, A.S.; Jungner, H. Variation with Depth of Dose Distributions in Single Grains of Quartz Extracted from an Irradiated Concrete Block. Radiat. Meas. 2003, 37, 315–321. [Google Scholar] [CrossRef]
- Hale, J.; Heinemeier, J.; Lindroos, A.; Lancaster, L. Dating Ancient Mortar. Am. Sci. 2003, 91, 130–137. [Google Scholar] [CrossRef]
- Daugbjerg, T.S.; Lindroos, A.; Heinemeier, J.; Ringbom, Å.; Barrett, G.; Michalska, D.; Hajdas, I.; Raja, R.; Olsen, J. A Field Guide to Mortar Sampling for Radiocarbon Dating. Archaeometry 2021, 63, 1121–1140. [Google Scholar] [CrossRef]
- Wojcieszak, M.; Fontaine, L.; Elsen, J.; Hayen, R.; Lehouck, A.; Boudin, M. Historic Lime Mortars Composition and Terminology for Radiocarbon Dating—Case Studies Based on Thin-Section Petrography and Cathodoluminescence. Radiocarbon 2024, 66, 1814–1834. [Google Scholar] [CrossRef]
- Urbanová, P.; Boaretto, E.; Artioli, G. The State-of-the-Art of Dating Techniques Applied to Ancient Mortars and Binders: A Review. Radiocarbon 2020, 62, 503–525. [Google Scholar] [CrossRef]
- Gartia, R.K.; Lovedy, L.; Ranita, U. Analysis of Glow Curves of Quartz and Transluminescence Dating; CSIR: Perth, Australia, 2009; pp. 417–419. [Google Scholar]
- Gartia, R.K.; Singh, L.L. Evaluation of Trapping Parameter of Quartz by Deconvolution of the Glow Curves. Radiat. Meas. 2011, 46, 664–668. [Google Scholar] [CrossRef]
- Kim, K.B.; Hong, D.G. Kinetic Parameters, Bleaching and Radiation Response of Thermoluminescence Glow Peaks Separated by Deconvolution on Korean Calcite. Radiat. Phys. Chem. 2014, 103, 16–21. [Google Scholar] [CrossRef]
- Kirsh, Y.; Townsend, P.D.; Shoval, S. Local transitions and charge transport in thermoluminescence of calcite. Int. J. Radiat. Appl. Instrum. Part D Nucl. Tracks Radiat. Meas. 1987, 13, 115–119. [Google Scholar] [CrossRef]
- Franklin, A.D.; Hornyak, W.F.; Pagonis, V.; Kristianpoller, N. Thermoluminescence study of annealing a geological calcite. Nucl. Tracks Radiat. Meas. 1990, 17, 517–523. [Google Scholar] [CrossRef]
- Dwijen Singh, T.; Dorendrajit Singh, S. Kinetic parameters of thermoluminescence glow curves of γ-irradiated green calcite. Indian J. Pure Appl. Phys. 2009, 47, 409–412. [Google Scholar] [CrossRef]
- Cano, N.F.; Etchvarne, C.A.; Munita, C.S.; Rocca, R.R.; Barbosa, R.F.; Watanabe, S. Point defects in calcite used to estimate the date of arrival of first settlers in central region of Brazil. Phys. Status Solidi C 2013, 10, 268–271. [Google Scholar] [CrossRef]
- Abdel-Razek, Y.A. Thermoluminescence dosimetry using natural calcite. J. Taibah Univ. Sci. 2016, 10, 286–295. [Google Scholar] [CrossRef]
- Murray, A.S.; Wintle, A.G. Luminescence Dating of Quartz Using an Improved Single-Aliquot Regenerative-Dose Protocol. Radiat. Meas. 2000, 32, 57–73. [Google Scholar] [CrossRef]
- Murray, A.S.; Wintle, A.G. The Single Aliquot Regenerative Dose Protocol: Potential for Improvements in Reliability. Radiat. Meas. 2003, 37, 377–381. [Google Scholar] [CrossRef]
- Murray, A.; Arnold, L.J.; Buylaert, J.P.; Guérin, G.; Qin, J.; Singhvi, A.K.; Thomsen, K.J. Optically stimulated luminescence dating using quartz. Nat. Rev. Methods Primers 2021, 1, 72. [Google Scholar] [CrossRef]
- Middendorf, B.; Hughes, J.J.; Callebaut, K.; Baronio, G.; Papayanni, I. 2.3 Chemical Characterisation of Historic Mortars. In Characterisation of Old Mortars with Respect to Their Repair—Final Report of RILEM TC 167-COM; Groot, C., Ashall, G., Hughes, J., Eds.; RILEM Publications: Paris, France, 2004; pp. 39–56. [Google Scholar]
- Casadio, F.; Chiari, G.; Simon, S. Evaluation of Binder/Aggregate Ratios in Archaeological Lime Mortars with Carbonate Aggregate: A Comparative Assessment of Chemical, Mechanical and Microscopic Approaches. Archaeometry 2005, 47, 671–689. [Google Scholar] [CrossRef]
- Stella, G.; Sallah, A.; Galvagno, R.; D’Anna, A.; Gueli, A.M. Simultaneous Double Dose Measurements Using TLD-100H. Crystals 2024, 14, 603. [Google Scholar] [CrossRef]
- Down, J.S.; Flower, R.; Strain, J.A.; Townsend, P.D. Thermoluminescence Emission Spectra of Calcite and Iceland Spar. Nucl. Tracks Radiat. Meas. 1985, 10, 581–589. [Google Scholar] [CrossRef]
- Gaft, M.; Nagli, L.; Panczer, G.; Waychunas, G.; Porat, N. The Nature of Unusual Luminescence in Natural Calcite CaCO3. Am. Mineral. 2008, 93, 158–167. [Google Scholar] [CrossRef]
- Duller, G.A.T.; Penkman, K.E.H.; Wintle, A.G. Assessing the Potential for Using Biogenic Calcites as Dosemeters for Luminescence Dating. Radiat. Meas. 2009, 44, 429–433. [Google Scholar] [CrossRef]
- Zhang, J.; Wang, L. Thermoluminescence Dating of Calcite–Alpha Effectiveness and Measurement Protocols. J. Lumin. 2020, 223, 117205. [Google Scholar] [CrossRef]
- Şahiner, E.; Polymeris, G.S.; Öztürk, M.Z.; Kadioğlu, Y.K.; Meriç, N. Component Resolved Equivalent Dose Estimation Using TL Glow Curves of Travertine Samples from Anatolia, Turkey. Geochronometria 2021, 48, 171–178. [Google Scholar] [CrossRef]
- May, C.E.; Partridge, J.A. Thermoluminescent kinetics of alpha-irradiated alkali halides. J. Chem. Phys. 1964, 40, 1401–1409. [Google Scholar] [CrossRef]
- Randall, J.T.; Wilkins, M.H.F. Phosphorescence and electron traps—I. The study of trap distributions. Proc. R. Soc. Lond. A 1945, 184, 365–389. [Google Scholar] [CrossRef]
- Garlick, G.F.J.; Gibson, A.F. The electron trap mechanism of luminescence in sulphide and silicate phosphors. Proc. Phys. Soc. 1948, 60, 574. [Google Scholar] [CrossRef]
- Balian, H.G.; Eddy, N.W. Figure-of-Merit (FOM), an Improved Criterion over the Normalized Chi-Squared Test for Assessing Goodness-of-Fit of Gamma-Ray Spectral Peaks. Nucl. Instrum. Methods Phys. Res. 1977, 145, 389–395. [Google Scholar] [CrossRef]
- Goedicke, C. Dating historical mortars by blue OSL: Results from known age samples. Radiat. Meas. 2003, 37, 409–415. [Google Scholar] [CrossRef]
- Bøtter-Jensen, L.; Larsen, N.A.; Mejdahl, V.; Poolton, N.R.J.; Morris, M.F.; McKeever, S.W.S. Luminescence sensitivity changes in quartz as a result of annealing. Radiat. Meas. 1995, 24, 535–541. [Google Scholar] [CrossRef]
- Krbetschek, M.R.; Götze, J.; Dietrich, A.; Trautmann, T. Spectral information from minerals relevant for luminescence dating. Radiat. Meas. 1997, 27, 695–748. [Google Scholar] [CrossRef]


| Step | Treatment | Observed |
|---|---|---|
| 1 | Preheating (@220 °C, 10 s) | - |
| 2 | Thermal Stimulation (@450 °C, 5 °C/s) | Lknown dose |
| 3 | Give Test Dose, DT = 7 Gy | - |
| 4 | Cut heat (@180 °C) | - |
| 5 | Thermal Stimulation (@450 °C, 5 °C/s) | Tknown dose |
| 6 | Give Dose, Di | - |
| 7 | Preheating (@220 °C, 10 s) | - |
| 8 | Thermal Stimulation (@450 °C, 5 °C/s) | Lx |
| 9 | Give Test Dose, DT = 7 Gy | - |
| 10 | Cut heat (@180 °C) | - |
| 11 | Thermal Stimulation (@450 °C, 5 °C/s) | Tx |
| 12 | Repeat step 8–13 for the dose value Di = 6.9 Gy, 13.80 Gy, 27.60 Gy, 41.40 Gy, 55.20 Gy | - |
| Quartz | Calcite | |||||
|---|---|---|---|---|---|---|
| Peak Number | Tm (K) | E (eV) | b | Tm (K) | E (eV) | b |
| P1 | 528 | 1.20 | 1.50 | - | - | - |
| P2 | 573 | 1.50 | 1.60 | 568 | 1.50 | 1.60 |
| P3 | 618 | 1.60 | 1.80 | 618 | 1.60 | 1.80 |
| P4 | 698 | - | - | 678 | - | - |
| Quartz | Calcite | |||||||||
|---|---|---|---|---|---|---|---|---|---|---|
| Peak Number | Tm (K) | E (eV) | b | s (s−1) | Tm (K) | E (eV) | b | s (s−1) | ||
| P1 | 527 ± 4 | 1.29 ± 0.04 | 1.52 ± 0.04 | 1.15 × 10¹⁰ | 7.94 × 10² | - | - | - | - | - |
| P2 | 573 ± 3 | 1.50 ± 0.04 | 1.57 ± 0.04 | 7.14 × 10¹¹ | 2.73 × 10⁶ | 568 ± 4 | 1.50 ± 0.04 | 1.57 ± 0.04 | 1.01 × 10¹² | 1.95 × 10⁶ |
| P3 | 618 ± 3 | 1.59 ± 0.04 | 1.86 ± 0.04 | 3.79 × 10¹¹ | 1.81 × 10⁸ | 617 ± 4 | 1.59 ± 0.04 | 1.86 ± 0.04 | 4.43 × 10¹¹ | 1.55 × 10⁸ |
| P4 | 701 ± 10 | - | - | - | - | 678 ± 12 | - | - | - | - |
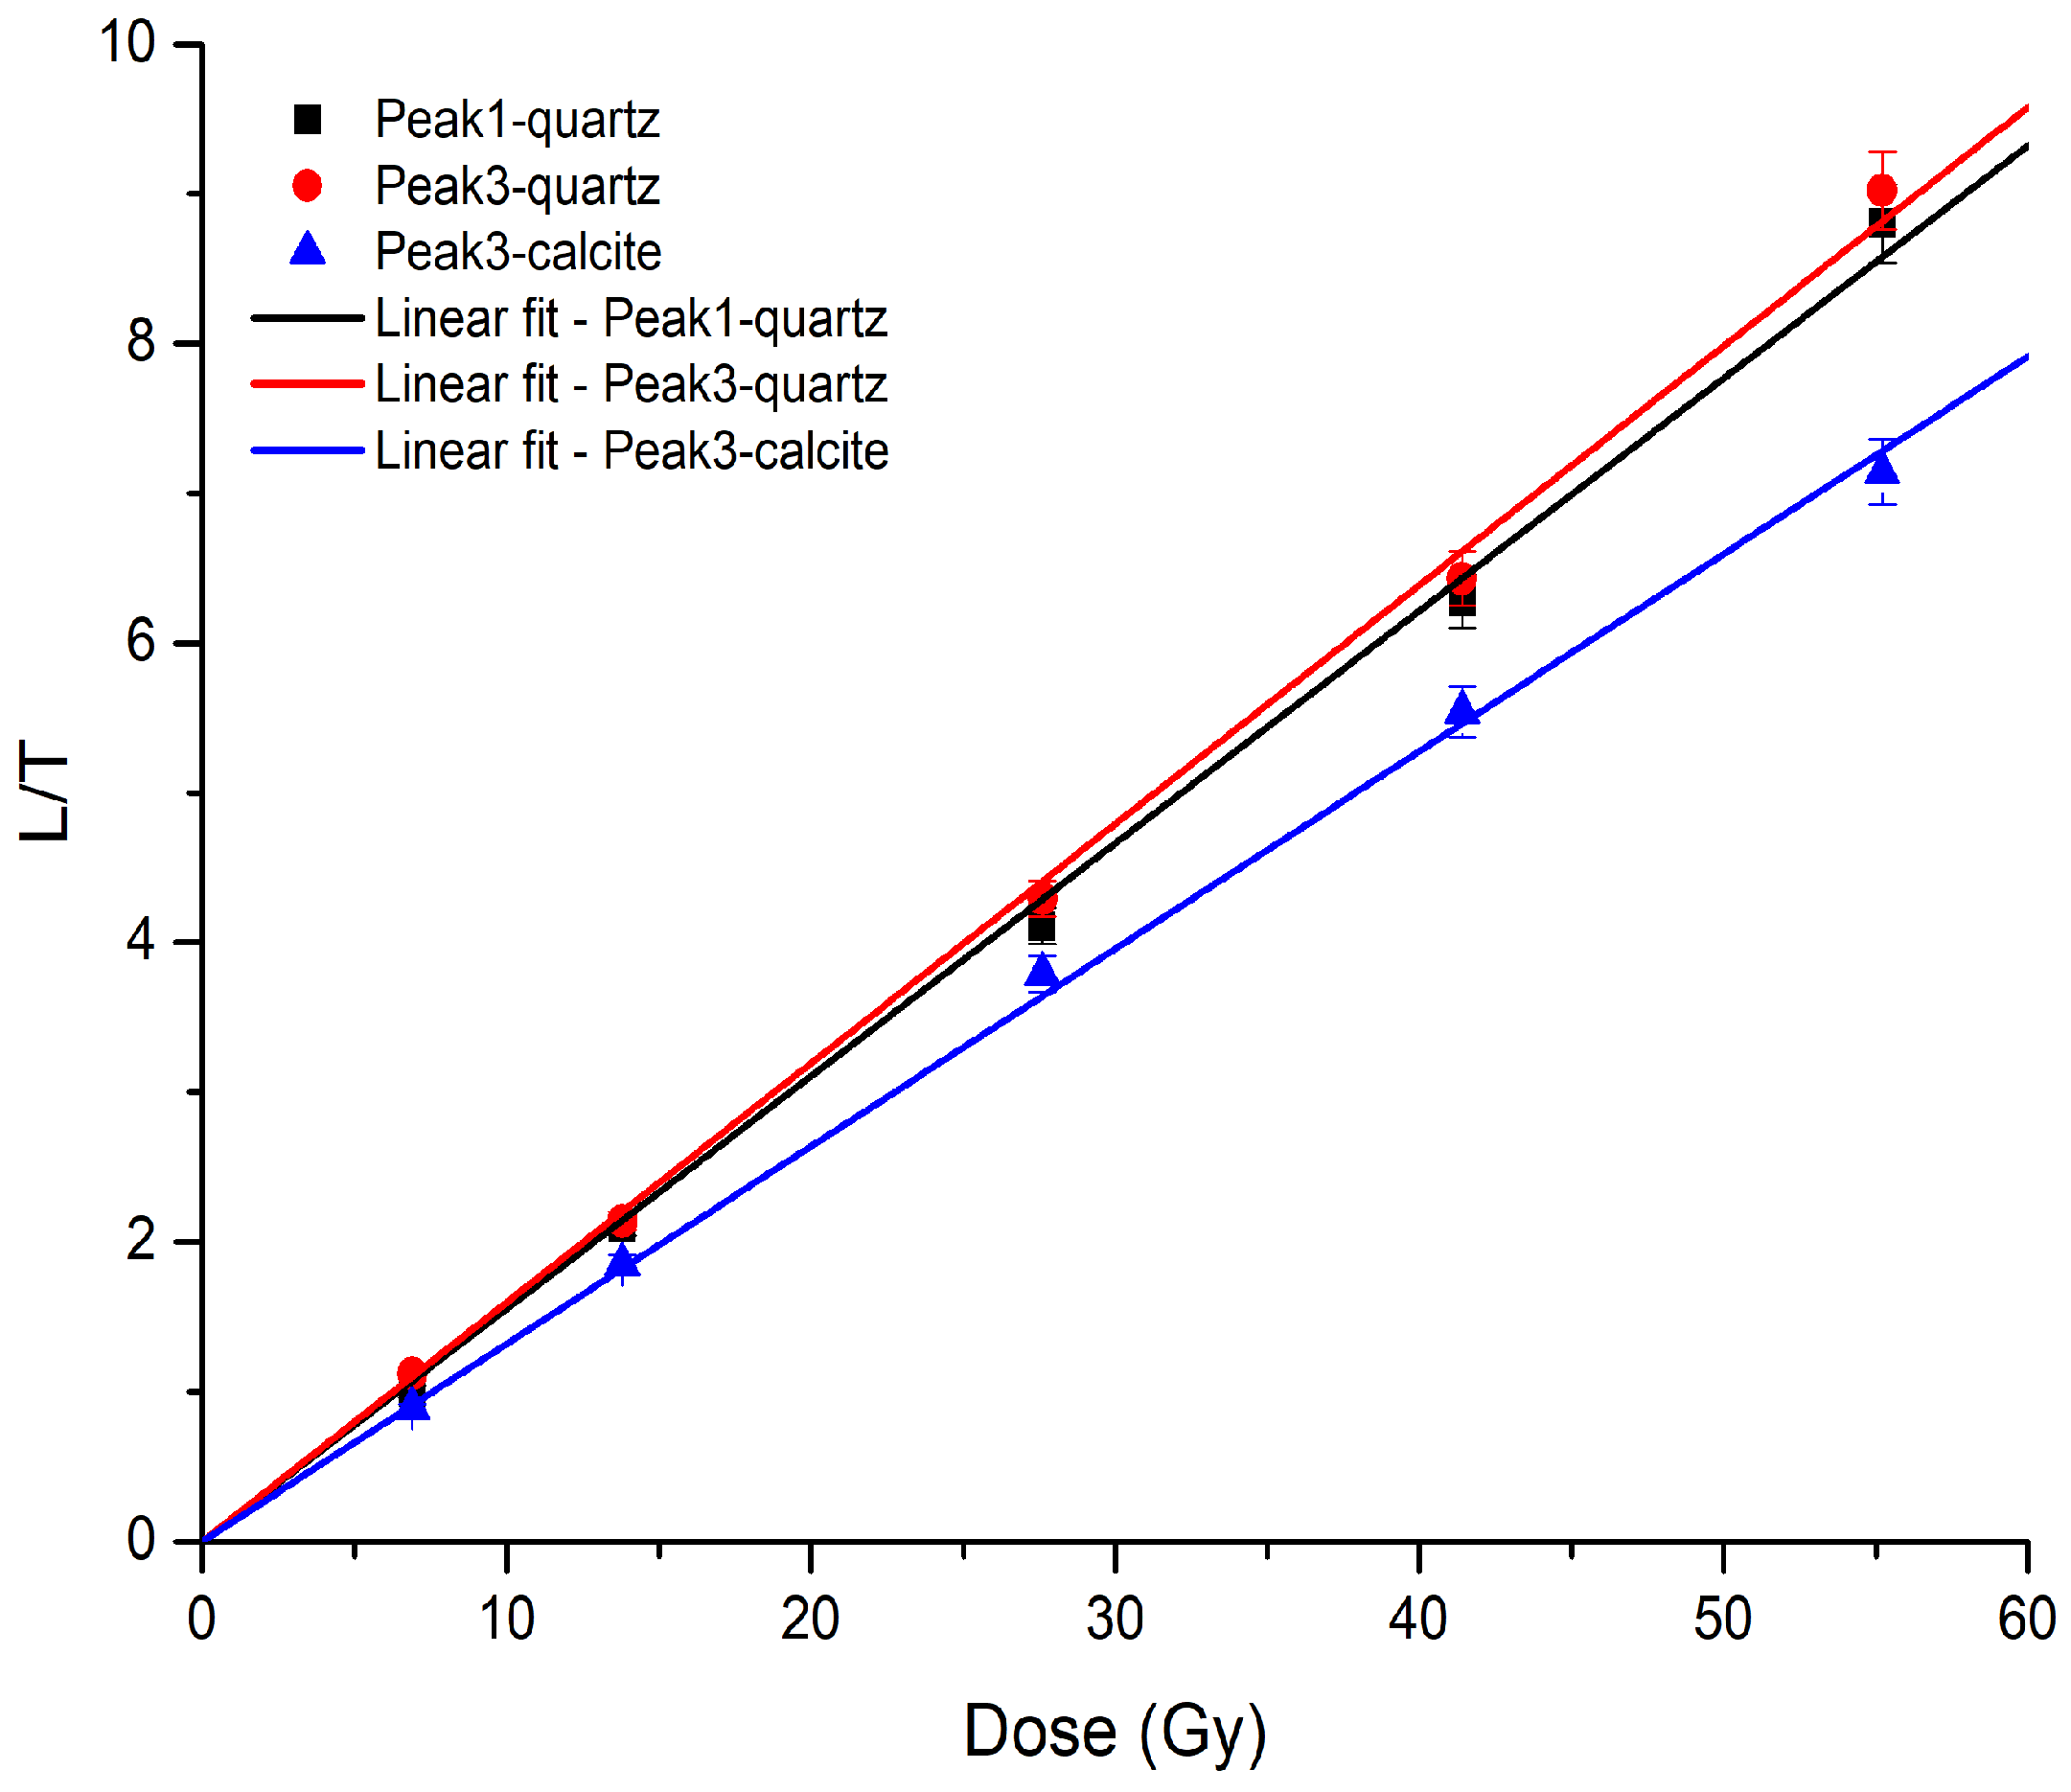
| Peak | RQuartz | RCalcite |
|---|---|---|
| P1 | 0.92 ± 0.30 | - |
| P2 | 0.94 ± 0.27 | 0.97 ± 0.27 |
| P3 | 0.96 ± 0.26 | 0.99 ± 0.27 |
Disclaimer/Publisher’s Note: The statements, opinions and data contained in all publications are solely those of the individual author(s) and contributor(s) and not of MDPI and/or the editor(s). MDPI and/or the editor(s) disclaim responsibility for any injury to people or property resulting from any ideas, methods, instructions or products referred to in the content. |
© 2025 by the authors. Licensee MDPI, Basel, Switzerland. This article is an open access article distributed under the terms and conditions of the Creative Commons Attribution (CC BY) license (https://creativecommons.org/licenses/by/4.0/).
Share and Cite
Galvagno, R.; Stella, G.; Reitano, R.; Gueli, A.M. Discrimination of Thermoluminescent Signals from Natural Quartz and Carbonate Crystals Mixture. Crystals 2025, 15, 306. https://doi.org/10.3390/cryst15040306
Galvagno R, Stella G, Reitano R, Gueli AM. Discrimination of Thermoluminescent Signals from Natural Quartz and Carbonate Crystals Mixture. Crystals. 2025; 15(4):306. https://doi.org/10.3390/cryst15040306
Chicago/Turabian StyleGalvagno, Rosaria, Giuseppe Stella, Riccardo Reitano, and Anna Maria Gueli. 2025. "Discrimination of Thermoluminescent Signals from Natural Quartz and Carbonate Crystals Mixture" Crystals 15, no. 4: 306. https://doi.org/10.3390/cryst15040306
APA StyleGalvagno, R., Stella, G., Reitano, R., & Gueli, A. M. (2025). Discrimination of Thermoluminescent Signals from Natural Quartz and Carbonate Crystals Mixture. Crystals, 15(4), 306. https://doi.org/10.3390/cryst15040306