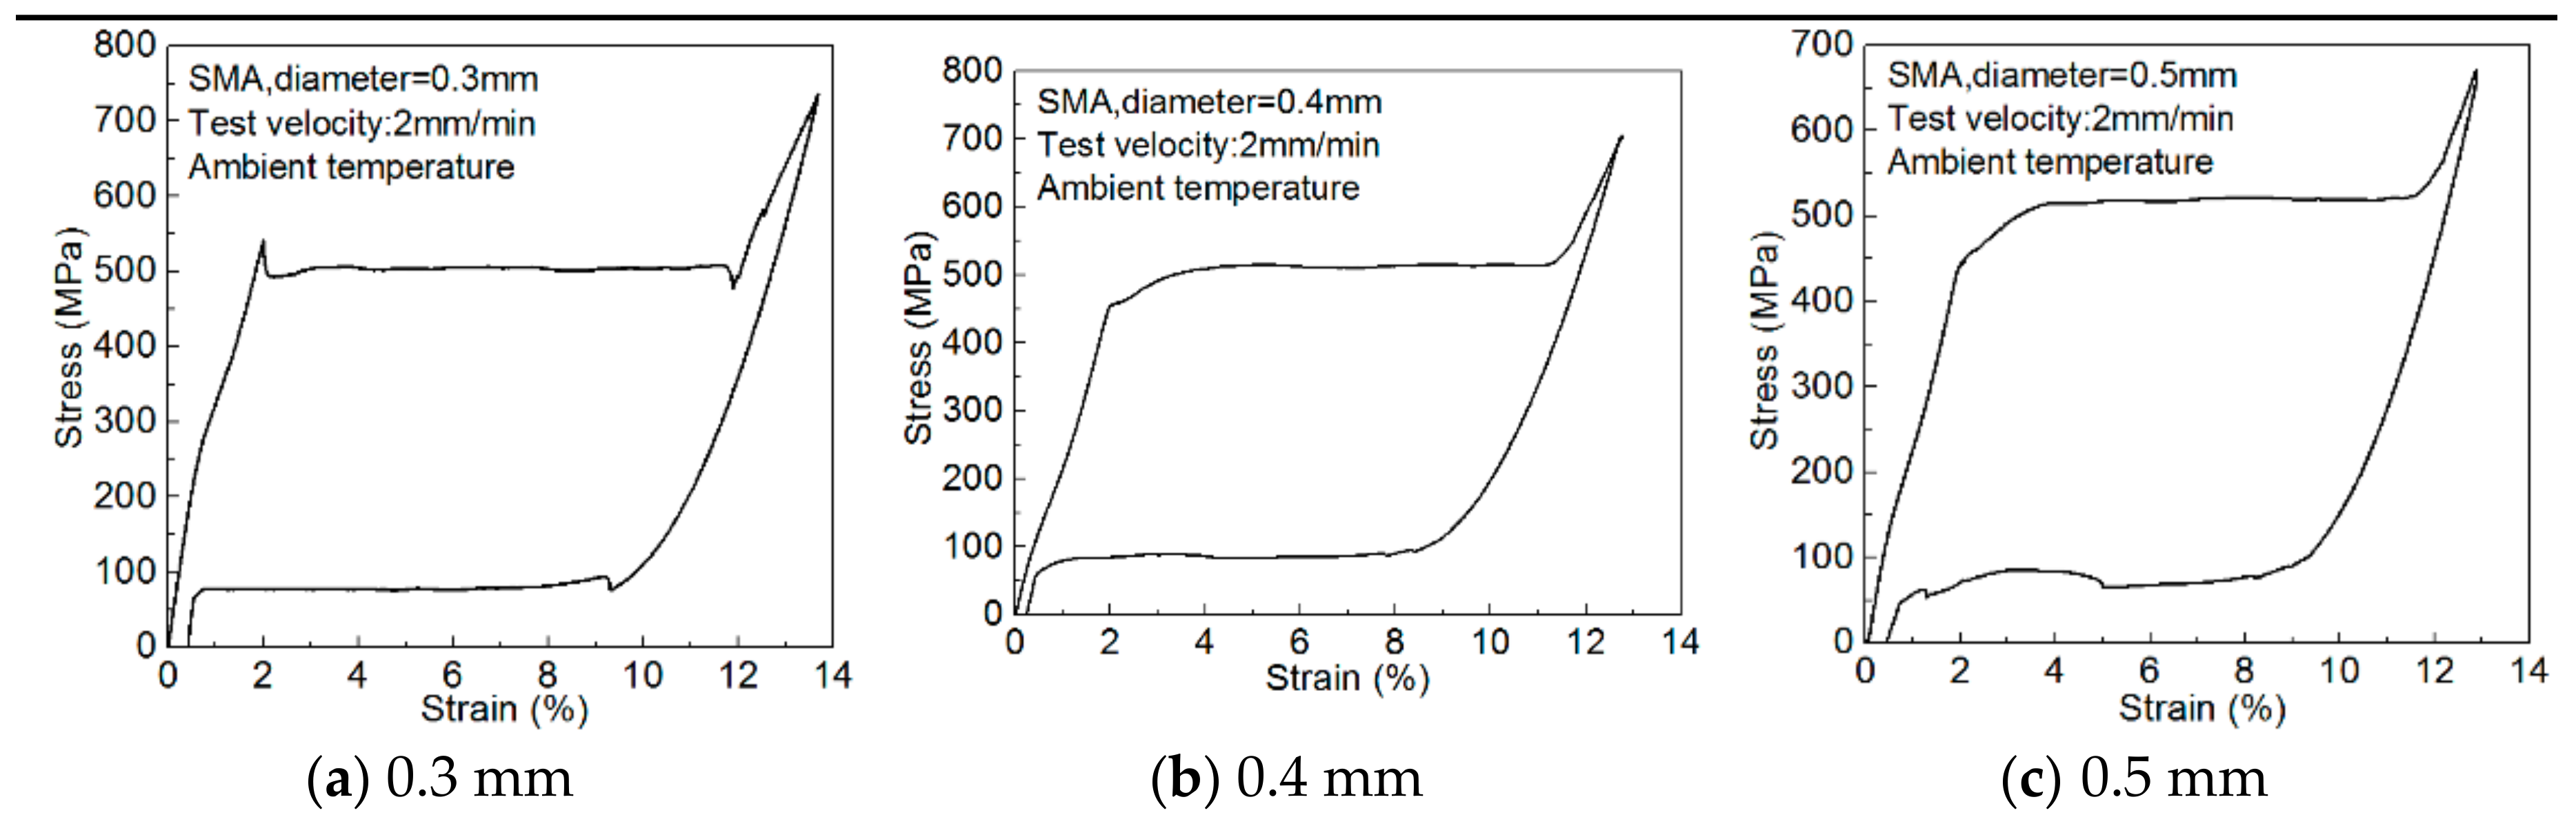
Figure 1.
The stress–strain diagram of Ni-Ti shape memory alloy wires.
Figure 1.
The stress–strain diagram of Ni-Ti shape memory alloy wires.
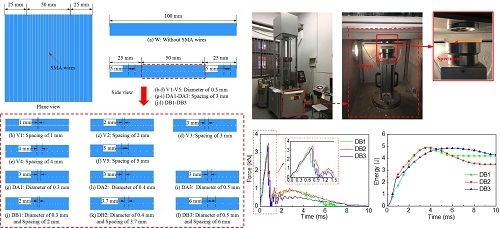
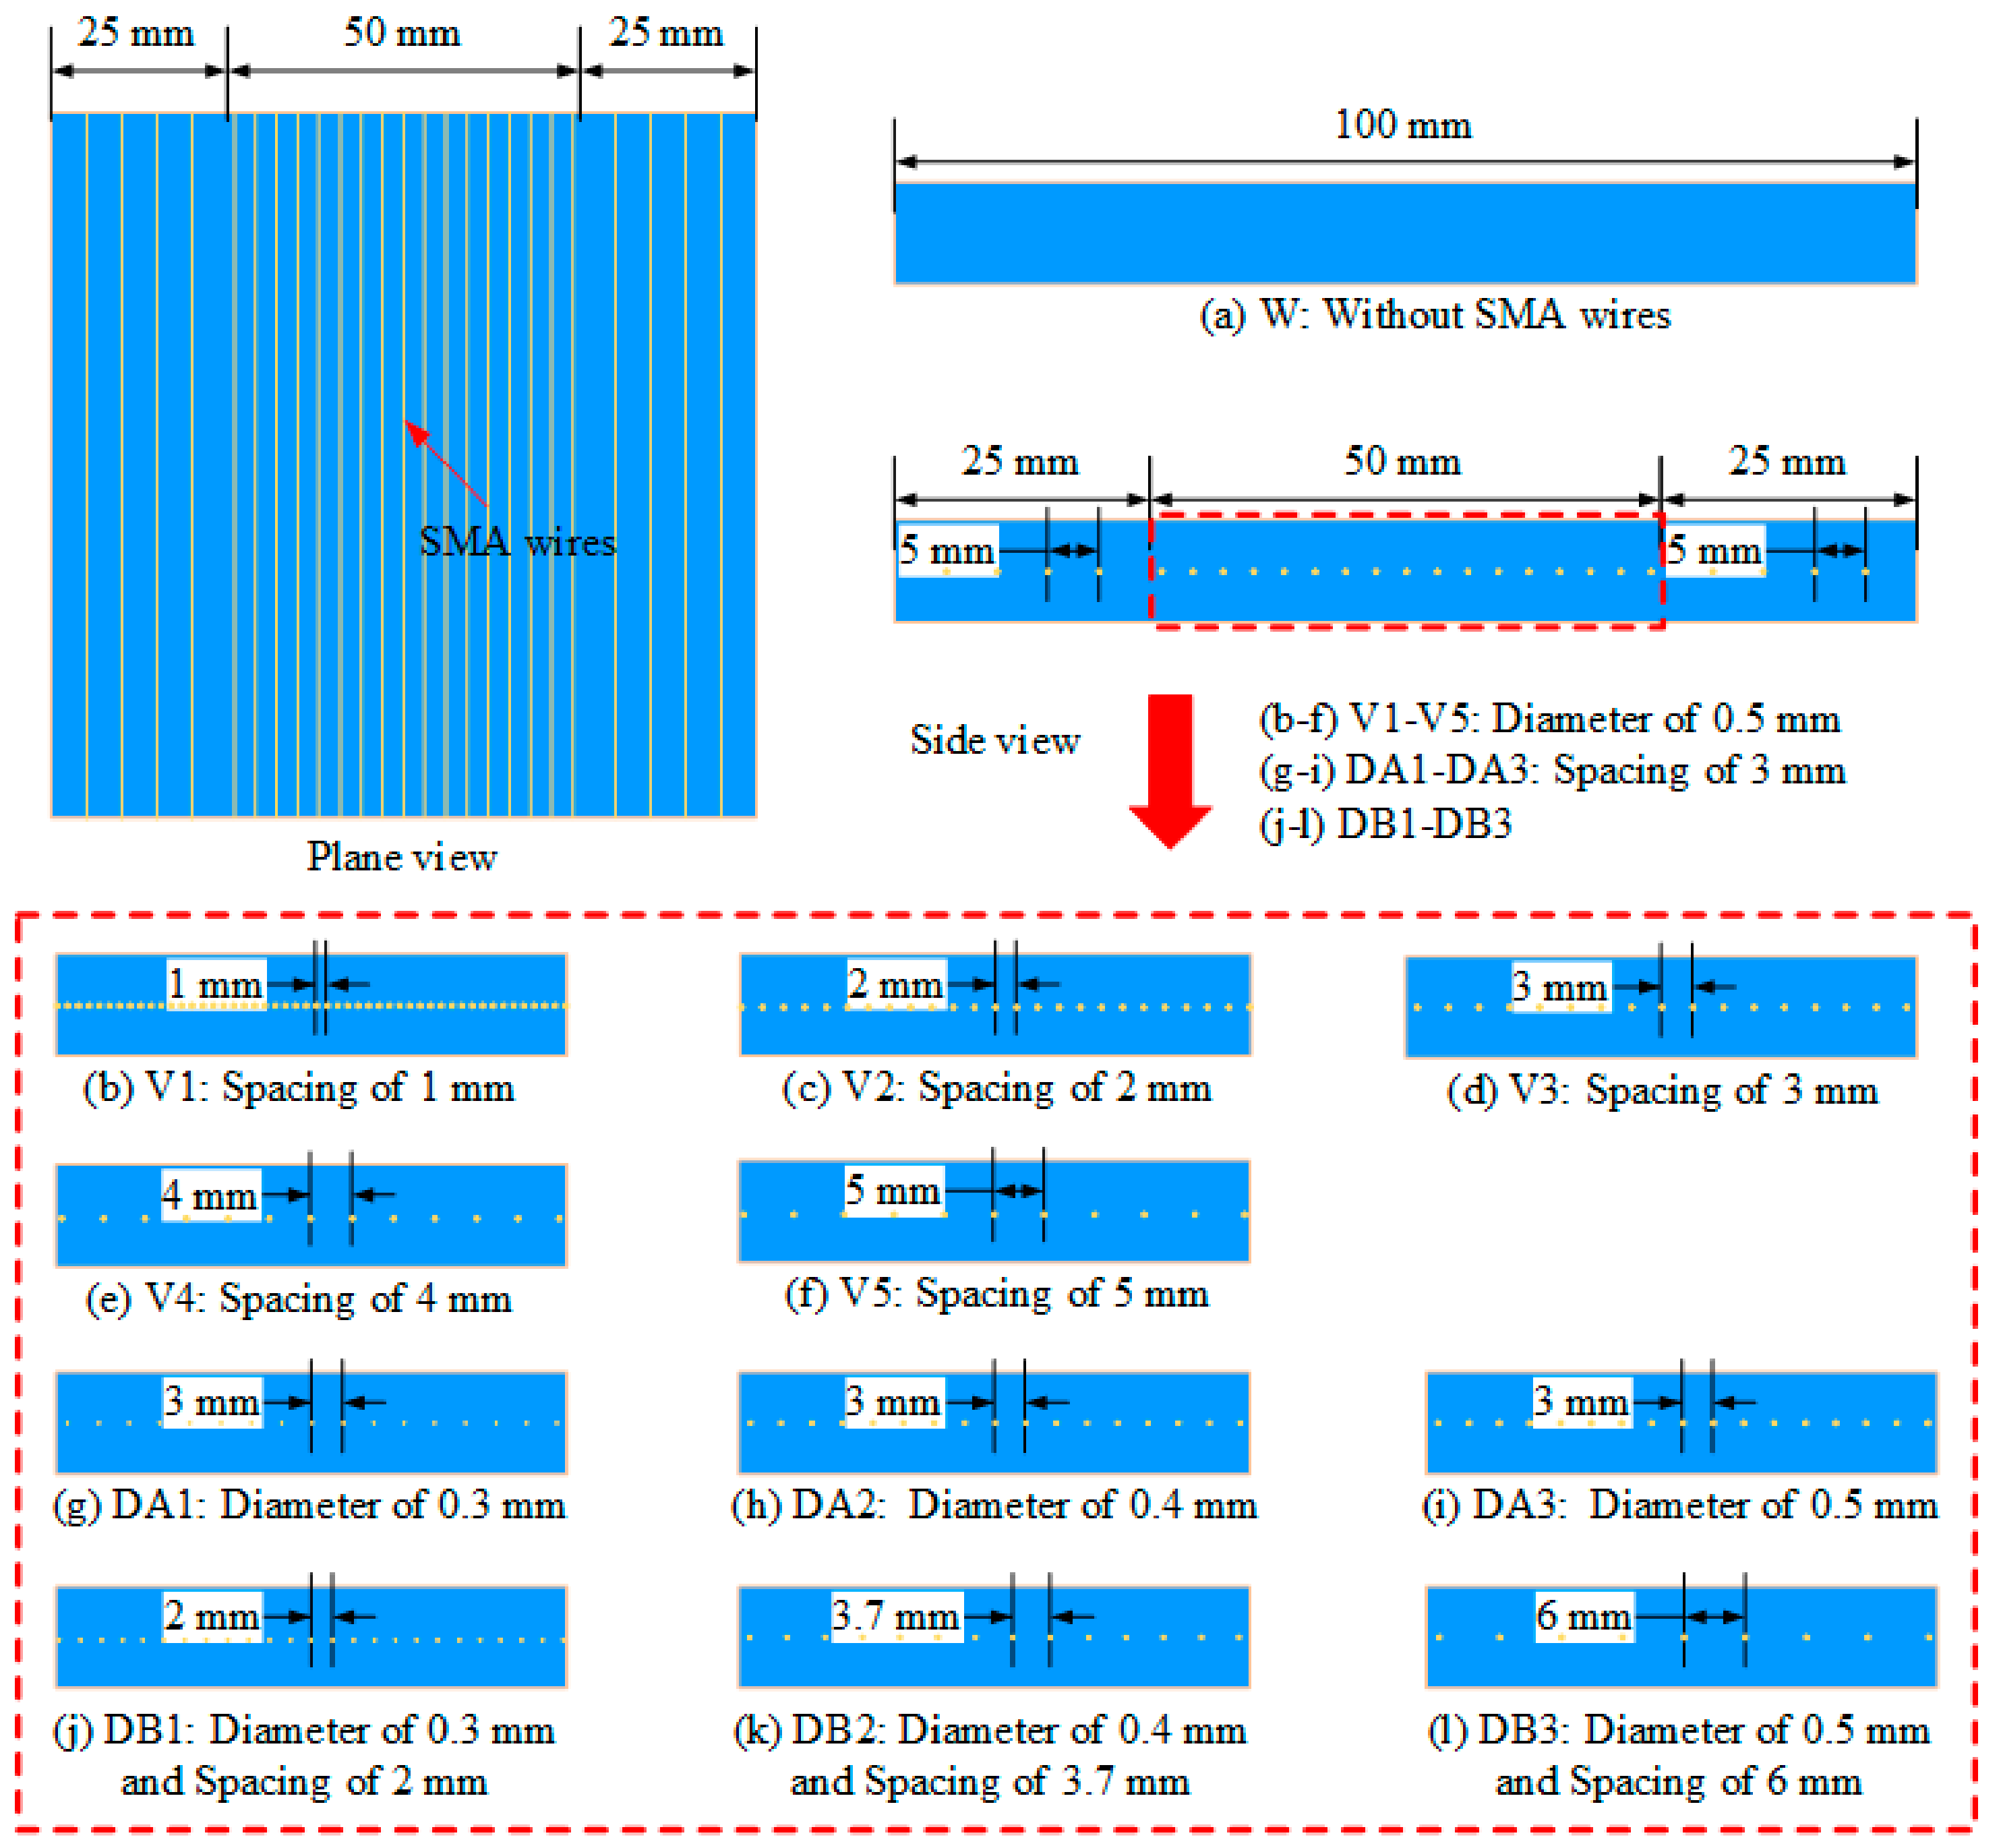
Figure 2.
The schematics and codes of composites specimens.
Figure 2.
The schematics and codes of composites specimens.
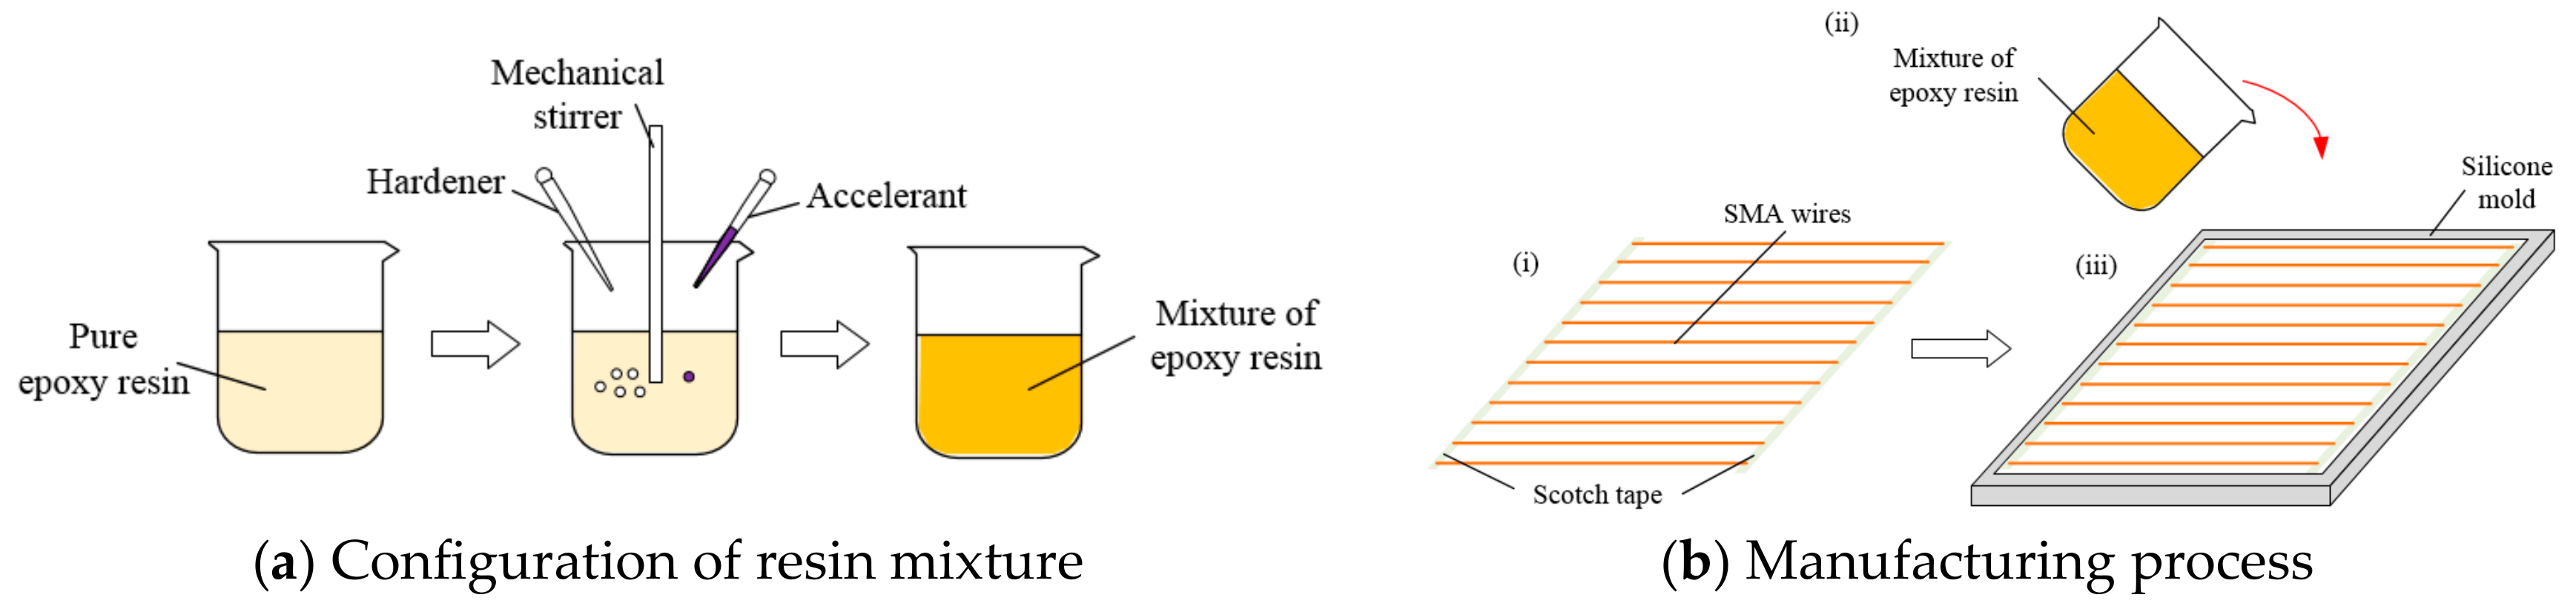
Figure 3.
The overall preparation process of the SMA reinforced polymer composites.
Figure 3.
The overall preparation process of the SMA reinforced polymer composites.
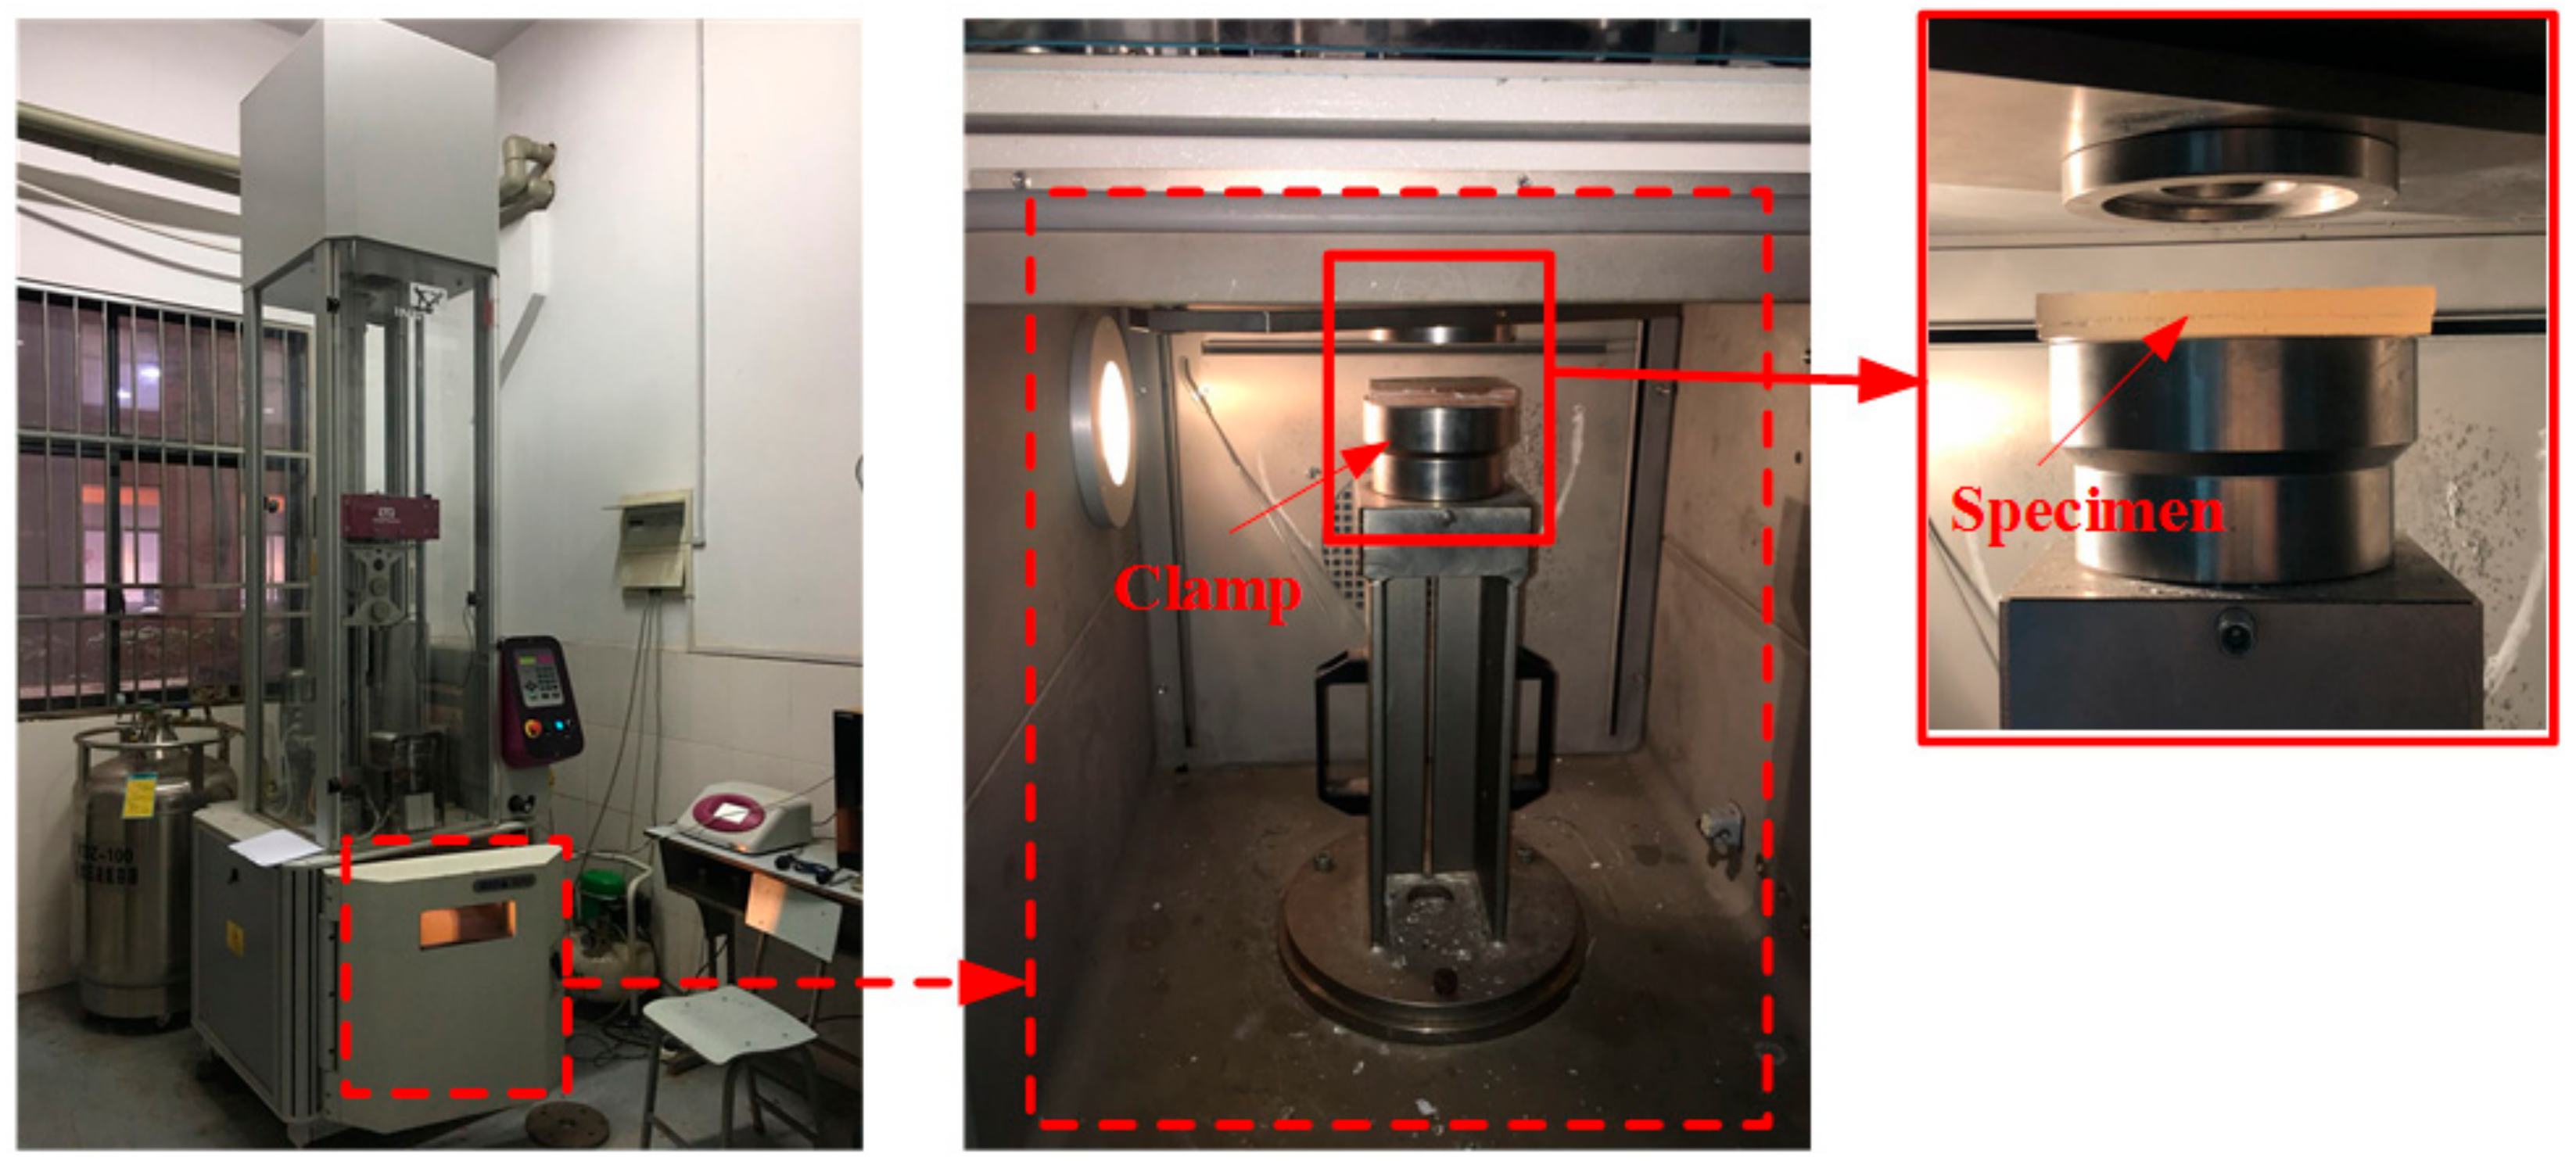
Figure 4.
The Instron CEAST 9350HV drop weight impact testing machine.
Figure 4.
The Instron CEAST 9350HV drop weight impact testing machine.
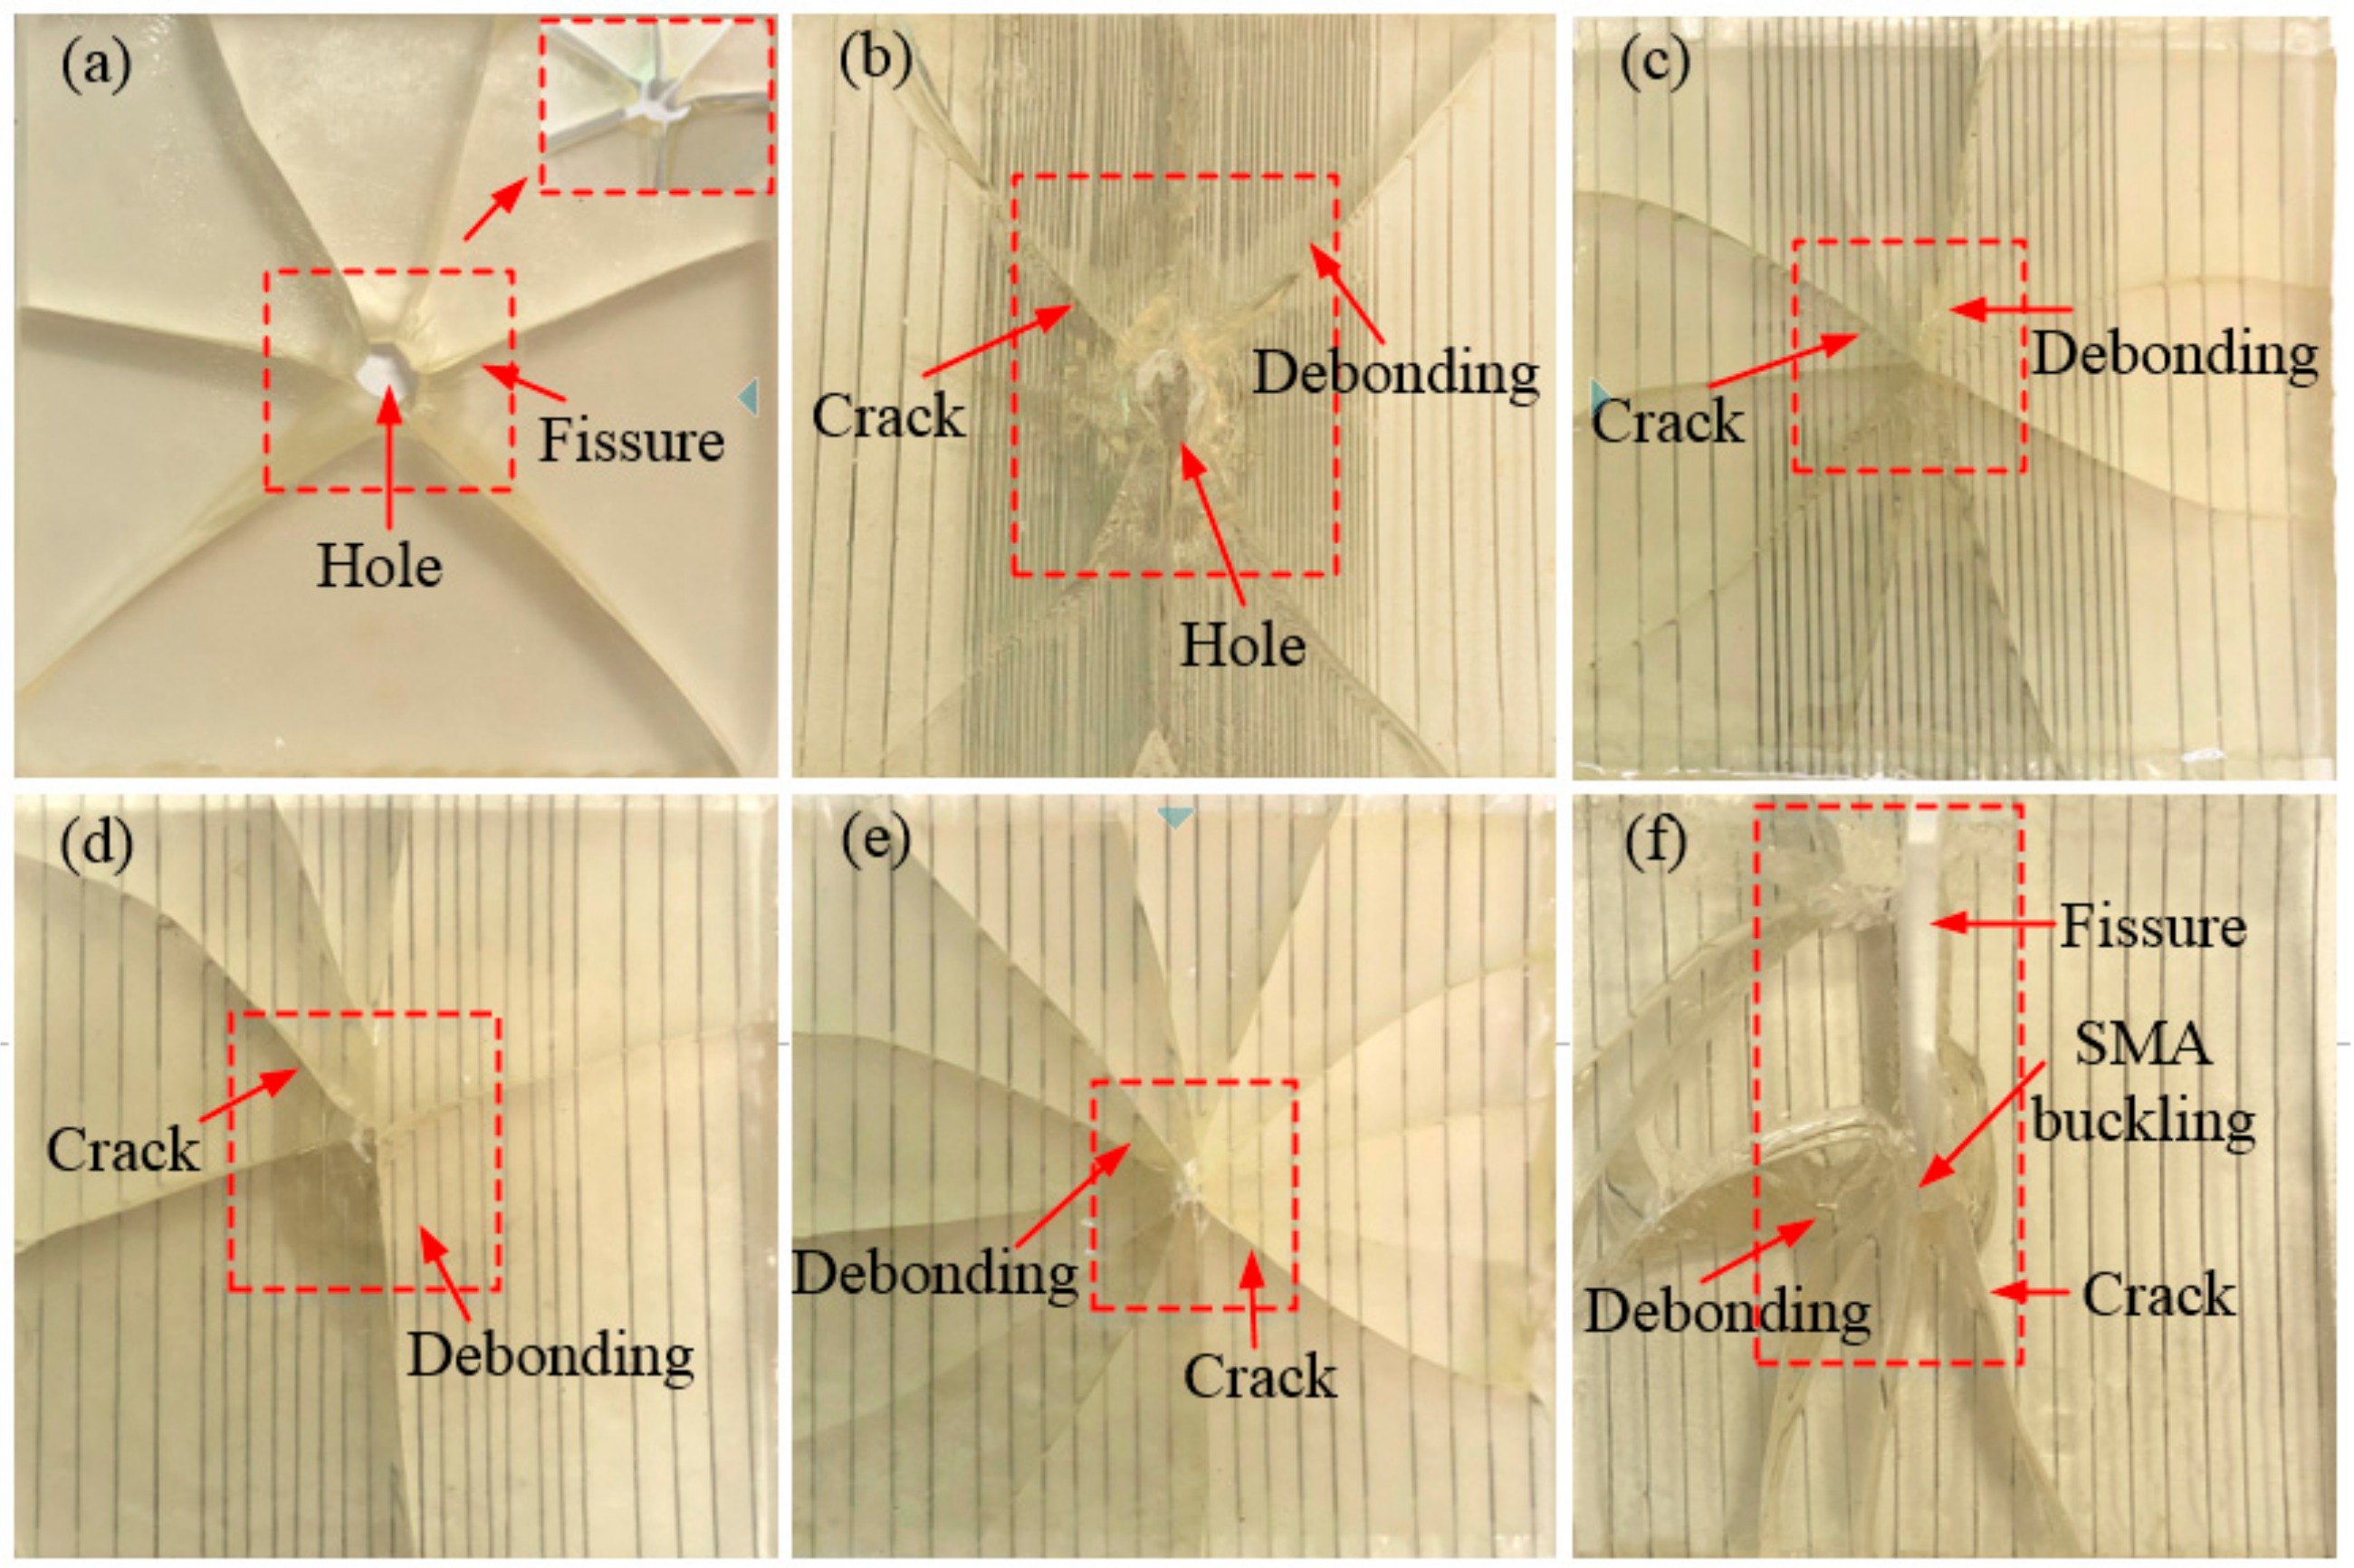
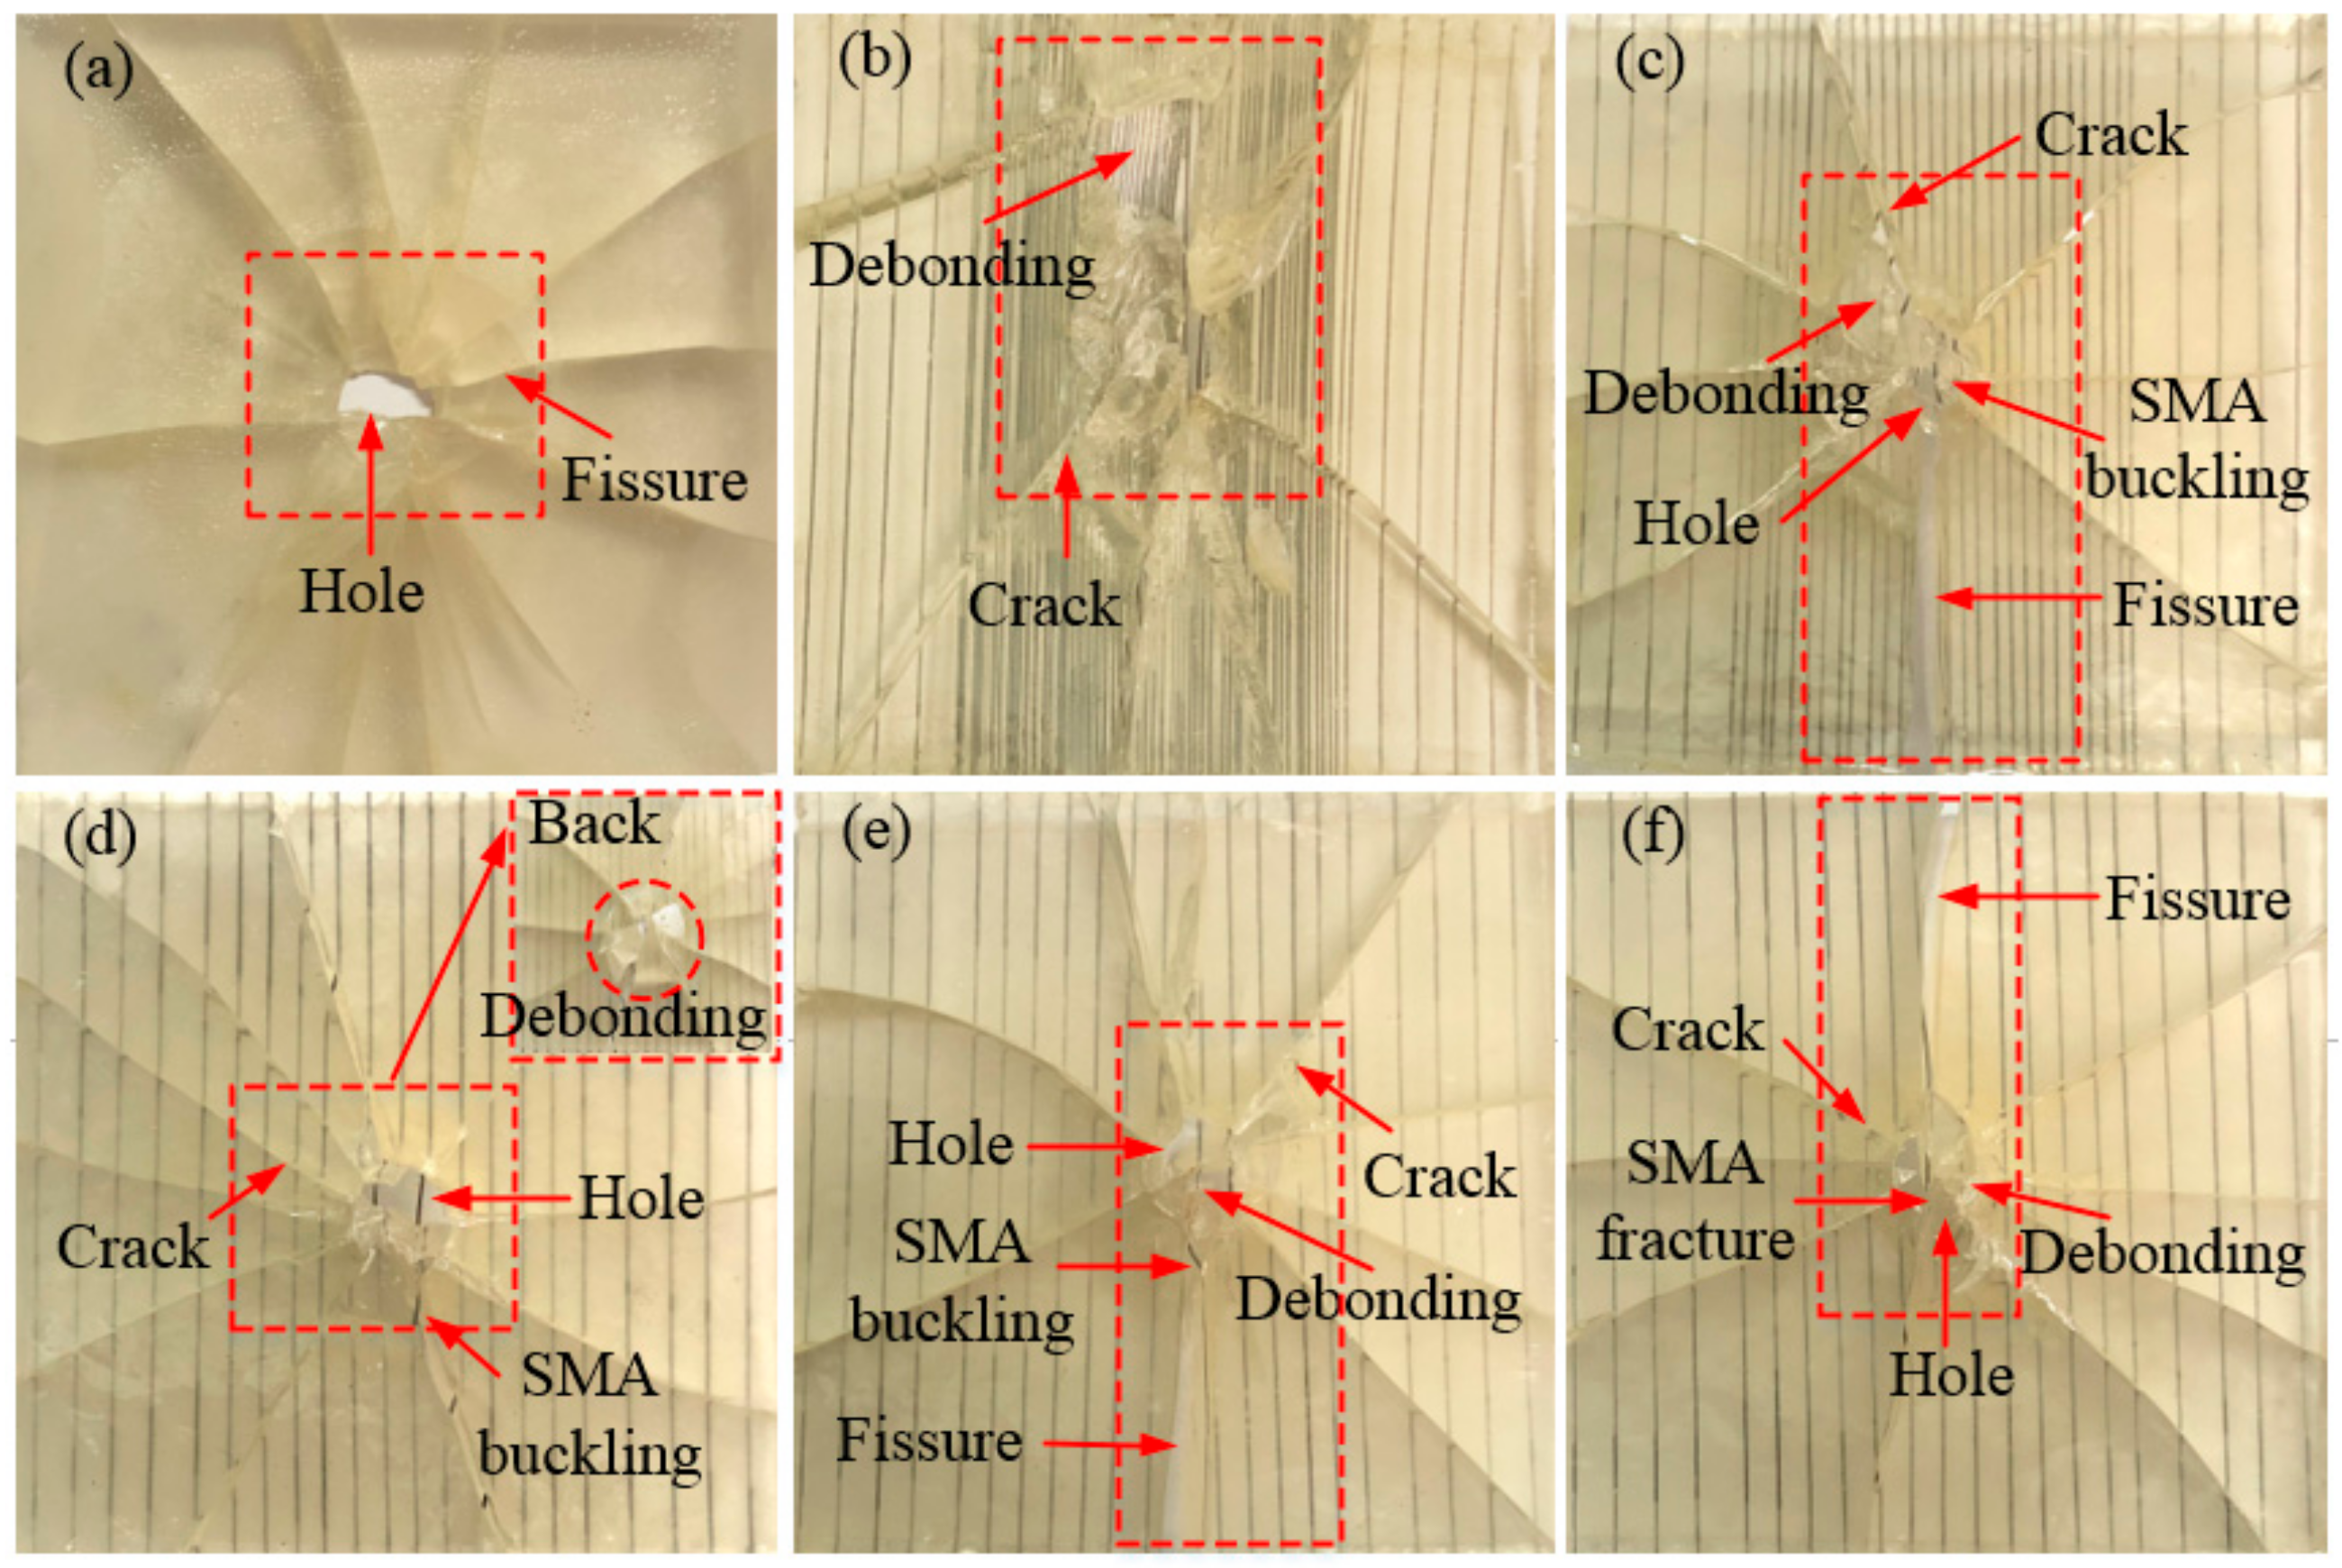
Figure 5.
The failure modes diagrams of specimens with different SMA layup spacing values under 5 J of energy: (a) indicates the pure resin-matrix test specimen; (b–f) indicate the SMA reinforced resin-matrix test specimens with SMA layup spacing of 1, 2, 3, 4, 5 mm, respectively.
Figure 5.
The failure modes diagrams of specimens with different SMA layup spacing values under 5 J of energy: (a) indicates the pure resin-matrix test specimen; (b–f) indicate the SMA reinforced resin-matrix test specimens with SMA layup spacing of 1, 2, 3, 4, 5 mm, respectively.
Figure 6.
The failure modes diagrams of spacing specimens with different SMA layup spacing under 14 J of energy: (a) indicates the pure resin-matrix test specimen; (b–f) indicate the SMA reinforced resin-matrix test specimens with SMA layup spacing of 1, 2, 3, 4, 5 mm, respectively.
Figure 6.
The failure modes diagrams of spacing specimens with different SMA layup spacing under 14 J of energy: (a) indicates the pure resin-matrix test specimen; (b–f) indicate the SMA reinforced resin-matrix test specimens with SMA layup spacing of 1, 2, 3, 4, 5 mm, respectively.
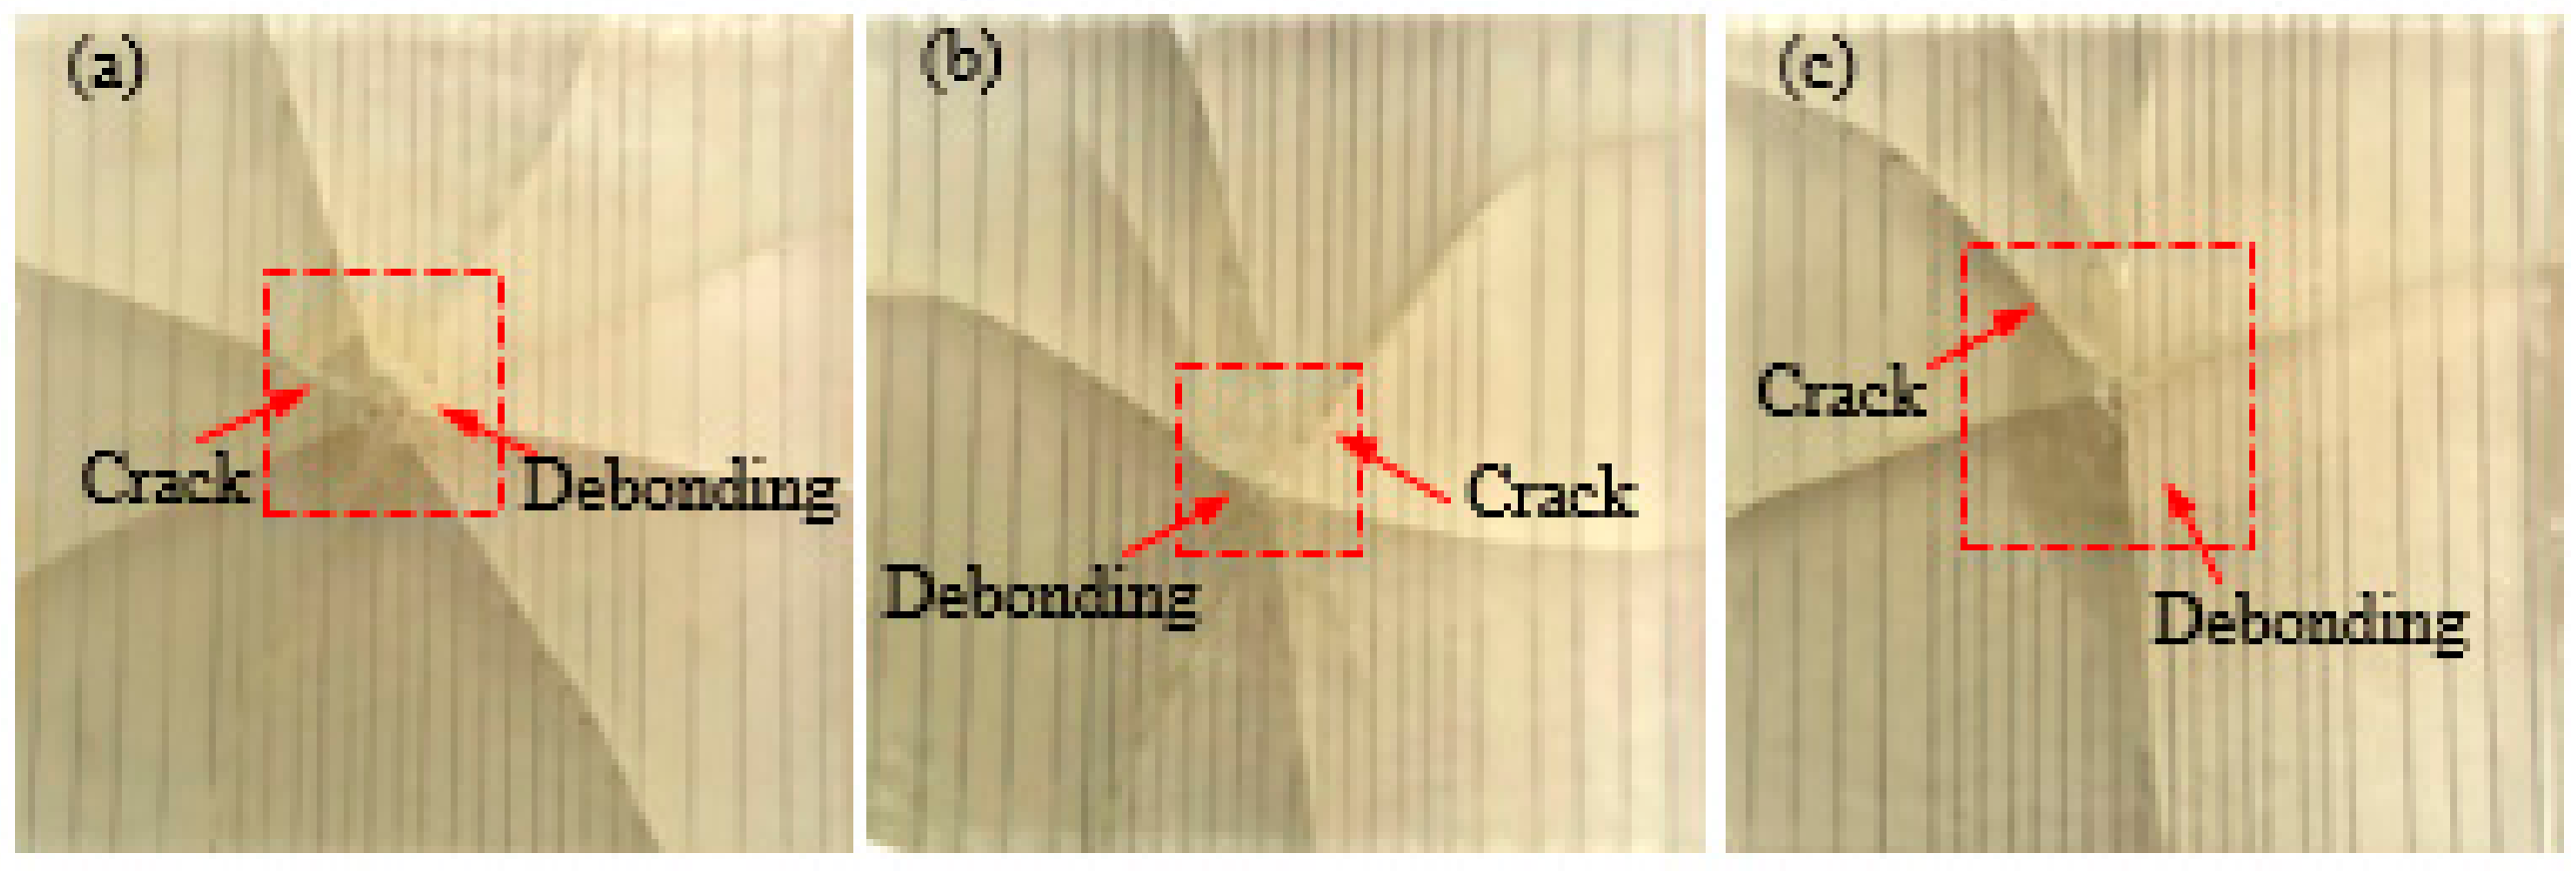
Figure 7.
The failure modes diagrams of specimens with different SMA diameters under 5 J of energy: (a–c) indicate the SMA reinforced resin-matrix test specimens with SMA diameters of 0.3, 0.4, 0.5 mm, respectively.
Figure 7.
The failure modes diagrams of specimens with different SMA diameters under 5 J of energy: (a–c) indicate the SMA reinforced resin-matrix test specimens with SMA diameters of 0.3, 0.4, 0.5 mm, respectively.
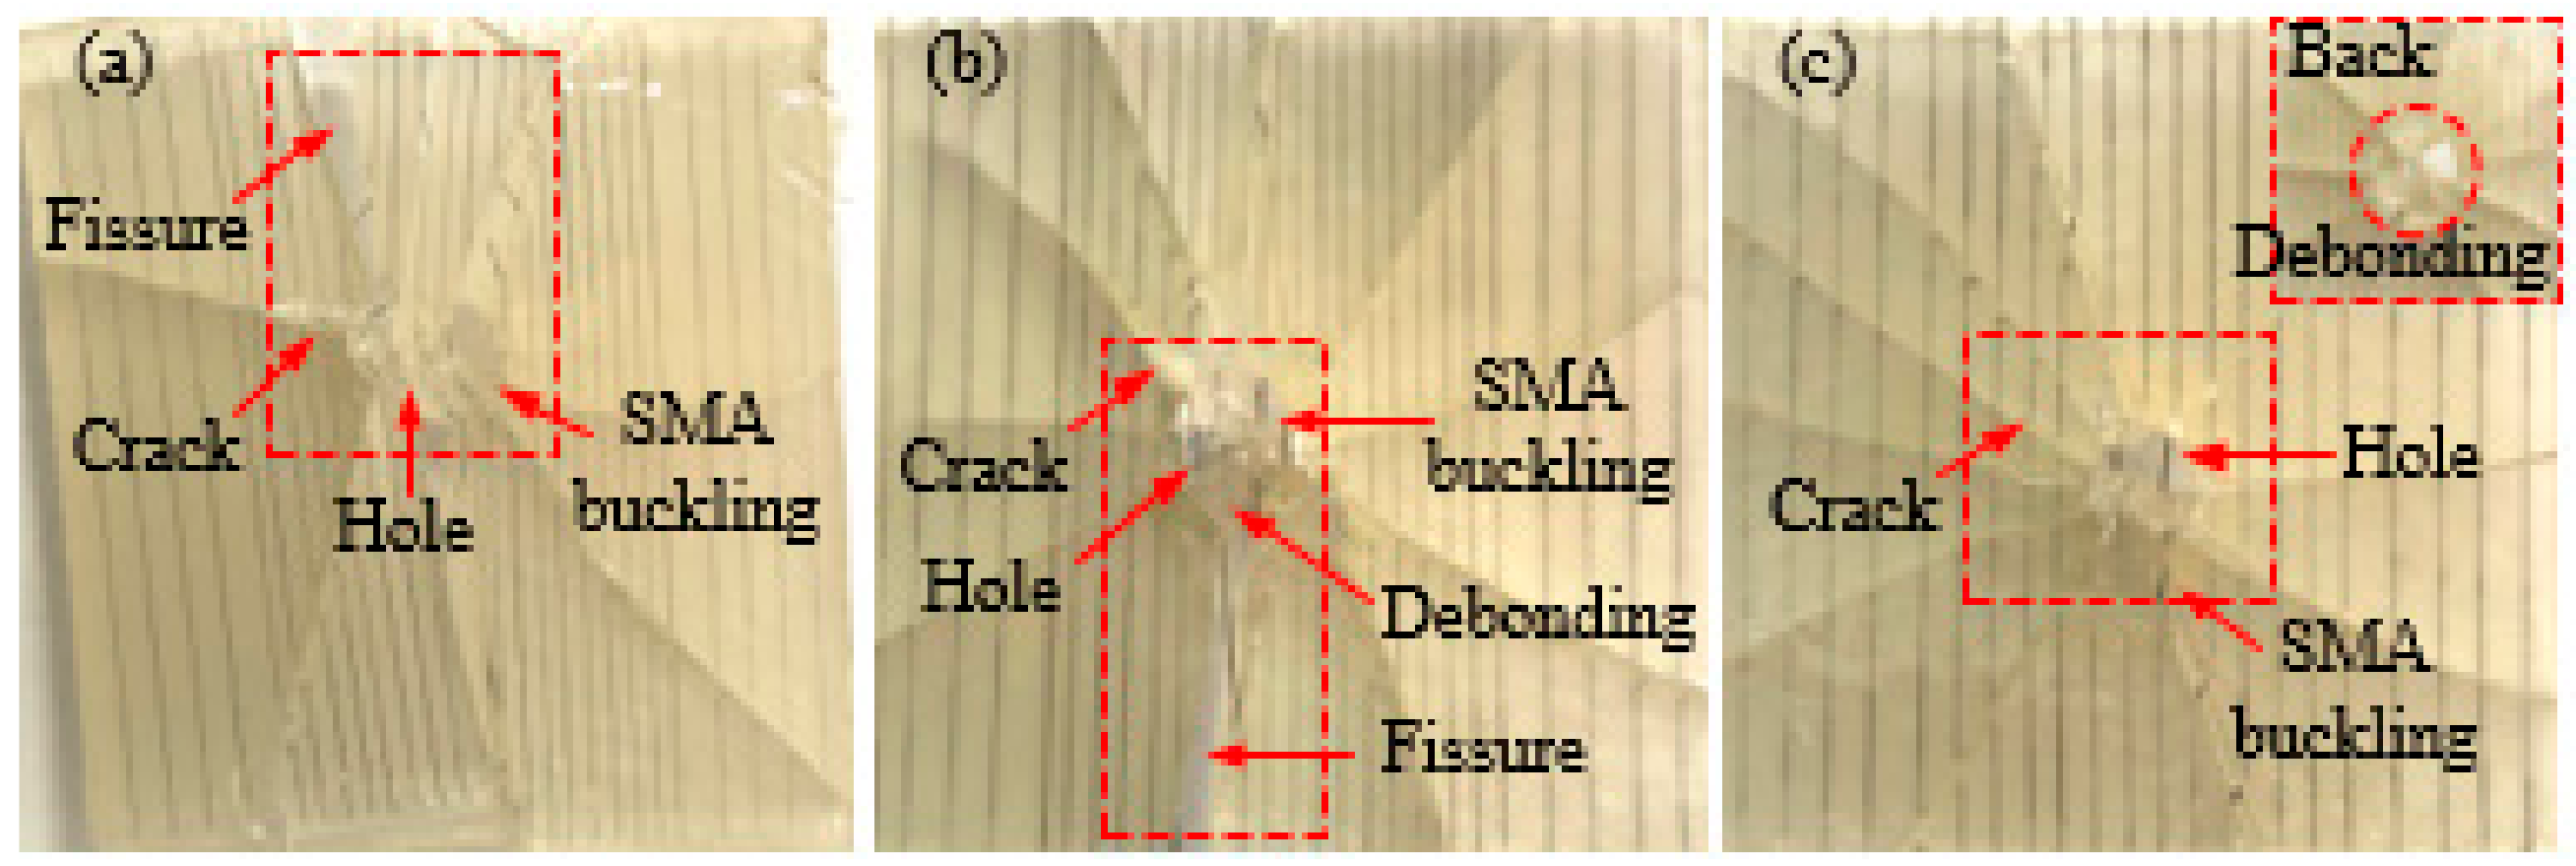
Figure 8.
The failure modes diagrams of specimens with different SMA diameters under 14 J of energy: (a–c) indicate the SMA reinforced resin-matrix test specimens with SMA diameters of 0.3, 0.4, 0.5 mm, respectively.
Figure 8.
The failure modes diagrams of specimens with different SMA diameters under 14 J of energy: (a–c) indicate the SMA reinforced resin-matrix test specimens with SMA diameters of 0.3, 0.4, 0.5 mm, respectively.
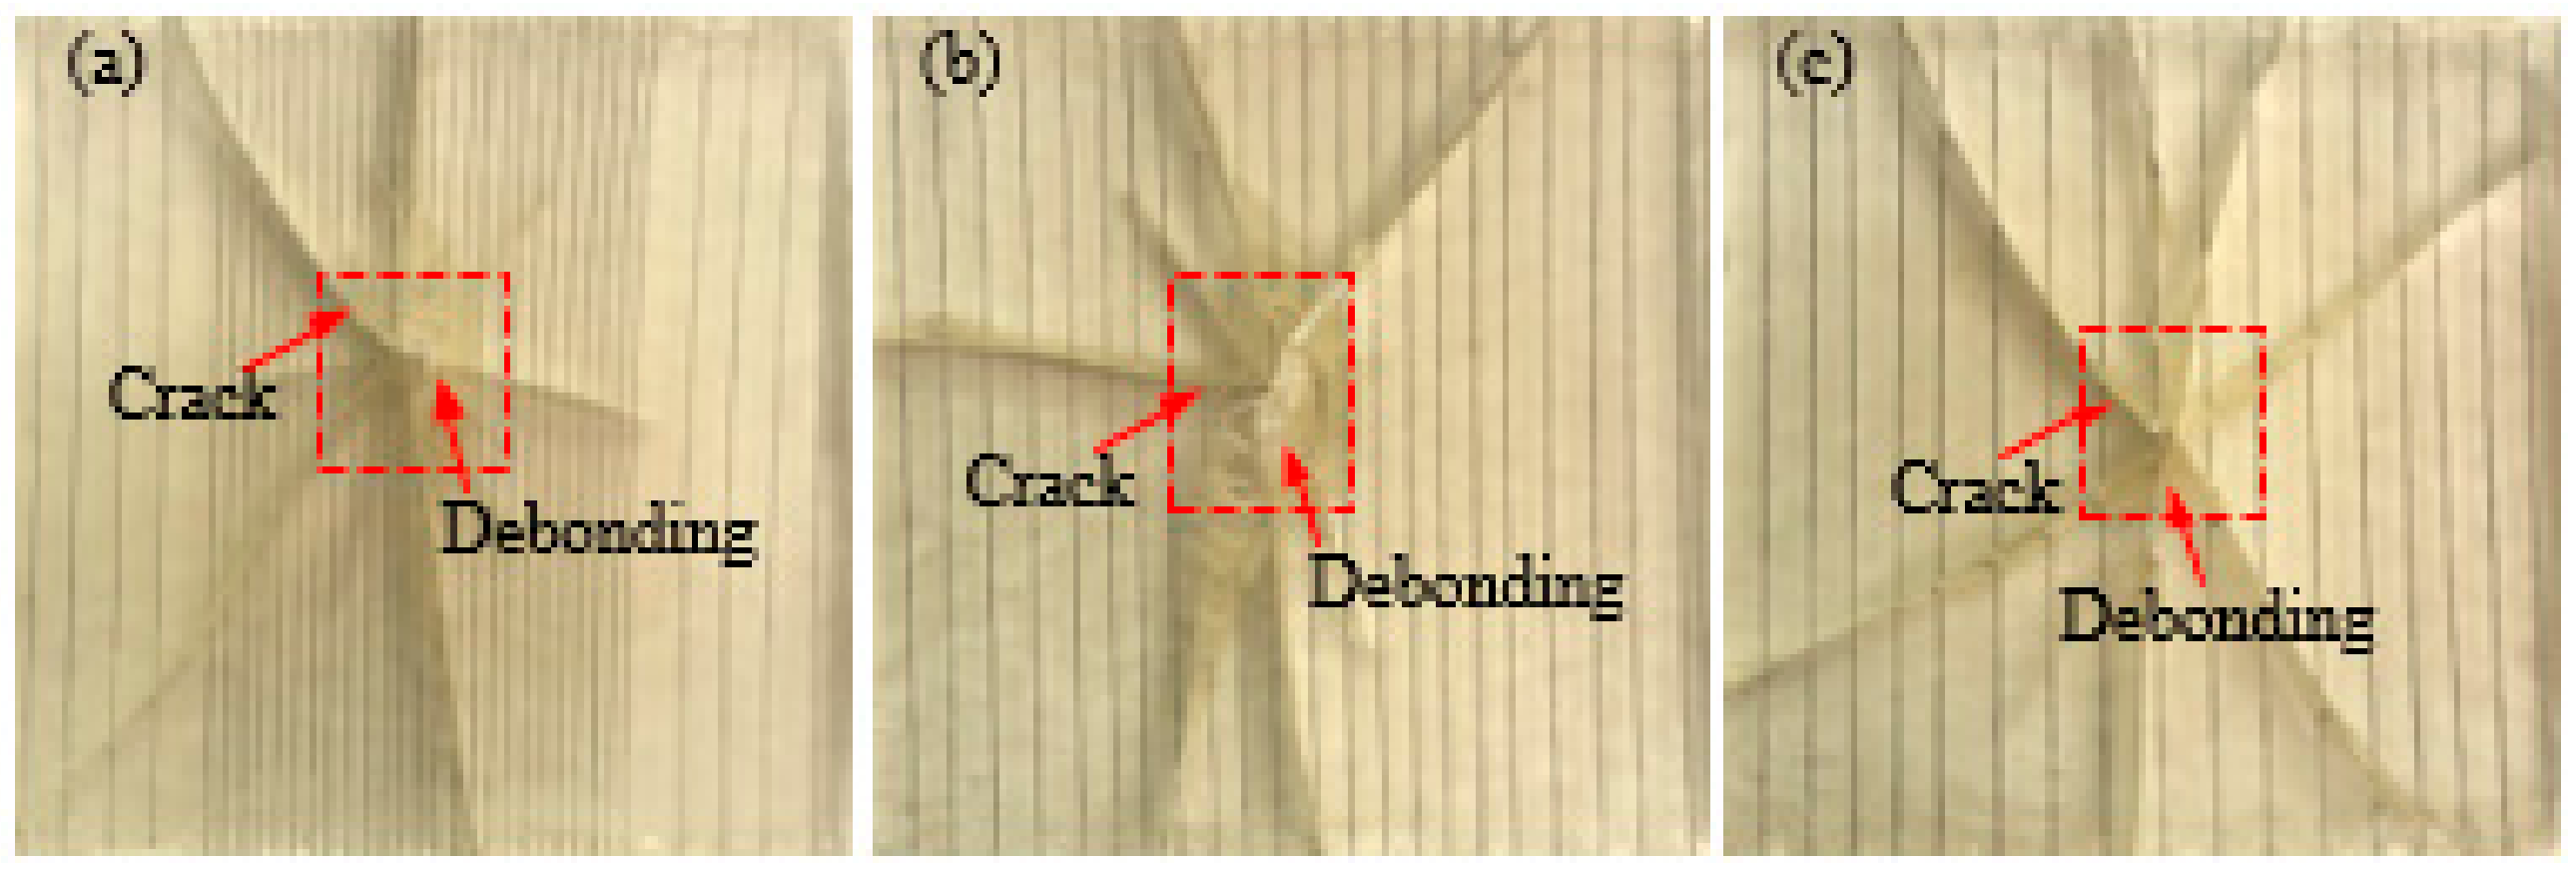
Figure 9.
The failure modes diagrams of specimens with different SMA layup spacing values and diameters under 5 J of energy: (a–c) indicate the SMA reinforced resin-matrix test specimens with SMA diameters of 0.3, 0.4, 0.5 mm, respectively, and SMA layup spacing of 2, 3.7, 6 mm, respectively.
Figure 9.
The failure modes diagrams of specimens with different SMA layup spacing values and diameters under 5 J of energy: (a–c) indicate the SMA reinforced resin-matrix test specimens with SMA diameters of 0.3, 0.4, 0.5 mm, respectively, and SMA layup spacing of 2, 3.7, 6 mm, respectively.
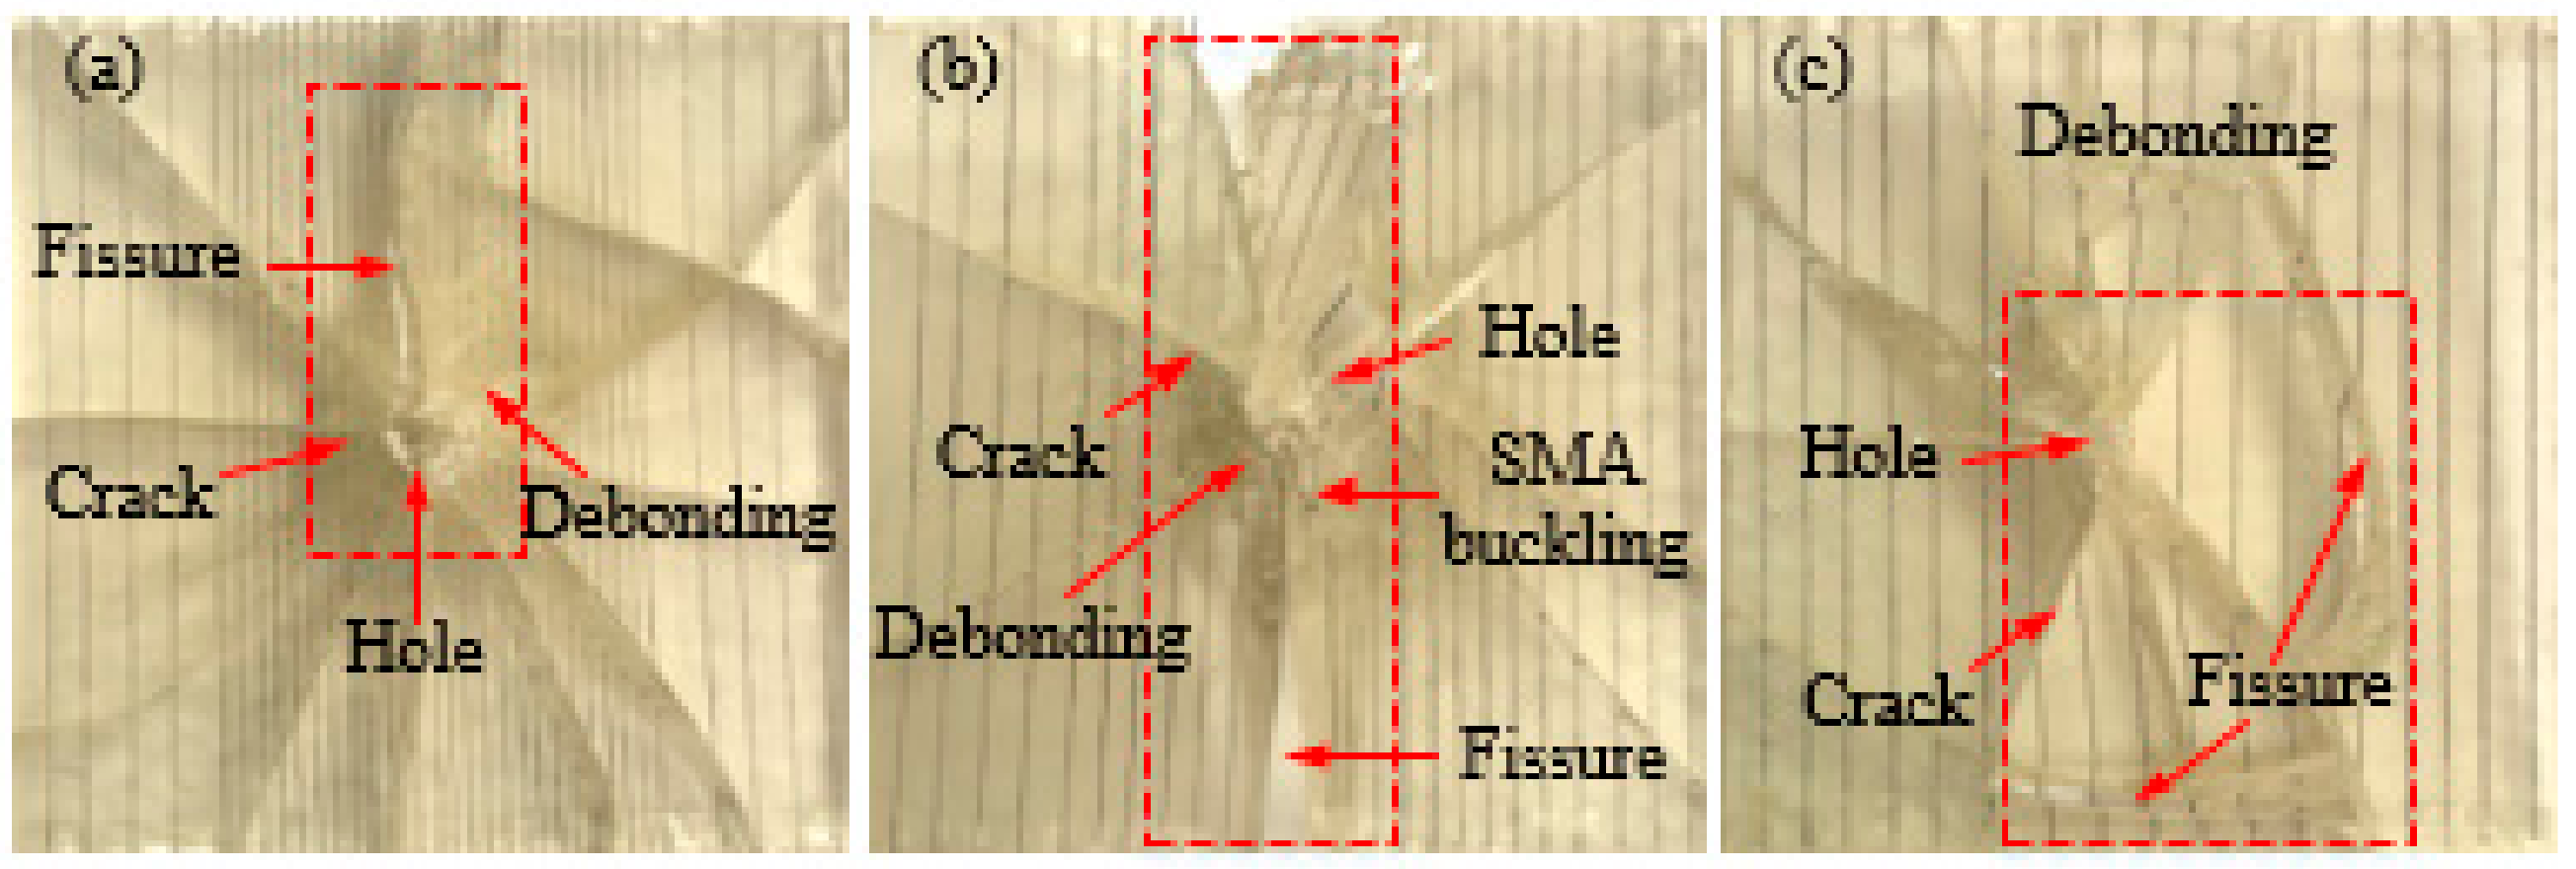
Figure 10.
The failure modes diagrams of specimens with different SMA layup spacing values and diameters under 14 J of energy: (a–c) indicate the SMA reinforced resin-matrix test specimens with SMA diameters of 0.3, 0.4, 0.5 mm, respectively, and SMA layup spacing of 2, 3.7, 6 mm, respectively.
Figure 10.
The failure modes diagrams of specimens with different SMA layup spacing values and diameters under 14 J of energy: (a–c) indicate the SMA reinforced resin-matrix test specimens with SMA diameters of 0.3, 0.4, 0.5 mm, respectively, and SMA layup spacing of 2, 3.7, 6 mm, respectively.
Figure 11.
The force-time curves and energy-time curves of the composites with different SMA spacing under two impact energies: (a) Initial impact energy of 5 J; (b) Initial impact energy of 14 J.
Figure 11.
The force-time curves and energy-time curves of the composites with different SMA spacing under two impact energies: (a) Initial impact energy of 5 J; (b) Initial impact energy of 14 J.
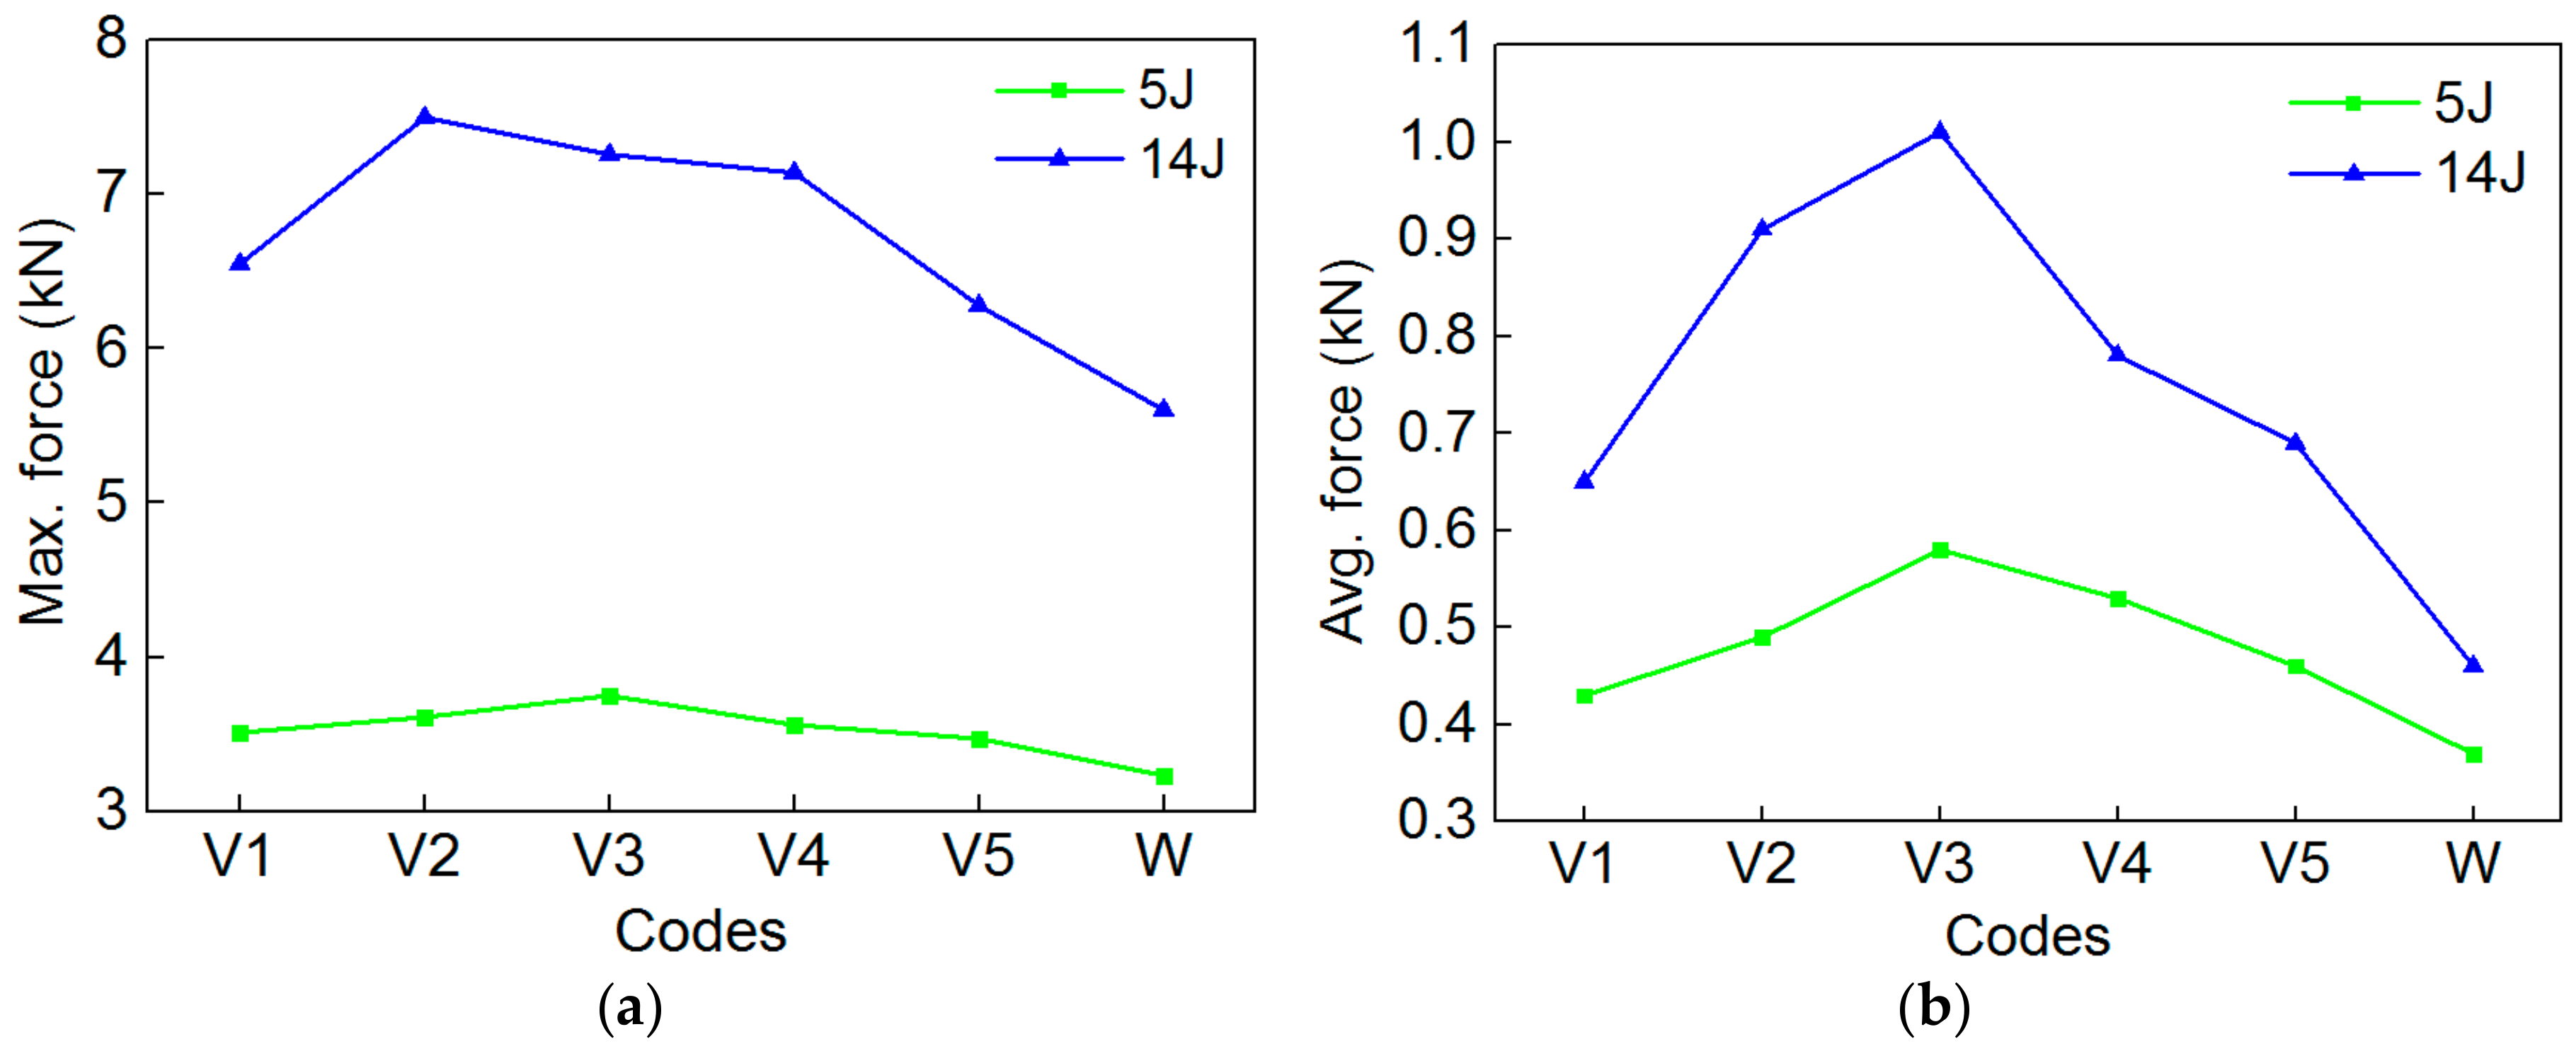
Figure 12.
The maximum contact force and average contact force value of specimens of V1/V2/V3/V4/V5/W under the two impact energies: (a) Max. force; (b) Avg. force.
Figure 12.
The maximum contact force and average contact force value of specimens of V1/V2/V3/V4/V5/W under the two impact energies: (a) Max. force; (b) Avg. force.
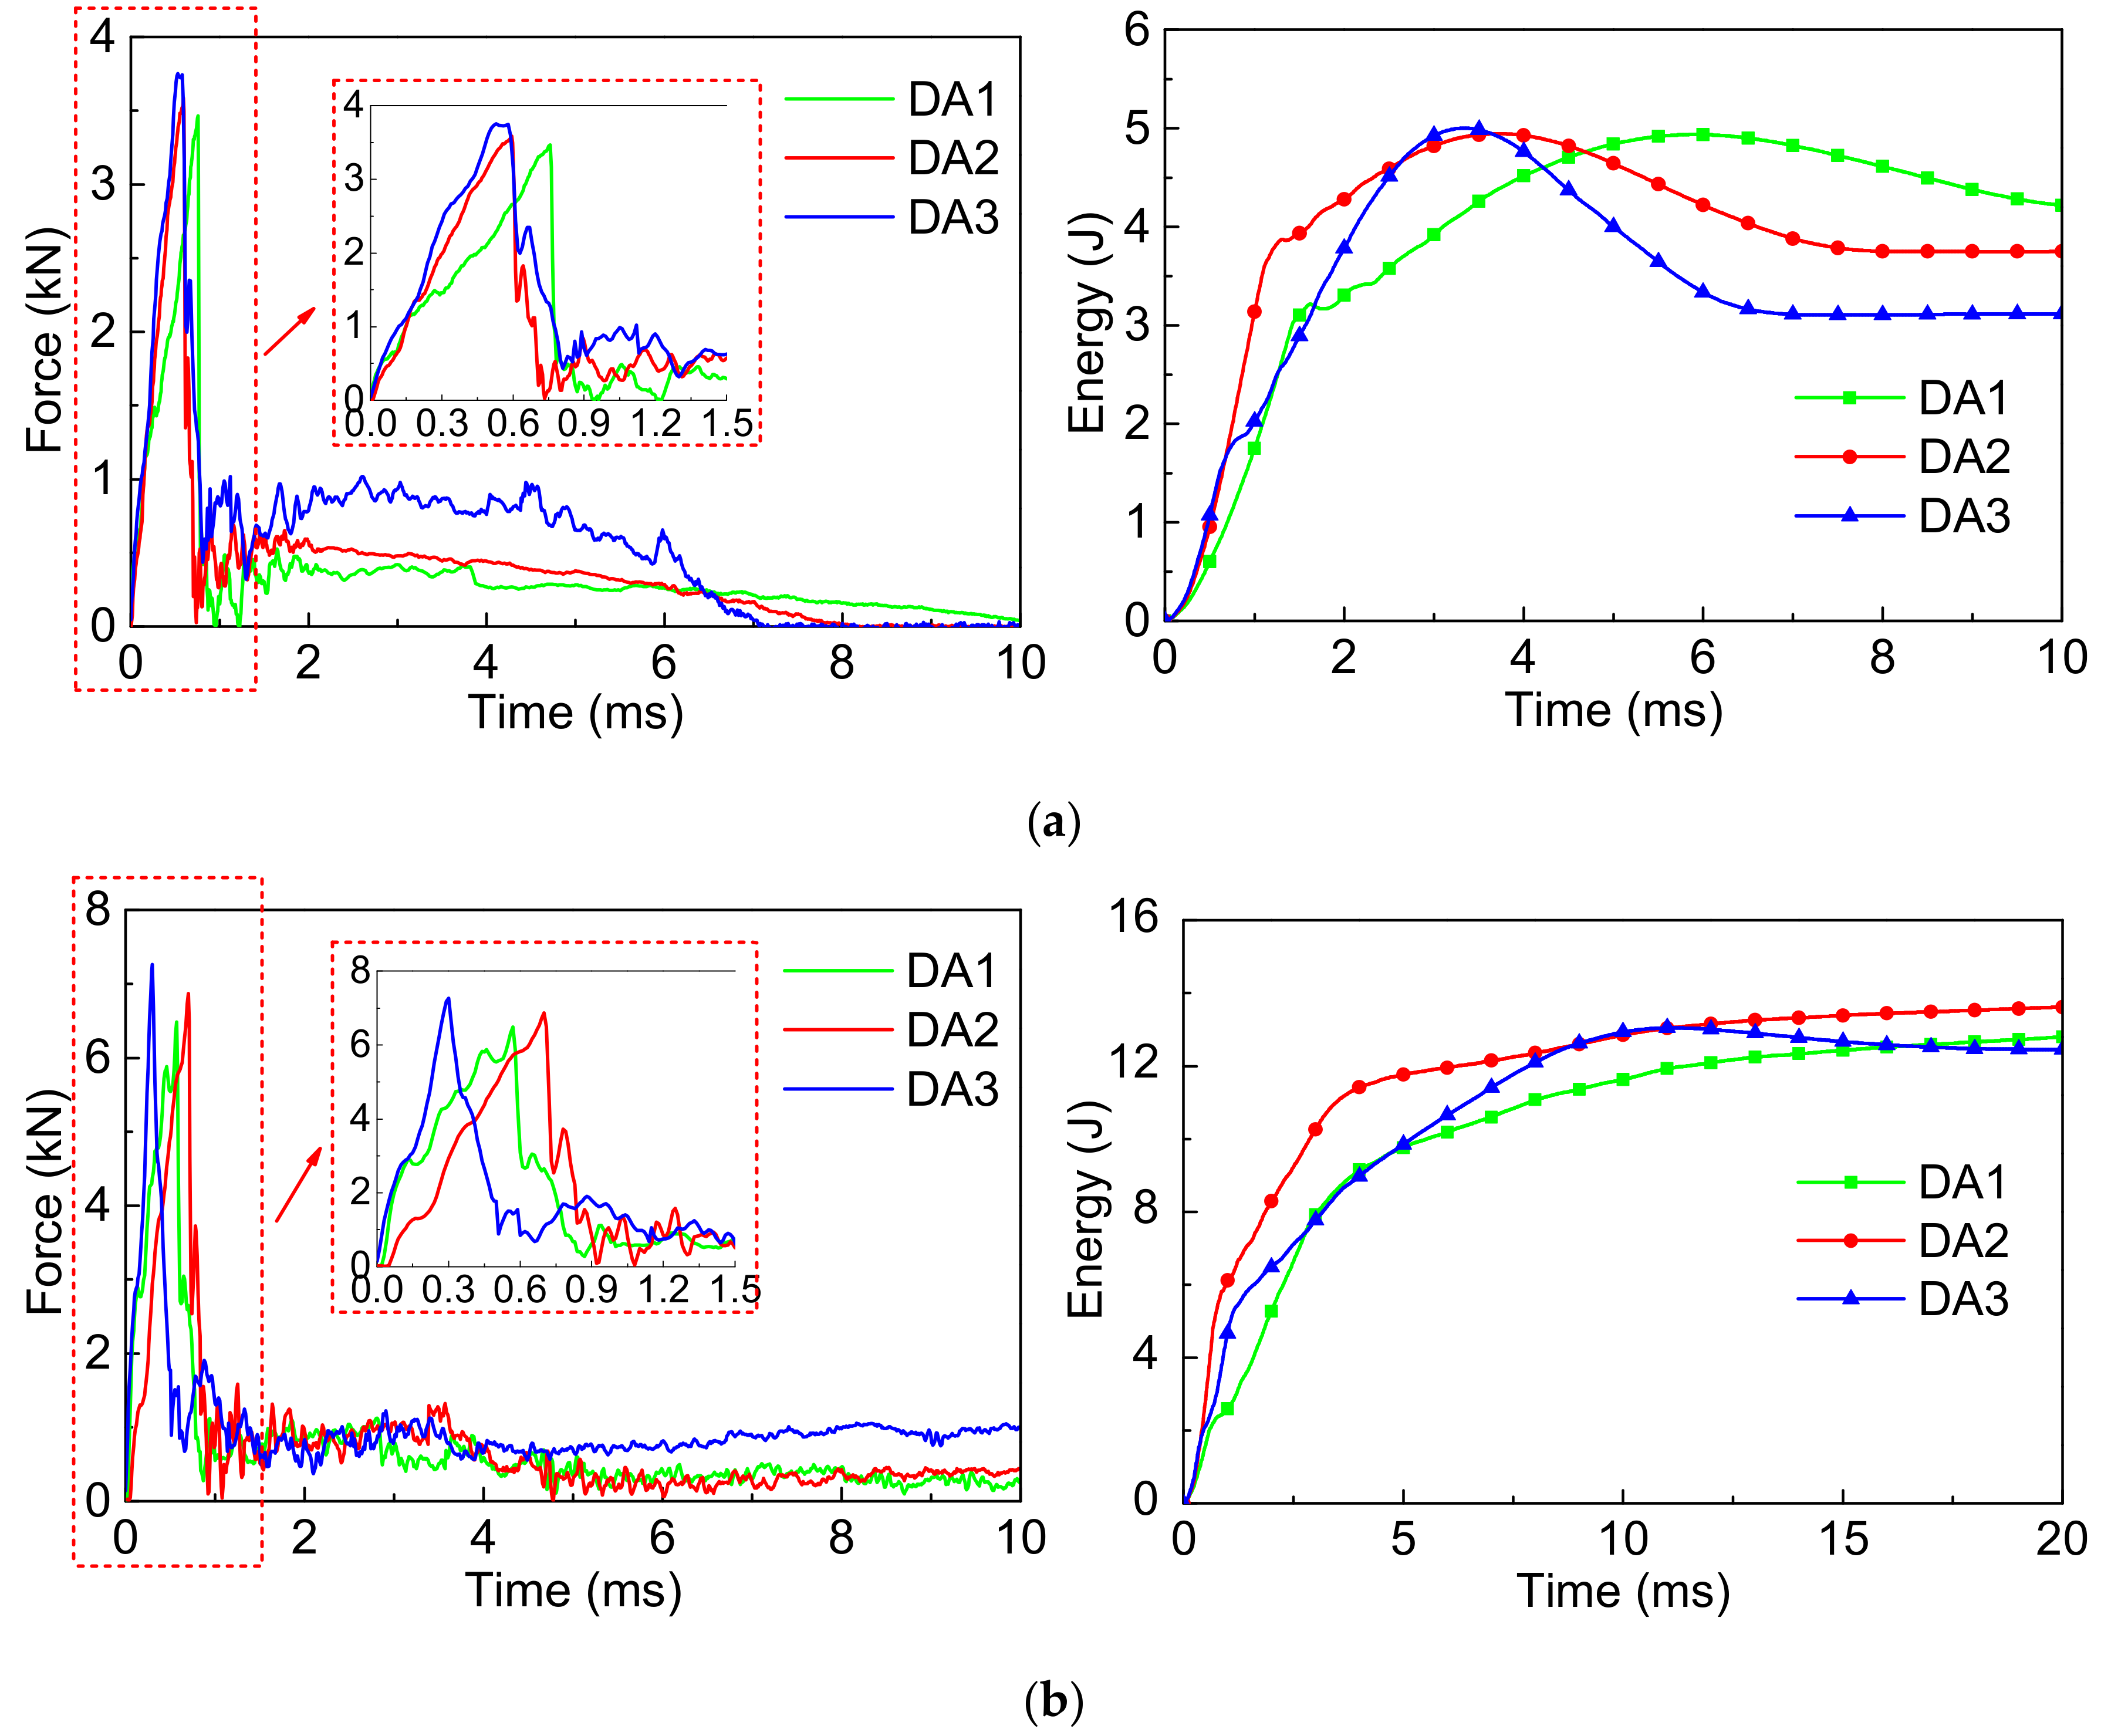
Figure 13.
The force-time curves and energy-time curves of composites with different SMA diameters under the two impact energies: (a) Initial impact energy of 5 J; (b) Initial impact energy of 14 J.
Figure 13.
The force-time curves and energy-time curves of composites with different SMA diameters under the two impact energies: (a) Initial impact energy of 5 J; (b) Initial impact energy of 14 J.
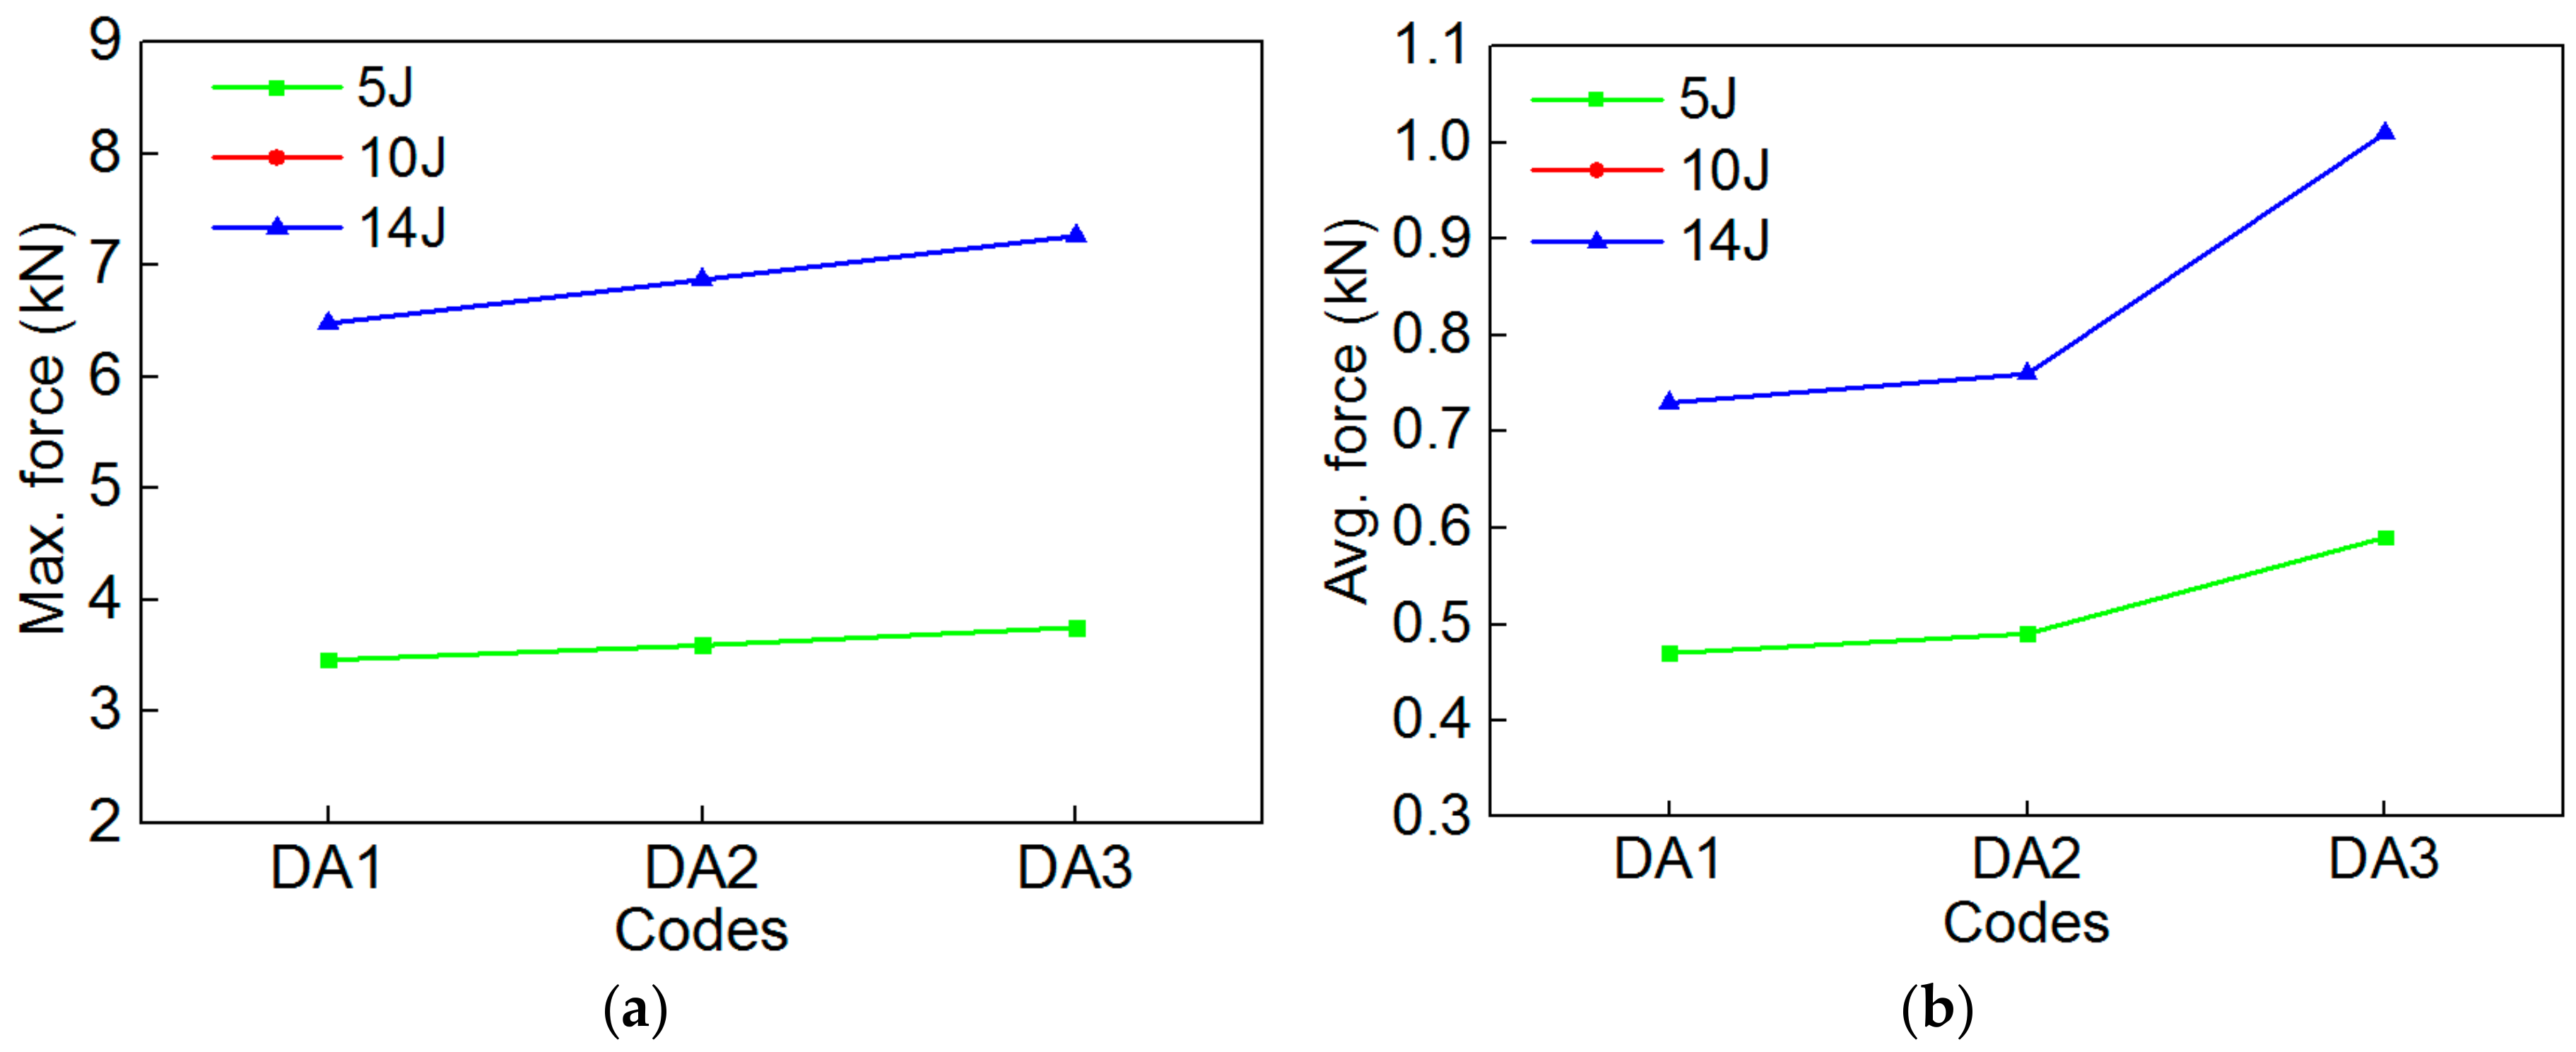
Figure 14.
The maximum contact force and average contact force value of the specimen of DA1/DA2/DA3 under the two impact energies: (a) Max. force; (b) Avg. force.
Figure 14.
The maximum contact force and average contact force value of the specimen of DA1/DA2/DA3 under the two impact energies: (a) Max. force; (b) Avg. force.
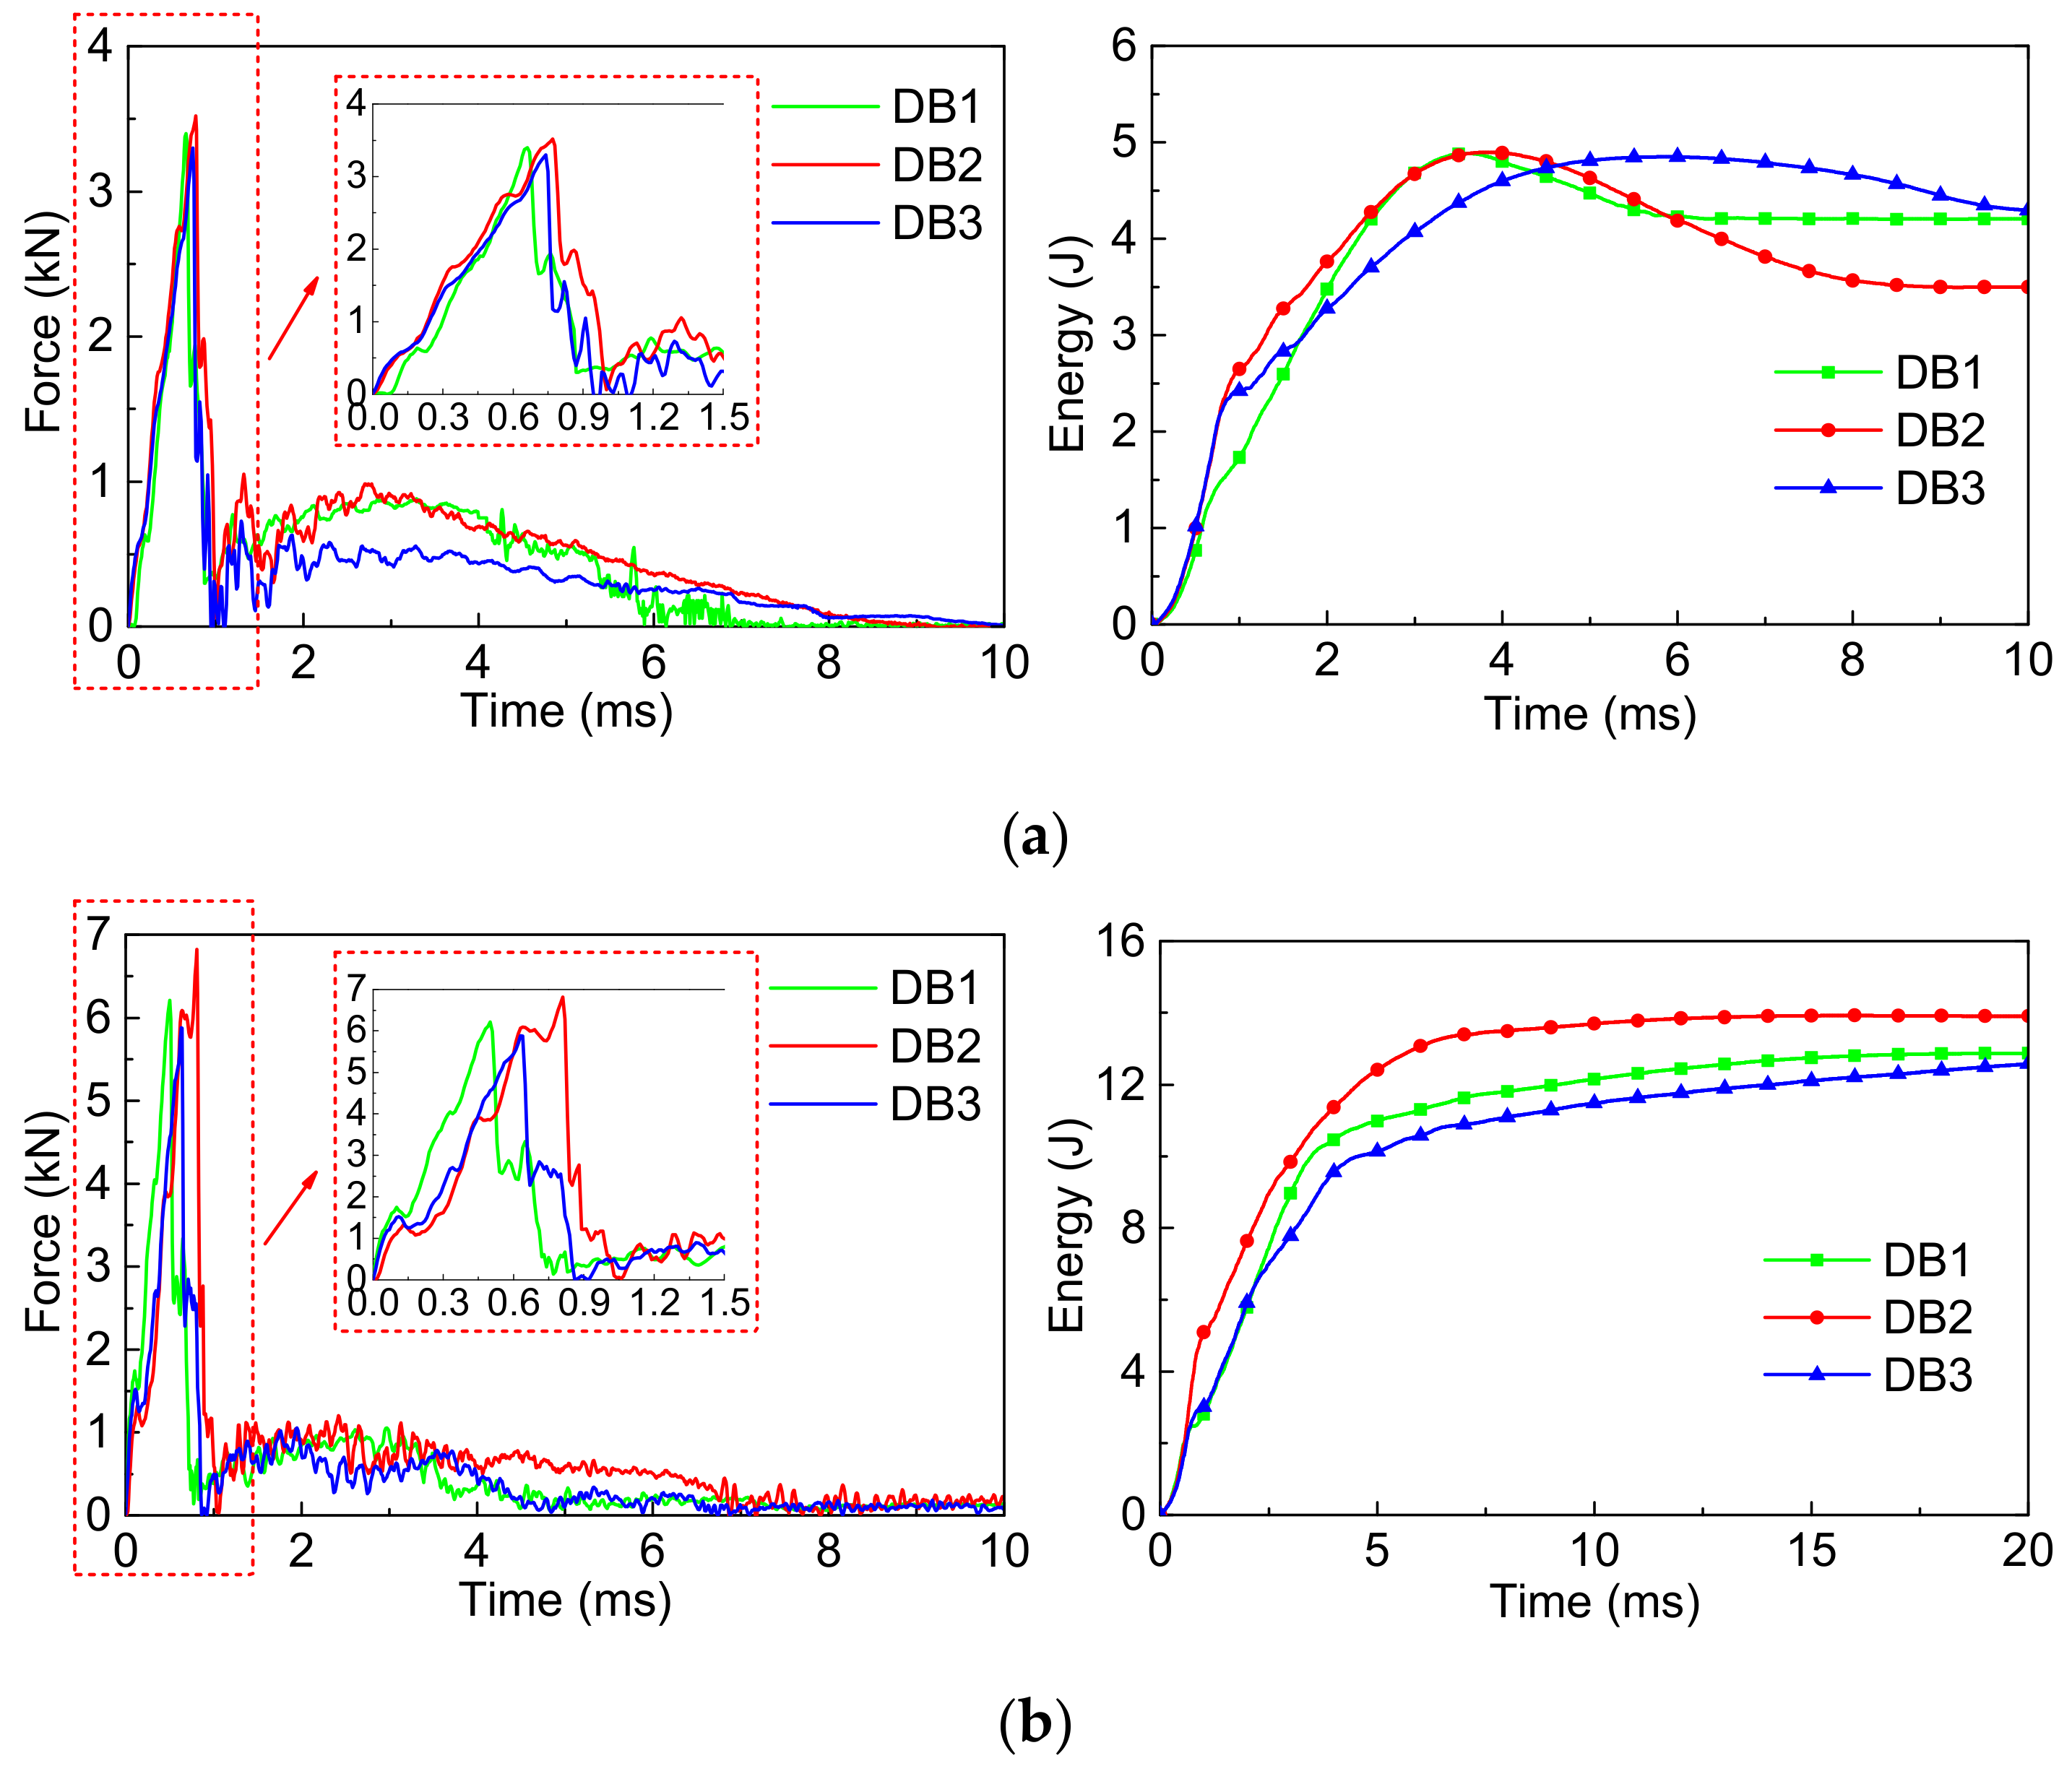
Figure 15.
The force-time curves and energy-time curves of composites with different SMA diameters and layup spacing under two impact energies: (a) Initial impact energy of 5 J; (b) Initial impact energy of 14 J.
Figure 15.
The force-time curves and energy-time curves of composites with different SMA diameters and layup spacing under two impact energies: (a) Initial impact energy of 5 J; (b) Initial impact energy of 14 J.
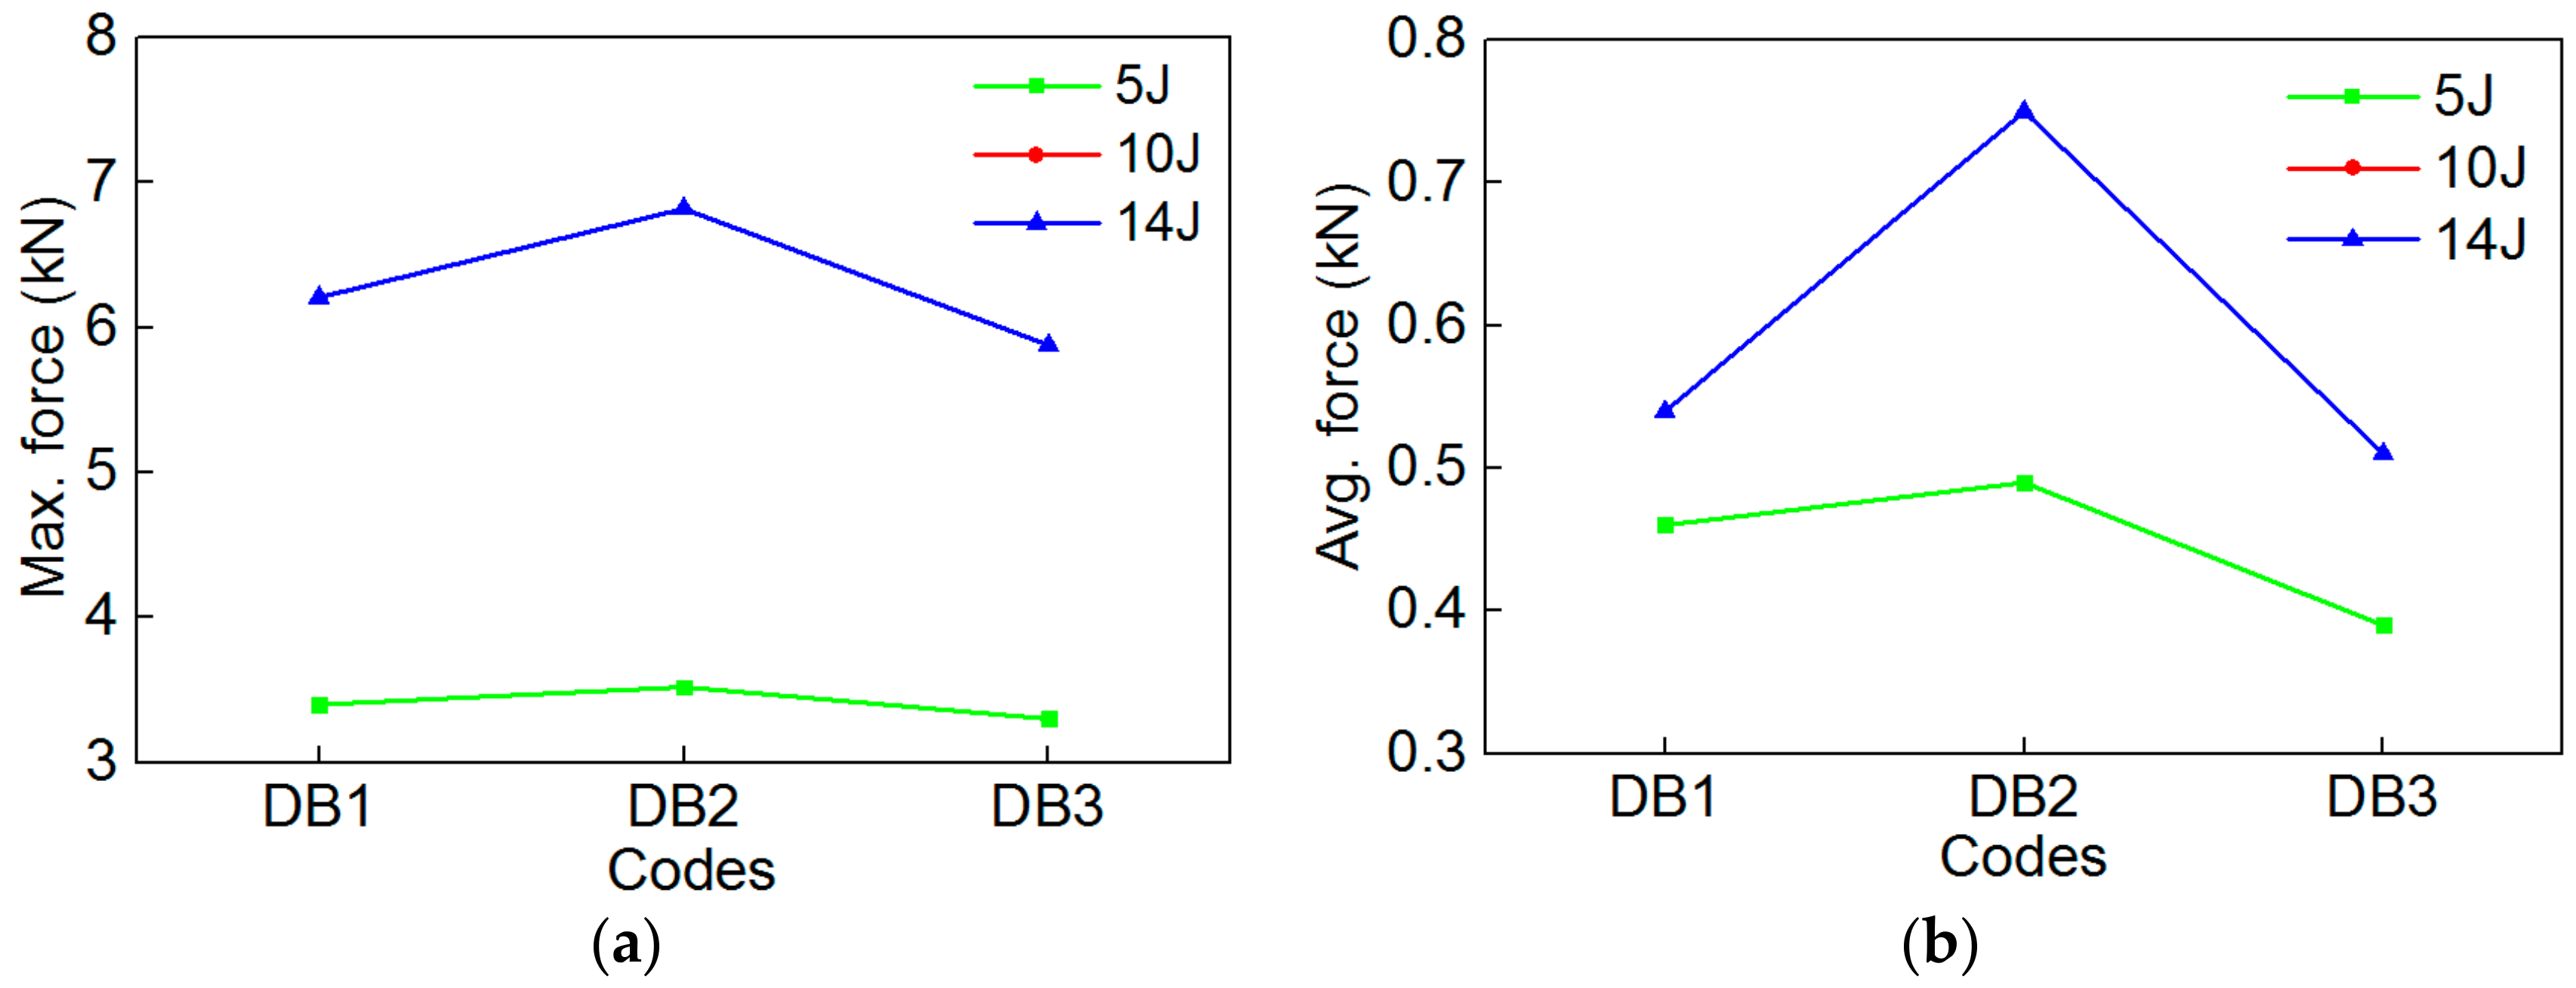
Figure 16.
The maximum contact force and average contact force value of DB1/DB2/DB3 specimens under the two impact energies: (a) Max. force; (b) Avg. force.
Figure 16.
The maximum contact force and average contact force value of DB1/DB2/DB3 specimens under the two impact energies: (a) Max. force; (b) Avg. force.
Table 1.
The basic material parameters of Ni-Ti shape memory alloy wires.
Table 1.
The basic material parameters of Ni-Ti shape memory alloy wires.
| Diameter (mm) | 0.301–0.303 | 0.394–0.398 | 0.501–0.502 |
|---|
| for Delivery (℃) | 9.5 | 14.2 | 10 |
| Tensile Strength (MPa) | 1566.84 | 1536.27 | 1535.88 |
| Upper Plateau Stress (MPa) | 541.84 | 564.12 | 542.26 |
| Lower Plateau Stress (MPa) | 116.01 | 142.48 | 110.02 |
| Elongation (%) | 12.99 | 12.62 | 12.75 |
| Residual Elongation (%) | 0.05 | 0.01 | 0.15 |
Table 2.
The shape memory alloy (SMA) volume fractions (VF) of the 12 groups composite specimens.
Table 2.
The shape memory alloy (SMA) volume fractions (VF) of the 12 groups composite specimens.
| Codes | VF (%) | Codes | VF (%) | Codes | VF (%) |
|---|
| W | 0 | V1 | 1.14 | V2 | 0.65 |
| V3 | 0.49 | V4 | 0.41 | V5 | 0.37 |
| DA1 | 0.18 | DA2 | 0.31 | DA3 | 0.49 |
| DB1 | 0.23 | DB2 | 0.28 | DB3 | 0.33 |
Table 3.
The marketing cost of various types of polymer composites.
Table 3.
The marketing cost of various types of polymer composites.
| Codes | Resin Unit Price (¥/L) | Resin Dosage (L) | SMA Diameter (mm) | SMA Unit Price (¥/m) | SMA Dosage (m) | Total Price (¥) | Cost Increase Rate (%) |
|---|
| W | 50 | 0.125 | 0 | 0 | 0 | 6.25 | 0 |
| V1 | 50 | 0.125 | 0.3 | 1 | 5.0 | 11.25 | 80 |
| V2 | 50 | 0.125 | 0.3 | 1 | 2.5 | 8.75 | 40 |
| V3 | 50 | 0.125 | 0.3 | 1 | 1.7 | 7.95 | 27.2 |
| V4 | 50 | 0.125 | 0.3 | 1 | 1.3 | 7.55 | 20.8 |
| V5 | 50 | 0.125 | 0.3 | 1 | 1.1 | 7.35 | 17.6 |
| DA1 | 50 | 0.125 | 0.3 | 1 | 1.7 | 7.95 | 27.2 |
| DA2 | 50 | 0.125 | 0.4 | 1.5 | 1.7 | 8.8 | 40.8 |
| DA3 | 50 | 0.125 | 0.5 | 2 | 1.7 | 9.65 | 54.4 |
| DB1 | 50 | 0.125 | 0.3 | 1 | 2.5 | 8.75 | 40 |
| DB2 | 50 | 0.125 | 0.4 | 1.5 | 1.4 | 8.35 | 33.6 |
| DB3 | 50 | 0.125 | 0.5 | 2 | 0.9 | 8.05 | 28.8 |
Table 4.
The impact parameters of specimens of V1/V2/V3/V4/V5/W under the two impact energies.
Table 4.
The impact parameters of specimens of V1/V2/V3/V4/V5/W under the two impact energies.
| Parameters | Initial Energy | V1 | V2 | V3 | V4 | V5 | W |
|---|
| Max. contact force (kN) | 5 J | 3.51 | 3.61 | 3.75 | 3.56 | 3.47 | 3.23 |
| 14 J | 6.55 | 7.50 | 7.26 | 7.14 | 6.28 | 5.60 |
| Avg. contact force (kN) | 5 J | 0.43 | 0.49 | 0.58 | 0.53 | 0.46 | 0.37 |
| 14 J | 0.65 | 0.91 | 1.01 | 0.78 | 0.69 | 0.46 |
| Ultimate absorbed Energy (J) | 5 J | 4.6 | 4.26 | 3.11 | 4.22 | 4.50 | 4.71 |
| 14 J | 12.74 | 14.13 | 12.93 | 13.43 | 11.16 | 9.23 |
Table 5.
The impact parameters of the specimens of DA1/DA2/DA3 under the two impact energies.
Table 5.
The impact parameters of the specimens of DA1/DA2/DA3 under the two impact energies.
| Parameters | Initial Energy | DA1 | DA2 | DA3 |
|---|
| Max. contact force (kN) | 5 J | 3.46 | 3.59 | 3.75 |
| 14 J | 6.48 | 6.87 | 7.26 |
| Avg. contact force (kN) | 5 J | 0.47 | 0.49 | 0.59 |
| 14 J | 0.73 | 0.76 | 1.01 |
| Ultimate absorbed Energy (J) | 5 J | 4.22 | 3.75 | 3.11 |
| 14 J | 11.63 | 12.85 | 12.93 |
Table 6.
The impact parameters of the DB1/DB2/DB3 specimens under the two impact energies.
Table 6.
The impact parameters of the DB1/DB2/DB3 specimens under the two impact energies.
| Parameters | Initial Energy | DB1 | DB2 | DB3 |
|---|
| Max. contact force (kN) | 5 J | 3.4 | 3.52 | 3.3 |
| 14 J | 6.21 | 6.82 | 5.88 |
| Avg. contact force (kN) | 5 J | 0.46 | 0.49 | 0.39 |
| 14 J | 0.54 | 0.75 | 0.51 |
| Ultimate absorbed Energy (J) | 5 J | 4.21 | 3.50 | 4.29 |
| 14 J | 12.88 | 13.90 | 12.58 |


