Study of the Influence of the Reprocessing Cycles on the Final Properties of Polylactide Pieces Obtained by Injection Molding


 ,
,  ,
,  , ,
, ,  and
and 
Abstract
1. Introduction
2. Materials and Methods
2.1. Materials
2.2. Processing and Reprocessing of PLA
2.3. Mechanical Characterization
2.4. Morphological Characterization
2.5. Characterization of the Melt Flow Index
2.6. Thermal Characterization
2.7. Thermomechanical Characterization
2.8. Color Measurements
2.9. Statistical Analysis
3. Results
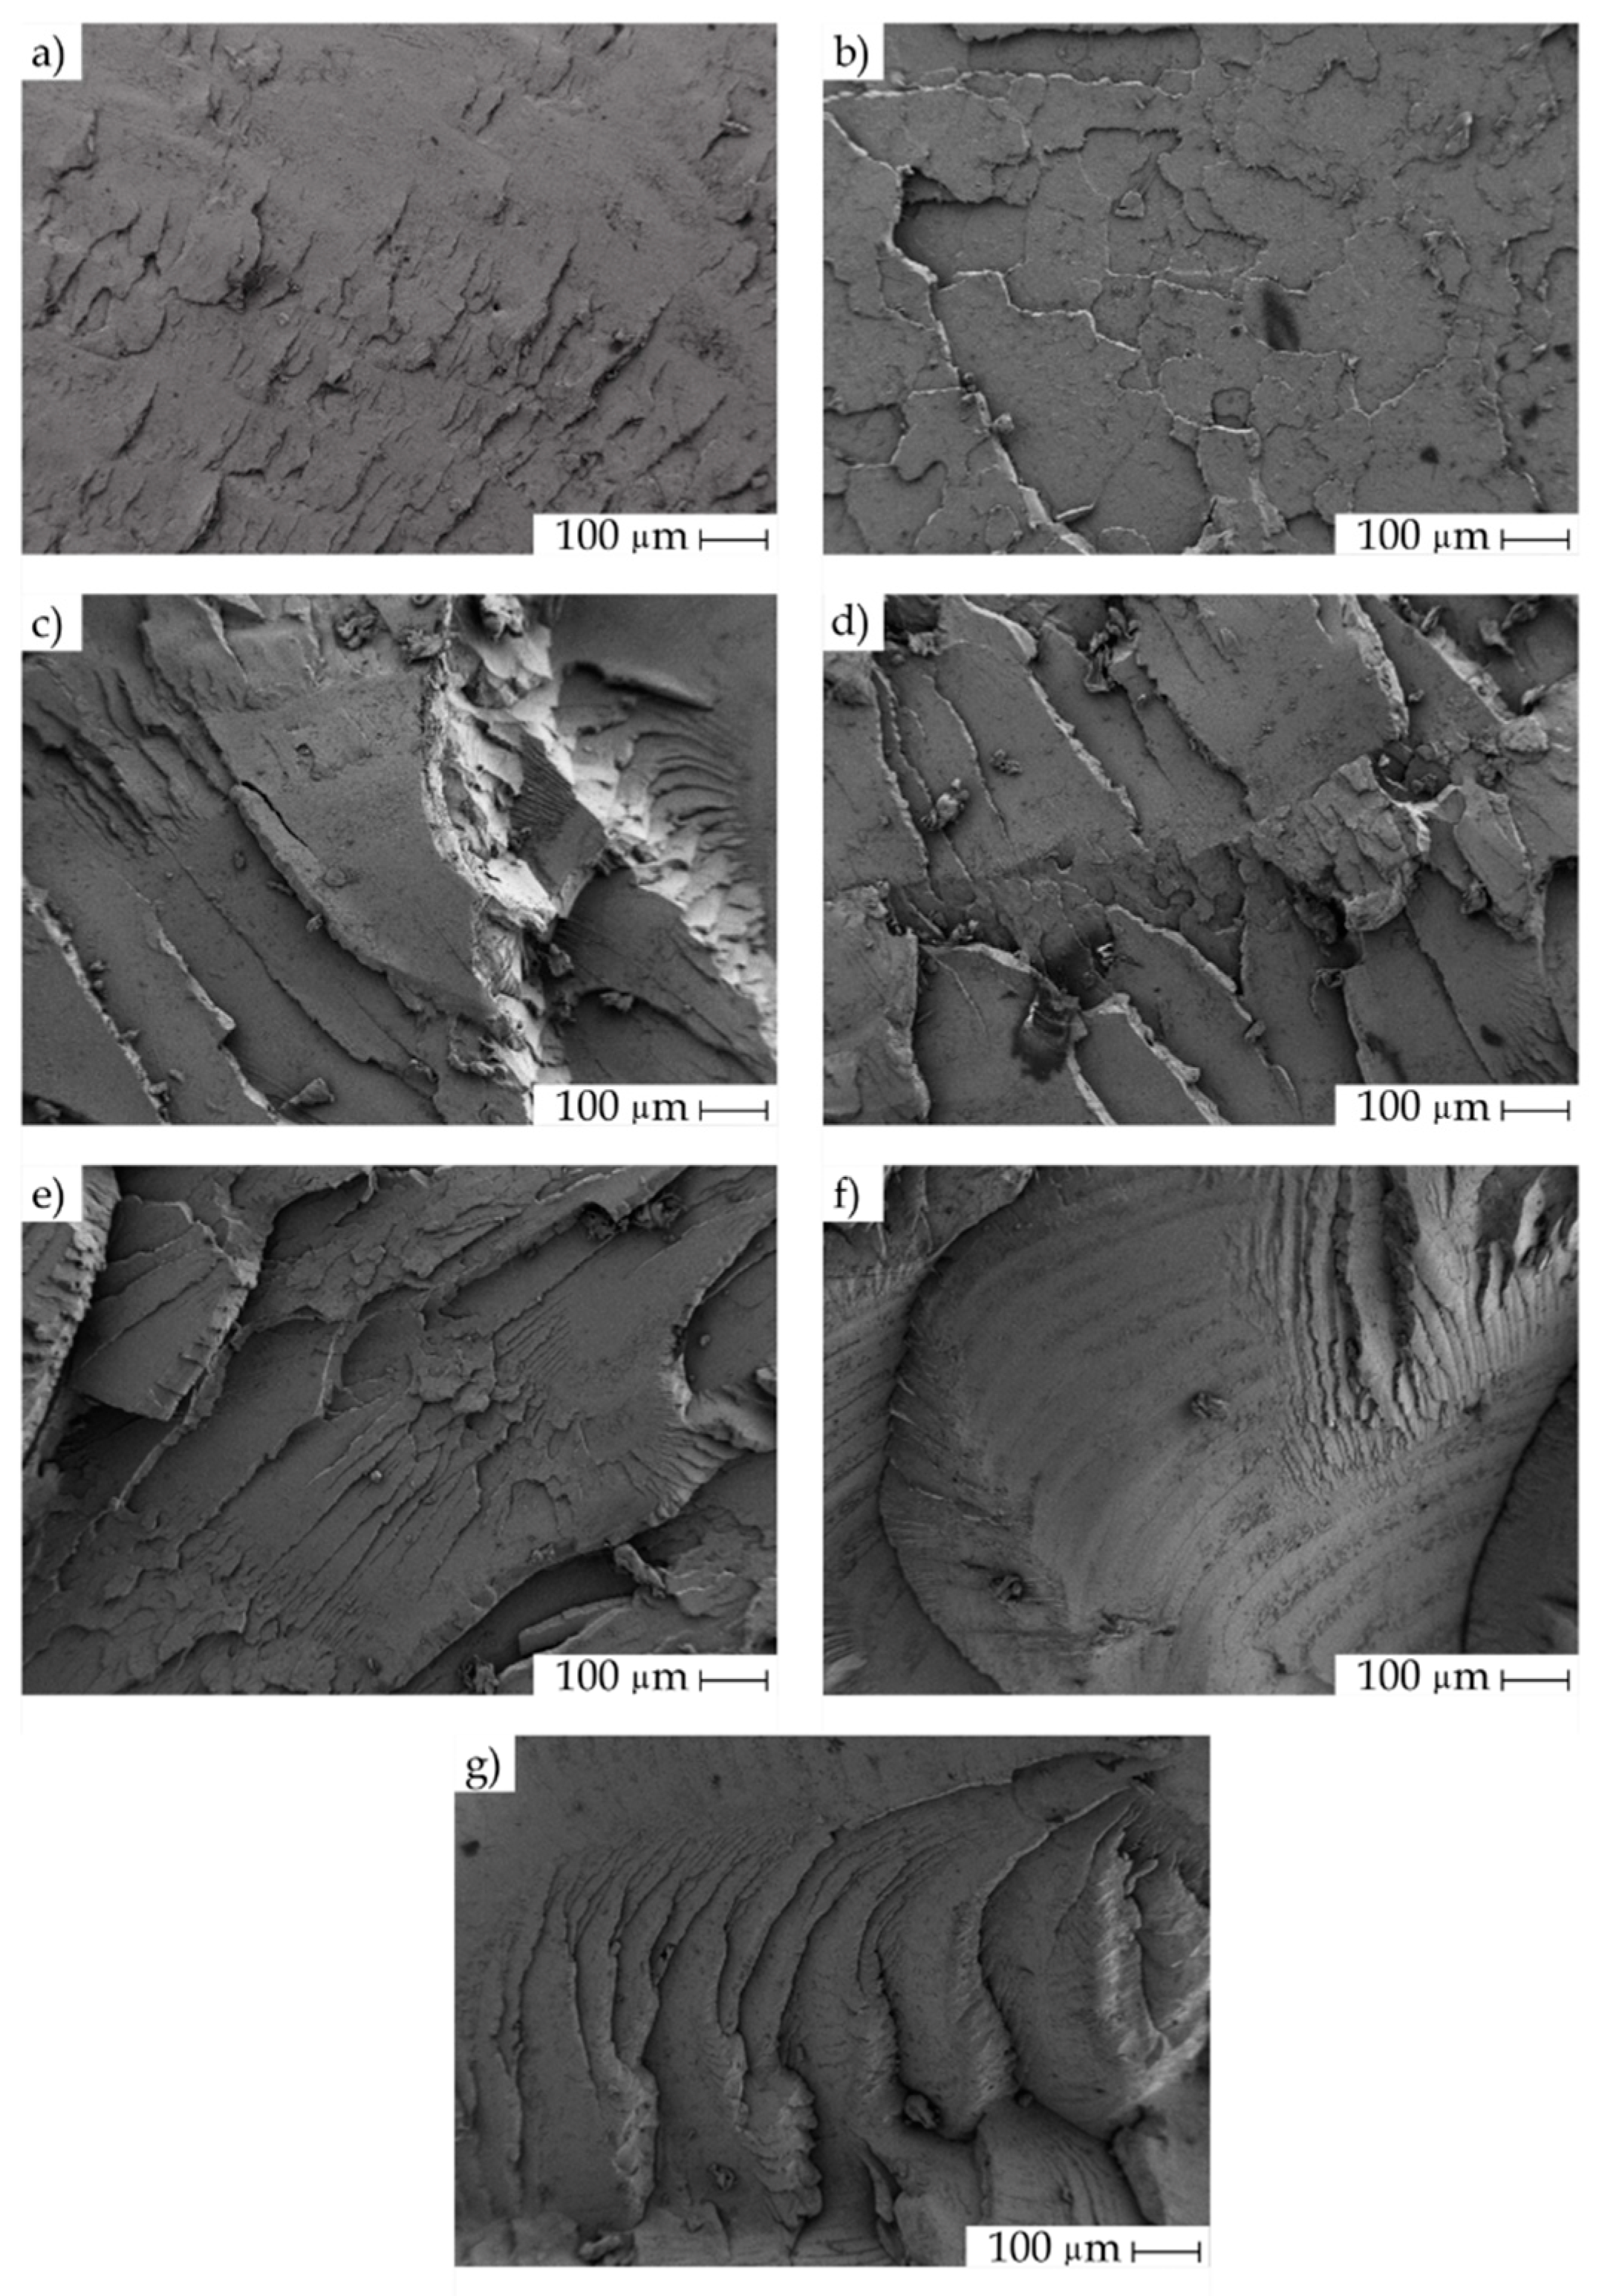
3.1. Influence of the Reprocessing Cycles on the Mechanical and Morphological Properties of PLA
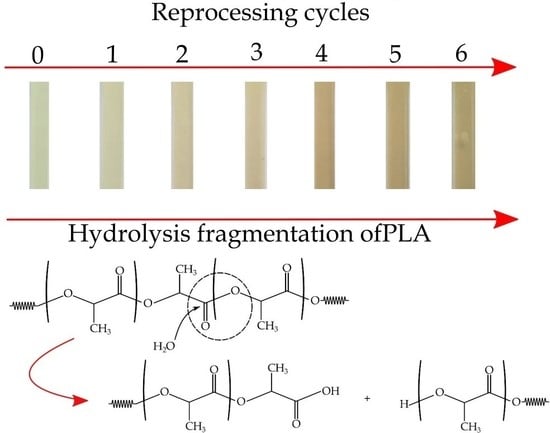
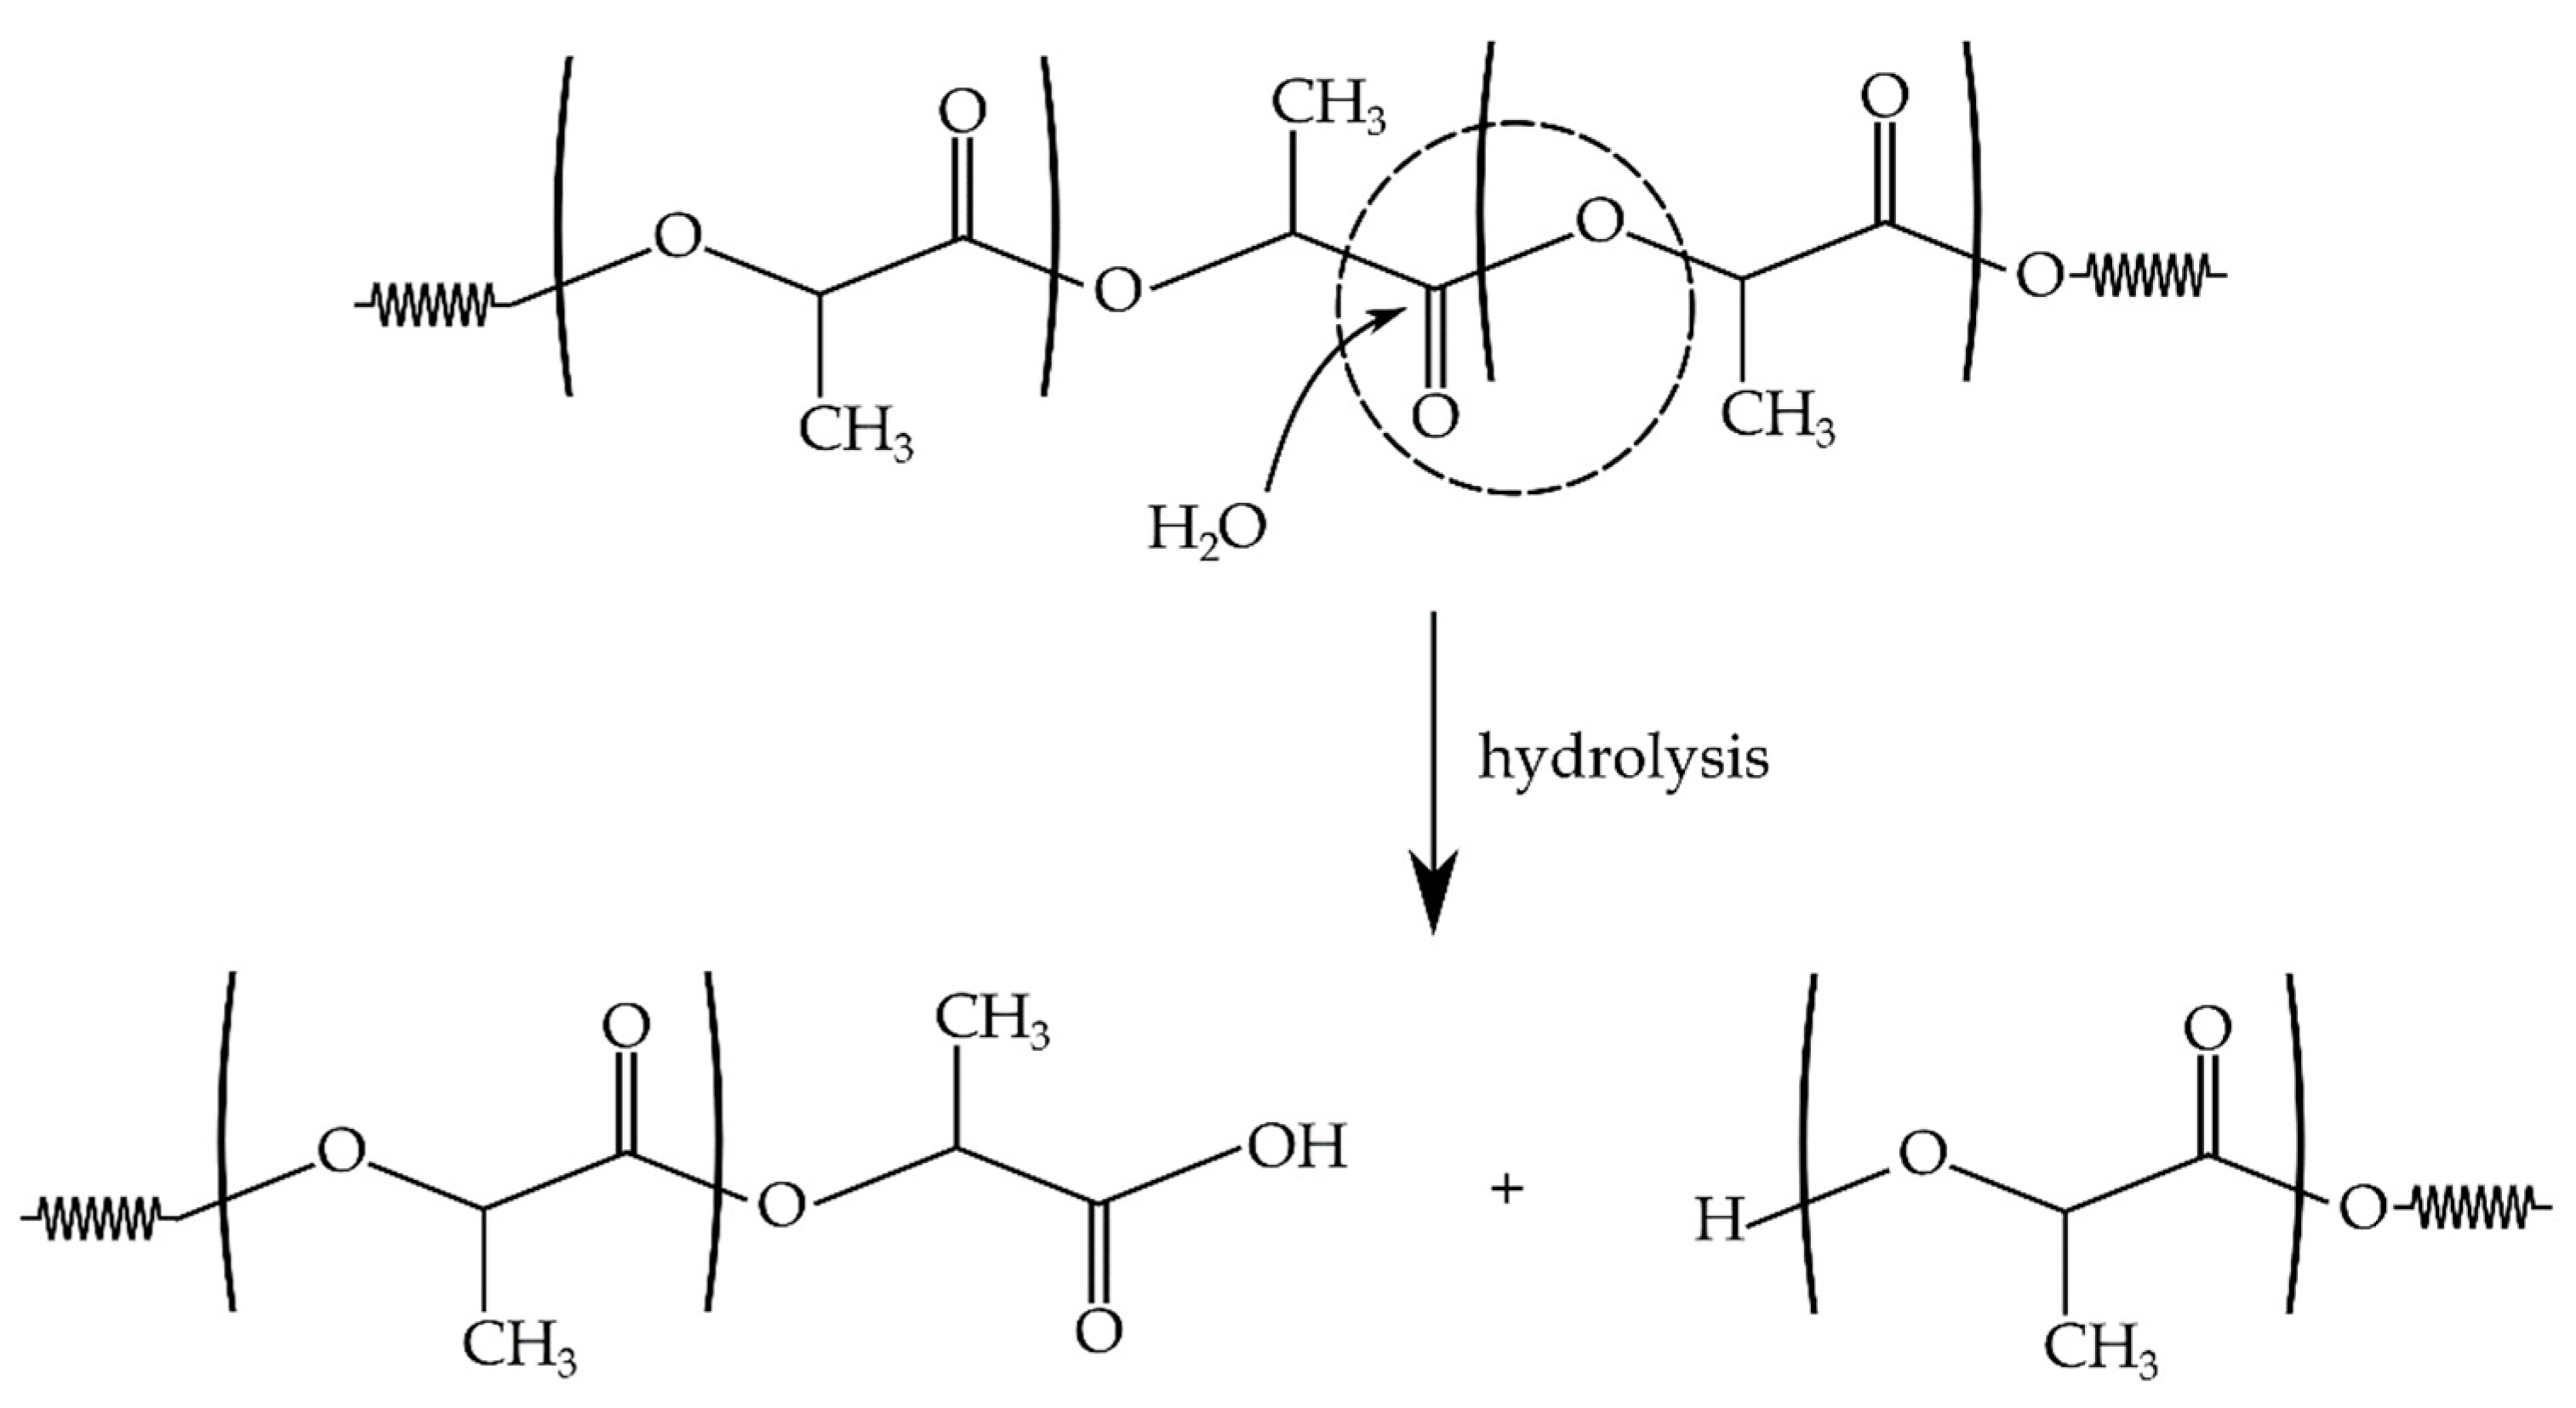
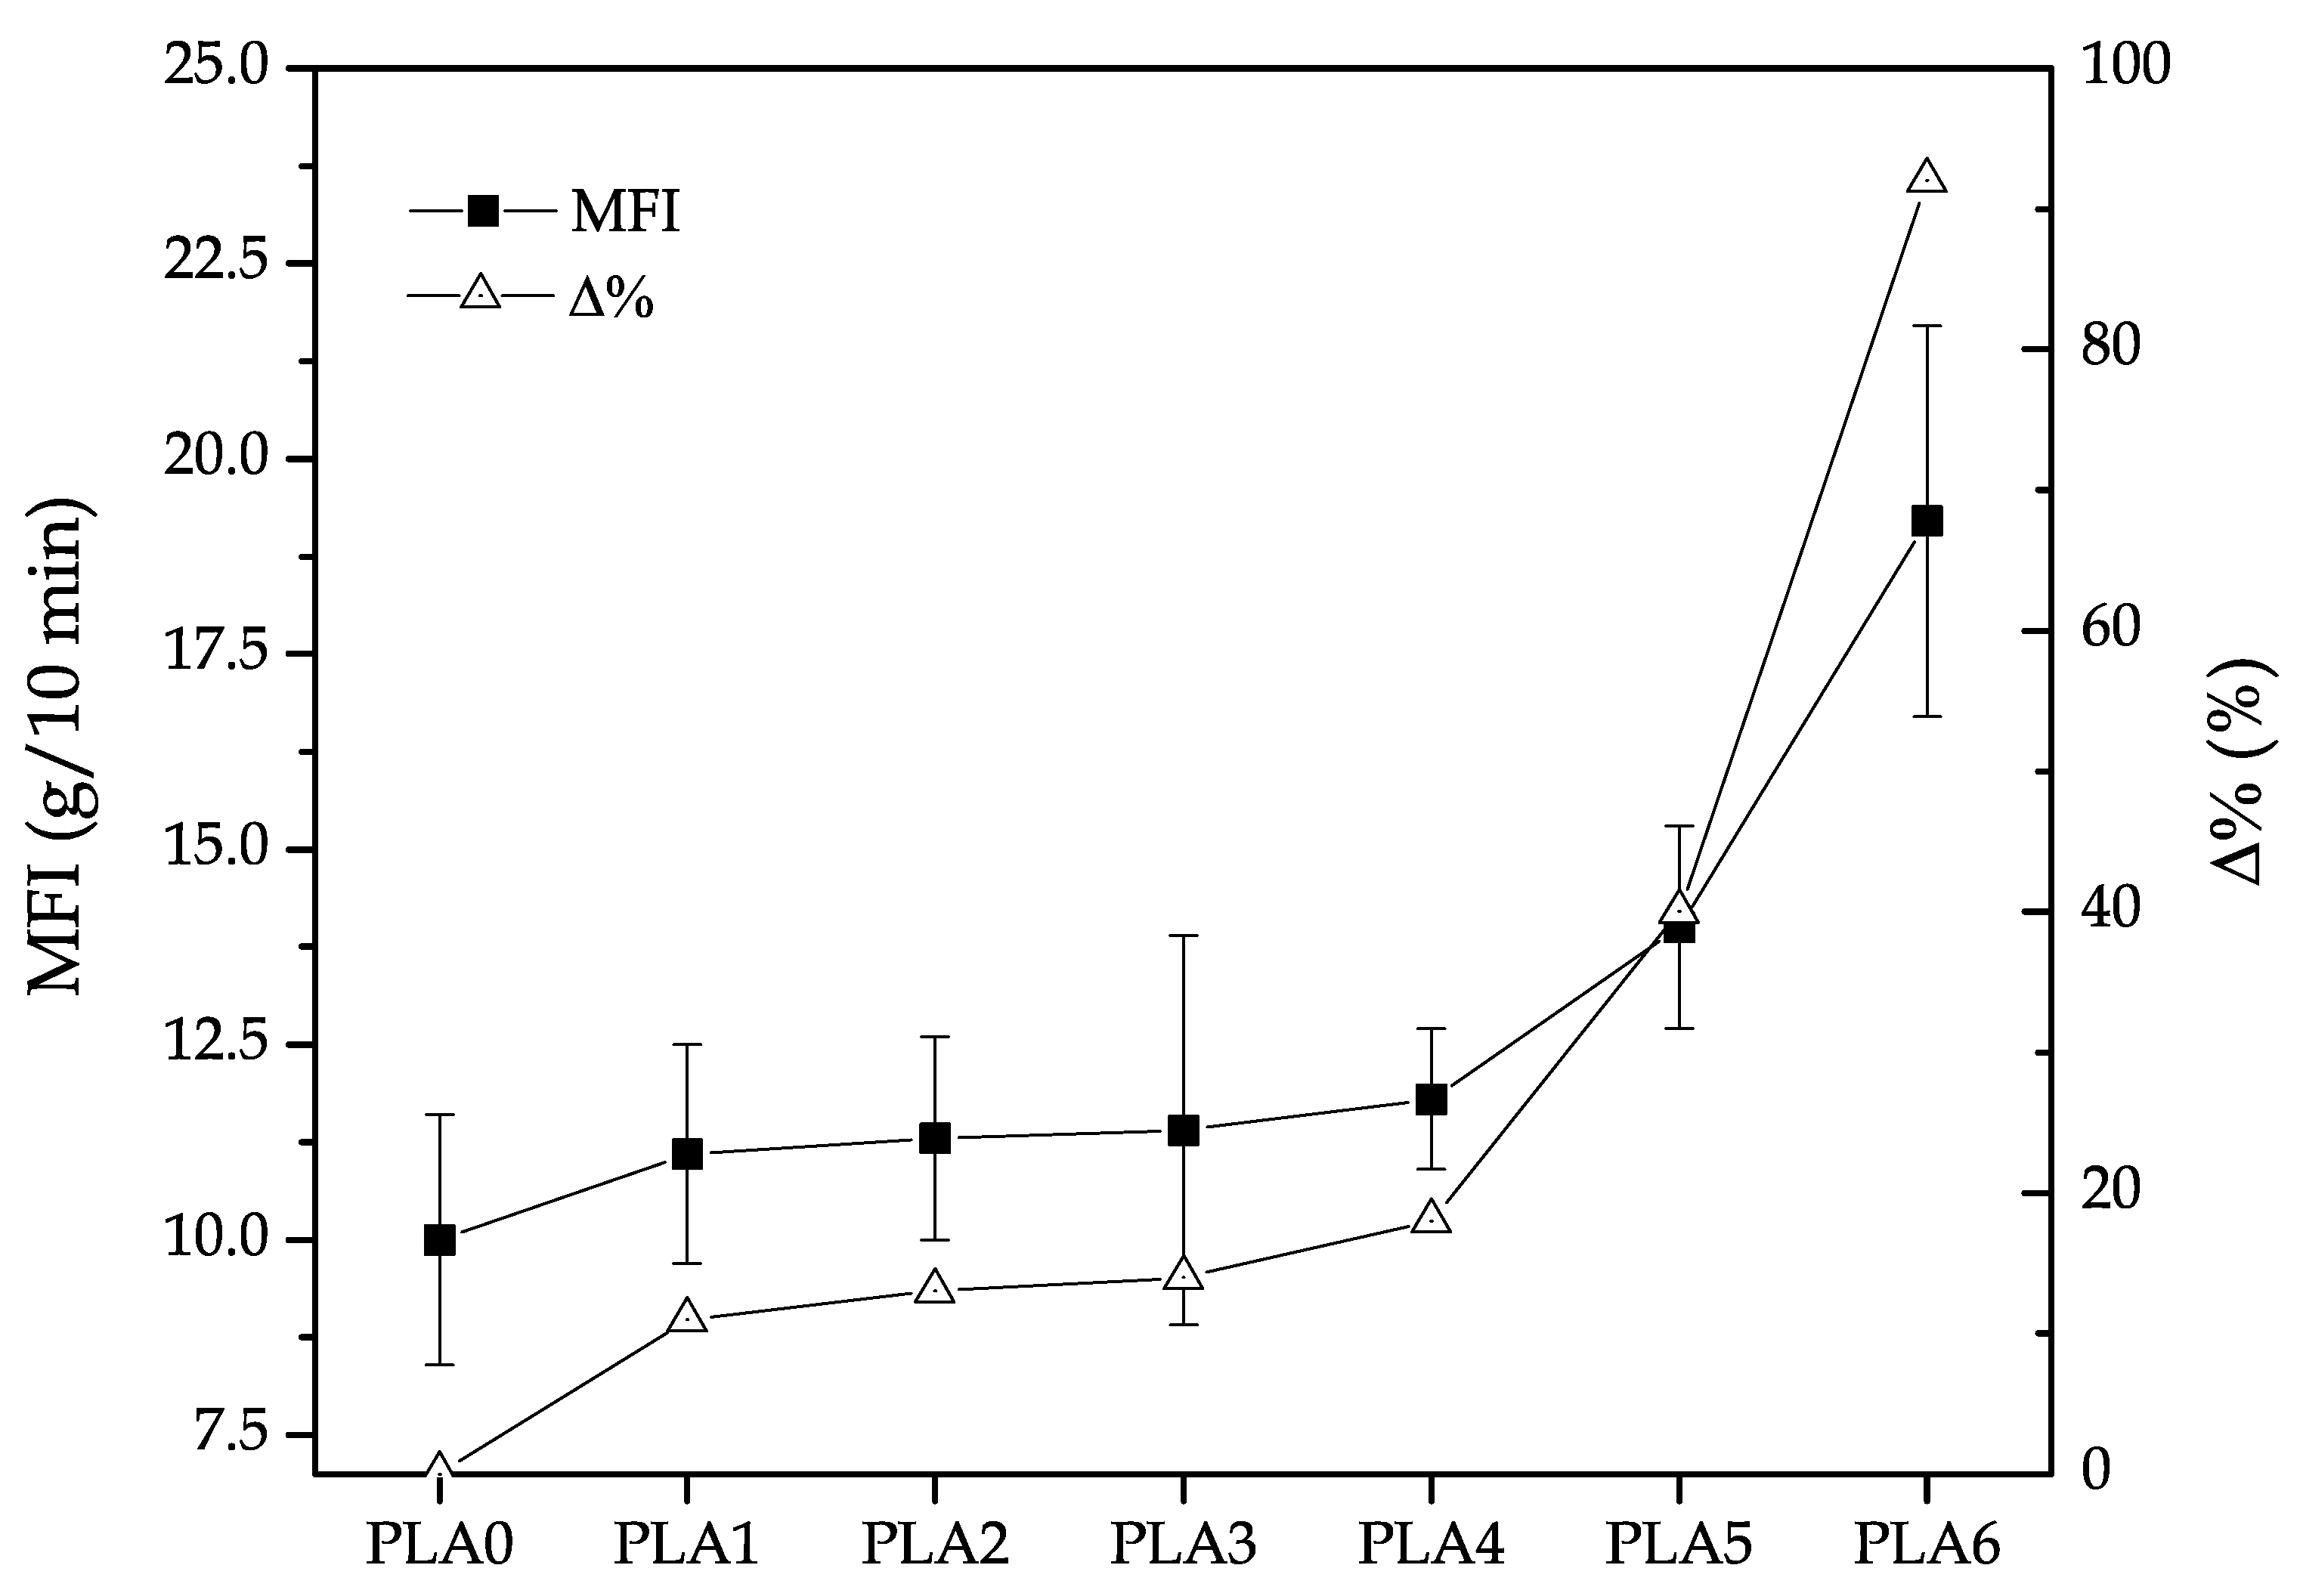
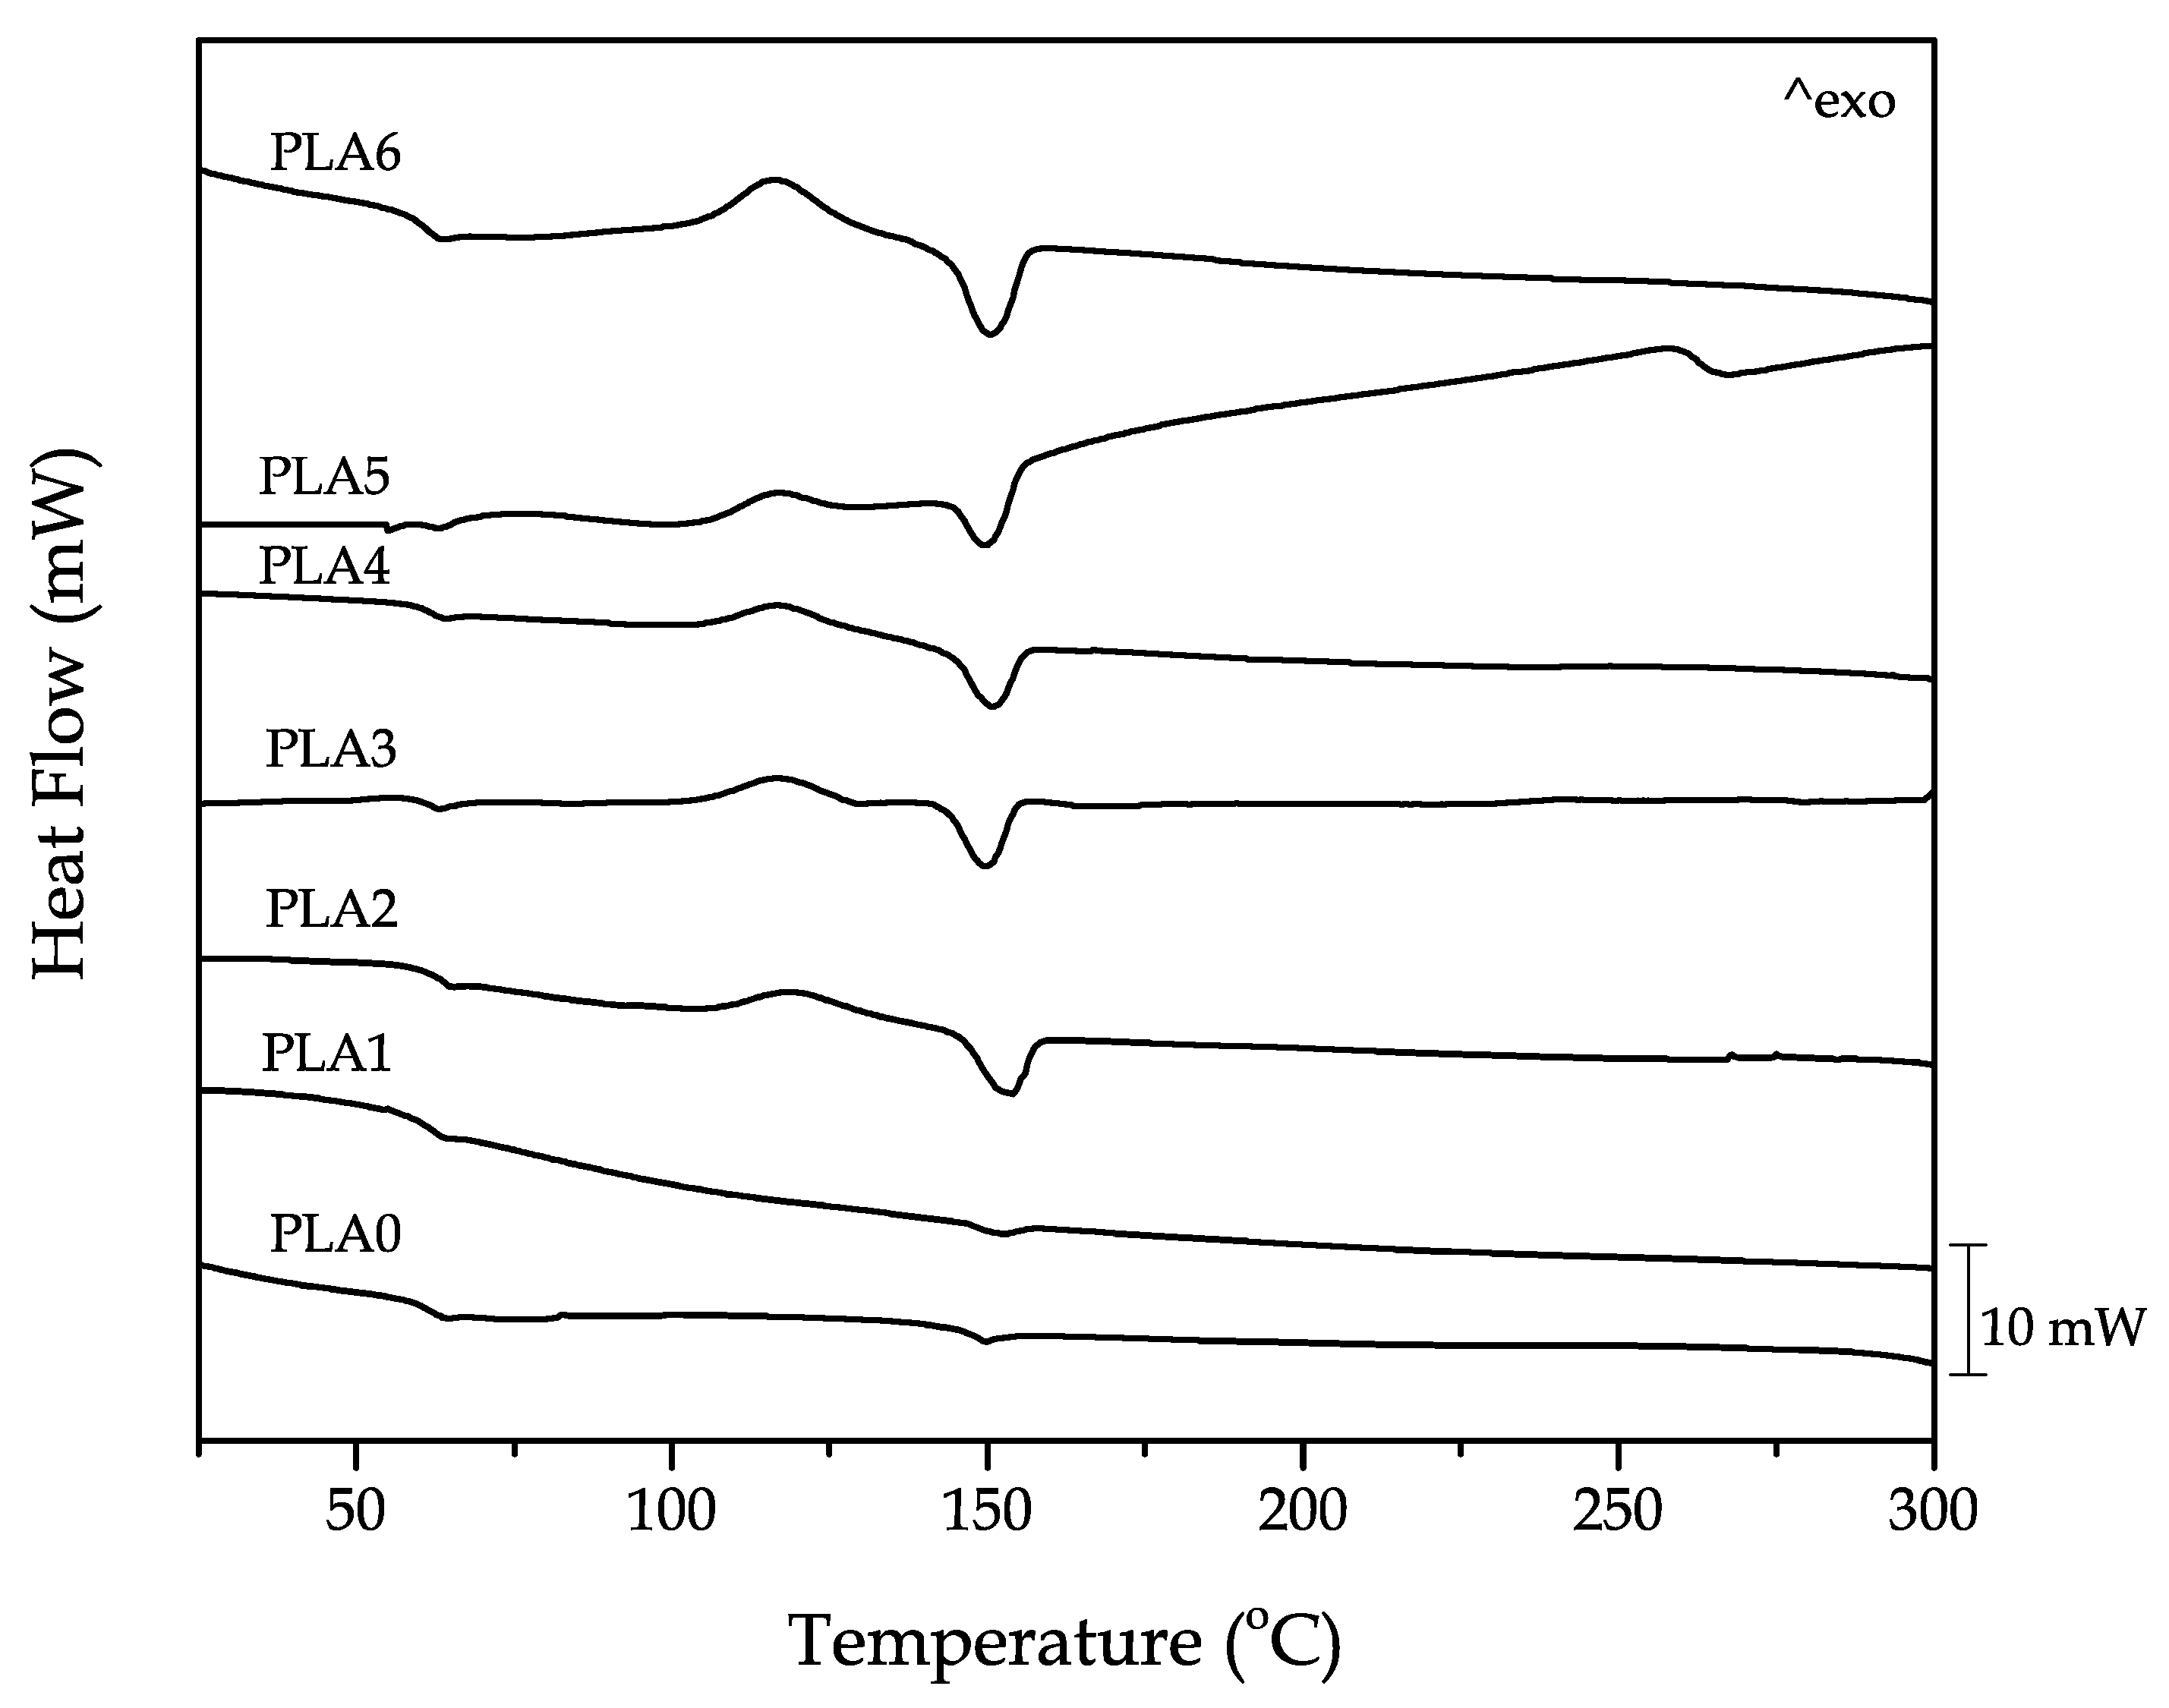
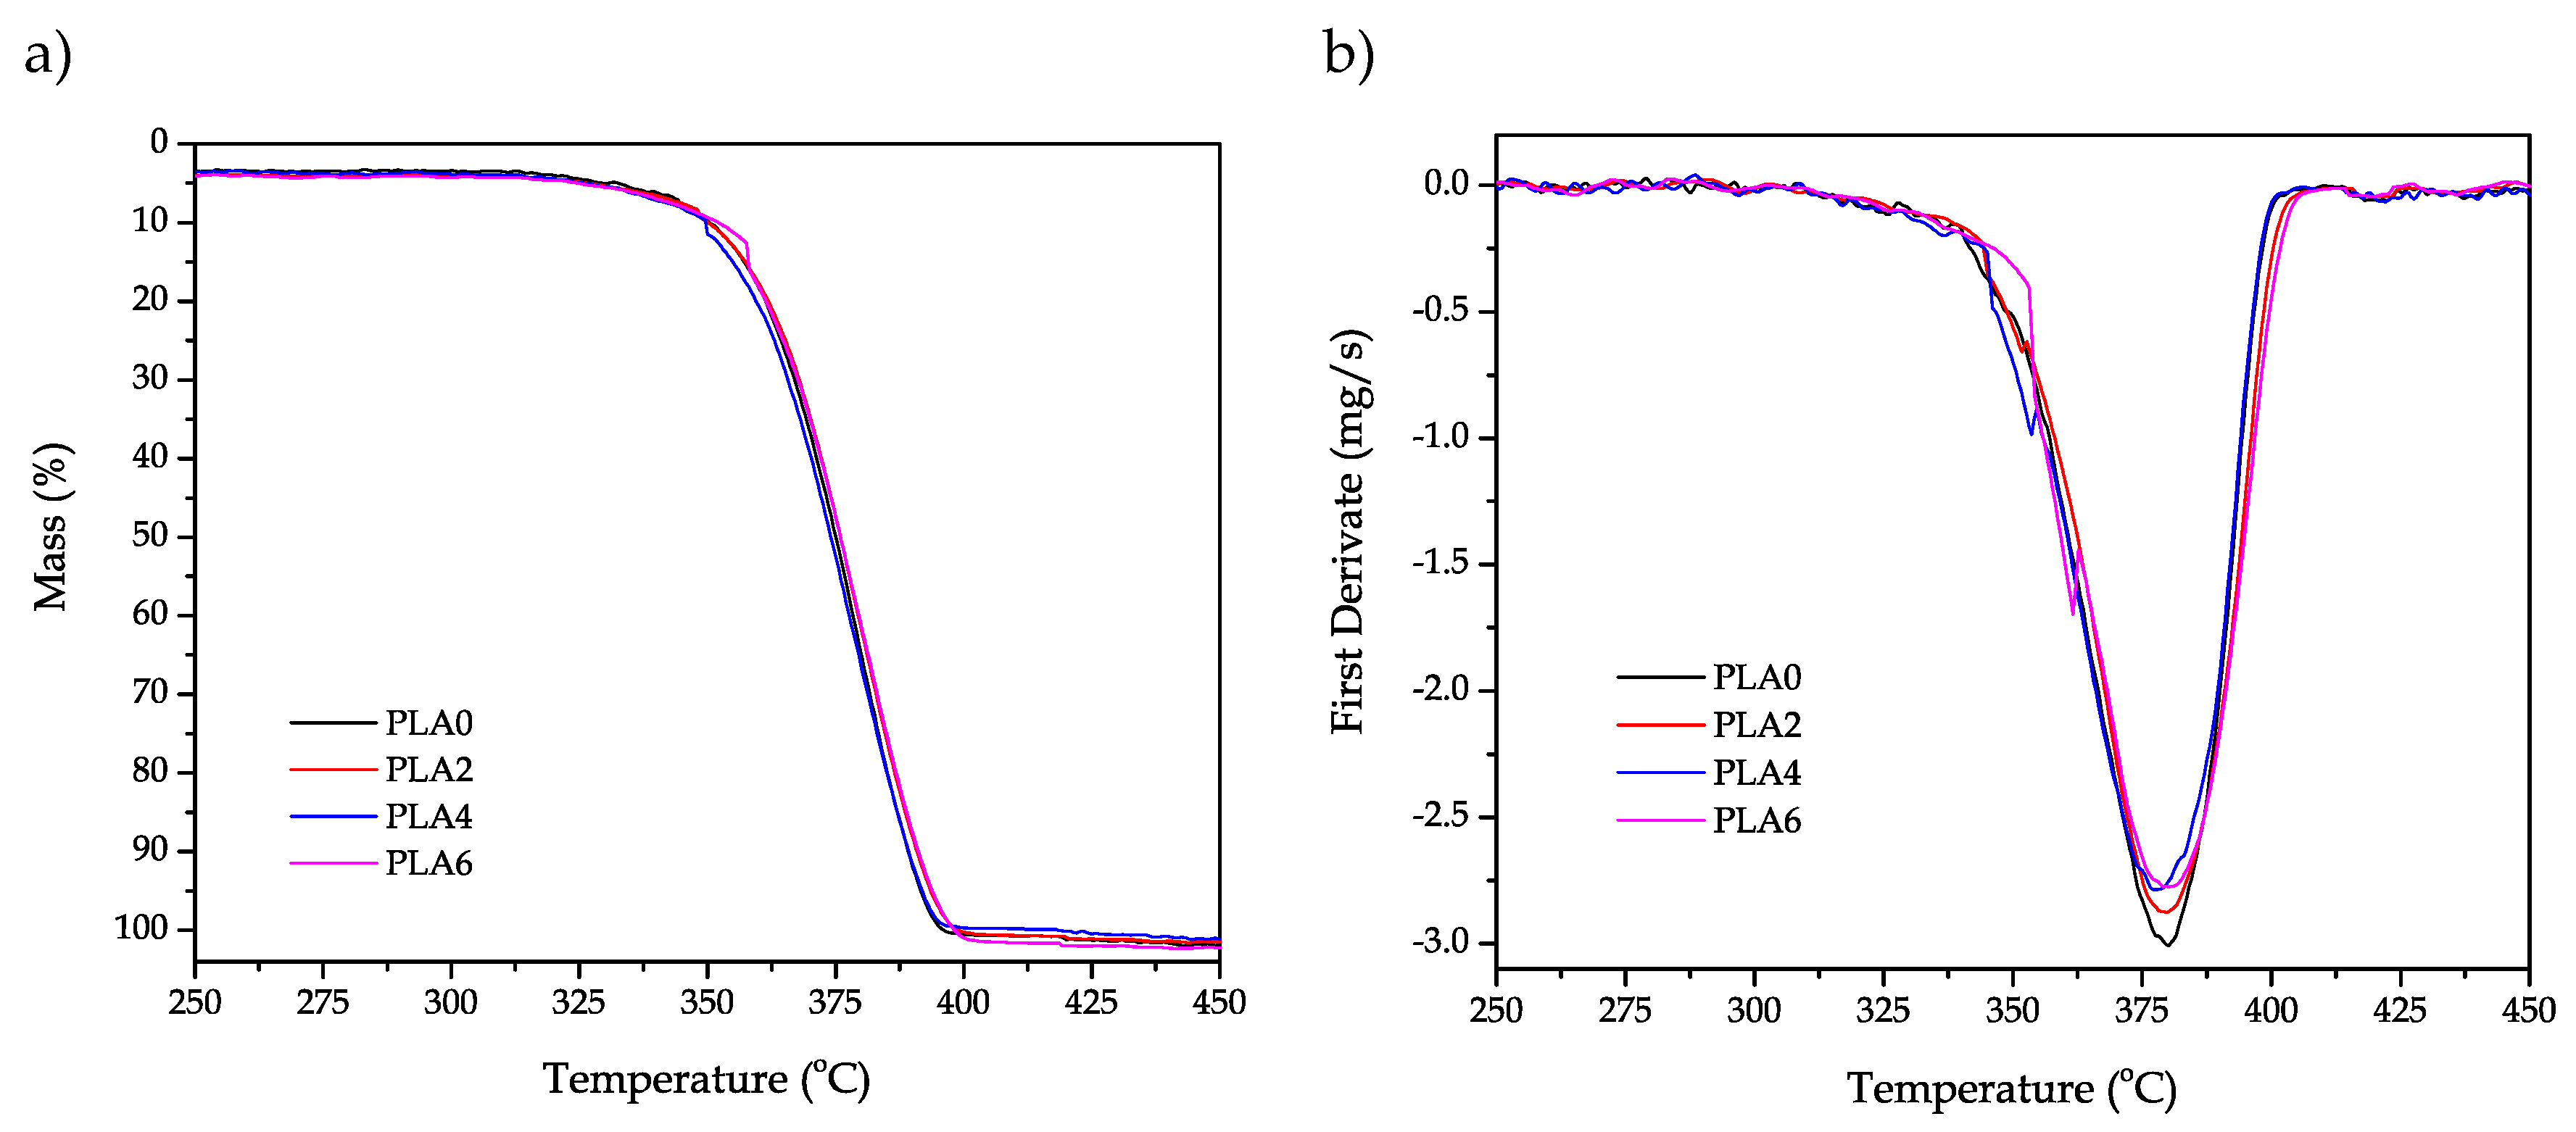
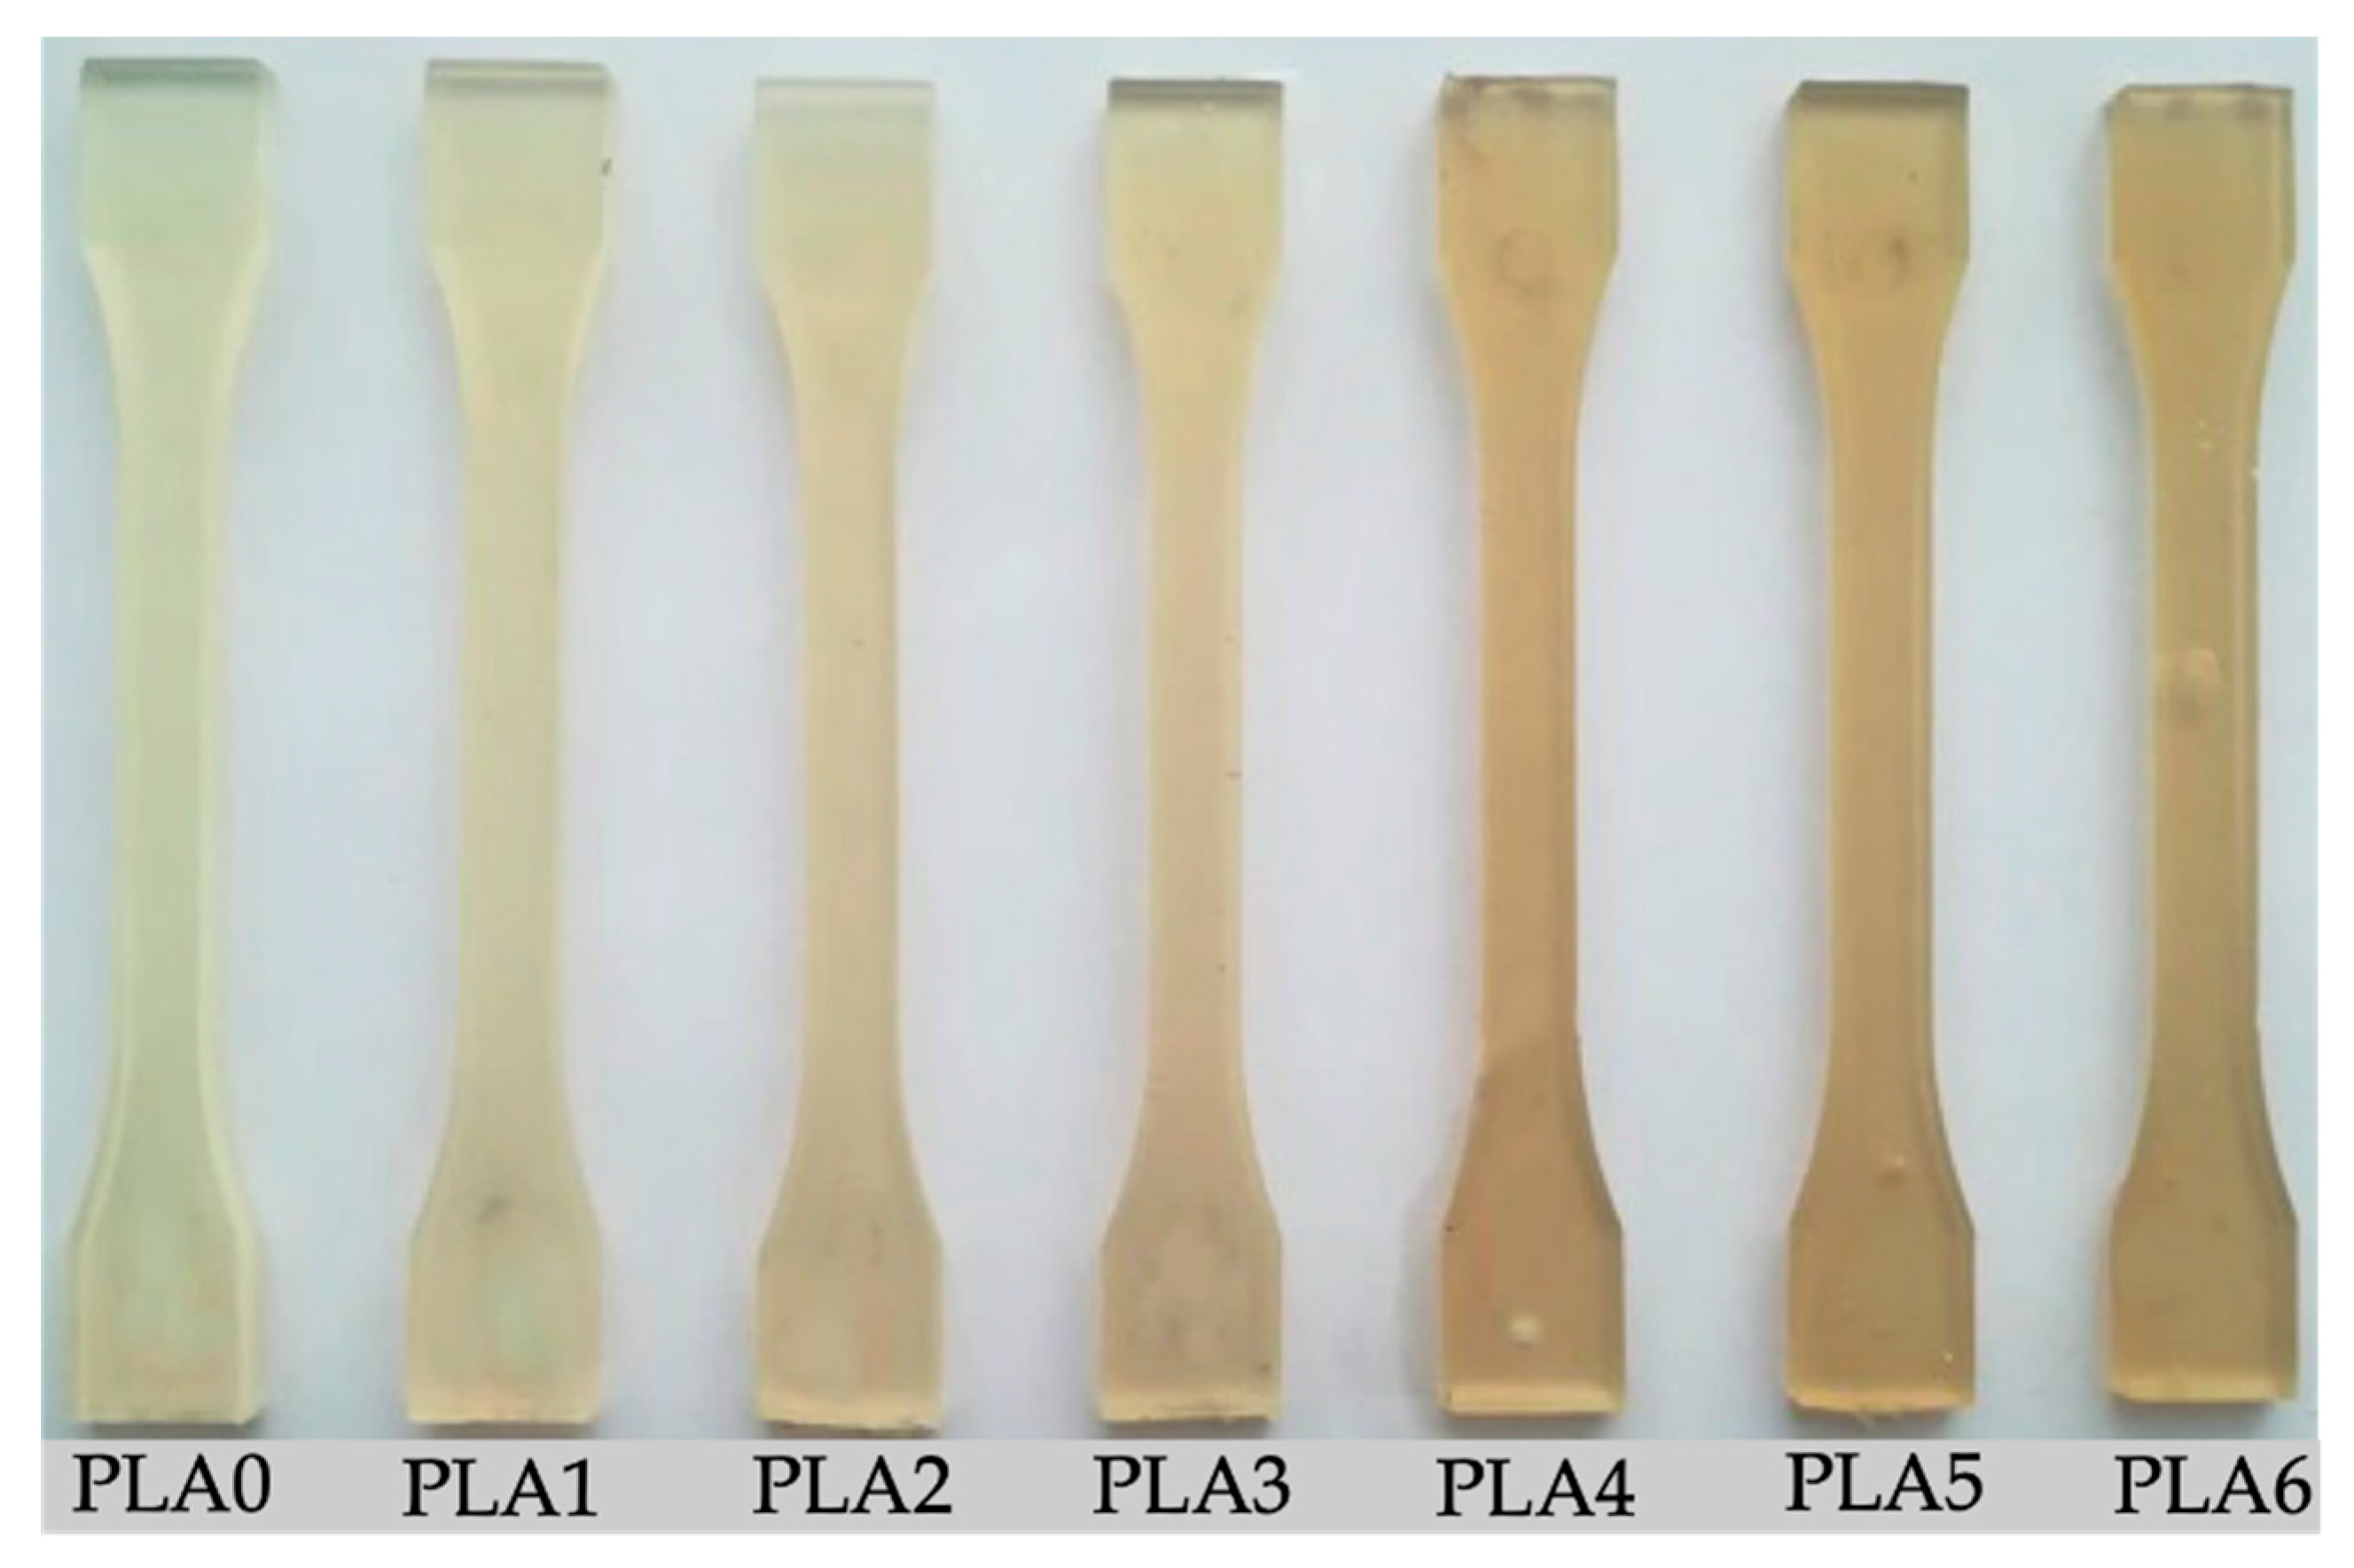
3.2. Influence of the Reprocessing Cycles on the Melt Fluidity, Thermal Properties, and Visual Aspect of PLA
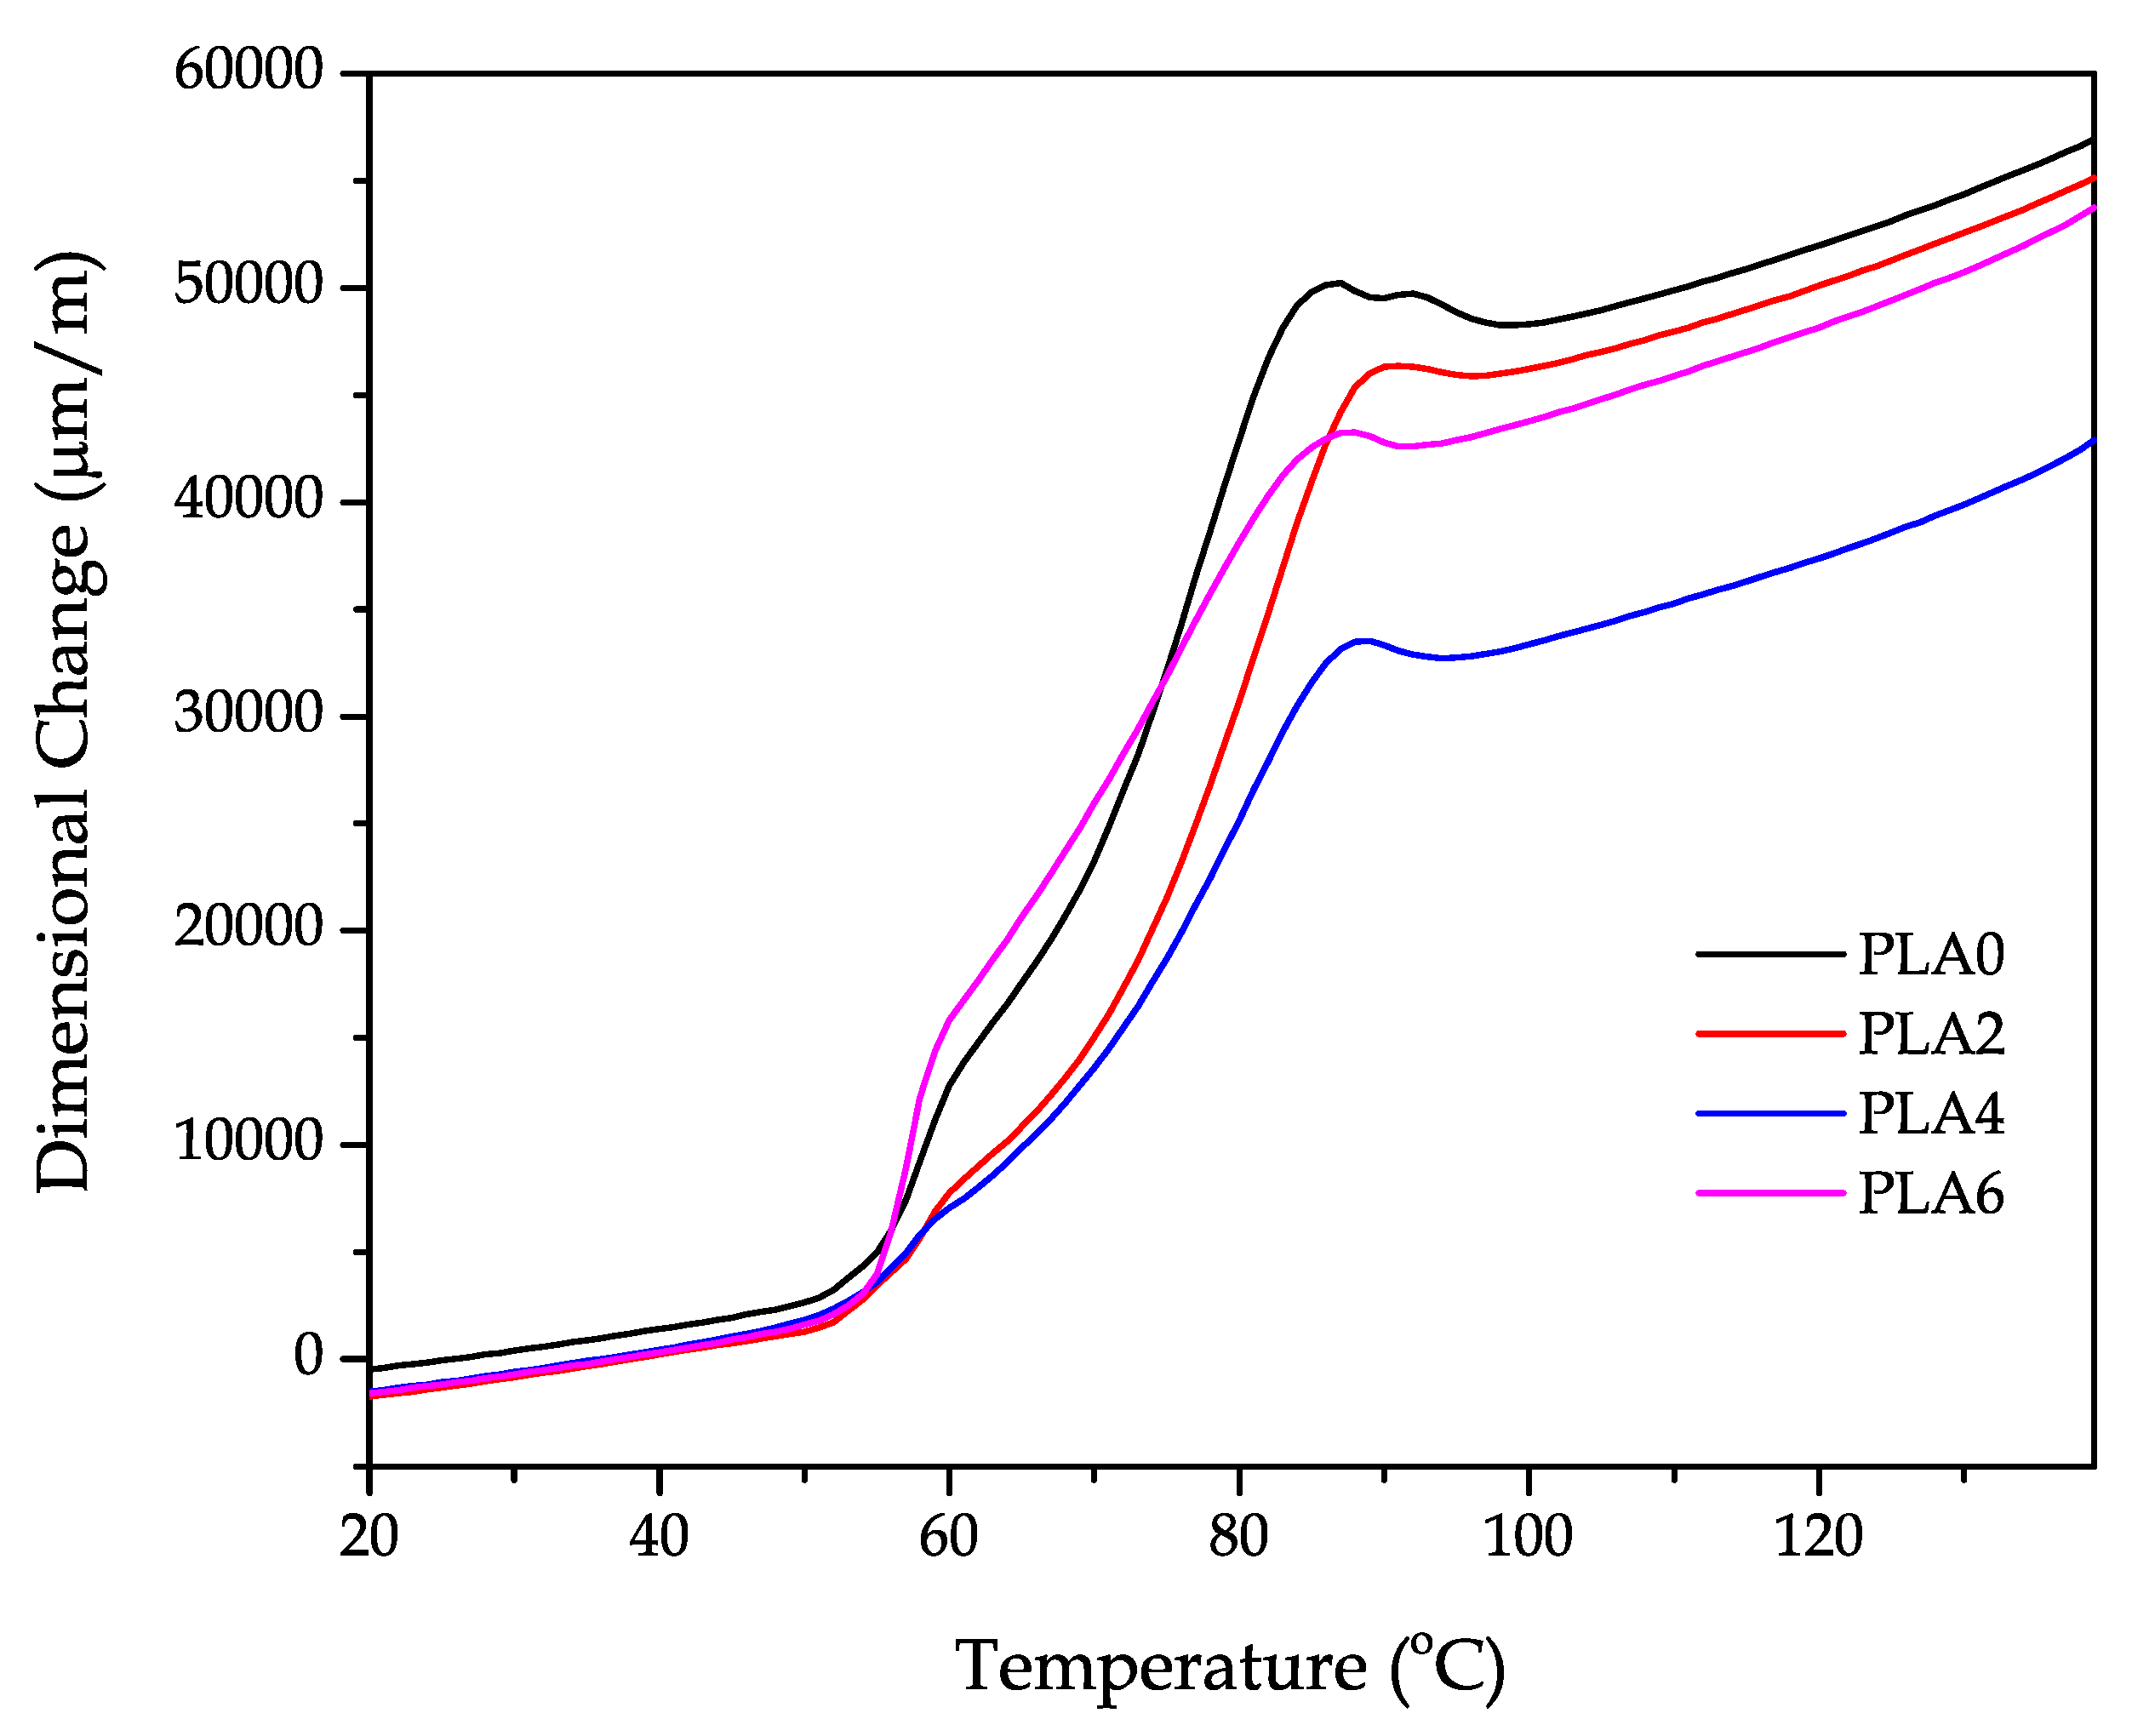
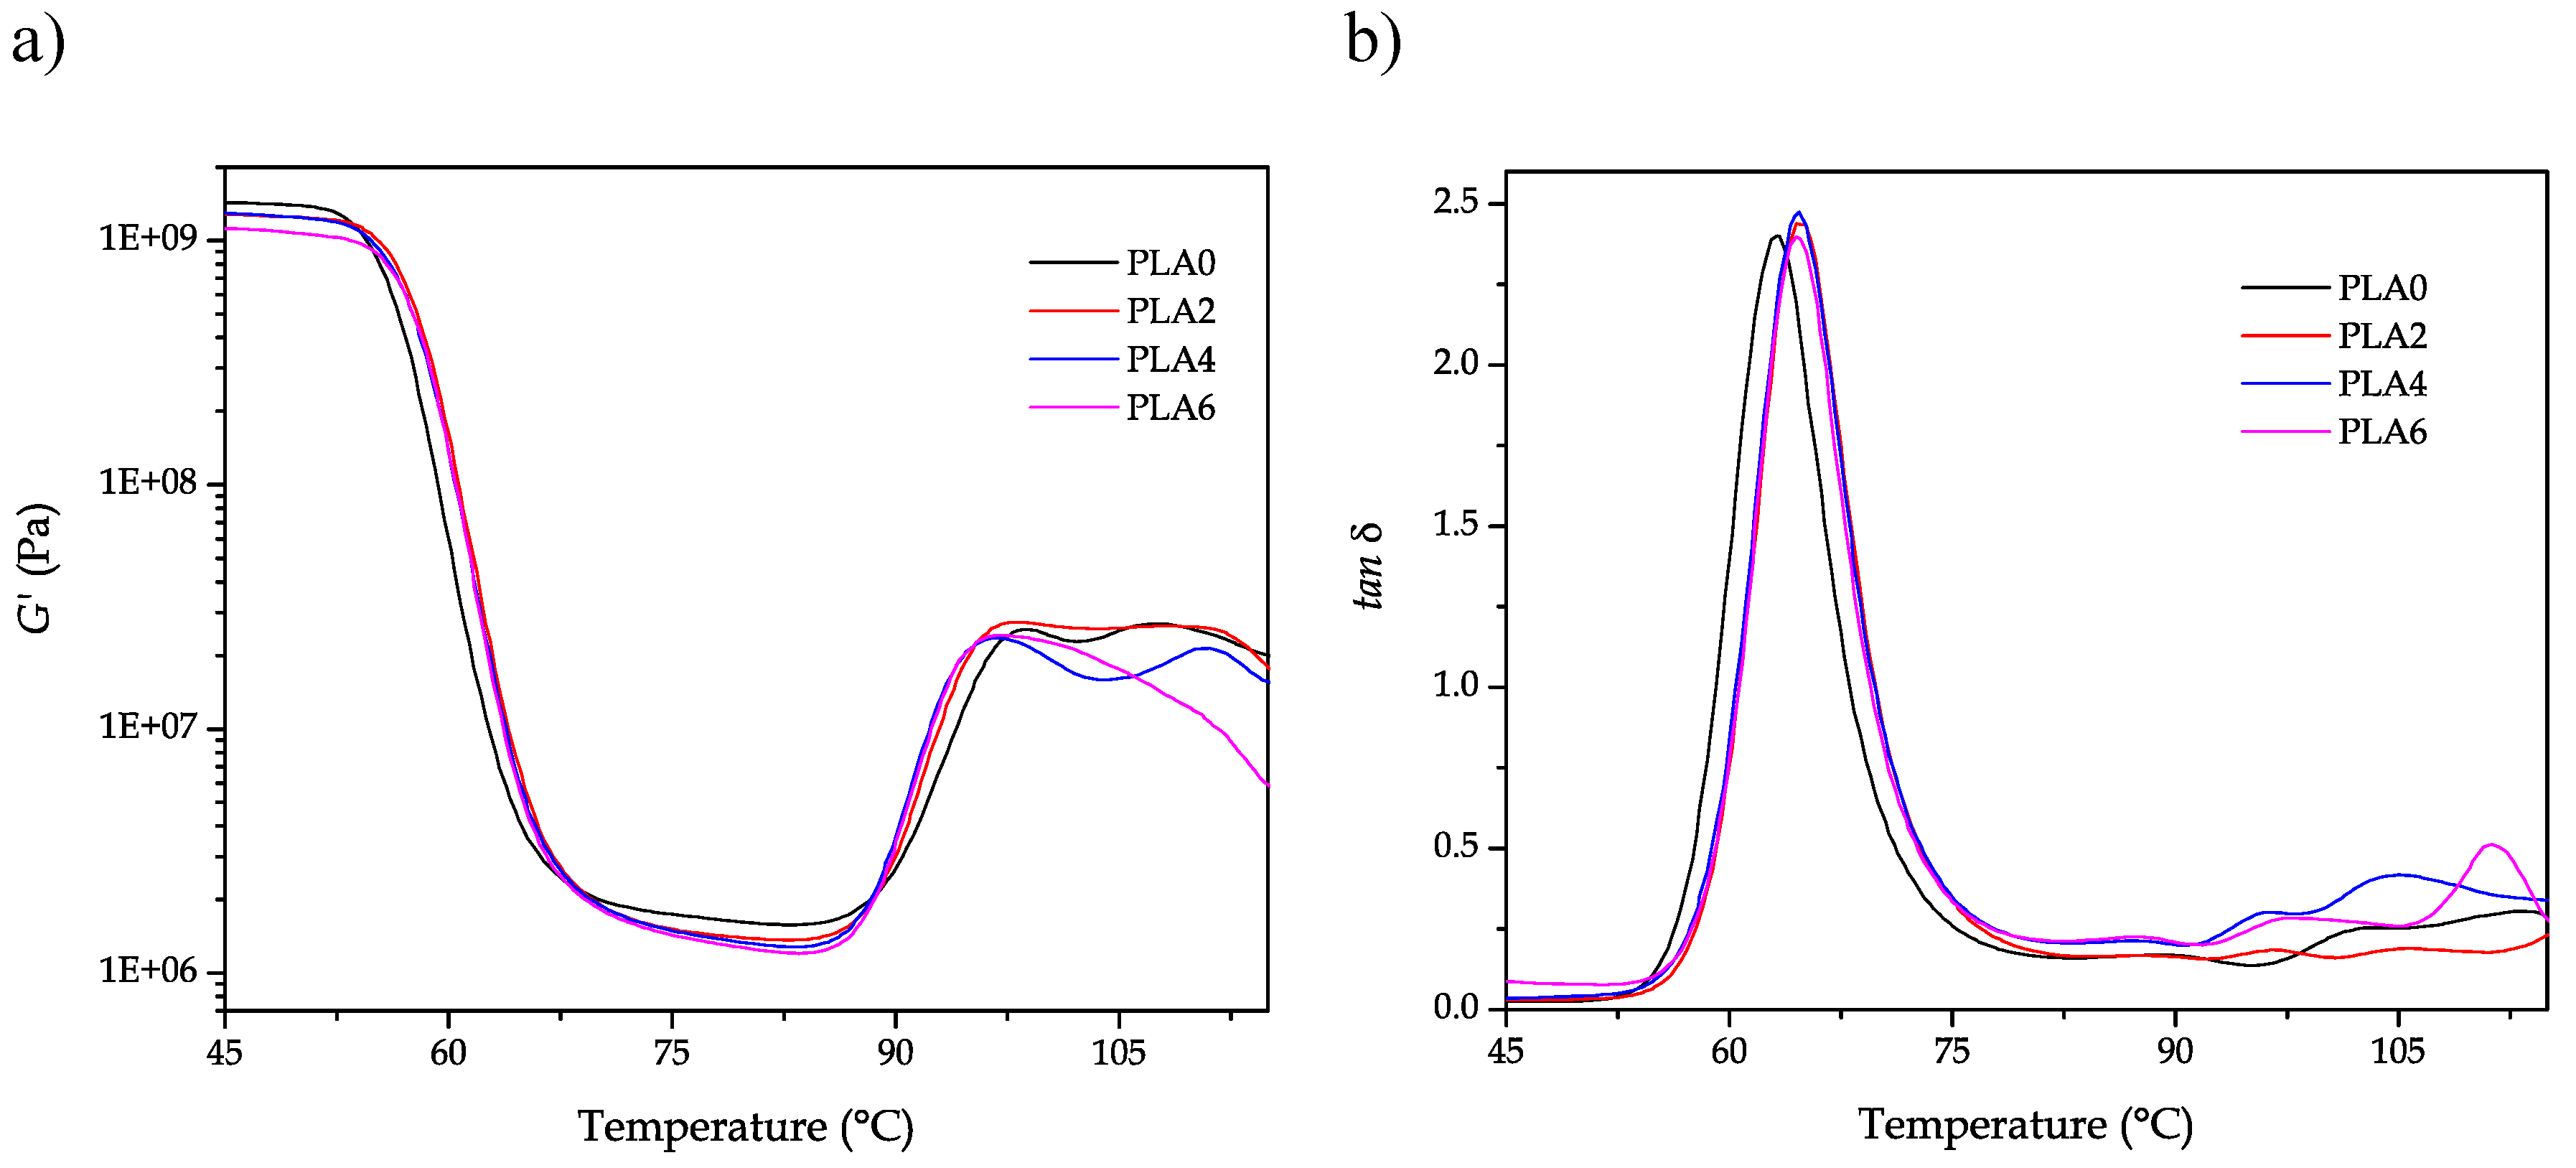
3.3. Influence of the Reprocessing Cycles on the Thermomechanical Properties of PLA
4. Conclusions
Author Contributions
Funding
Acknowledgments
Conflicts of Interest
References
- Gironi, F.; Piemonte, V. Life cycle assessment of polylactic acid and polyethylene terephthalate bottles for drinking water. Environ. Prog. Sustain. Energy 2011, 30, 459–468. [Google Scholar] [CrossRef]
- Hoppe, W.; Thonemann, N.; Bringezu, S. Life cycle assessment of carbon dioxide-based production of methane and methanol and derived polymers. J. Ind. Ecol. 2018, 22, 327–340. [Google Scholar] [CrossRef]
- Lujan-Ornelas, C.; Sternenfels, U.M.D.C.; Patricia Guereca, L. Life cycle assessment of mexican polymer and high-durability cotton paper banknotes. Sci. Total Environ. 2018, 630, 409–421. [Google Scholar] [CrossRef] [PubMed]
- Vidal, R.; Moliner, E.; Martin, P.P.; Fita, S.; Wonneberger, M.; Verdejo, E.; Vanfleteren, F.; Lapena, N.; Gonzalez, A. Life cycle assessment of novel aircraft interior panels made from renewable or recyclable polymers with natural fiber reinforcements and non-halogenated flame retardants. J. Ind. Ecol. 2018, 22, 132–144. [Google Scholar] [CrossRef]
- Kijchavengkul, T.; Auras, R.; Rubino, M.; Selke, S.; Ngouajio, M.; Fernandez, R.T. Biodegradation and hydrolysis rate of aliphatic aromatic polyester. Polym. Degrad. Stab. 2010, 95, 2641–2647. [Google Scholar] [CrossRef]
- Borovikov, P.I.; Sviridov, A.P.; Antonov, E.N.; Dunaev, A.G.; Krotova, L.I.; Fatkhudinov, T.K.; Popov, V.K. Model of aliphatic polyesters hydrolysis comprising water and oligomers diffusion. Polym. Degrad. Stab. 2019, 159, 70–78. [Google Scholar] [CrossRef]
- Han, S.-I.; Yoo, Y.; Kim, D.K.; Im, S.S. Biodegradable aliphatic polyester ionomers. Macromol. Biosci. 2004, 4, 200–207. [Google Scholar] [CrossRef]
- Li, Y.; Liao, C.; Tjong, S.C. Synthetic biodegradable aliphatic polyester nanocomposites reinforced with nanohydroxyapatite and/or graphene oxide for bone tissue engineering applications. Nanomaterials 2019, 9, 590. [Google Scholar] [CrossRef]
- Sekiguchi, T.; Saika, A.; Nomura, K.; Watanabe, T.; Watanabe, T.; Fujimoto, Y.; Enoki, M.; Sato, T.; Kato, C.; Kanehiro, H. Biodegradation of aliphatic polyesters soaked in deep seawaters and isolation of poly(epsilon-caprolactone)-degrading bacteria. Polym. Degrad. Stab. 2011, 96, 1397–1403. [Google Scholar] [CrossRef]
- Ferrero, B.; Fombuena, V.; Fenollar, O.; Boronat, T.; Balart, R. Development of natural fiber-reinforced plastics (NFRP) based on biobased polyethylene and waste fibers from posidonia oceanica seaweed. Polym. Compos. 2015, 36, 1378–1385. [Google Scholar] [CrossRef]
- Montanes, N.; Garcia-Sanoguera, D.; Segui, V.J.; Fenollar, O.; Boronat, T. Processing and characterization of environmentally friendly composites from biobased polyethylene and natural fillers from thyme herbs. J. Polym. Environ. 2018, 26, 1218–1230. [Google Scholar] [CrossRef]
- Torres-Giner, S.; Torres, A.; Ferrándiz, M.; Fombuena, V.; Balart, R. Antimicrobial activity of metal cation-exchanged zeolites and their evaluation on injection-molded pieces of bio-based high-density polyethylene. J. Food Saf. 2017, 37, e12348. [Google Scholar] [CrossRef]
- Quiles-Carrillo, L.; Boronat, T.; Montanes, N.; Balart, R.; Torres-Giner, S. Injection-molded parts of fully bio-based polyamide 1010 strengthened with waste derived slate fibers pretreated with glycidyl- and amino-silane coupling agents. Polym. Test. 2019, 77, 105875. [Google Scholar] [CrossRef]
- Quiles-Carrillo, L.; Montanes, N.; Boronat, T.; Balart, R.; Torres-Giner, S. Evaluation of the engineering performance of different bio-based aliphatic homopolyamide tubes prepared by profile extrusion. Polym. Test. 2017, 61, 421–429. [Google Scholar] [CrossRef]
- Abedini, F.; Ebrahimi, M.; Roozbehani, A.H.; Domb, A.J.; Hosseinkhani, H. Overview on natural hydrophilic polysaccharide polymers in drug delivery. Polym. Adv. Technol. 2018, 29, 2564–2573. [Google Scholar] [CrossRef]
- Gandini, A.; Lacerda, T.M.; Carvalho, A.J.F.; Trovatti, E. Progress of polymers from renewable resources: Furans, vegetable oils, and polysaccharides. Chem. Rev. 2016, 116, 1637–1669. [Google Scholar] [CrossRef]
- Jagadeesh, D.; Kanny, K.; Prashantha, K. A review on research and development of green composites from plant protein-based polymers. Polym. Compos. 2017, 38, 1504–1518. [Google Scholar] [CrossRef]
- Rai, K.; Sun, Y.; Shaliutina-Kolesova, A.; Nian, R.; Xian, M. Proteins: Natural polymers for tissue engineering. J. Biomater. Tissue Eng. 2018, 8, 295–308. [Google Scholar] [CrossRef]
- Werten, M.W.T.; Eggink, G.; Cohen Stuart, M.A.; de Wolf, F.A. Production of protein-based polymers in pichia pastoris. Biotechnol. Adv. 2019, 37, 642–666. [Google Scholar] [CrossRef]
- Brigham, C.J.; Riedel, S.L. The potential of polyhydroxyalkanoate production from food wastes. Appl. Food Biotechnol. 2019, 6, 7–18. [Google Scholar]
- Elmowafy, E.; Abdal-Hay, A.; Skouras, A.; Tiboni, M.; Casettari, L.; Guarino, V. Polyhydroxyalkanoate (PHA): Applications in drug delivery and tissue engineering. Expert Rev. Med. Devices 2019, 16, 467–482. [Google Scholar] [CrossRef] [PubMed]
- Partini, M.; Pantani, R. Ftir analysis of hydrolysis in aliphatic polyesters. Polym. Degrad. Stab. 2007, 92, 1491–1497. [Google Scholar] [CrossRef]
- Wang, D.K.; Varanasi, S.; Fredericks, P.M.; Hill, D.J.T.; Symons, A.L.; Whittaker, A.K.; Rasoul, F. Ft-ir characterization and hydrolysis of PLA-PEG-PLA based copolyester hydrogels with short PLA segments and a cytocompatibility study. J. Polym. Sci. Part A Polym. Chem. 2013, 51, 5163–5176. [Google Scholar] [CrossRef]
- Li, Y.; Chu, Z.; Li, X.; Ding, X.; Guo, M.; Zhao, H.; Yao, J.; Wang, L.; Cai, Q.; Fan, Y. The effect of mechanical loads on the degradation of aliphatic biodegradable polyesters. Regen. Biomater. 2017, 4, 179–190. [Google Scholar] [CrossRef] [PubMed]
- Quiles-Carrillo, L.; Duart, S.; Montanes, N.; Torres-Giner, S.; Balart, R. Enhancement of the mechanical and thermal properties of injection-molded polylactide parts by the addition of acrylated epoxidized soybean oil. Mater. Des. 2018, 140, 54–63. [Google Scholar] [CrossRef]
- Quiles-Carrillo, L.; Montanes, N.; Garcia-Garcia, D.; Carbonell-Verdu, A.; Balart, R.; Torres-Giner, S. Effect of different compatibilizers on injection-molded green composite pieces based on polylactide filled with almond shell flour. Compos. Part B Eng. 2018, 147, 76–85. [Google Scholar] [CrossRef]
- European Bioplastics. Bioplastics Market Data 2018. Global Production Capacities of Bioplastics 2018–2023; European Bioplastics: Berlin, Germany, 2018; p. 4. [Google Scholar]
- Chen, Y.; Xu, J.; Tan, Q.; Zhang, Z.; Zheng, J.; Xu, X.; Li, Y. End-group functionalization of polyethylene glycol-polylactic acid copolymer and its application in the field of pharmaceutical carriers. J. Biobased Mater. Bioenergy 2019, 13, 690–698. [Google Scholar]
- Hua, K.; Yang, X.; Zhou, J.; Duan, C. Biocompatibility analysis of an novel poly (butyl succinate) (PBS) and polylactic acid (pla) copolymer as a sternal fixation material. Cardiology 2011, 120, 47–48. [Google Scholar]
- Nguyen, T.H.; Tangboriboonrat, P.; Rattanasom, N.; Petchsuk, A.; Opaprakasit, M.; Thammawong, C.; Opaprakasit, P. Polylactic acid/ethylene glycol triblock copolymer as novel crosslinker for epoxidized natural rubber. J. Appl. Polym. Sci. 2012, 124, 164–174. [Google Scholar] [CrossRef]
- Sun, R.; Du, X.-J.; Sun, C.-Y.; Shen, S.; Liu, Y.; Yang, X.-Z.; Bao, Y.; Zhu, Y.-H.; Wang, J. A block copolymer of zwitterionic polyphosphoester and polylactic acid for drug delivery. Biomater. Sci. 2015, 3, 1105–1113. [Google Scholar] [CrossRef]
- Veloso dos Anjos, A.L.; Perez, R.C.; Braga, B.M.; Matsumoto, M.A.; Okamoto, R.; Saraiva, P.P.; da Silva, A.A.; Pegoraro, T.A. Polylactic/polyglycolic acid copolymer is a good carrier for BMP-2 on bone regeneration? Biosci. J. 2017, 33, 815–823. [Google Scholar] [CrossRef]
- Fairag, R.; Rosenzweig, D.H.; Ramirez-Garcialuna, J.L.; Weber, M.H.; Haglund, L. Three-dimensional printed polylactic acid scaffolds promote bone-like matrix deposition in vitro. ACS Appl. Mater. Interfaces 2019, 11, 15306–15315. [Google Scholar] [CrossRef] [PubMed]
- Miclaus, R.; Repanovici, A.; Roman, N. Biomaterials: Polylactic acid and 3D printing processes for orthosis and prosthesis. Mater. Plast. 2017, 54, 98–102. [Google Scholar]
- Zhang, H.; Mao, X.; Zhao, D.; Jiang, W.; Du, Z.; Li, Q.; Jiang, C.; Han, D. Three dimensional printed polylactic acid-hydroxyapatite composite scaffolds for prefabricating vascularized tissue engineered bone: An in vivo bioreactor model. Sci. Rep. 2017, 7, 15255. [Google Scholar] [CrossRef]
- Coulembier, O.; Degee, P.; Hedrick, J.L.; Dubois, P. From controlled ring-opening polymerization to biodegradable aliphatic polyester: Especially poly(beta-malic acid) derivatives. Prog. Polym. Sci. 2006, 31, 723–747. [Google Scholar] [CrossRef]
- Mazzanti, V.; Malagutti, L.; Mollica, F. FDM 3D printing of polymers containing natural fillers: A review of their mechanical properties. Polymers 2019, 11, 1094. [Google Scholar] [CrossRef]
- Zhao, P.; Rao, C.; Gu, F.; Sharmin, N.; Fu, J. Close-looped recycling of polylactic acid used in 3d printing: An experimental investigation and life cycle assessment. J. Clean. Prod. 2018, 197, 1046–1055. [Google Scholar] [CrossRef]
- Liu, Z.; Wang, Y.; Wu, B.; Cui, C.; Guo, Y.; Yan, C. A critical review of fused deposition modeling 3D printing technology in manufacturing polylactic acid parts. Int. J. Adv. Manuf. Technol. 2019, 102, 2877–2889. [Google Scholar] [CrossRef]
- Mistro Matos, B.D.; Rocha, V.; da Silva, E.J.; Moro, F.H.; Bottene, A.C.; Ribeiro, C.A.; Dias, D.D.S.; Antonio, S.G.; do Amaral, A.C.; Cruz, S.A.; et al. Evaluation of commercially available polylactic acid (PLA) filaments for 3D printing applications. J. Therm. Anal. Calorim. 2019, 137, 555–562. [Google Scholar] [CrossRef]
- Kamthai, S.; Magaraphan, R. Development of an active polylactic acid (pla) packaging film by adding bleached bagasse carboxymethyl cellulose (CMCB) for mango storage life extension. Packag. Technol. Sci. 2019, 32, 103–116. [Google Scholar] [CrossRef]
- Marra, A.; Silvestre, C.; Duraccio, D.; Cimmino, S. Polylactic acid/zinc oxide biocomposite films for food packaging application. Int. J. Biol. Macromol. 2016, 88, 254–262. [Google Scholar] [CrossRef]
- Masmoudi, F.; Bessadok, A.; Dammak, M.; Jaziri, M.; Ammar, E. Biodegradable packaging materials conception based on starch and polylactic acid (PLA) reinforced with cellulose. Environ. Sci. Pollut. Res. 2016, 23, 20904–20914. [Google Scholar] [CrossRef]
- Akesson, D.; Vrignaud, T.; Tissot, C.; Skrifvars, M. Mechanical recycling of PLA filled with a high level of cellulose fibres. J. Polym. Environ. 2016, 24, 185–195. [Google Scholar] [CrossRef]
- Cristina, A.M.; Sara, F.; Fausto, G.; Vincenzo, P.; Rocchina, S.; Claudio, V. Degradation of post-consumer PLA: Hydrolysis of polymeric matrix and oligomers stabilization in aqueous phase. J. Polym. Environ. 2018, 26, 4396–4404. [Google Scholar] [CrossRef]
- Carbokarst, D.; Yang, Y. Molecular modeling study of the resistance of pla to hydrolysis based on the blending of plla and pdla. Polymer 2006, 47, 4845–4850. [Google Scholar]
- Najafi, N.; Heuzey, M.C.; Carreau, P.J. Crystallization behavior and morphology of polylactide and PLA/clay nanocomposites in the presence of chain extenders. Polym. Eng. Sci. 2013, 53, 1053–1064. [Google Scholar] [CrossRef]
- Palsikowski, P.A.; Kuchnier, C.N.; Pinheiro, I.F.; Morales, A.R. Biodegradation in soil of PLA/PBAT blends compatibilized with chain extender. J. Polym. Environ. 2018, 26, 330–341. [Google Scholar] [CrossRef]
- Stloukal, P.; Kalendova, A.; Mattausch, H.; Laske, S.; Holzer, C.; Koutny, M. The influence of a hydrolysis-inhibiting additive on the degradation and biodegradation of PLA and its nanocomposites. Polym. Test. 2015, 41, 124–132. [Google Scholar] [CrossRef]
- Tanaka, M.; Atsumi, K.; Onodera, M.; Saito, H.; Kimpara, I. Hydrolysis control by introduction of photodissociable protecting groups in pla as matrix of green composite materials. Adv. Compos. Mater. 2014, 23, 521–534. [Google Scholar] [CrossRef]
- Akesson, D.; Fazelinejad, S.; Skrifvars, V.-V.; Skrifvars, M. Mechanical recycling of polylactic acid composites reinforced with wood fibres by multiple extrusion and hydrothermal ageing. J. Reinf. Plast. Compos. 2016, 35, 1248–1259. [Google Scholar] [CrossRef]
- Cristina, A.M.; Rosaria, A.; Sara, F.; Fausto, G. PLA recycling by hydrolysis at high temperature. In VIII International Conference on Times of Polymers and Composites: From Aerospace to Nanotechnology; Damore, A., Acierno, D., Grassia, L., Eds.; AIP Publishing: Melville, NY, USA, 2016; Volume 1736. [Google Scholar]
- Fazelinejad, S.; Akesson, D.; Skrifvars, M. Repeated mechanical recycling of polylactic acid filled with chalk. Prog. Rubber Plast. Recycl. Technol. 2017, 33, 1–16. [Google Scholar] [CrossRef]
- Hamad, K.; Kaseem, M.; Deri, F. Effect of recycling on rheological and mechanical properties of poly(lactic acid)/polystyrene polymer blend. J. Mater. Sci. 2011, 46, 3013–3019. [Google Scholar] [CrossRef]
- Baimark, Y.; Srihanam, P. Influence of chain extender on thermal properties and melt flow index of stereocomplex pla. Polym. Test. 2015, 45, 52–57. [Google Scholar] [CrossRef]
- Freitas, A.L.P.D.L.; Tonini Filho, L.R.; Calvao, P.S.; Catelh de Souza, A.M. Effect of montmorillonite and chain extender on rheological, morphological and biodegradation behavior of PLA/PBAT blends. Polym. Test. 2017, 62, 189–195. [Google Scholar] [CrossRef]
- Hachana, N.; Wongwanchai, T.; Chaochanchaikul, K.; Harnnarongchai, W. Influence of crosslinking agent and chain extender on properties of gamma-irradiated pla. J. Polym. Environ. 2017, 25, 323–333. [Google Scholar] [CrossRef]
- Rojas-González, A.F.; Carrero-Mantilla, J.I. Thermal degradation kinetic of polylactic acid in multiple extrusions. Ing. Univ. 2015, 19, 189–206. [Google Scholar]
- Tochacek, J.; Jancar, J. Processing degradation index (PDI)—A quantitative measure of processing stability of polypropylene. Polym. Test. 2012, 31, 1115–1120. [Google Scholar] [CrossRef]
- Gonzalez, L.; Agüero, A.; Quiles-Carrillo, L.; Lascano, D.; Montanes, N. Optimization of the loading of an environmentally friendly compatibilizer derived from linseed oil in poly(lactic acid)/diatomaceous earth composites. Materials 2019, 12, 1627. [Google Scholar] [CrossRef]
- Stencel, R.; Kasperski, J.; Pakieła, W.; Mertas, A.; Bobela, E.; Barszczewska-Rybarek, I.; Chladek, G. Properties of experimental dental composites containing antibacterial silver-releasing filler. Materials 2018, 11, 1031. [Google Scholar] [CrossRef]
- Mokrzycki, W.S.; Tatol, M. Colour difference ∆E—A survey. Mach. Graph. Vis. Int. J. 2011, 20, 383–411. [Google Scholar]
- Simmons, H.; Kontopoulou, M. Hydrolytic degradation of branched PLA produced by reactive extrusion. Polym. Degrad. Stab. 2018, 158, 228–237. [Google Scholar] [CrossRef]
- Oromiehie, A.; Mamizadeh, A. Recycling PET beverage bottles and improving properties. Polym. Int. 2004, 53, 728–732. [Google Scholar] [CrossRef]
- Ferri, J.M.; Fenollar, O.; Jorda-Vilaplana, A.; García-Sanoguera, D.; Balart, R. Effect of miscibility on mechanical and thermal properties of poly(lactic acid)/polycaprolactone blends. Polym. Int. 2016, 65, 453–463. [Google Scholar] [CrossRef]
- Ferri, J.M.; Garcia-Garcia, D.; Montanes, N.; Fenollar, O.; Balart, R. The effect of maleinized linseed oil as biobased plasticizer in poly(lactic acid)-based formulations. Polym. Int. 2017, 66, 882–891. [Google Scholar] [CrossRef]
- Lascano, D.; Quiles-Carrillo, L.; Balart, R.; Boronat, T.; Montanes, N. Toughened poly (lactic acid)—PLA formulations by binary blends with poly (butylene succinate-co-adipate)—PBSA and their shape memory behaviour. Materials 2019, 12, 622. [Google Scholar] [CrossRef]
- Yarahmadi, N.; Jakubowicz, I.; Enebro, J. Polylactic acid and its blends with petroleum-based resins: Effects of reprocessing and recycling on properties. J. Appl. Polym. Sci. 2016, 133. [Google Scholar] [CrossRef]
- Qi, H.J.; Joyce, K.; Boyce, M.C. Durometer hardness and the stress-strain behavior of elastomeric materials. Rubber Chem. Technol. 2003, 76, 419–435. [Google Scholar] [CrossRef]
- Graupner, N.; Albrecht, K.; Ziegmann, G.; Enzler, H.; Muessig, J. Influence of reprocessing on fibre length distribution, tensile strength and impact strength of injection moulded cellulose fibre-reinforced polylactide (PLA) composites. Express Polym. Lett. 2016, 10, 647–663. [Google Scholar] [CrossRef]
- Awale, R.J.; Ali, F.B.; Azmi, A.S.; Puad, N.I.M.; Anuar, H.; Hassan, A. Enhanced flexibility of biodegradable polylactic acid/starch blends using epoxidized palm oil as plasticizer. Polymers 2018, 10, 977. [Google Scholar] [CrossRef]
- Sharma, S.; Singh, A.A.; Majumdar, A.; Butola, B.S. Tailoring the mechanical and thermal properties of polylactic acid-based bionanocomposite films using halloysite nanotubes and polyethylene glycol by solvent casting process. J. Mater. Sci. 2019, 54, 8971–8983. [Google Scholar] [CrossRef]
- Tocháček, J.; Jančář, J.; Kalfus, J.; Zbořilová, P.; Buráň, Z. Degradation of polypropylene impact-copolymer during processing. Polym. Degrad. Stab. 2008, 93, 770–775. [Google Scholar] [CrossRef]
- La Mantia, F.P.; Correnti, A. Effect of processing conditions on the degradation and on the recycling of polycarbonate. Prog. Rubber Plast. Recycl. Technol. 2003, 19, 135–142. [Google Scholar] [CrossRef]
- Papageorgiou, G.Z.; Beslikas, T.; Gigis, J.; Christoforides, J.; Bikiaris, D.N. Crystallization and enzymatic hydrolysis of pla grade for orthopedics. Adv. Polym. Technol. 2010, 29, 280–299. [Google Scholar] [CrossRef]
- Aguero, A.; Quiles-Carrillo, L.; Jorda-Vilaplana, A.; Fenollar, O.; Montanes, N. Effect of different compatibilizers on environmentally friendly composites from poly(lactic acid) and diatomaceous earth. Polym. Int. 2019, 68, 893–903. [Google Scholar] [CrossRef]
- Signori, F.; Coltelli, M.-B.; Bronco, S. Thermal degradation of poly (lactic acid)(PLA) and poly (butylene adipate-co-terephthalate) (PBAT) and their blends upon melt processing. Polym. Degrad. Stab. 2009, 94, 74–82. [Google Scholar] [CrossRef]
- Peike, C.; Kaltenbach, T.; Weiß, K.; Koehl, M. Indoor vs. Outdoor Aging: Polymer Degradation in pv Modules Investigated by Raman Spectroscopy. In Reliability of Photovoltaic Cells, Modules, Components, and Systems V; International Society for Optics and Photonics: Bellingham, WA, USA, 2012; p. 84720V. [Google Scholar]
- Yousif, E.; Haddad, R. Photodegradation and photostabilization of polymers, especially polystyrene. SpringerPlus 2013, 2, 398. [Google Scholar] [CrossRef]
- Carrasco, F.; Pagès, P.; Gámez-Pérez, J.; Santana, O.; Maspoch, M.L. Processing of poly(lactic acid): Characterization of chemical structure, thermal stability and mechanical properties. Polym. Degrad. Stab. 2010, 95, 116–125. [Google Scholar] [CrossRef]
- Garancher, J.-P.; Fernyhough, A. Expansion and dimensional stability of semi-crystalline polylactic acid foams. Polym. Degrad. Stab. 2014, 100, 21–28. [Google Scholar] [CrossRef]


| Piece | Et (MPa) | σb (MPa) | εb (%) |
|---|---|---|---|
| PLA0 | 3580 ± 180 a | 54.8 ± 0.7 a | 9.73 ± 0.04 a |
| PLA1 | 3670 ± 250 b | 54.0 ± 0.8 a | 8.80 ± 0.47 b |
| PLA2 | 3750 ± 225 b | 53.8 ± 0.7 b | 8.79 ± 0.33 b |
| PLA3 | 3880 ± 290 b | 53.4 ± 0.4 b | 8.49 ± 0.28 b |
| PLA4 | 3900 ± 395 b | 52.1 ± 1.0 c | 7.27 ± 0.91 c |
| PLA5 | 3870 ± 302 b | 51.5 ± 1.3 c | 6.28 ± 0.21 d |
| PLA6 | 3770 ± 245 b | 51.2 ± 0.9 c | 6.28 ± 0.11 d |
| Piece | Shore D Hardness | Impact Strength (kJ·m−2) |
|---|---|---|
| PLA0 | 79.6 ± 3.2 a | 57.8 ± 3.7 a |
| PLA1 | 79.3 ± 3.3 a | 56.3 ± 3.6 a |
| PLA2 | 78.1 ± 1.9 a | 47.0 ± 2.8 b |
| PLA3 | 78.7 ± 2.4 a | 41.6 ± 0.6 c |
| PLA4 | 78.3 ± 1.3 a | 35.5 ± 4.7 d |
| PLA5 | 76.8 ± 1.6 b | 32.8 ± 2.4 d,e |
| PLA6 | 79.1 ± 1.8 a | 31.1 ± 1.9 e |
| Piece | Tg (°C) | ΔHcc (J·g−1) | Tcc (°C) | ΔHm (J·g−1) | Tm (°C) | χc_max (%) |
|---|---|---|---|---|---|---|
| PLA0 | 61.4 ± 1.1 a | - | - | 4.0 ± 0.2 a | 149.4 ± 2.1 a | 4.3 ± 0.2 a |
| PLA1 | 61.9 ± 0.9 a | - | - | 2.5 ± 0.4 b | 151.5 ± 1.9 a | 2.7 ± 0.8 b |
| PLA2 | 63.6 ± 2.1 a | 6.5 ± 0.5 a | 119.2 ± 1.1 a | 16.6 ± 0.7 c | 153.7 ± 2.5 a | 17.8 ± 0.8 c |
| PLA3 | 64.4 ± 2.4 a | 10.3 ± 0.6 b | 117.1 ± 2.1 b | 16.9 ± 0.9 c | 150.0 ± 2.0 a | 18.2 ± 1.0 c |
| PLA4 | 61.9 ± 2.0 a | 9.0 ± 0.9 c | 116.8 ± 1.7 b | 18.2 ± 1.1 d | 150.6 ± 1.7 a | 19.6 ± 1.1 c |
| PLA5 | 63.3 ± 1.9 a | 11.4 ± 0.8 b | 116.8 ± 2.1 b | 16.6 ± 0.9 c | 150.3 ± 2.3 a | 17.8 ± 1.0 c |
| PLA6 | 61.1 ± 2.3 a | 19.8 ± 1.0 d | 116.0 ± 2.4 b | 27.4 ± 1.7 e | 150.2 ± 1.9 a | 29.5 ± 1.4 d |
| Piece | T5% (°C) | Tdeg (°C) |
|---|---|---|
| PLA0 | 332.6 ± 1.1 a | 380.1 ± 1.1 a |
| PLA2 | 326.7 ± 0.8 b | 379.7 ± 0.9 a |
| PLA4 | 326.1 ± 0.9 b | 378.1 ± 1.0 a |
| PLA6 | 324.7 ± 1.0 b | 380.2 ± 1.1 a |
| Piece | L* | a* | b* | ΔE*ab | YI (D65/10°) |
|---|---|---|---|---|---|
| PLA0 | 73.23 ± 0.8 a | −6.96 ± 0.08 a | 10.75 ± 0.15 a | - | 42.4 ± 1.8 a |
| PLA1 | 74.15 ± 0.7 a | −4.51 ± 0.06 b | 13.23 ± 0.11 b | 3.6 ± 0.2 a | 48.5 ± 1.6 b |
| PLA2 | 63.70 ± 0.8 b | −1.01 ± 0.04 c | 13.14 ± 0.14 b | 11.5 ± 0.5 b | 54.2 ± 1.8 c |
| PLA3 | 62.31 ± 0.6 b | −0.53 ± 0.02 d | 14.53 ± 0.19 c | 13.2 ± 0.6 c | 57.5 ± 2.0 d |
| PLA4 | 65.06 ± 0.7 a,b | −0.70 ± 0.03 e | 21.25 ± 0.20 d | 14.7 ± 0.7 d | 66.9 ± 3.1 e |
| PLA5 | 54.56 ± 0.5 c | 0.51 ± 0.02 d | 21.77 ± 0.18 d | 22.9 ± 1.2 e | 73.6 ± 3.3 f |
| PLA6 | 58.65 ± 0.9 b,c | −2.10 ± 0.08 f | 20.59 ± 0.53 e | 18.3 ± 1.1 f | 66.8 ± 4.1 e |
| Code | Tg (°C) | CLTE (μm m−1 K−1) below Tg | CLTE (μm m−1 K−1) above Cold Crystallization |
|---|---|---|---|
| PLA0 | 54.2 ± 1.1 a | 106.7 ± 4.3 b | 198.2 ± 7.2 c |
| PLA2 | 54.9 ± 0.9 a | 106.2 ± 5.8 b | 195.5 ± 8.6 c |
| PLA4 | 53.6 ± 1.7 a | 106.3 ± 7.9 a | 196.2 ± 9.3 c |
| PLA6 | 55.0 ± 2.0 a | 111.6 ± 6.2 b | 218.4 ± 9.7 c |
© 2019 by the authors. Licensee MDPI, Basel, Switzerland. This article is an open access article distributed under the terms and conditions of the Creative Commons Attribution (CC BY) license (http://creativecommons.org/licenses/by/4.0/).
Share and Cite
Agüero, A.; Morcillo, M.d.C.; Quiles-Carrillo, L.; Balart, R.; Boronat, T.; Lascano, D.; Torres-Giner, S.; Fenollar, O. Study of the Influence of the Reprocessing Cycles on the Final Properties of Polylactide Pieces Obtained by Injection Molding. Polymers 2019, 11, 1908. https://doi.org/10.3390/polym11121908
Agüero A, Morcillo MdC, Quiles-Carrillo L, Balart R, Boronat T, Lascano D, Torres-Giner S, Fenollar O. Study of the Influence of the Reprocessing Cycles on the Final Properties of Polylactide Pieces Obtained by Injection Molding. Polymers. 2019; 11(12):1908. https://doi.org/10.3390/polym11121908
Chicago/Turabian StyleAgüero, Angel, Maria del Carmen Morcillo, Luis Quiles-Carrillo, Rafael Balart, Teodomiro Boronat, Diego Lascano, Sergio Torres-Giner, and Octavio Fenollar. 2019. "Study of the Influence of the Reprocessing Cycles on the Final Properties of Polylactide Pieces Obtained by Injection Molding" Polymers 11, no. 12: 1908. https://doi.org/10.3390/polym11121908
APA StyleAgüero, A., Morcillo, M. d. C., Quiles-Carrillo, L., Balart, R., Boronat, T., Lascano, D., Torres-Giner, S., & Fenollar, O. (2019). Study of the Influence of the Reprocessing Cycles on the Final Properties of Polylactide Pieces Obtained by Injection Molding. Polymers, 11(12), 1908. https://doi.org/10.3390/polym11121908