3.1. Characterization of TP-AFC
The FT-IR spectra of polyaniline and TP-AFC are shown in
Figure 1. The peaks at 820 cm
−1, 1667 cm
−1, 1596 cm
−1 and 3414 cm
−1 represented the CH, C-N, N-H and O-H bonds, respectively. TP-AFC showed two new peaks compared to polyaniline at 943 cm
−1 and 1051 cm
−1. They represented the P-O and P=O bonds, respectively. This indicated that the trimethyl phosphate was successfully grafted.
The SEM images of polyaniline and TP-AFC are shown in
Figure 2. It can be found that the morphology of the adsorbent does not substantially change after being grafted. This showed that the adsorbent had a stable structure. The modification rate of the amine can be calculated by the data obtained by SEM-EDS and the structural formula of polymer. One nitrogen atom is grafted with two phosphorus atoms. The calculated modification rate of amine is 20.6%.
3.2. Effect of pH
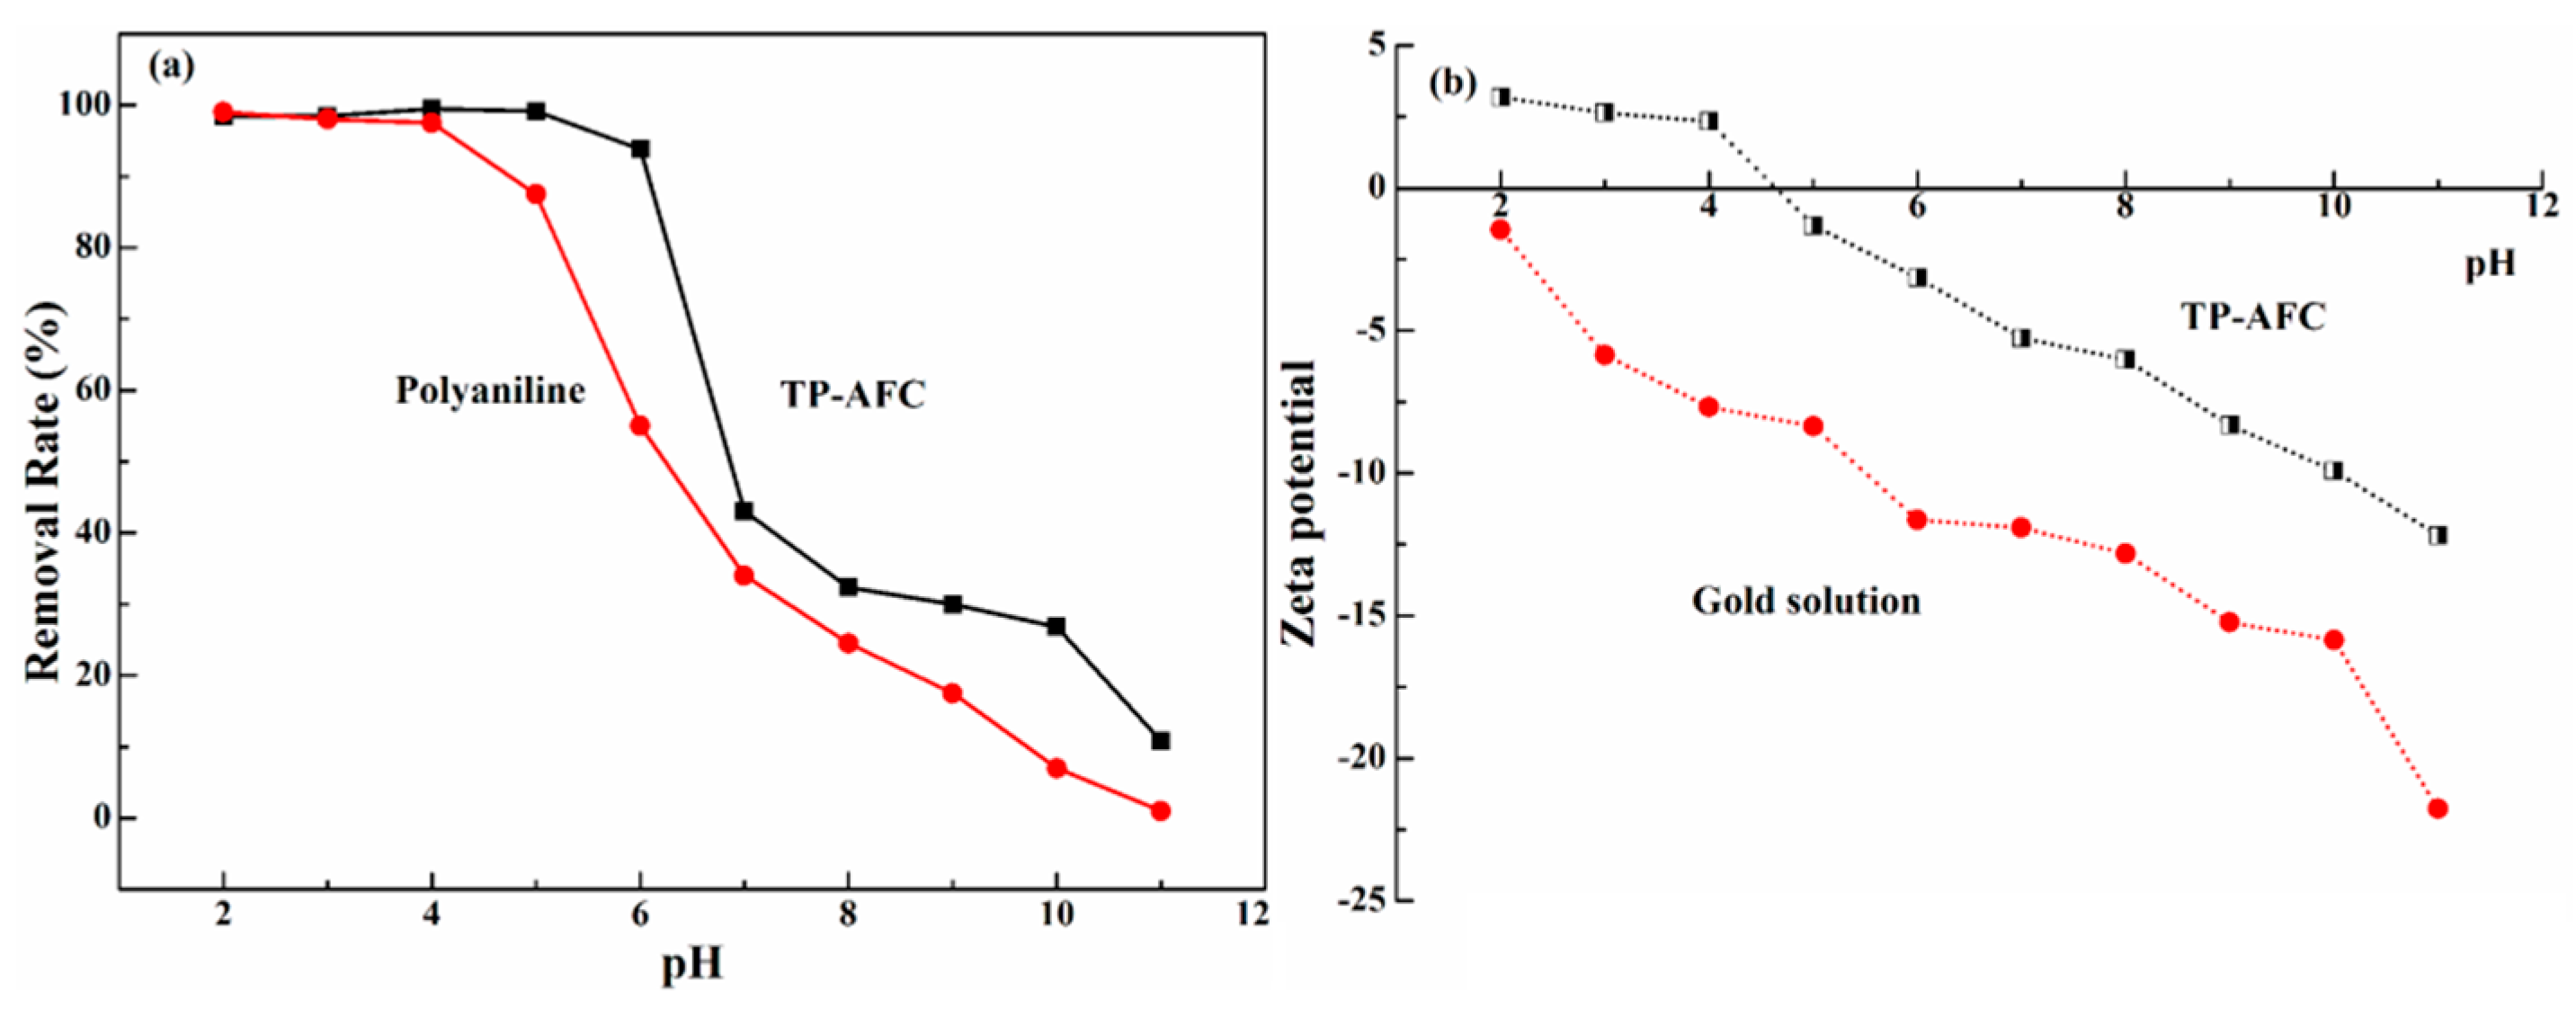
Solution pH has an important influence on the removal ability of metal ions. The effect of pH from 2 to 11 was studied when the concentration of gold ion was 200 mg/L.
Figure 3a showed that the adsorption capacity varies greatly with the change in pH. Obviously, TP-AFC shows the excellent adsorption ability in the pH range of 2 to 6. The maximum removal rate of gold ions by TP-AFC was occurred at pH 4. In contrast, the good removal rate of gold ions by polyaniline was occurred in the pH range of 2 to 4. When the pH is too high, the hydroxide(OH
−) in the solution competes with the adsorbent, resulting in a sharp drop in the adsorbing capacity. As the pH of the solution changes, gold ions mainly exist in the following forms:
The net total surface charge of TP-AFC can be represented by the zero potential (pH
PZC). The value of pH
PZC charge can be determined by the method described in the literature [
24]. The pH
PZC of TP-AFC was 2.8. In order to study the adsorption mechanism, the zeta potential of TP-AFC and gold solution were also determined. As shown in
Figure 3b, the isoelectric point of TP-AFC was 4.6, indicating that the potential was positive when pH was below 4.6. The gold solution showed a negative charge in the range of pH 2 to pH 4. Hence, there has an electrostatic effect between TP-AFC and gold.
3.3. Effect of Reaction Time
The effect of the reaction time on adsorption capacity was studied in order to explore the adsorption mechanism. 10 mg TP-AFC was added to 20 mL gold solutions (pH 4) and oscillated at 298 K with 250 rpm. The time was changed from 10 to 1440 min. As can be seen from
Figure 4a, the removal rate increased from 14% to 95% as time increased from 10 to 840 min, because many adsorption sites can rapidly combine with gold ions during the adsorption stage. As time goes by, the adsorption sites are few. Therefore, the removal rate did not change significantly after 840 min. Therefore, 840 min is the optimal reaction time.
The adsorption kinetics was studied by pseudo-first-order kinetic model, pseudo-second-order kinetic model, and intraparticle kinetic model. The pseudo-first-order kinetic model assumes that the adsorption rate varies with the number of non-adsorbed sites on the surface of the adsorbent. Equation (3) is used to describe the relationship between them [
25]:
where
and
are the adsorption capacities at equilibrium time and at time t, respectively.
is the rate constant of the Pseudo-first-order kinetic model. It can be seen from
Figure 4b and
Table 1 that the value of the correlation coefficient is lower, and the theoretical equilibrium adsorption capacity (292.5 mg/g) is much lower than the actual equilibrium adsorption capacity (399.6 mg/g). Therefore, the adsorption process does not conform to the pseudo-first-order kinetic model.
The pseudo-second-order kinetic model is based on chemisorption and is affected by the mass balance equation and the second-order rate derivative. Equation (4) is used to describe the pseudo-second-order kinetic model [
26]:
where
is the rate constant of the pseudo-second-order kinetic model. It can be seen from
Figure 4c and
Table 1 that the correlation coefficient of the pseudo-second-order kinetic model (0.999) is much closer to 1 than that of the pseudo-first-order kinetic model (0.910). In addition, the theoretical equilibrium adsorption capacity (420 mg/g) calculated by the pseudo-second-order kinetic model is close to the actual equilibrium adsorption capacity (399.6 mg/g) and the △q value of the pseudo-second-order kinetic model is smaller than that of the pseudo-first-order kinetic model. Therefore, the pseudo-second-order kinetic model described the adsorption process and the whole process was chemsorption.
The intraparticle diffusion model can further explain the adsorption process. Equation (5) is used to describe the intraparticle diffusion model [
27]:
where
and C are the constants of the rate and the intraparticle diffusion model, respectively. As can be seen from
Figure 4d and
Table 2, the intraparticle diffusion model is a complex linear relationship that can be divided into three stages. The first stage was a rapid adsorption process. This stage was mainly the diffusion of gold ions from the solution to the surface of the adsorbent. The second stage was a slow adsorption process. Gold ions diffused from the surface of the adsorbent to the interior of the adsorbent. At the last stage, there was no significant change in the amount of adsorption. At this stage, the gold ions diffused slowly and the adsorption sites had reached saturation.
3.4. Effect of Initial Concentration
Isothermal adsorption experiments are very important to study the adsorption mechanism. 10 mg TP-AFC was added to 20 mL gold solution with different concentrations (285 mg/L, 380 mg/L, 475 mg/L, 570 mg/L 665 mg/L and 760 mg/L), respectively. It can be seen from
Figure 5a, the adsorption capacity of gold ions increased with the increasing of initial concentration. A high concentration of gold solution contributed to the binding of the adsorption site to the gold ions. The maximal adsorption capacity of TP-AFC for gold ions is 881 mg/g. The adsorption test of polyaniline was also carried out under the same conditions.
Figure 5a also shows that the maximal adsorption capacity of polyaniline for gold ions is 599 mg/g, which is lower than that of TP-AFC.
In order to further study the adsorbing mechanism, three isothermal models were used to describe the adsorption process, including Langmuir, Freundlich and Temkin. Langmuir model describes single layer adsorption with no lateral effects or spatial barriers. Langmuir model can be expressed by Equation (6) [
28]:
where
and
represent the equilibrium adsorption capacity and the remaining concentration, respectively.
is the constant of Langmuir model and
is the maximum theoretical adsorption capacity.
The Freundlich model describes that the adsorption process occurs on a heterogeneous surface. The Freundlich model can be expressed by Equation (7) [
29]:
where
represents the Freundlich constant and
n1 is the adsorption capacity index.
The Temkin model describes that the adsorption heat continually decreases as the adsorbent and adsorbate interact in different adsorbent layers. This model is based on chemisorptions. It can be expressed by Equation (8) [
30]:
where
and
is the constant of the Temkin model. R and T are the constant of universal gas and temperature in Kelvin, respectively.
Figure 5 b–d is the fitting curves of the three models. The relevant parameters of the models are listed in
Table 3. The correlation constant (1/n) in the Freundlich model is in the range of 0 to 1, indicating that adsorption is advantageous. The Temkin model isotherm provided additional information on the adsorbent–adsorbate binding interaction. The adsorption heat from the Temkin model indicated a strong interaction between the reactive group and the Au(III) ion. The correlation coefficient is R
2L>R
2T>R
2F. At the same time, the theoretical maximum adsorption capacity was 883.05 mg/g, which is close to the actual adsorption capacity (881mg/g). △q value of Langmuir (2.01mg/g) is smaller than that of Freundlich (275.77mg/g). Therefore, the Langmuir model well described the adsorption process.
The separation factor K
s can be obtained from the Langmuir model. The K
s value can be used to judge the superiority of the adsorption process. When K
s = 1, the adsorption is reversible. When 0 < K
s < 1, adsorption is advantageous and linear. When K
s > 1, adsorption is disadvantageous. The value of K
s can be expressed by Equation (9):
Table 4 shows that the K
s values of each Au(III) initial concentration were between 0.0015 to 0.004, indicating that the adsorption process was favorable.
In order to study the difference between TP-AFC and other adsorbents, it was compared with various adsorbents, including adsorption capacity and pH. As shown in
Table 5, TP-AFC exhibits a higher adsorption capacity.
3.7. Application of TP-AFC in Practical Wastewater
The separation capacity of the adsorbent was tested by laboratory wastewater. The wastewater was firstly adjusted to pH 4 and ICP-OES was used to measure the metal ion concentration in wastewater. Then, 10 mg TP-AFC was added to 20 ml wastewater and oscillated for 24 h, respectively. After centrifugation, the residual concentration of the solution was measured (
Figure 7). It can be seen that TP-AFC has higher selectivity for gold ions against the interference of various metal ions. The separation capacity of polyaniline was also tested according to the same procedure. However, polyaniline adsorbed not only gold ion but also cadmium and arsenic ions.
Table 8 showed the related parameters of each metal ion on TP-AFC. The distribution coefficient (K
Q) and selectivity coefficient (K) can be expressed by Equations (10) and (11). The experiment results showed that TP-AFC has a good prospect in practical application.
3.8. Adsorption Mechanism
The excellent absorption capacity of TP-AFC for gold ion is mainly attributed to the strong interaction between phosphorus-containing functional groups and gold ions. In order to understand the mechanism of gold adsorption by TP-AFC, TP-AFC was characterized by XPS and SEM before and after adsorption. As shown in
Figure 8a, the peak of Au4f appeared after adsorption, indicating that gold was absorbed by TP-AFC. As shown in
Figure 8b, XPS of gold showed two peaks at 84.1 and 87.59 eV. In addition, XPS of P can be divided into two peaks at 132.78 and 133.71 eV before adsorption (
Figure 8c). The peaks shifted to 131.3 and 133.77 eV after adsorption (
Figure 8d), indicating that P played an important role in the adsorption process. SEM images of TP-AFC before and after adsorption are shown in
Figure 9. It can be clearly seen that the gold is distributed throughout on the adsorbent after adsorption, but the morphology of the adsorbent does not change. In summary, combined with Zeta potential, XPS and SEM, the main mechanism of TP-AFC adsorption of gold is ion exchange and chelation.

 and
and 


