3.1. Polymerization of Aniline
Chemical oxidative polymerization is a traditional technique used for the preparation of PANI in bulk with a large consumption of chemicals and a long process time [
26,
27]. The polymerization is usually performed by the slow addition of reactants one after another under vigorous stirring. The obtained product is often highly agglomerated and irregularly shaped because of heterogeneous nucleation. The key to obtain PANI nanofibers is to overcome the heterogeneous nucleation [
28,
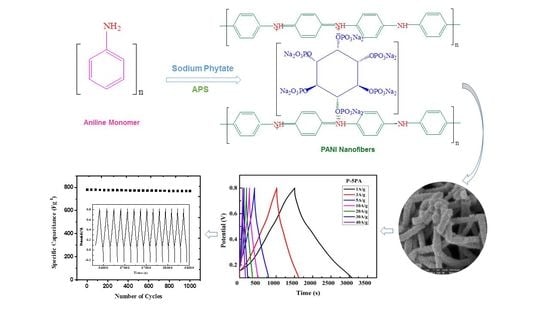
29]. In the present study, we rapidly mixed aniline and sodium phytate solution with the oxidant at room temperature (
Scheme 1). This allowed an even distribution of monomer and oxidant molecules before polymerization. When the polymerization started, the oxidant rapidly polymerized the monomers in less than 15 min and induced the formation of nanofibers by overcoming the heterogeneous nucleation. This led to the consumption of all the oxidant, dopant, and monomer molecules to form the respective PANI in remarkably high yield (98%) in the optimized sample P-5PA by a reproducible, inexpensive, and scalable method. To the best of our knowledge there is no report on the synthesis of PANI that is as green, efficient, rapid, and simple.
The PANI samples were dispersible in DMSO, DMF, NMP, THF, ethanol etc., which permitted the use of facile and cost-effective techniques to process this synthesized nanostructure material into a variety of utilizable forms like films and composites. This makes the protocol to a time- and cost effective, less toxic, and efficient strategy for improvement in PANI processability compared to prior work (see
Supplementary Materials,
Table S1) [
30,
31].
3.2. Structural and Morphology Characterization
Figure 1 shows the different morphologies of the PANI with variant sodium phytate dopant amounts. For P-0.5PA and P-1PA (
Figure 1a,b) irregular agglomerated short fibrous growth patterns were found. With increasing amount of dopant, e.g., 3% for P-3PA (
Figure 1c), the morphology changed to dense interconnected, branched, and twisted fibers with a diameter of 91 to 162 nm. While this structure was already more fiber-like, it was still not feasible for good energy storage applications as the presence of branched structures and twists hinder the diffusion of electrolyte into the polymer matrix [
32,
33].
In contrast, for P-5PA long and uniform fiber interconnected structures with rough and porous morphology were observed (
Figure 1d). The fibers had diameters of 69 to 129 nm and their structure revealed no random agglomerates as within the other samples. Further increase in dopant amount to 7% (P-7PA) resulted in the formation of thicker and shortened fibers with the appearance of random aggregates, with a diameter range of 182 to 276 nm (
Figure 1e). Breakage of long fibers into small pieces was clearly visible with increase in diameter. This in turn was expected to reduce the electrical properties of the material [
34]. Those short fibers completely agglomerate when the dopant amount is further increased to 10% (P-10PA) (
Figure 1f).
The differences in morphology relate directly to the surface area value, pore size distribution range and volume of the pores. The surface area of the P-0.5PA, P-5PA and P-10PA samples were calculated by measuring nitrogen absorption and desorption isotherms using Brunauer–Emmett–Teller (BET) analysis (see
Supplementary Materials,
Figures S2–S4). The P-5PA exhibited a significantly higher surface area value (230.5 m
2g
−1) than the P-0.5PA (200.4 m
2g
−1) and the P-10PA (101.5 m
2g
−1). Furthermore, the pore size distributions and volumes were measured by the Barrett–Joyner–Halenda (BJH) method. The pore size distribution of the samples were similar, ranging from 15.0–19.5 nm while the volume followed the same trend as with the surface area with 0.032 cm
3g
−1 for P-0.5PA, 0.046 cm
3g
−1 for P-5PA and 0.011 cm
3g
−1 for P-10PA, respectively.
The results revealed that the reaction parameters of P-5PA with 5% sodium phytate were most desirable to achieve fibrous and porous nanostructure networks with distinct connectivity, particle size distribution and pore volume. As well-known, such interconnected PANI nanofiber structures can be more beneficial for electrical and capacitive properties than wires and particles when used as electrode material for supercapacitors. The large open pore channels within the structure [
35], as well as a large fibrous and rough surface area favor ion transport and charge transfer reactions, which are beneficial for good electrocatalytic properties [
28,
36,
37].
The spectra revealed that all PANI samples contain C, O, N, Na and P. EDX-mapping also established a homogeneous distribution of the elements. This evidently proved the successful synthesis of PANI with effective integration of dopant into the polymer backbone. Of particular importance were the Na and P contents since they correlate directly with the dopant amount. With increasing dopant/aniline ratios in synthesis a steady increase in Na and P contents up to the P-5PA sample could be observed (
Table 1). Further increase in ratios resulted in a significant decrease in dopant assimilation during synthesis. Especially the high content in Phosphor of the sample P-5PA is worthwhile, because it reduces the agglomeration of the polymer chains and barrier height, creates a deep interaction for intra- and inter-molecular charge delocalization and is expected to enhance the electrical conductivity [
38].
Figure 2 depicts the FT-IR spectra of sodium phytate and the synthesized PANI samples. The FT-IR spectrum of sodium phytate displays basic absorption peaks at 1193 and 1087 cm
−1 that can be assigned to the stretching vibration of P=O and P-O–C, respectively. The peak at 554 cm
−1 corresponds to O-Na interaction, while the one at 2402 cm
−1 is due to O–P=O vibrations. The peaks of –OH group of present water molecules in the sodium phytate salt appear at 1642 and 1797 cm
−1 [
39].
In the FT-IR spectra of the PANI samples, the characteristic peaks at 1685 and 1558 cm
−1 are attributed to the vibrations of C═C in the quinoid and benzenoid rings, respectively. The typical peak at 1487 cm
−1 is assigned to C–N stretching vibrations in the neighborhood of the quinoid ring [
40]. The absorption at 1284 cm
−1 is attributed to the C–N bonds associated with the benzenoid ring. The absorption at 1104 cm
−1 is due to the C═N bond associated with the quinoid ring. Those peaks are characteristic for PANI in its emeraldine form where the doping primarily occurs at the quinoid ring segments. Additionally, the broadened band at 1104 cm
−1 indicates an electron delocalization in the PANI backbone, which guarantees a high conductivity [
41,
42,
43]. Furthermore, the peaks at 820 and 554 cm
−1 are associated with P–O–C and O-Na stretching vibrations of stray free phosphonates of the phytic acid sodium salt [
41,
44].
Further validation of the PANI structure was employed by UV-vis analysis (
Figure 3). The spectra revealed three major absorbance peaks. The first peak at 345 nm (λ
1) was attributed to the π-π* transition by excitation of nitrogen of the benzenoid rings. The other two peaks at 424 (λ
2) nm and 787 nm (λ
3) belong to polaron-π* transition and π-polaron transition, respectively, indicating that the samples are in the conductive emeraldine form [
45]. The transition band at 787 nm is strongly broadened, which is certainly caused by interband charge transfer from benzenoid to quinoid rings of conjugated PANI. It is well-known that λ
3 exhibits a significant red shift with increase in dopant concentration, consequently, the stronger the absorbance of this band the more dopant is incorporated and the larger is the conjugation length and ordered structure of the PANI. This can be clearly seen for P-1PA to P-5PA. As in accordance with SEM and EDX data, P-7PA and P-10PA revealed blue-shifts compared to P-5PA, which relate to less amounts of incorporated dopant and shorter chain length.
3.3. Electrochemical Properties
To confirm that the PANI samples have the potential as electrode material for supercapacitors, the electrical and electrochemical properties were investigated by conductivity measurements, cyclic voltammetry (CV), galvanostatic charge/discharge (GCD), and electrochemical impedance spectroscopy (EIS).
The electrical (DC) conductivity of the PANI samples was determined from conductance measurements multiplied by the geometrical factor. Before the measurement, the respective powders of the PANI samples were pressed into small pallets (13 mm Ø, 5 mm thickness) using a hydraulic press with 15 tons of load. The four-probe method is ideal for those kinds of samples, because it eliminates the influence of leads resistance or contact resistance, providing a better accuracy for the measuring conductance [
46]. The conductivity values at 25 °C of the PANI samples are shown in
Table 2.
The results illustrate an increase in conductivity with increasing amount of dopant content up to P-5PA with remarkable 10 S cm
−1. Then, for P-7PA and P-10PA the conductivity decreases significantly. The differences in conductivity are in accordance with the SEM, BET and EDX results as SEM results revealed long and uniform fiber interconnected structures with rough and porous morphology for P-5PA. The same sample exhibited large surface area and small pore volume during BET analysis while highly assimilated dopant content of Na and P was also observed for sample P-5PA suggesting that uniform interconnected fibrous and porous nature with large surface area and high dopant contents favors high conductivity. Moreover, the conductivities of the presented sodium phytate doped PANI samples are a magnitude higher than those using phytic acid solution (0.11 S cm
−1 [
37], 0.28 S cm
−1) [
38], or phytic acid/hydrochloric acid mixtures (0.48–0.61 S cm
−1) [
47], during synthesis as well as with other dopants [
48,
49,
50].
3.3.1. Cyclic Voltammetry (CV)
To investigate the dopant influence on electrocatalytic efficiency and capacitive energy storage behaviors of the PANI salts, the electrochemical properties of the synthesized samples (P-0.5PA, P-1PA, P-3PA, P-5PA, P-7PA and P-10PA) as electrode in SCs were tested by CV (
Figure 4). The curves were also used to calculate the specific capacitances of the electrode materials at different scan rates by using equation [
24]. The compared CV profile of the PANI electrodes (P-0.5PA, P-1PA, P-3PA, P-5PA, P-7PA and P-10PA) were recorded at a lower scan rate (20 mVs
−1) and are depicted in
Figure 4a. All the PANI salts illustrate a quasi-rectangular shaped CV curve with two pairs of redox peaks that are attributable to the conversion of leucomeraldine to emeraldine form and further to pernigraniline [
51]. The shape is typical for PANI and consists of a combination of double layer capacitance and pseudo capacitance with its two redox pairs [
52]. It can be seen that among different samples of PANI salts, P-5PA exhibits a significantly high current, suggesting its strong interaction with the dopant. Such interaction results in high porosity and rough surface, providing larger electrode/electrolyte interface area for more redox reactions [
53,
54] and provides fast rate of ionic transport and high capacitance [
51]. The specific capacitances calculated from the curves (at low scan rate 20 mVs
−1) are presented in
Table 3 and histogram (
Figure 4b). The obtained results show that P-5PA exhibits a higher value of C
sp (950.0 ± 1.09 Fg
−1) in comparison with P-0.5PA (582.5 ± 2.06Fg
−1), P-1PA (819.8 ± 1.81 Fg
−1), P-3PA (875.0 ± 1.55 Fg
−1), P-7PA (840.0 ± 1.95 Fg
−1) and P-10PA (739.0 ±2.24 Fg
−1).
The samples were further tested by subjecting them to higher scan rate of 300 mVs
−1 and the obtained curves are displayed in
Figure 4c. The specific capacitances are given in table (
Table 3) and histogram (
Figure 4d). It can be observed from the CV curves that the rectangular shape of all the samples are maintained even at higher scan rate which describes its excellent electrochemical performance. Shifting of anodic peaks towards positive potential is obvious because at higher scan rate, there is an enhancement of ohmic resistance which makes diffusion of ions into the inner surface of electrode material difficult and is expected to peak shifting [
55,
56]. Additionally, lower specific capacitance is observed for all the samples at higher scan rate. P-5PA shows the highest specific capacitance of 517.5 ±1.52 Fg
−1 relative to all other samples i.e., P-0.5PA (300.5 ± 2.38 Fg
−1), P-1PA (378.7 ± 2.10 Fg
−1) P-3PA (454.2 ± 1.62 Fg
−1), P-7PA (424.2 ± 1.96 Fg
−1) and P-10PA (372.7 ± 2.05 Fg
−1).
From the tabulated values, it can be observed that the capacitance is inversely related to the scan rate as all the samples show high capacitance values at low scan rate than at a high scan rate. It is thought that low scan rate can permit electrolyte to easily enter the pores of the active material and interact with the electrode’s inner surface and lead to large storage of charge on the electrode surface, hence provide high capacitance. Whereas at higher scan rate, an ineffective interaction occurs between the electrode and electrolyte due to diffusion limitation, which results in less storage of charge at the surface of electrode, hence a low capacitance is observed [
54].
The above observations determine that P-5PA exhibits the highest specific capacitance both at lower and higher scan rates. The superior capacitive performance attained by our synthesized material endorses the distinctive advantages of the rough, porous interconnected nanostructures and sodium phytate crosslinked PANI material.
The capacitance behavior of P-5PA electrode was further explored by recording the CV curves at a wide range of scan rates (20, 50, 100, 150, 200, 250 and 300 mVs
−1). The cyclic voltammograms of P-5PA are shown in
Figure 5a and the calculated capacitance values are presented in tabulated form (
Table 4). It is notable that P-5PA shows excellent electrochemical behavior even in a wide range of scan rates. The CV curves of the P-5PA electrode are quite stable and reflect no aberration even at high scan rates suggesting that the synthesized material is highly stable with respect to charge transfer [
28,
51]. Furthermore, the specific capacitances of the electrode material decrease with increase in scan rates which is consistent with the above discussed results. The redox processes that take place on the electrode are either kinetically controlled or diffusion controlled. This is proven by plotting the square root of the scan rage against the peak currents of the anodic and cathodic process of the redox transition (
Figure 5b). The linear relationship implies that the redox reaction is diffusion controlled within the range of 20–300 mVs
−1, suggesting the good rate capability of the electrode [
57].
The behavior of material at different scan rates is also important for observation of its high-power characteristics which is also an important property of a material for its successful application in different technologies involving SCs. The increase in current densities with scanning rates illustrated the excellent stability, reversibility, and quick response to redox processes [
55]. These outcomes publicized a high-power delivery of the PANI materials as electroactive electrode materials in SCs applications. The enhancement in the electrochemical properties originates from the highly percolative electron conduction pathway and is expected due to our ultra-fast synthetic route by using sodium phytate as novel dopant.
3.3.2. Galvanostatic Charge/Discharge (GCD)
Due to comparatively high specific capacitance both at low and high scan rates, the possibility of the P-5PA electrode as the potential application for capacitors is higher than others. Therefore, the P-5PA electrode was further subjected to the GCD measurement for the exploration of its capacitive behavior in a three-electrode system.
Figure 6a illustrates GCD curves of P-5PA measured at a wide range of current densities (1 Ag
−1 to 40 Ag
−1). All the GCD curves of the PANI salt showed nearly symmetric and equilateral triangular shapes, which are characteristic of an excellent capacitance and high reversibility of PANI salts during the charging/discharging process [
58]. The deviation of discharge curves from a linear shape is an evidence of pseudo capacitance behavior due to the quick response of redox processes [
45,
59]. The specific capacitances from the GCD curves were assessed by using the following equation [
25] and are illustrated in the
Table 5 and
Figure 6b.
The results indicate that at a low current density of 1 Ag
−1, the P-5PA electrode shows a maximum value 832.5 ±1.40 F g
−1 and this remains 528.0 ±1.36 F g
−1 when the current density was increased to 40 Ag
−1. In this wide range of current densities, this electrode material generated an excellent rate performance of 67.6% of its initial capacitance retention. This shows a profound distinction to formerly stated PANI-based electrodes, where 25–40% losses in capacitance value was observed at a current density of 1-5 Ag
−1 [
60,
61]. This high performance could be attributed to the facile ionic and electronic transport emanating from the conductive network of the prepared PANI salt. The specific capacitance of P-5PA electrode is found to be much better than the values as reported for other PANI and PANI based materials for SCs mentioned in (see
Supplementary Materials,
Table S2) [
15,
54,
62,
63,
64].
Annotations of the above findings exposed that high capacitance values at low current density of GCD can be attributed due to the sufficient diffusion of counter-anions into and out of PANI during the process of charging/discharging at the lower current density while higher current density contributes to the increase in the ohmic resistance which results in slow diffusion of ions by resisting the electrolyte ion to penetrate the inner surface of active materials [
65]. These findings are similar to that observed in CV analysis.
The excellent capacitive performance of the P-5PA electrode can mainly be attributed to the synergistic effect between dopant and PANI backbone in the matrix, which leads to the formation of conductive, rough, and porous nanostructure. The sodium phytate anchored PANI surface can effectively accumulate protons from the electrolyte and also facilitates the transportation of those protons into the inner surface of the electrode by decreasing ion diffusion path even at higher current density. From these finding, we can say that our material has the potential for application in electrochemical SCs.
3.3.3. Cycling Stability
Cycling stability is also a key factor for the operational SCs. SCs based on CPs often experienced limited cyclability because of shrinking and swelling of electroactive polymers during its charging or discharging operation [
66]. The cycling performance of P-5PA showed a capacitance retention of 95.3% over 1000 cycles at a high current density of 40 Ag
−1 (
Figure 6c,d). According to the reported literature, this retention is superior to the SCs based on PANI (typically 60∼85% retention for 1000 cycles) [
58,
67]. The achievement of the high cycling performance for our electrode material could be accredited to the porous and cross-linked nanofibers morphology of sodium phytate doped PANI that can compensate the shrinking and swelling problems of the polymer network during intensive cycling processes.
3.3.4. Electrochemical Impedance Spectroscopy (EIS)
To evaluate the interfacial charge transfer process at electrode/electrolyte interface, the P-5PA electrode was subjected to EIS analysis and the corresponding Nyquist plots are portrayed in
Figure 7 at various potentials within 0.1–10
5 Hz frequency range. Each spectrum manifests a semicircle that appears in the region of high frequency and an inclined line observed in the region of low frequency. The Surface properties of the electrode are associated with the semicircle as high frequency region involves the electrochemical process at the electrode surface and is responsible for the faradic charge transfer resistance (R
ct) and double layer capacitance. The inclined line in the low frequency region illustrates the transport and diffusion of the ions due to pseudo-capacitance [
45]. The appearance of a vertical line supports the capacitive behavior of the material. If the inclined line is short and close to the
y-axis, it is attributed to the ideal capacitive behavior [
68,
69,
70].
Nyquist plots were further fitted with a proposed equivalent circuit model illustrated in
Figure 7d and parameters are given in
Table 6. The proposed equivalent model includes the solution resistance R
s, the charge transfer resistance R
ct, a constant-phase element CPE1 to describe the double-layer capacitance at the electrode/electrolyte interface, and a second constant phase element CPE2 to describe the pseudo-capacitance of the PANI material [
45]. A decreasing trend of R
ct is observed from 7.67 Ω at 0.4 V to 7.44 Ω at 0.6 V followed by an increase in value of R
ct to 7.49 Ω at 0.8 V. Similar trend can be found for the pseudo-capacitance described by CPE2, particularly in the an increase of the exponent n up to 0.77 at 0.6 V, which indicates higher capacitive behavior. At 0.8 V this value decreases again to n = 0.71. It is reported that on increasing potential up to a certain limit, an increase in pseudo-capacitive behavior of the electrode material is observed [
25,
71]. Same observations can be seen in the present work, when we increase the potential from 0.4 to 0.6 V, the plots show dominant pseudo-capacitive behavior but after 0.6 V, the decrease in pseudo-capacitive behavior is observed at 0.8 V. This demonstrates that a synthesized PANI nanofiber by an ultra-fast and green route is a significant and simple way to improve electrochemical properties. The sodium phytate doped PANI nanofibers may have potential applications in energy storage and other electrochemical devices.


