Lignin Based Activated Carbon Using H3PO4 Activation


Abstract
:
1. Introduction
2. Experimental
2.1. Materials
2.2. Preparation of Theoretically Sulfur-Free AHL
2.3. AC Preparation
2.4. Characterizations
2.5. Adsorption Experimentation
3. Results and Discussion
3.1. N2 Adsorption-Desorption of AC Isotherms
3.2. FT-IR Analysis
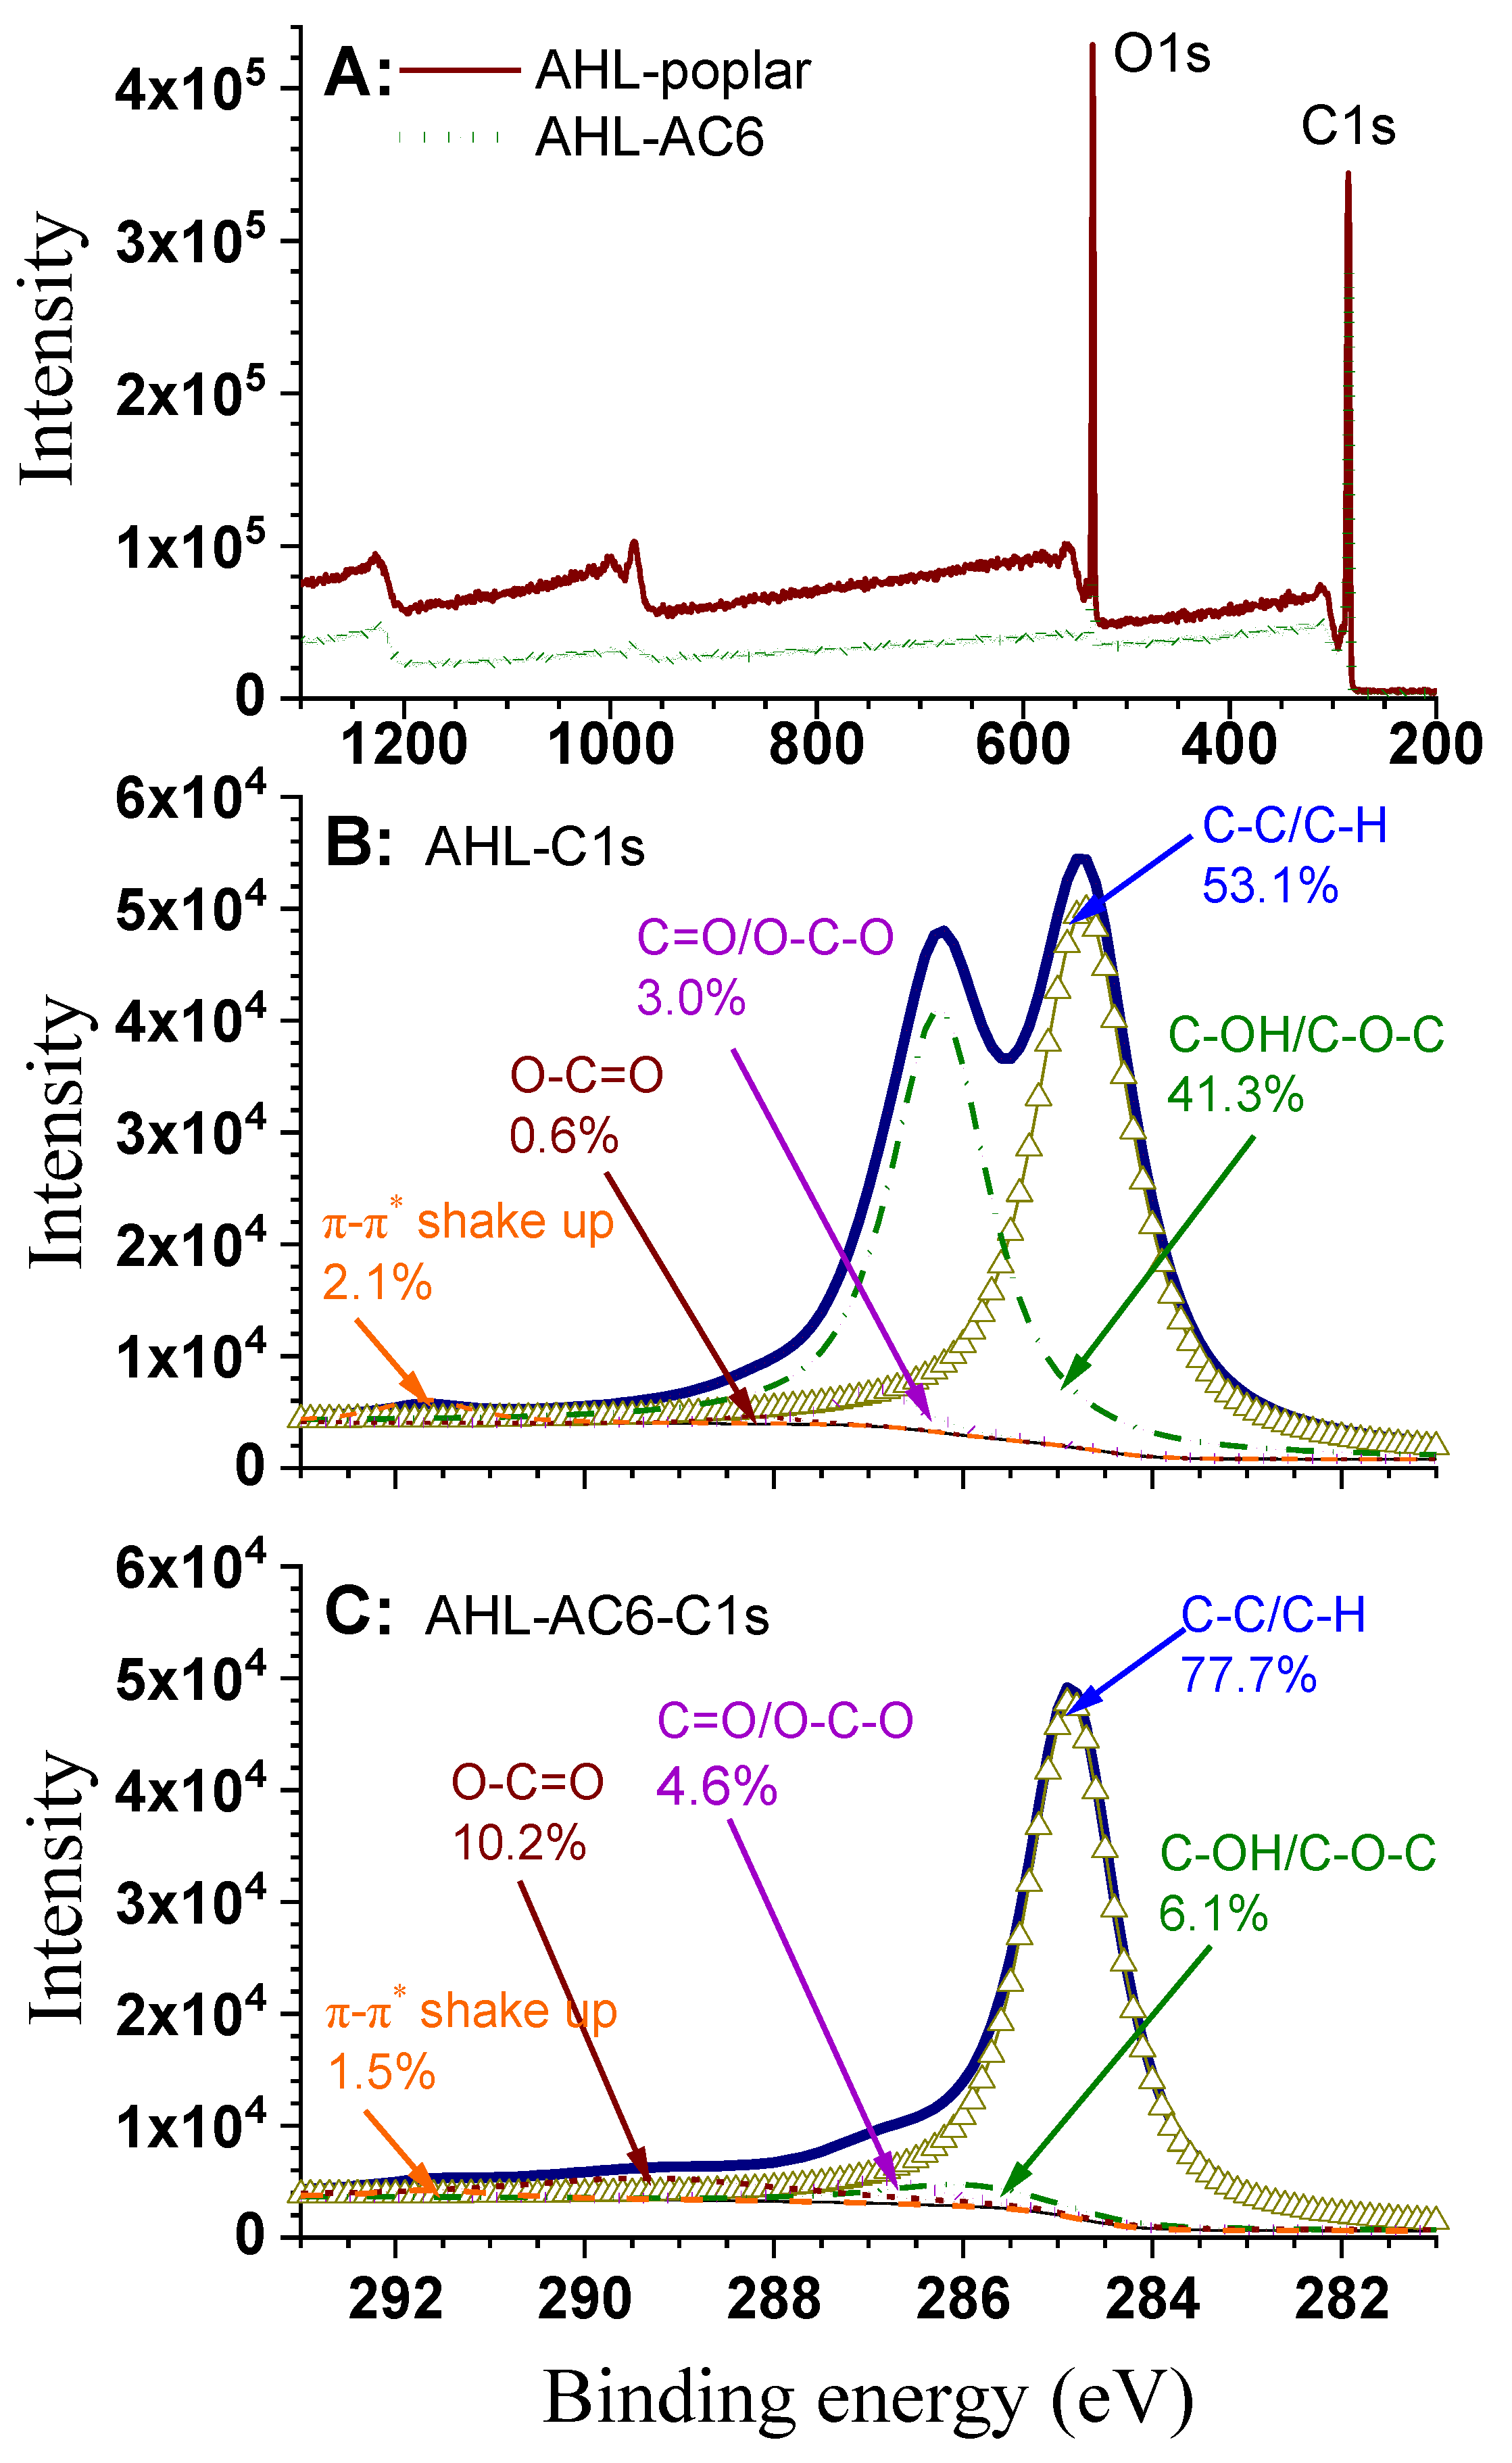
3.3. XPS Analysis
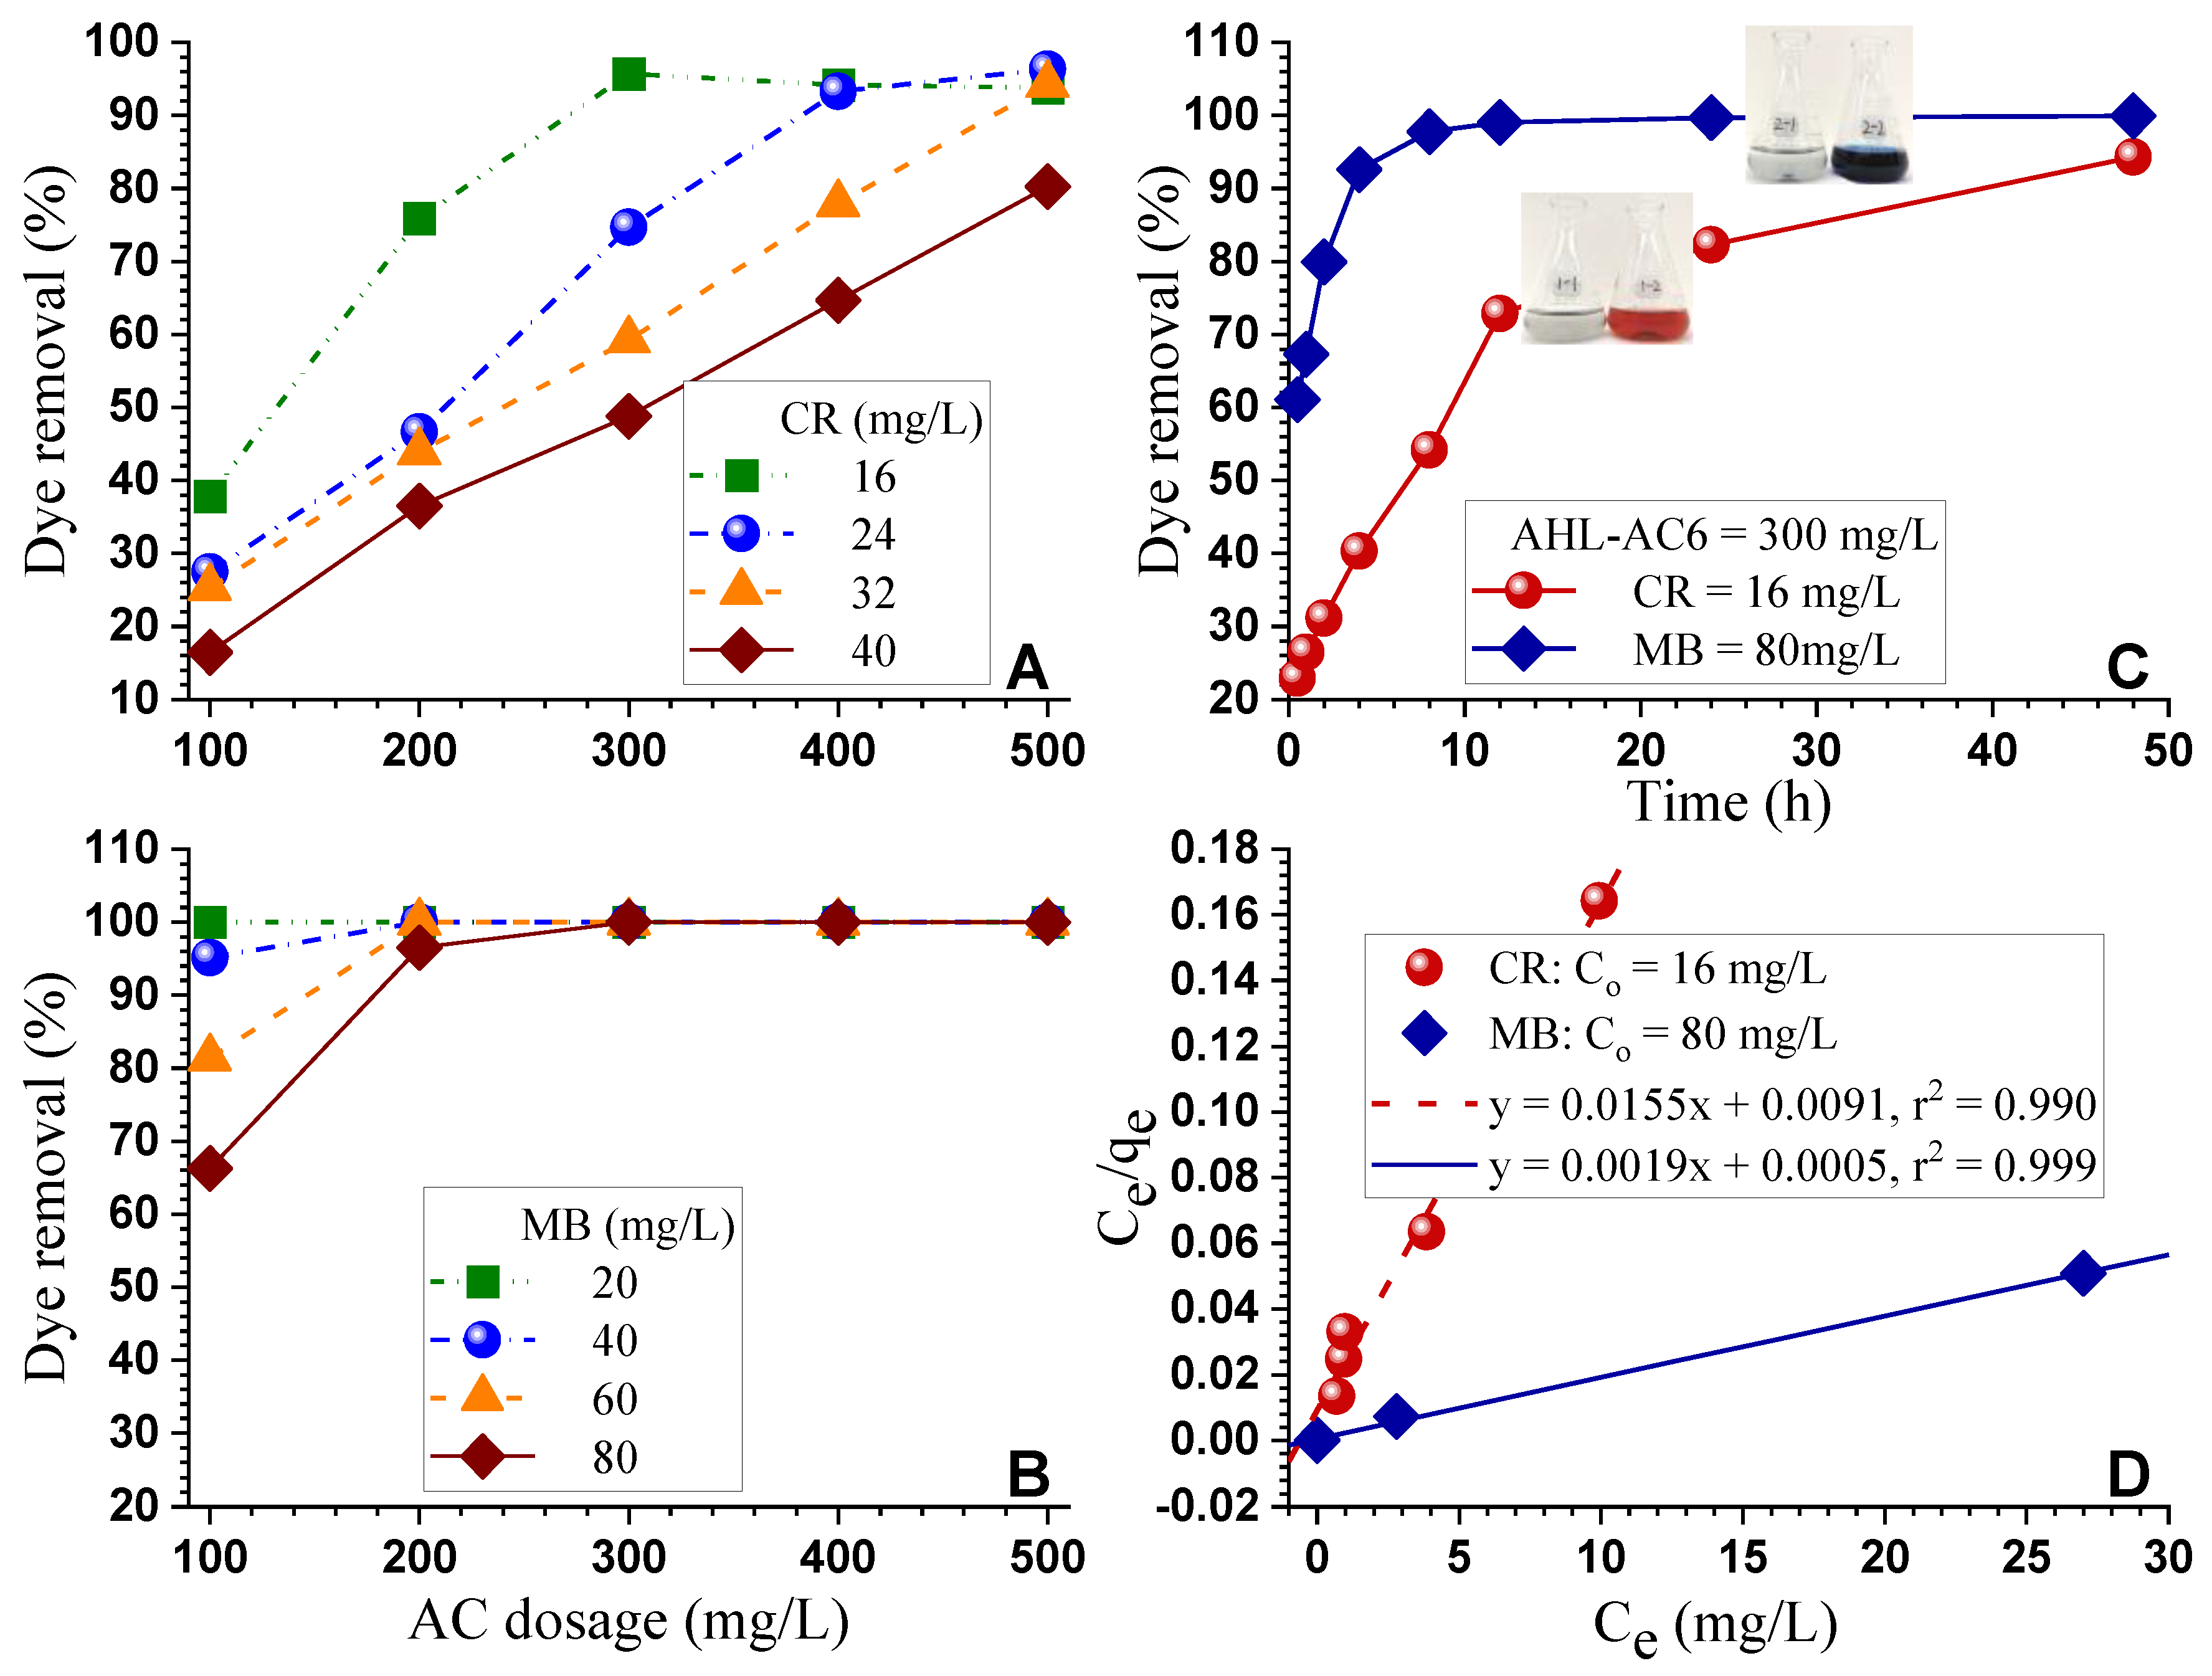
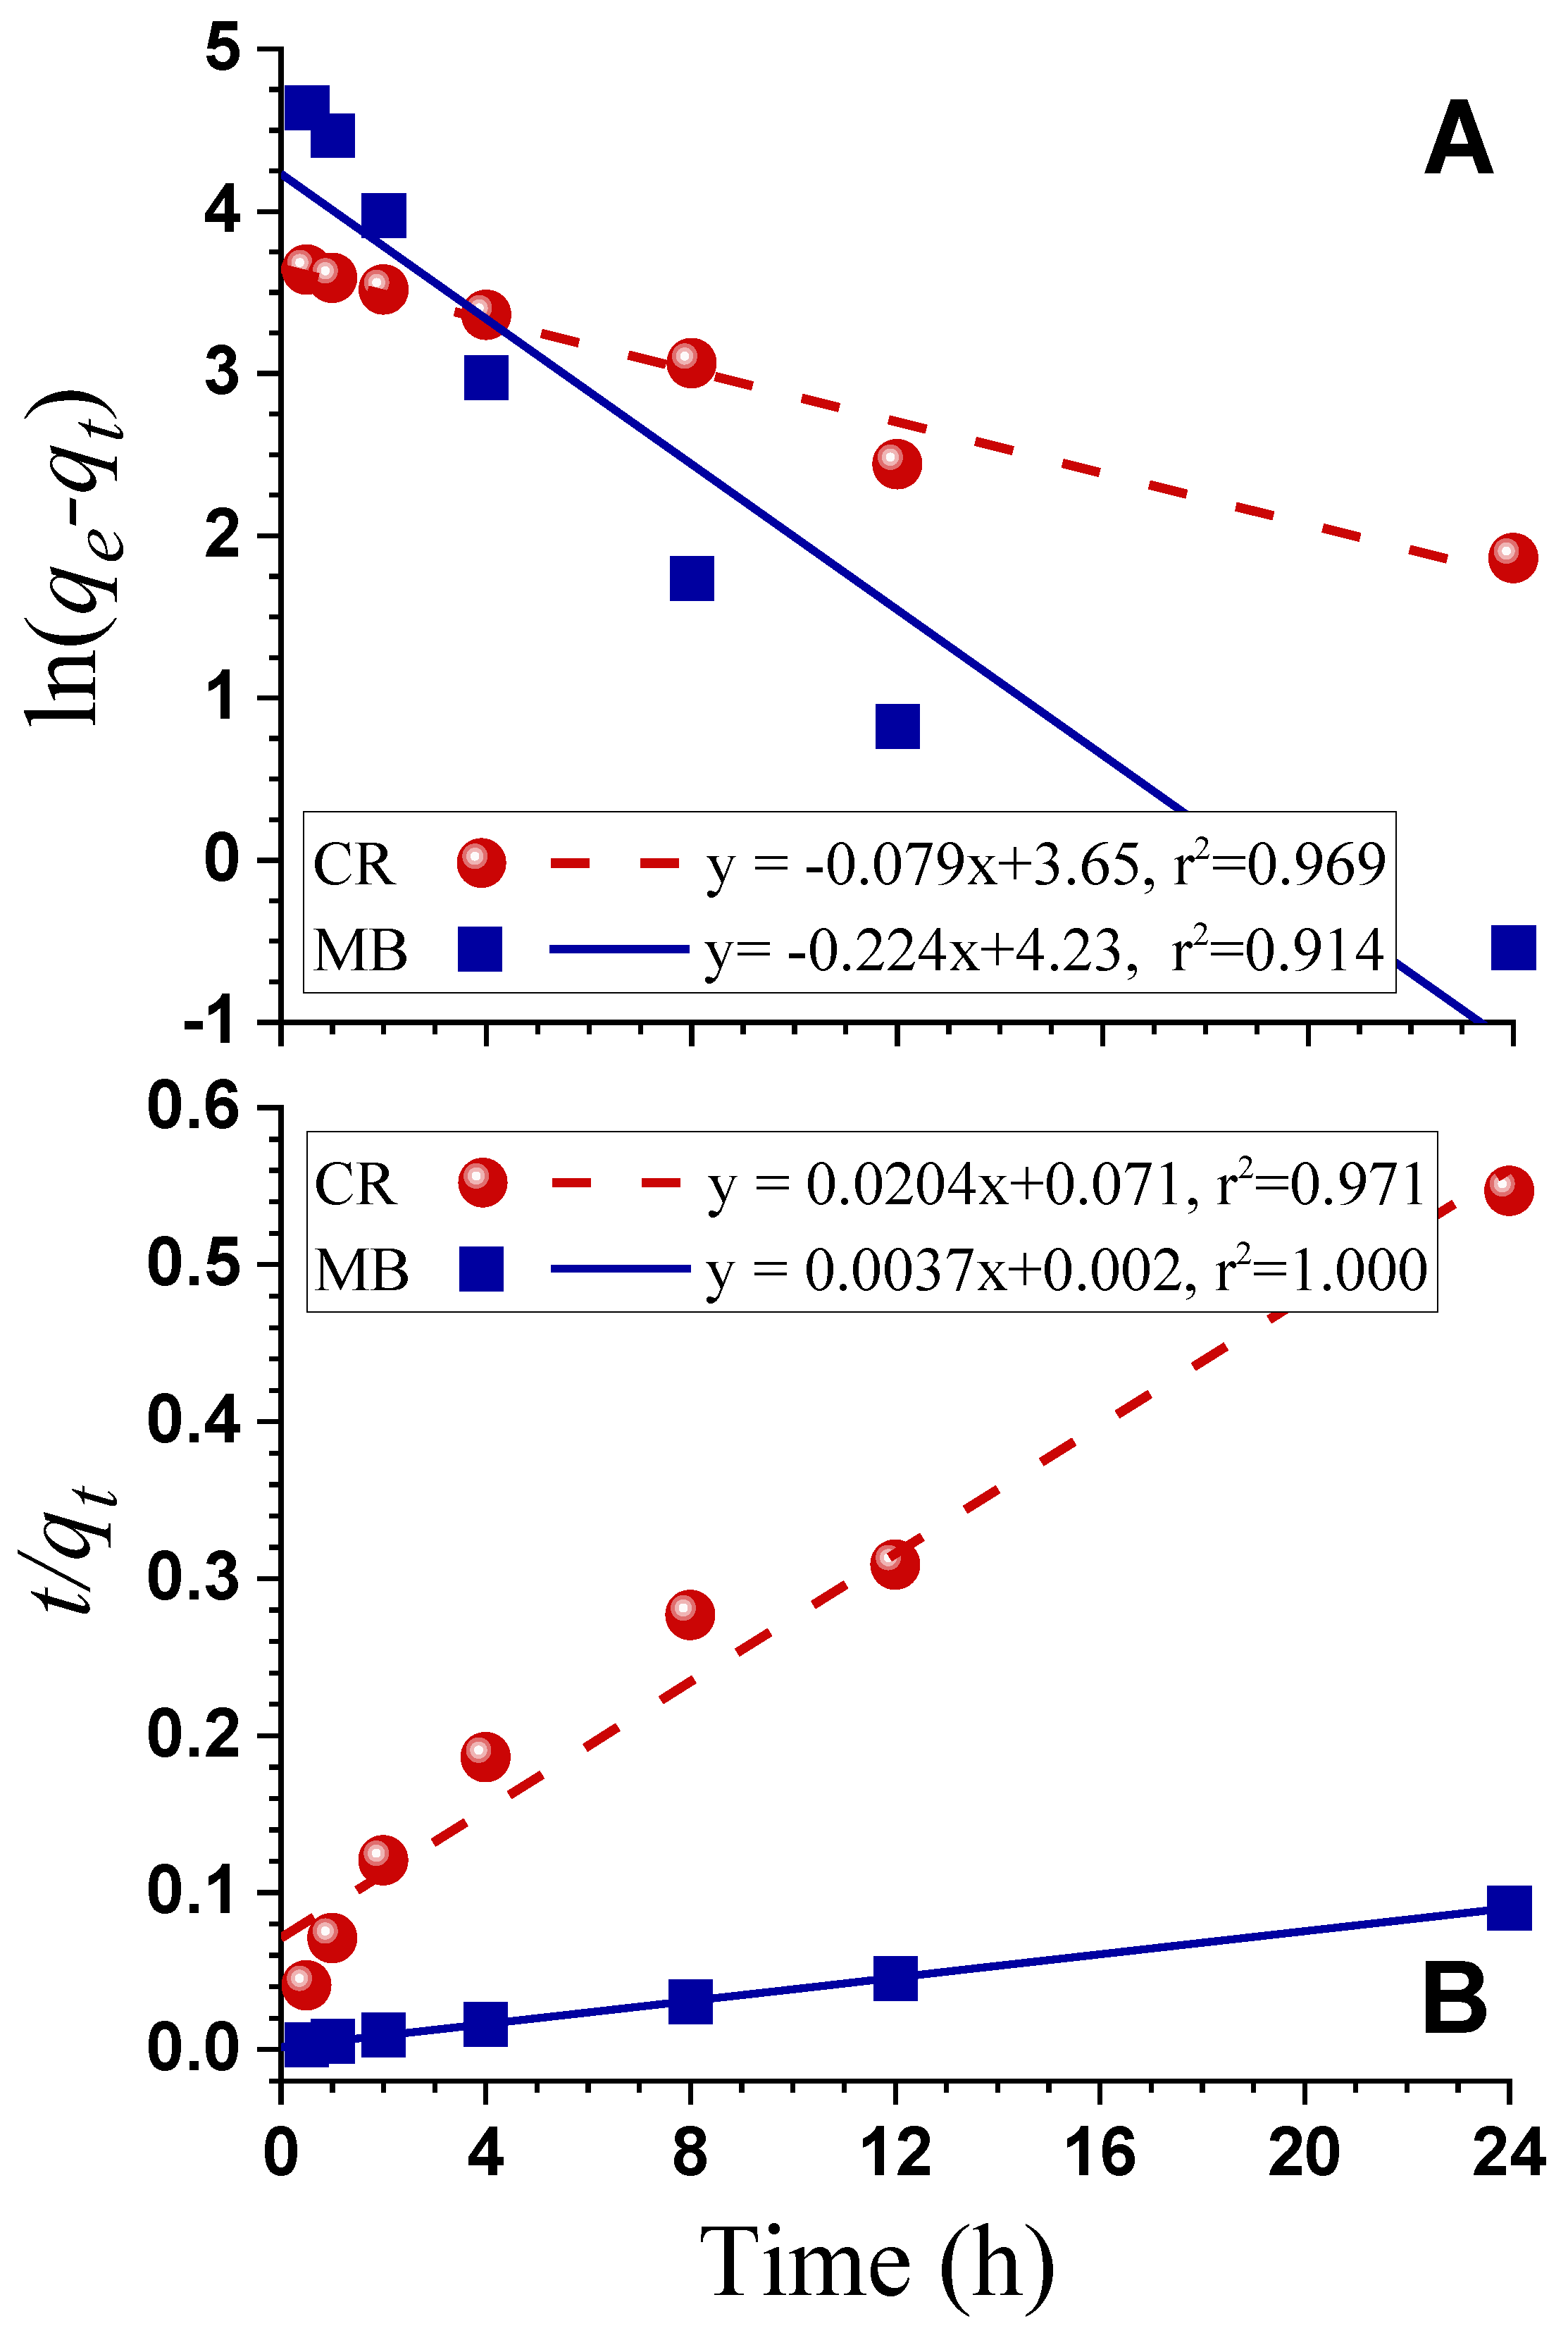
3.4. Dyes Adsorption
4. Conclusions
Supplementary Materials
Author Contributions
Funding
Acknowledgments
Conflicts of Interest
References
- Boerjan, W.; Ralph, J.; Baucher, M. Lignin biosynthesis. Annu. Rev. Plant Biol. 2003, 54, 519–546. [Google Scholar] [CrossRef] [PubMed]
- Zhu, J.Y.; Zhuang, X. Conceptual net energy output for biofuel production from lignocellulosic biomass through biorefining. Prog. Energy Combust. Sci. 2012, 38, 583–598. [Google Scholar] [CrossRef]
- Ragauskas, A.J.; Beckham, G.T.; Biddy, M.J.; Chandra, R.; Chen, F.; Davis, M.F.; Davison, B.H.; Dixon, R.A.; Gilna, P.; Keller, M.; et al. Lignin Valorization: Improving Lignin Processing in the Biorefinery. Science 2014, 344, 1246843. [Google Scholar] [CrossRef] [PubMed]
- Rinaldi, R.; Jastrzebski, R.; Clough, M.T.; Ralph, J.; Kennema, M.; Bruijnincx, P.C.A.; Weckhuysen, B.M. Paving the Way for Lignin Valorisation: Recent Advances in Bioengineering, Biorefining and Catalysis. Angew. Chem. Int. Ed. 2016, 55, 8164–8215. [Google Scholar] [CrossRef] [PubMed] [Green Version]
- Guo, X.; Zhang, S.; Shan, X. Adsorption of metal ions on lignin. J. Hazard. Mater. 2008, 151, 134–142. [Google Scholar] [CrossRef]
- Varma, K.V.R.; Swaminathan, T.; Subrahmanyam, P.V.R. Heavy metal removal with lignin. J. Environ. Sci. Health 1989, A23, 243–265. [Google Scholar] [CrossRef]
- Leatikainen, M. Adsorption of cationic compouds on ground water and on cellulose and lignin surface. J. Colloid Interface Sci 1989, 132, 451–461. [Google Scholar] [CrossRef]
- Carrott, P.J.M.; Carrott, M.R. Lignin- from natural adsorbent to activated carbon: A review. Bioresour. Technol. 2007, 98, 2301–2312. [Google Scholar] [CrossRef]
- Supanchaiyamat, N.; Jetsrisuparb, K.; Knijnenburg, J.T.; Tsang, D.C.W.; Hunt, A.J. Lignin materials for adsorption: Current trend, perspectives and opportunities. Bioresour. Technol. 2019, 272, 570–581. [Google Scholar] [CrossRef]
- Nirmale, T.C.; Kale, B.B.; Varma, A.J. Areview on cellulose and lignin based binders and electrodes: Small steps towards a sustainable lithium ion battery. Int. J. Biol. Macromol. 2017, 103, 1032–1043. [Google Scholar] [CrossRef]
- Yahya, M.A.; Al-Qodah, Z.; Ngah, C.Z. Agricultural bio-waste materials as potential sustainable precursors used for activated carbon production: A review. Renew. Sustain. Energy Rev. 2015, 46, 218–235. [Google Scholar] [CrossRef]
- Rosas, J.M.; Berenguer, R.; Valero-Romero, M.J.; Rodríguez-Mirasol, J.; Cordero, T. Preparation of Different Carbon Materials by Thermochemical Conversion of Lignin. Front. Mater. 2014, 1, 1–17. [Google Scholar] [CrossRef] [Green Version]
- Wang, J.; Kaskel, S. KOH activation of carbon-based materials for energy storage. J. Mater. Chem. 2012, 22, 23710–23725. [Google Scholar] [CrossRef]
- González-García, P. Activated carbon from lignocellulosics precursors: A review of the synthesis methods, characterization techniques and applications. Renew. Sustain. Energy Rev. 2018, 82, 1393–1414. [Google Scholar] [CrossRef]
- Rashidi, N.A.; Yusup, S. A review on recent technological advancement in the activated carbon production from oil palm wastes. Chem. Eng. J. 2017, 314, 277–290. [Google Scholar] [CrossRef]
- Molina-Sabio, M.; Rodríguez-Reinoso, F.; Caturla, F.; Sellés, M. Porosity in granular carbons activated with phosphoric acid. Carbon 1995, 33, 1105–1113. [Google Scholar] [CrossRef]
- Patnukao, P.; Pavasant, P. Activated carbon from Eucalyptus camaldulensis Dehn bark using phosphoric acid activation. Bioresour. Technol. 2008, 99, 8540–8543. [Google Scholar] [CrossRef]
- Arami-Niya, A.; Daud, W.W.; Mjalli, F. Production of Palm Shell-Based Activated Carbon with More Homogeniouse Pore Size Distribution. J. Appl. Sci. 2010, 10, 3361–3366. [Google Scholar] [CrossRef] [Green Version]
- Xu, J.; Chen, L.; Qu, H.; Jiao, Y.; Xie, J.; Xing, G. Preparation and characterization of activated carbon from reedy grass leaves by chemical activation with H3PO4. Appl. Surf. Sci. 2014, 320, 674–680. [Google Scholar] [CrossRef]
- Zuo, S.; Yang, J.; Liu, J.; Cai, X. Significance of the carbonization of volatile pyrolytic products on the properties of activated carbons from phosphoric acid activation of lignocellulosic material. Fuel Process. Technol. 2009, 90, 994–1001. [Google Scholar] [CrossRef]
- Li, S.; Han, K.; Li, J.; Li, M.; Lu, C. Preparation and characterization of super activated carbon produced from gulfweed by KOH activation. Microporous Mesoporous Mater. 2017, 243, 291–300. [Google Scholar] [CrossRef]
- Faraji, S.; Ani, F.N. The development supercapacitor from activated carbon by electroless plating—A review. Renew. Sustain. Energy Rev. 2015, 42, 823–834. [Google Scholar] [CrossRef]
- Chen, L.; Dou, J.; Ma, Q.; Li, N.; Wu, R.; Bian, H.; Yelle, D.; Vuorinen, T.; Fu, S.; Pan, X.; et al. Rapid and near-complete dissolution of wood lignin at ≤80 °C by a recyclable acid hydrotrope. Sci. Adv. 2017, 3, e1701735. [Google Scholar] [CrossRef] [PubMed] [Green Version]
- Cai, C.; Hirth, K.; Gleisner, R.; Lou, H.; Qiu, X.; Zhu, J. Maleic acid as a dicarboxylic acid hydrotrope for sustainable fractionation of wood at atmospheric pressure and ≤100 °C. mode and utility of lignin esterification. Green Chem. 2020, 22, 1605–1617. [Google Scholar] [CrossRef]
- Cai, C.; Li, J.; Hirth, K.; Huber, G.W.; Lou, H.; Zhu, J.Y. Comparison of Two Acid Hydrotropes for Sustainable Fractionation of Birch Wood. ChemSusChem 2020, 13, 4649–4659. [Google Scholar] [CrossRef] [PubMed]
- Zhu, J.; Chen, L.; Gleisner, R. Co-production of bioethanol and furfural from poplar wood via low temperature (≤90 °C) acid hydrotropic fractionation (AHF). Fuel 2019, 254, 115572. [Google Scholar] [CrossRef]
- Lu, X.; Jiang, J.; Sun, K.; Zhu, G.; Lin, G. Enhancement of Pb2+ removal by activating carbon spheres/activated carbon composite material with H2O vapor. Colloids Surf. A Physicochem. Eng. Asp. 2016, 506, 637–645. [Google Scholar] [CrossRef]
- Mussatto, S.I.; Fernandes, M.; Rocha, G.J.; Órfão, J.J.; Teixeira, J.A.; Roberto, I.C. Production, characterization and application of activated carbon from Brewer’s spent grain lignin. Bioresour. Technol. 2010, 101, 2450–2457. [Google Scholar] [CrossRef] [Green Version]
- Myglovets, M.; Poddubnaya, O.I.; Sevastyanova, O.; Lindström, M.E.; Gawdzik, B.; Sobiesiak, M.; Tsyba, M.M.; Sapsay, V.I.; Klymchuk, D.O.; Puziy, A.M. Preparation of carbon adsorbents from lignosulfonate by phosphoric acid activation for the adsorption of metal ions. Carbon 2014, 80, 771–783. [Google Scholar] [CrossRef]
- Rosas, J.M.; Ruiz-Rosas, R.; Rodríguez-Mirasol, J.; Cordero, T. Kinetic study of the oxidation resistance of phosphorus-containing activated carbons. Carbon 2012, 50, 1523–1537. [Google Scholar] [CrossRef]
- Sanchez-Sanchez, A.; Torné-Fernández, V.; Celzard, A. Kraft lignin as a precursor for microporous activated carbons prepared by impregnation with ortho-phosphoric acid: Synthesis and textural characterisation. Microporous Mesoporous Mater. 2006, 92, 243–250. [Google Scholar] [CrossRef]
- Maldhure, A.V.; Ekhe, J.D. Microwave treated activated carbon from industrial waste lignin for endosulfan adsorption. J. Chem. Technol. Biotechnol. 2011, 86, 1074–1080. [Google Scholar] [CrossRef]
- Gonzalez-Serrano, E.; Cordero, T.; Rodriguez-Mirasol, J.; Cotoruelo, L.; Rodriguez, J. Removal of water pollutants with activated carbons prepared from H3PO4 activation of lignin from kraft black liquors. Water Res. 2004, 38, 3043–3050. [Google Scholar] [CrossRef] [PubMed]
- Cotoruelo, L.M.; Marqués, M.D.; Diaz, F.J.; Rodríguez-Mirasol, J.; Cordero, T.; Rodriguez, J.J. Activated Carbons from Lignin: Their Application in Liquid Phase Adsorption. Sep. Sci. Technol. 2007, 42, 3363–3389. [Google Scholar] [CrossRef]
- Rosas, J.M.; Ruiz-Rosas, R.; Rodríguez-Mirasol, J.; Cordero, T. Kinetic study of SO2 removal over lignin-based activated carbon. Chem. Eng. J. 2017, 307, 707–721. [Google Scholar] [CrossRef]
- Saha, D.; Taylor, B.; Alexander, N.; Joyce, D.F.; Faux, G.I.; Lin, Y.; Shteyn, V.; Orkoulas, G. One-step conversion of agro-wastes to nanoporous carbons: Role in separation of greenhouse gases. Bioresour. Technol. 2018, 256, 232–240. [Google Scholar] [CrossRef]
- Sangchoom, W.; Mokaya, R. Valorization of Lignin Waste: Carbons from Hydrothermal Carbonization of Renewable Lignin as Superior Sorbents for CO2 and Hydrogen Storage. ACS Sustain. Chem. Eng. 2015, 3, 1658–1667. [Google Scholar] [CrossRef]
- Solum, M.; Pugmire, R.; Jagtoyen, M.; Derbyshire, F. Evolution of carbon structure in chemically activated wood. Carbon 1995, 33, 1247–1254. [Google Scholar] [CrossRef]
- Zuo, S.; Liu, J.; Yang, J.; Cai, X. Effects of the crystallinity of lignocellulosic material on the porosity of phosphoric acid-activated carbon. Carbon 2009, 47, 3578–3580. [Google Scholar] [CrossRef]
- Yorgun, S.; Yıldız, D. Preparation and characterization of activated carbons from Paulownia wood by chemical activation with H3PO4. J. Taiwan Inst. Chem. Eng. 2015, 53, 122–131. [Google Scholar] [CrossRef]
- Guo, H.; Deng, X.; Zhu, G.; Wang, G. Preparation of high adsorption performance activated carbon by phosphoric acid activation. Chem. Ind. For. Prod. 2013, 33, 55–58. [Google Scholar]
- Zhu, G.; Deng, X.; Liu, X.; Xu, Y.; Lin, G.; Gong, J. Preparation of High-butane-working-capacity Granular Activated Carbon from China Fir Sawdust. Chem. Ind. For. Prod. 2011, 31, 17–22. [Google Scholar]
- Laine, J.; Calafat, A.; Labady, M. Preparation and characterization of activated carbons from coconut shell impregnated with phosphoric acid. Carbon 1989, 27, 191–195. [Google Scholar] [CrossRef]
- Corcho-Corral, B.; Olivares-Marín, M.; Fernández-González, C.; Gómez-Serrano, V.; Macías-García, A. Preparation and textural characterisation of activated carbon from vine shoots (Vitis vinifera) by H3PO4—Chemical activation. Appl. Surf. Sci. 2006, 252, 5961–5966. [Google Scholar] [CrossRef]
- Zuo, S.; Yang, J.; Liu, J. Effects of the heating history of impregnated lignocellulosic material on pore development during phosphoric acid activation. Carbon 2010, 48, 3293–3295. [Google Scholar] [CrossRef]
- Rabinovich, M.L.; Fedoryak, O.; Dobele, G.; Andersone, A.; Gawdzik, B.; Lindström, M.E.; Sevastyanova, O.J.R.; Reviews, S.E. Carbon adsorbents from industrial hydrolysis lignin: The USSR/Eastern European experience and its importance for modern biorefineries. Renew. Sustain. Energy Rev. 2016, 57, 1008–1024. [Google Scholar] [CrossRef]
- Jagtoyen, M.; Thwaites, M.; Stencel, J.; McEnaney, B.; Derbyshire, F. Adsorbent carbon synthesis from coals by phosphoric acid activation. Carbon 1992, 30, 1089–1096. [Google Scholar] [CrossRef]
- Puziy, A.; Poddubnaya, O.; Martınez-Alonso, A.; Suárez-Garcıa, F.; Tascón, J. Synthetic carbons activated with phosphoric acid: I. Surface chemistry and ion binding properties. Carbon 2002, 40, 1493–1505. [Google Scholar] [CrossRef]
- Zhu, G.-Z.; Deng, X.-L.; Hou, M.; Sun, K.; Zhang, Y.-P.; Li, P.; Liang, F.-M. Comparative study on characterization and adsorption properties of activated carbons by phosphoric acid activation from corncob and its acid and alkaline hydrolysis residues. Fuel Process. Technol. 2016, 144, 255–261. [Google Scholar] [CrossRef]
- Terzyk, A.P. The influence of activated carbon surface chemical composition on the adsorption of acetaminophen (paracetamol) in vitro: Part II. TG, FTIR, and XPS analysis of carbons and the temperature dependence of adsorption kinetics at the neutral pH. Colloids Surf. A. Physicochem. Eng. Asp. 2001, 177, 23–45. [Google Scholar] [CrossRef]
- Akpan, E.I. Sustainable Lignin for Carbon Fibers: Principles, Techniques, and Applications; Springer: Berlin/Heidelberg, Germany, 2019. [Google Scholar]
- Brodin, I.; Ernstsson, M.; Gellerstedt, G.; Sjöholm, E. Oxidative stabilisation of kraft lignin for carbon fibre production. Holzforschung 2012, 66, 141–147. [Google Scholar] [CrossRef]
- Lin, J.; Zhao, G. Preparation and Characterization of High Surface Area Activated Carbon Fibers from Lignin. Polymers 2016, 8, 369. [Google Scholar] [CrossRef] [PubMed] [Green Version]
- Katzman, H.; Adams, P.; Le, T.; Hemminger, C. Characterization of low thermal conductivity pan-based carbon fibers. Carbon 1994, 32, 379–391. [Google Scholar] [CrossRef] [Green Version]
- Darmstadt, H.; Roy, C.; Kaliaguine, S. ESCA characterization of commercial carbon blacks and of carbon blacks from vacuum pyrolysis of used tires. Carbon 1994, 32, 1399–1406. [Google Scholar] [CrossRef]
- Wu, Q.-Y.; Liang, H.-Q.; Li, M.; Liu, B.-T.; Xu, Z.-K. Hierarchically porous carbon membranes derived from PAN and their selective adsorption of organic dyes. Chin. J. Polym. Sci. 2015, 34, 23–33. [Google Scholar] [CrossRef]
- Macedo, J.D.S.; Júnior, N.B.D.C.; Almeida, L.E.; Vieira, E.F.D.S.; Cestari, A.R.; Gimenez, I.D.F.; Carreño, N.L.V.; Barreto, L.S. Kinetic and calorimetric study of the adsorption of dyes on mesoporous activated carbon prepared from coconut coir dust. J. Colloid Interface Sci. 2006, 298, 515–522. [Google Scholar] [CrossRef]
- Mall, I.D.; Srivastava, V.C.; Agarwal, N.K.; Mishra, I.M. Removal of congo red from aqueous solution by bagasse fly ash and activated carbon: Kinetic study and equilibrium isotherm analyses. Chemosphere 2005, 61, 492–501. [Google Scholar] [CrossRef]
- Fan, L.; Luo, C.; Li, X.; Lu, F.; Qiu, H.; Sun, M. Fabrication of novel magnetic chitosan grafted with graphene oxide to enhance adsorption properties for methyl blue. J. Hazard. Mater. 2012, 215, 272–279. [Google Scholar] [CrossRef]
- Liu, Y. New insights into pseudo-second-order kinetic equation for adsorption. Colloids Surf. A Physicochem. Eng. Asp. 2008, 320, 275–278. [Google Scholar] [CrossRef]
- Pagalan, E., Jr.; Sebron, M.; Gomez, S.; Salva, S.J.; Ampusta, R.; Macarayo, A.J.; Joyno, C.; Ido, A.; Arazo, R. Activated carbon from spent coffee grounds as an adsorbent for treatment of water contaminated by aniline yellow dye. Ind. Crops Prod. 2020, 145, 111953. [Google Scholar] [CrossRef]


| Samples | T (°C) | t (h) | IR | Yield (%) | SBET (m²/g) | Vtot (cm³/g) | Vmicro (cm³/g) | Vmeso (cm³/g) | D (nm) |
|---|---|---|---|---|---|---|---|---|---|
| AHL-AC1 | 350 | 1 | 1:2 | 67.5 | 1526 | 0.86 | 0.36 | 0.29 | 2.88 |
| AHL-AC2 | 350 | 1.5 | 1:3 | 70.0 | 1480 | 0.89 | 0.25 | 0.43 | 2.97 |
| AHL-AC3 | 400 | 1.5 | 1:3 | 66.2 | 1871 | 1.20 | 0.16 | 0.75 | 3.08 |
| AHL-AC4 | 400 | 2 | 1:2 | 64.8 | 1956 | 1.14 | 0.23 | 0.60 | 2.92 |
| AHL-AC5 | 450 | 1 | 1:3 | 64.2 | 1869 | 1.39 | 0.12 | 1.05 | 3.69 |
| AHL-AC6 | 450 | 1.5 | 1:2 | 62.3 | 2015 ± 5 | 1.20 | 0.19 | 0.73 | 2.94 |
| AHL-AC7 | 500 | 1 | 1:1 | 60.1 | 1321 | 0.67 | 0.51 | 0.08 | 2.86 |
| AHL-AC8 | 500 | 2 | 1:3 | 64.3 | 1790 | 1.46 | 0.16 | 1.13 | 4.34 |
| AHL | - | - | - | - | 0.24 | 0.0003 | - | - | 4.37 |
| IndL-AC | 450 | 1.5 | 1:2 | 45.3 | 1371 ± 25 | 0.66 | 0.36 | 0.19 | 3.82 |
| AlkL-AC | 450 | 1.5 | 1:2 | 61.8 | 2119 | 1.13 | 0.19 | 0.66 | 2.61 |
| LS-AC | 450 | 1.5 | 1:2 | 32.3 | 2179 | 1.81 | - | 1.65 | 3.41 |
| Material | Conditions | SBET (m²/g) | Vtot (cm³/g) | Vmicro (cm³/g) | Vmeso (cm³/g) | Source |
|---|---|---|---|---|---|---|
| Brew spent grain hydrolysis lignin | H3PO4, IR = 1:3, impregnation for 1 h at room temperature, 17.5 °C/min to 170 °C for 1 h, 600 °C for 2 h in air | 459 | 0.30 | 0.17 | 0.13 | [28] |
| Softwood sodium lignosulfonate | H3PO4 (60%), IR = 1:1, impregnation for 1 h at 110 °C, 10 °C/min to 1000 °C in argon | 1373 | 0.97 | 0.41 | 0.56 | [29] |
| Alcell® lignin | H3PO4, IR = 1:3, impregnation for 24 h at 60 °C in a vacuum dryer, 500 °C for 2 h in N2 | 1015 | - | 0.37 | 1.10 | [30] |
| Kraft lignin | H3PO4, IR = 1:1.4, impregnation for 1 h at room temperature, 10 °C/min to 150 °C for 1 h, 600 °C for 2 h in air | 1305 | 0.67 | - | - | [31] |
| Kraft lignin | H3PO4, IR = 1:1.5, microwave pretreatment for 4 min, 600 °C for 1 h in a closed stainless steel reactor | 1202 | 0.66 | 0.48 | 0.16 | [32] |
| Eucalyptus kraft lignin | H3PO4, IR = 1:2, impregnation for 24 h at 60 °C in a vacuum dryer, 10 °C/min to 425 °C for 2h in N2 | 1459 | - | 0.82 | 0.53 | [33] |
| Eucalyptus kraft lignin | CO2, 10 °C/min to 350 °C for 2 h in N2, then 850 °C for 20 h in CO2 | 1853 | 2.09 | 0.70 | 0.86 | [34] |
| Eucalyptus kraft lignin | ZnCl2, IR = 1:2.3, impregnation in a rotary evaporator for 1 h at 30 °C and vacuum-evaporation at 60 °C, 10 °C /min to 500 °C for 2 h in N2 | 1321 | 0.79 | 0.06 | - | [35] |
| De-alkaline lignin | KOH, IR = 1:3, 10 °C/min to 800 °C for 5 min in N2 | 2254 | 1.14 | 1.02 | - | [36] |
| Lignin waste | KOH, converted to hydrochar via hydrothermal treatment at 300−390 °C, IR = 1:4, 3 °C/min to 800 °C for 1 h in N2 | 3235 | 1.77 | 0.93 | - | [37] |
| Poplar AHL | H3PO4 (aliquot H2SO4), Condition for AHL-AC4 (Table 1) | 1956 | 1.14 | 0.23 | 0.60 | This study |
| Poplar AHL | H3PO4 (aliquot H2SO4), Condition for AHL-AC6 (Table 1) | 2015 | 1.20 | 0.19 | 0.73 | This study |
| Alkali lignin | H3PO4 (aliquot H2SO4), Condition for AHL-AC6 (Table 1) | 2119 | 1.13 | 0.19 | 0.66 | This study |
| Samples | C (%) | O (%) | S (%) | P (%) | O/C |
|---|---|---|---|---|---|
| AHL | 74.56 | 25.09 | 0.22 | 0.13 | 0.34 |
| AHL-AC6 | 90.39 | 8.49 | 0.52 | 0.60 | 0.09 |
| Dye | qm (mg/g) | k | RL | r2 | Experimental qm (mg/g) |
|---|---|---|---|---|---|
| CR | 64.7 | 1.7045 | 0.0354 | 0.9904 | 60.7 |
| MB | 534.8 | 3.8998 | 0.0032 | 0.9985 | 530.1 |
Publisher’s Note: MDPI stays neutral with regard to jurisdictional claims in published maps and institutional affiliations. |
© 2020 by the authors. Licensee MDPI, Basel, Switzerland. This article is an open access article distributed under the terms and conditions of the Creative Commons Attribution (CC BY) license (http://creativecommons.org/licenses/by/4.0/).
Share and Cite
Yang, Z.; Gleisner, R.; H. Mann, D.; Xu, J.; Jiang, J.; Zhu, J.Y. Lignin Based Activated Carbon Using H3PO4 Activation. Polymers 2020, 12, 2829. https://doi.org/10.3390/polym12122829
Yang Z, Gleisner R, H. Mann D, Xu J, Jiang J, Zhu JY. Lignin Based Activated Carbon Using H3PO4 Activation. Polymers. 2020; 12(12):2829. https://doi.org/10.3390/polym12122829
Chicago/Turabian StyleYang, Zhongzhi, Roland Gleisner, Doreen H. Mann, Junming Xu, Jianchun Jiang, and J.Y. Zhu. 2020. "Lignin Based Activated Carbon Using H3PO4 Activation" Polymers 12, no. 12: 2829. https://doi.org/10.3390/polym12122829
APA StyleYang, Z., Gleisner, R., H. Mann, D., Xu, J., Jiang, J., & Zhu, J. Y. (2020). Lignin Based Activated Carbon Using H3PO4 Activation. Polymers, 12(12), 2829. https://doi.org/10.3390/polym12122829