1. Introduction
The topic of bulk vs. confined organic
materials is usually studied by a variety of classic experimental techniques. Changes in dynamics of various organic
media as reflected by specific
intrinsic probes of material, such as dynamic density fluctuations, reorientations of magnetic and electric dipoles are detected by means of neutron scattering (NS), nuclear magnetic resonance (NMR) or dielectric relaxation spectroscopy (BDS), respectively, are often observed (see general and special reviews [
1,
2,
3,
4,
5,
6,
7,
8,
9]). These are related to phase transitions and eventually, to a formation of new phase(s) induced in confined organic
medium (
filler) by spatial restriction or/and by wall surface of confining inorganic
matrix (
confiner) [
1,
2,
3,
4] with their complex impacts into dynamic properties [
5,
6,
7,
8,
9]. The overall confinement effect, as seen by these standard dynamic techniques, is considered to be a result of the complex mutual interplay of the following two main factors: (i) restricting geometric effects of the pores in a given
matrix on the investigated
medium and (ii) the mutual interaction effects of the
medium’s entities with the pore surface wall of the
matrix [
1,
2,
3,
4,
5,
6,
7,
8,
9].
The bulk vs. confinement topic as the multiparameter problem includes a complex mutual action of many
internal and
external parameters. The most studied group of
internal parameters concerns the confining
matrix, such as pore size, pore size distribution, pore topology (mutual pore separation or interconnectivity) and pore surface composition and the confined organic
medium, such as its size, shape and polarity, and proticity of the
molecules. The group of
external parameters includes those related to the
matrix and confined
system conditioning and preparation, such as thermal/time treatments of inorganic
matrix in certain atmosphere, filling procedure of confined
systems, again under a certain atmosphere, as well as degree of filling the pores (filling factor), of the previous specifically treated
matrix with a given
medium. One of the most often used model inorganic
matrices based on
silica such as irregular
mesoporous silica gels (
SG) and regular
periodic mesoporous silicas (
PMS), e.g.,
MCM-41 [
10,
11,
12] and
SBA-15 [
13,
14], has the hydrophilic character due to the presence of three basic kinds of polar
silanol groups: isolated (free)
silanol [
O≡Si-OH], geminal
silanol or
silanediol [
O=Si=(
OH)
2] and vicinal
silanol [
O≡Si-OH...HO-Si≡O], with their different adsorption ability to the environmental
moisture (
H2O from
air) or other
agents [
15,
16,
17,
18] and the capability of having various modification treatments [
17,
18]. Consequently, many BDS works addressed this important
water-adsorption phenomenon in various
silicas [
19,
20,
21,
22]. However, in spite of the importance of these
external parameters, a relatively small amount of attention was devoted to
systematic studies of their variations from the viewpoint of their impact into the dynamic response of the various confined
organics [
23,
24]. This is also evident from the frequent absence of
detailed descriptions of the empty
matrix and confined
system conditioning, as well as of the filling conditions during the preparation of the confined
systems.The knowledge situation is further complicated for the special group of
H-bonded compounds, a very important class of organic
media. Although the simpler
poly alcohols, such as
1,2-ethanediol, ethylene glycol (
EG),
1,2-propanediol,
propylene glycol (
PG) and
1,2,3-propanetriol, glycerol (
GL) were among the first model
organic media investigated after insertion into various inorganic
silica matrices by BDS [
25,
26,
27,
28,
29,
30], BDS works on confined
monohydroxy alcohols are rather limited [
24,
31,
32,
33]. This family of
alcohols exhibits basically two peak features, where the main peak consists of two strongly superimposed subpeaks from the dominating Debye relaxation and the essentially less intense primary
α one together with the well-separated secondary
β process [
34]. First, branched longer
monohydroxy alkanols were studied where well-separated Debye- and
α-processes were observed [
31,
32]. Later the first simplest members of the
n-alkanol family, i.e.,
methanol and
ethanol, were measured under confinement in
MCM-41, showing a single global main peak, without any resolution of possible individual processes [
24,
33].
N-propanol, CH3CH2CH2OH, (
n-PrOH) is a typical amphiphilic organic
substance containing both the
apolar alkyl group and the
polar hydroxyl one in
the molecule, with its ability to form intermolecular
H-bonded
associates (
aggregates) in the liquid state [
34]. Basic structural and dynamic properties of
n-PrOH in the bulk state were investigated by classic structural X-ray and neutron diffraction (XD and ND) techniques, together with various Monte Carlo and molecular dynamics (MC and MD) simulations, as well as Empirical Potential Structure Refinement (EPSR) modeling [
35,
36,
37,
38], and by dynamics techniques, such as BDS and neutron scattering (NS) [
39,
40,
41], so that the structural–dynamic state of the bulk
liquid n-PrOH is quite well understood. On the other hand, a few works only were focused on dynamic behavior of small
alkanols, such as
n-PrOH confined in various microscopic porous inorganic
matrices [
42]. In addition, recently, some of us performed electron spin resonance (ESR) studies via
spin probe method on the bulk
n-PrOH [
43] and on the respective saturated confined states in the irregular virgin
silica gels (
SGs) [
44], as well as in the regular virgin
MCM-41 [
45], showing significant differences in the
spin probe 2,2,6,6-tetramethyl-piperidinyl-1-oxy (
TEMPO) dynamics, as well as in its dynamic heterogeneity with respect to the bulk
n-PrOH medium.
In this contribution, we present the results of detailed systematic BDS studies of the relaxation dynamics of
n-PrOH embedded in a periodic
silica-based
matrix. The
MCM-41 type silica matrix with the defined pore size, pore topology and pore composition [
10,
11,
12] was investigated in detail by a variation of
external variables, such as (i) thermal, i.e., temperature/time treatment and capacitor filling of the empty
MCM-41 matrix under various atmospheres, i.e.,
air and
nitrogen; (ii) pore and capacitor filling of the
n-PrOH/MCM-41 systems under various atmospheres; and (iii) different filling factor of the confined
medium/matrix system for the most optimally treated empty
MCM-41 matrix, as well as the most optimally prepared confined
n-PrOH/MCM-41 system.
2. Materials and Methods
Anhydrous n-Propanol (n-PrOH) from Sigma-Aldrich, Inc., Germany, with a purity of 99.7% was used as confined organic medium (filler). Regular virgin Mobil Composition of Matter (MCM-41) silica matrix having regularly (parallelly) ordered cylinder-like channels with the mean pore size Dpore = 40 Å, from Sigma-Aldrich, Inc., Germany, was utilized as a confining inorganic material.
2.1. FTIR Measurements
First, the conditioning by drying procedure of the empty MCM-41 was monitored by Fourier transform middle-infrared (FT M-IR) spectroscopy. The empty MCM-41 matrix was undergone to stepwise drying for 0, 1, 3, 6 and 7 days, in the vacuum oven (VO), and subsequently immediately measured in FTIR spectrometer Nicolet 8700TM, Thermo Scientific, Madison, WI, USA, in transmission mode, under the standard air atmosphere. The analyzed samples in amounts below 2 mg were grounded in the ball mill, along with calcium bromide. Then the ground powder was molded into pellets. The corresponding spectra were taken throughout the whole middle infrared region (4000–400 cm−1) and normalized by converting to unit mass. The calcium bromide (KBr, CAS: 7758-02-3) used was a FTIR-grade product purchased from Sigma-Aldrich Chemie, Steinheim, Germany. The KBr was dried at 120 °C, in a common oven, in air atmosphere, before measurement. The resolution of spectra was set to 4 cm−1, and the number of scans was 32 in every case.
Next, the empty MCM-41 matrix was exposed to various conditioning treatments that consisted of three different drying procedures before BDS measurements. These sample preparations of MCM-41 matrix included the following: (i) drying at specific drying temperature of 120 °C, in the VO, for different drying times, 0,1,3,6 and 7 days, followed by filling the capacitor under air (O2 + N2 + moisture) atmosphere; (ii) drying at 120 °C for 1 day, in the VO, followed by filling the capacitor under inert nitrogen atmosphere in the glove box (GB); and finally (iii) drying at 120 °C directly in the BDS cell, under N2 atmosphere, for different drying times, 1–8 h with subsequent immediate BDS measurements at 150 K.
2.2. BDS Measurements
The confined
n-PrOH/MCM-41 systems for BDS studies were prepared by adding
n-PrOH into the
MCM-41 powder, drop by drop, and stirring till the desired weight ratio was achieved (see
Table 1). For the underfilled and saturated cases, capillary forces were allowed to fill the accessible pores of
matrices with
n-PrOH so that no liquid remained on the external surface
of the silica grains. By further adding the
n-PrOH medium, the overfilled state with the
n-PrOH molecules in the inter-grain
silica space was achieved. Two different environments were tested for capacitor preparation and for the
n-PrOH filling of
MCM-41 matrix: under regular air (
mixture of N2+O2+moisture (
H2O) in laboratory and under inert
N2 atmosphere in the GB. The
theoretical and
real mass fractions of the
filler for each
filler/confiner system, as well as the ratios of the latter quantity to the former one, are listed in
Table 1.
BDS measurements were performed by using a high-resolution Novocontrol dielectric analyzer in the range 10−1–107 Hz. Isothermal frequency scans were performed over the temperature interval from 100 to 300 K, with a temperature step of 5 K. The MCM-41 powder and n-PrOH containing MCM-41 powder samples and liquid samples were placed between two parallel plate capacitors, without or with a Teflon spacer, with a thickness of 100 μm, respectively.
3. Results
3.1. Effect of the Conditioning of the Empty MCM-41 Matrix on the M-IR and BDS Response.
First, we investigated the influence of various thermal treatments on the empty MCM-41 matrix by M-IR and BDS techniques. The treatments consisted of (i) drying the MCM-41 samples at a specific drying temperature, Td = 393 K (120 °C), for various drying times, td, in the VO or directly in the BDS cell; and (ii) subsequent sample preparation of the variously dried MCM-41 matrix into the M-IR cell, under air or into the capacitor of the BDS cell, under various atmospheres, i.e., under regular air or inert nitrogen (N2) in the GB.
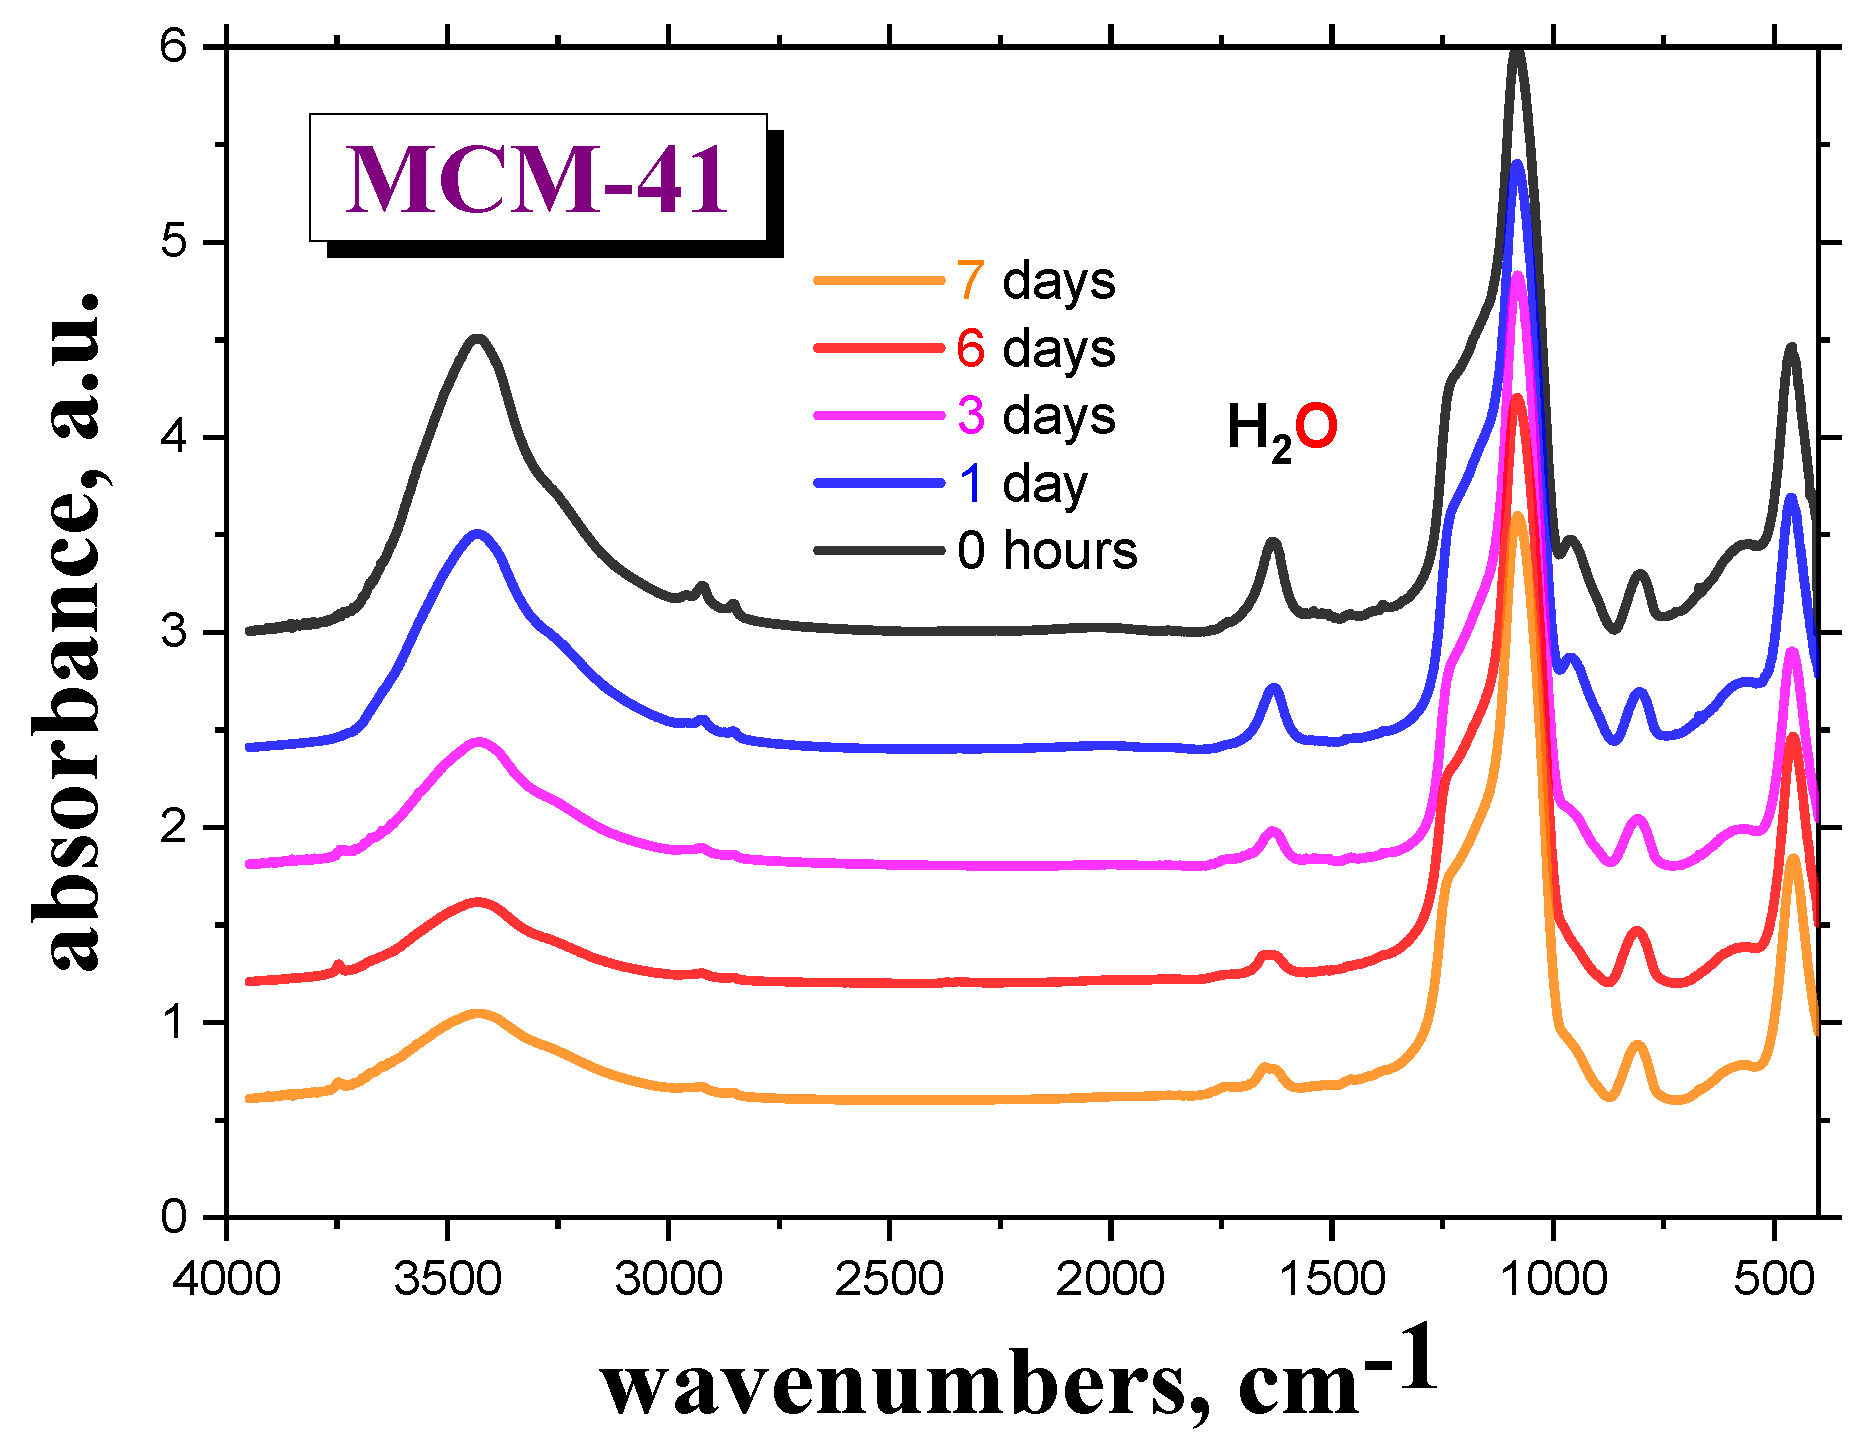
Figure 1 shows the M-IR spectra of the
MCM-41 as a function of drying time,
td = 0, 1, 3, 6 and 7 days, in the VO, followed by sample preparation of the M-IR cell under
air atmosphere. Here, the spectral bands at the wavenumbers of 1630 and ~3500 cm
−1 are ascribed to the bound
H2O molecules to the silanol groups of
silica [
15,
16]. The presence of even a small amount of
water at the surface of the
silica matrix may significantly contribute to its dielectric response [
19,
20,
21,
22]. After drying the empty
MCM-41 material in the VO for six days, followed by subsequent sample preparation of the M-IR cell under
air atmosphere, the intensity of this particular peak becomes almost constant.
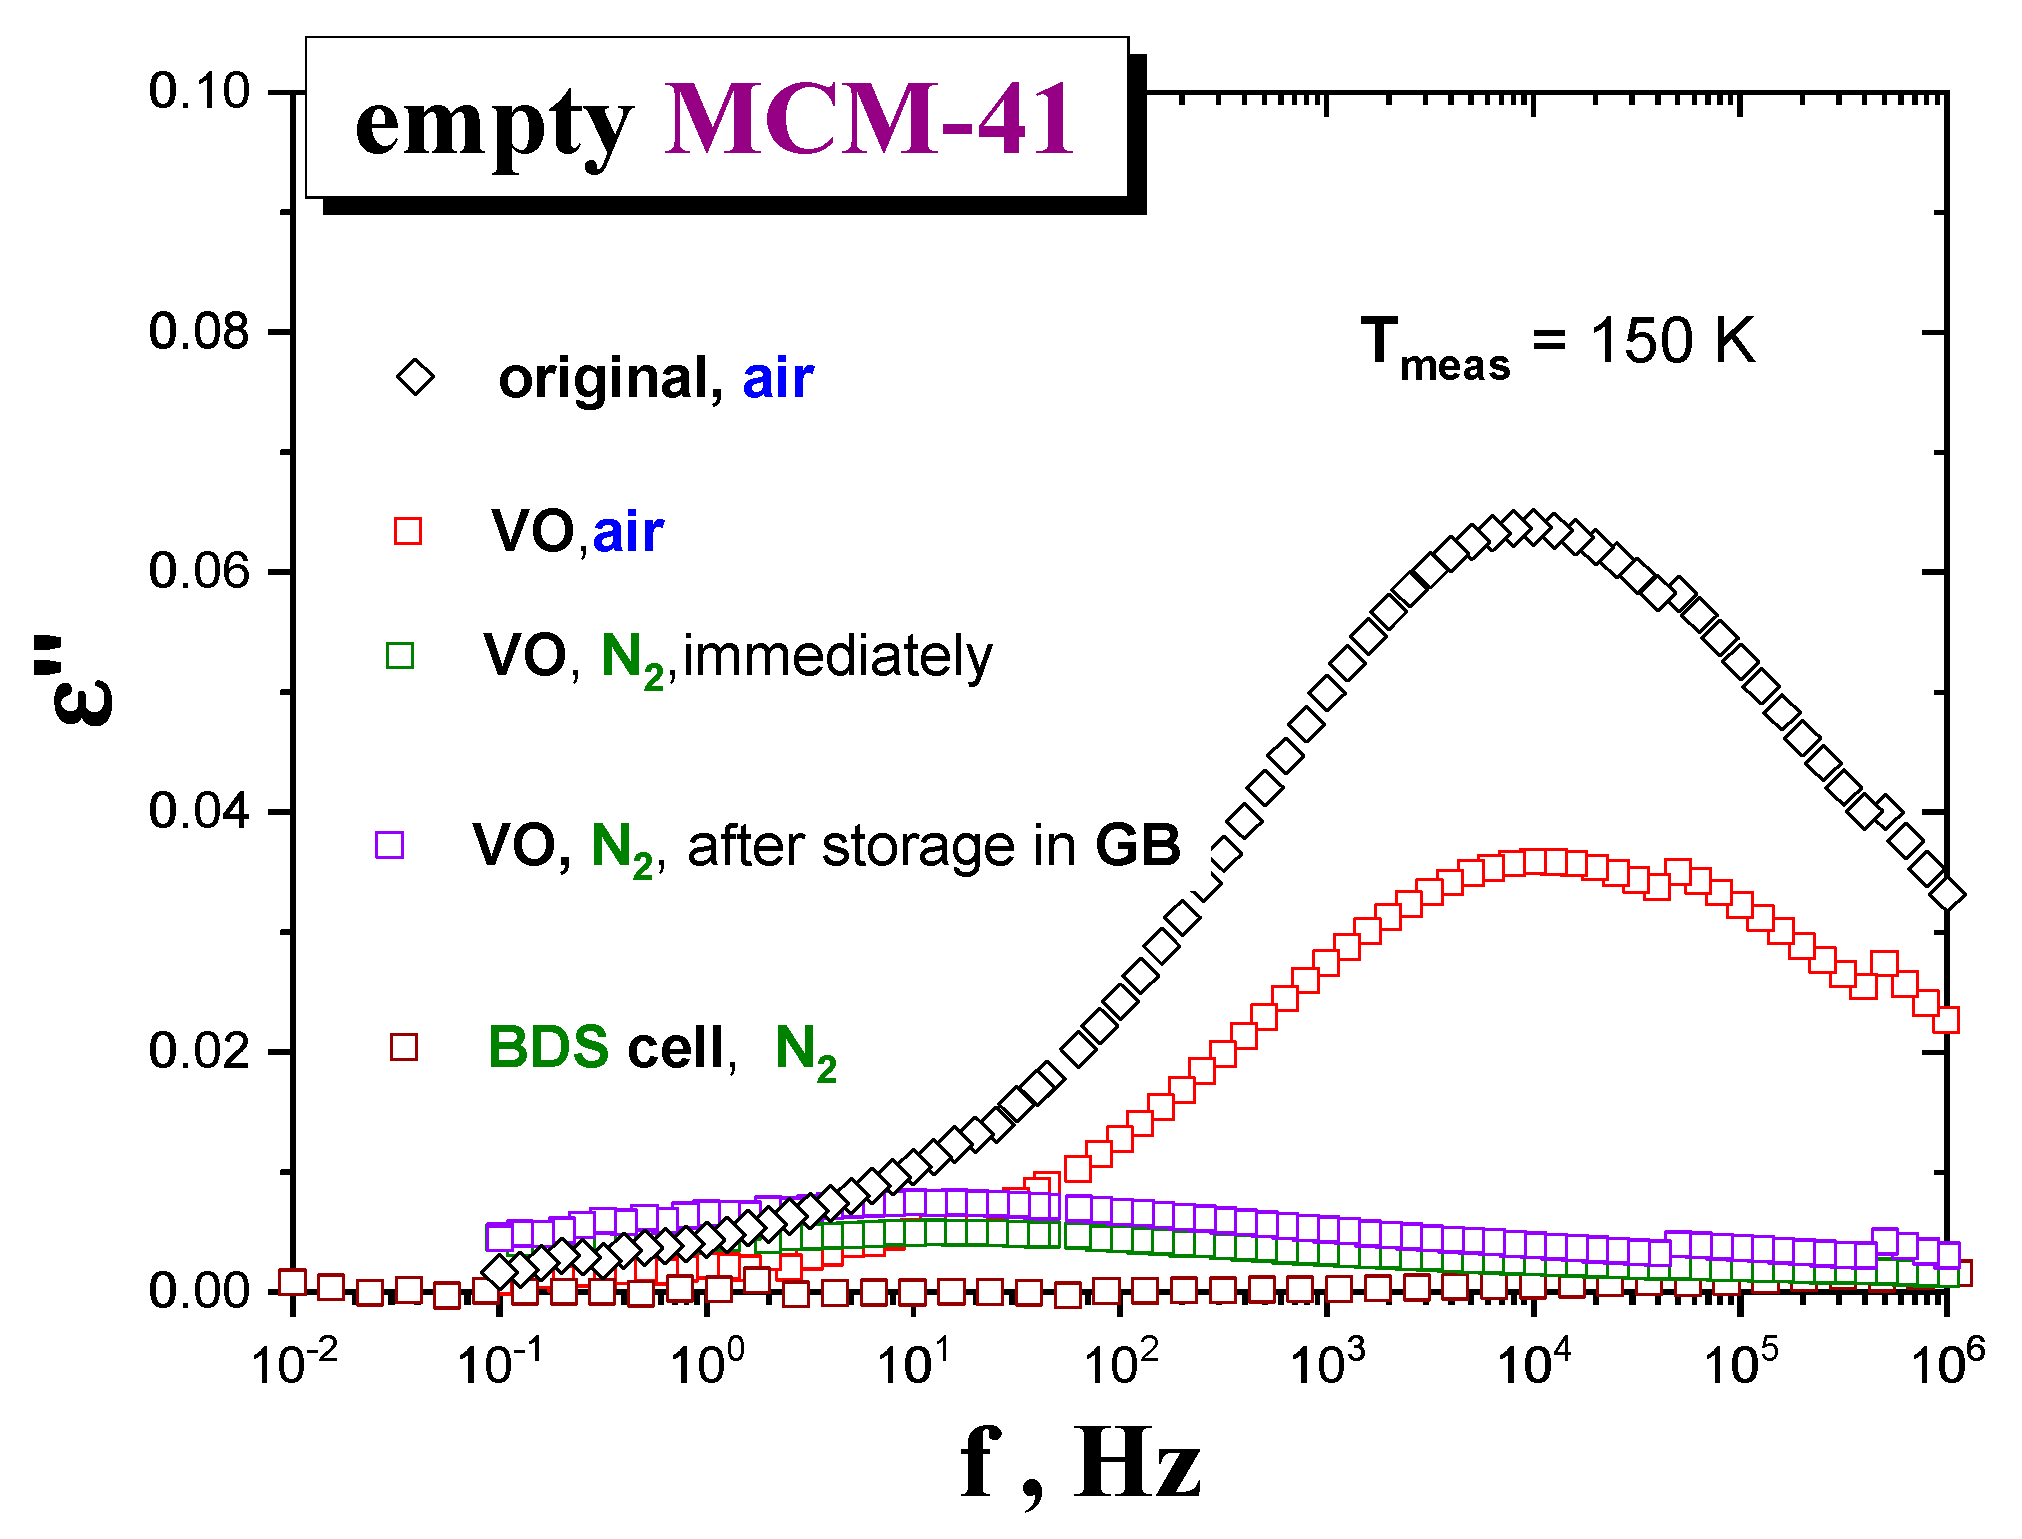
Figure 2 shows BDS spectra of the
MCM-41 matrix samples under different drying and atmosphere conditions, at some representative temperature,
T = 150 K. As it can be seen, the dielectric response of those samples exposed to air for capacitor preparation after six days of drying exhibits a relatively intense loss peak at f
max (150 K,
air) ≈ 1 × 10
4 Hz. In contrast, the
MCM-41 samples exposed to
N2 for capacitor preparation after one day drying exhibit almost one order of magnitude lower intensity centered at a relatively lower f
max (150 K,
N2) ≈ 3 Hz. These results indicate that the quality of atmosphere in contact with the
matrix after drying is more determinant than the drying time on decreasing the amount of
water molecules of the
host matrix. Note that, according to M-IR data, the
moisture content after one day of drying is higher than that after the three days’ one, when measured under the same air atmosphere conditions. Consistently, among those samples exposed to
N2 after drying that dried inside the BDS cell under
N2 flow shows the lowest signal, followed by that measured right after drying and preparing, and finally, that of a sample stored under
N2 in the GB for five days before measurement (see
Figure 2). It is worth noting that the stepwise drying of the
MCM-41 silica reaches the stationary state (no appreciable evolution of the signal) after just two cumulative hours at 393 K.
These findings emphasize the important effect of matrix thermal treatment, atmosphere exposure and sample preparation conditions on the dielectric response of the empty MCM-41 matrix. Sample preparation details can be critical to understand certain surface effects and should be properly indicated and underlined in the future literature.
3.2. Effects of Preparation of the Confined n-PrOH/MCM-41 Systems under Various Atmospheres.
Although the last special
drying treatment of
MCM-41 matrix directly in the BDS cell is the most effective, it is technically impossible to apply this kind of treatment for own BDS measurements of any filled
organic/MCM-41 system because of the inevitable short-term manipulations with the
sample under air. Therefore, we have used the standard
drying of the
MCM-41 matrix in the VO and investigated the effects of both basic types of atmospheres (air and
N2) during preparation of the confined
n-PrOH/MCM-41 systems.
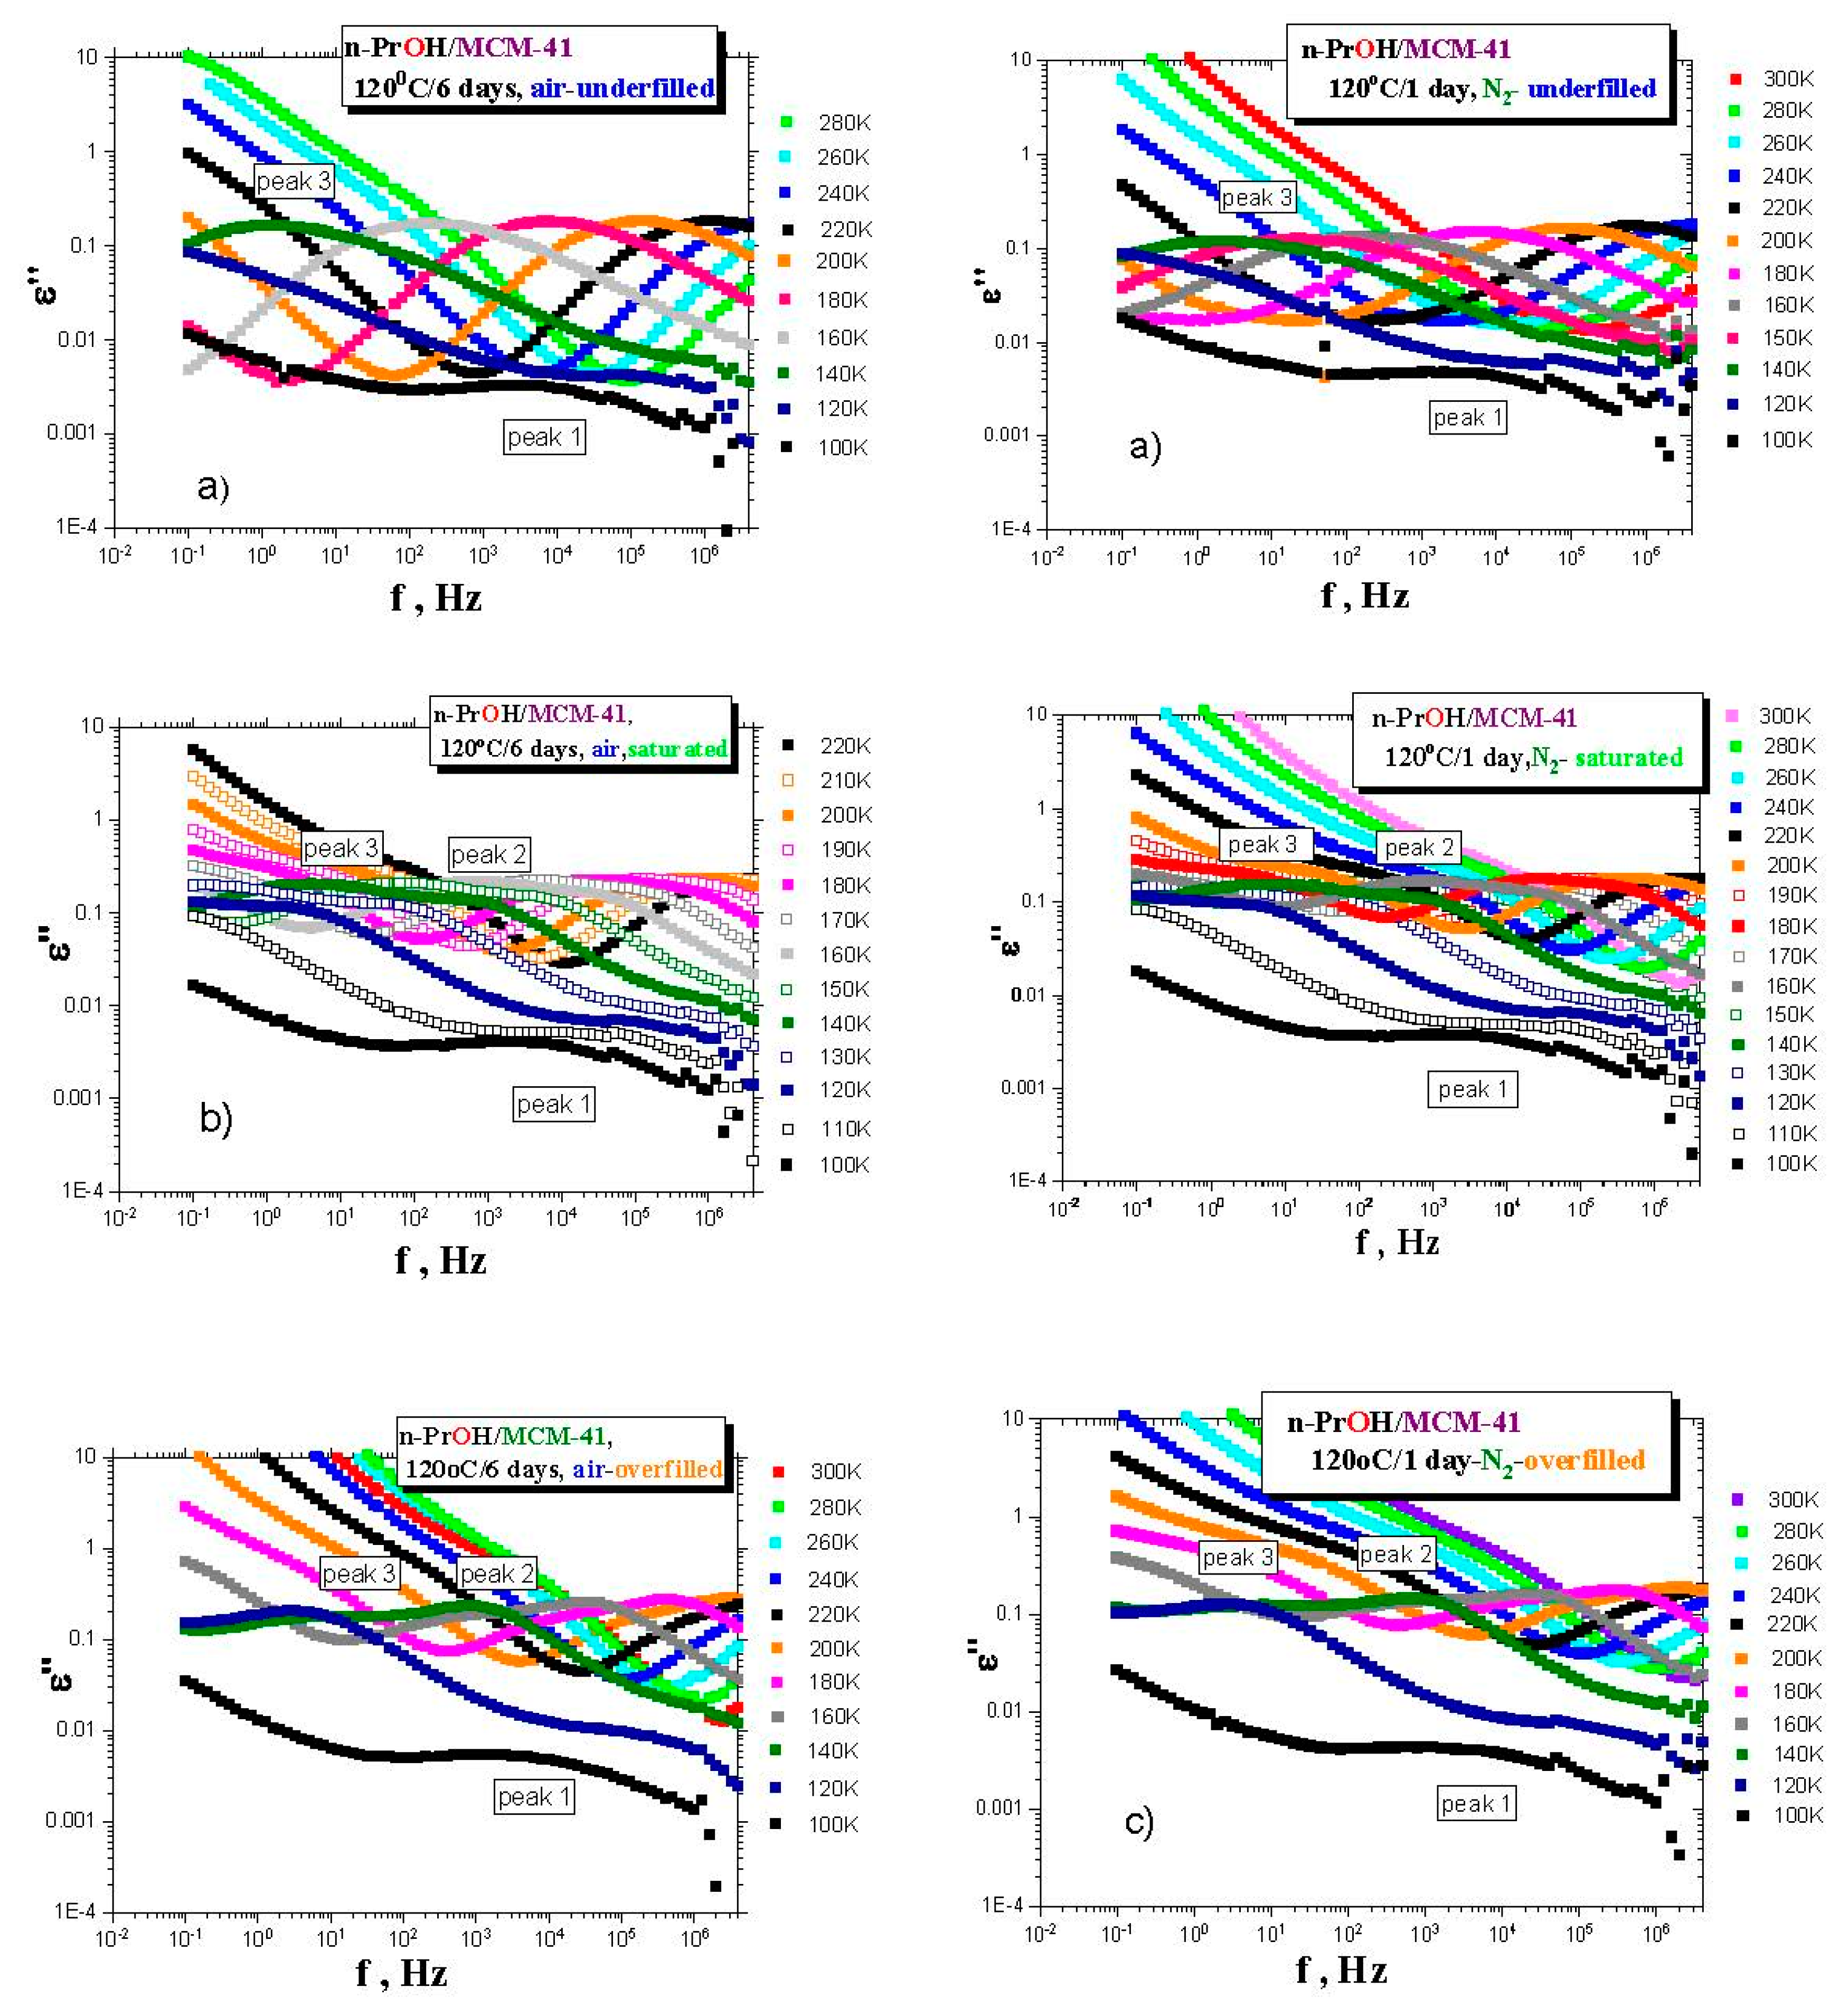
Figure 3a–c presents the BDS spectra for the various
n-PrOH/MCM-41 systems filled to the three different filling fractions under
air or
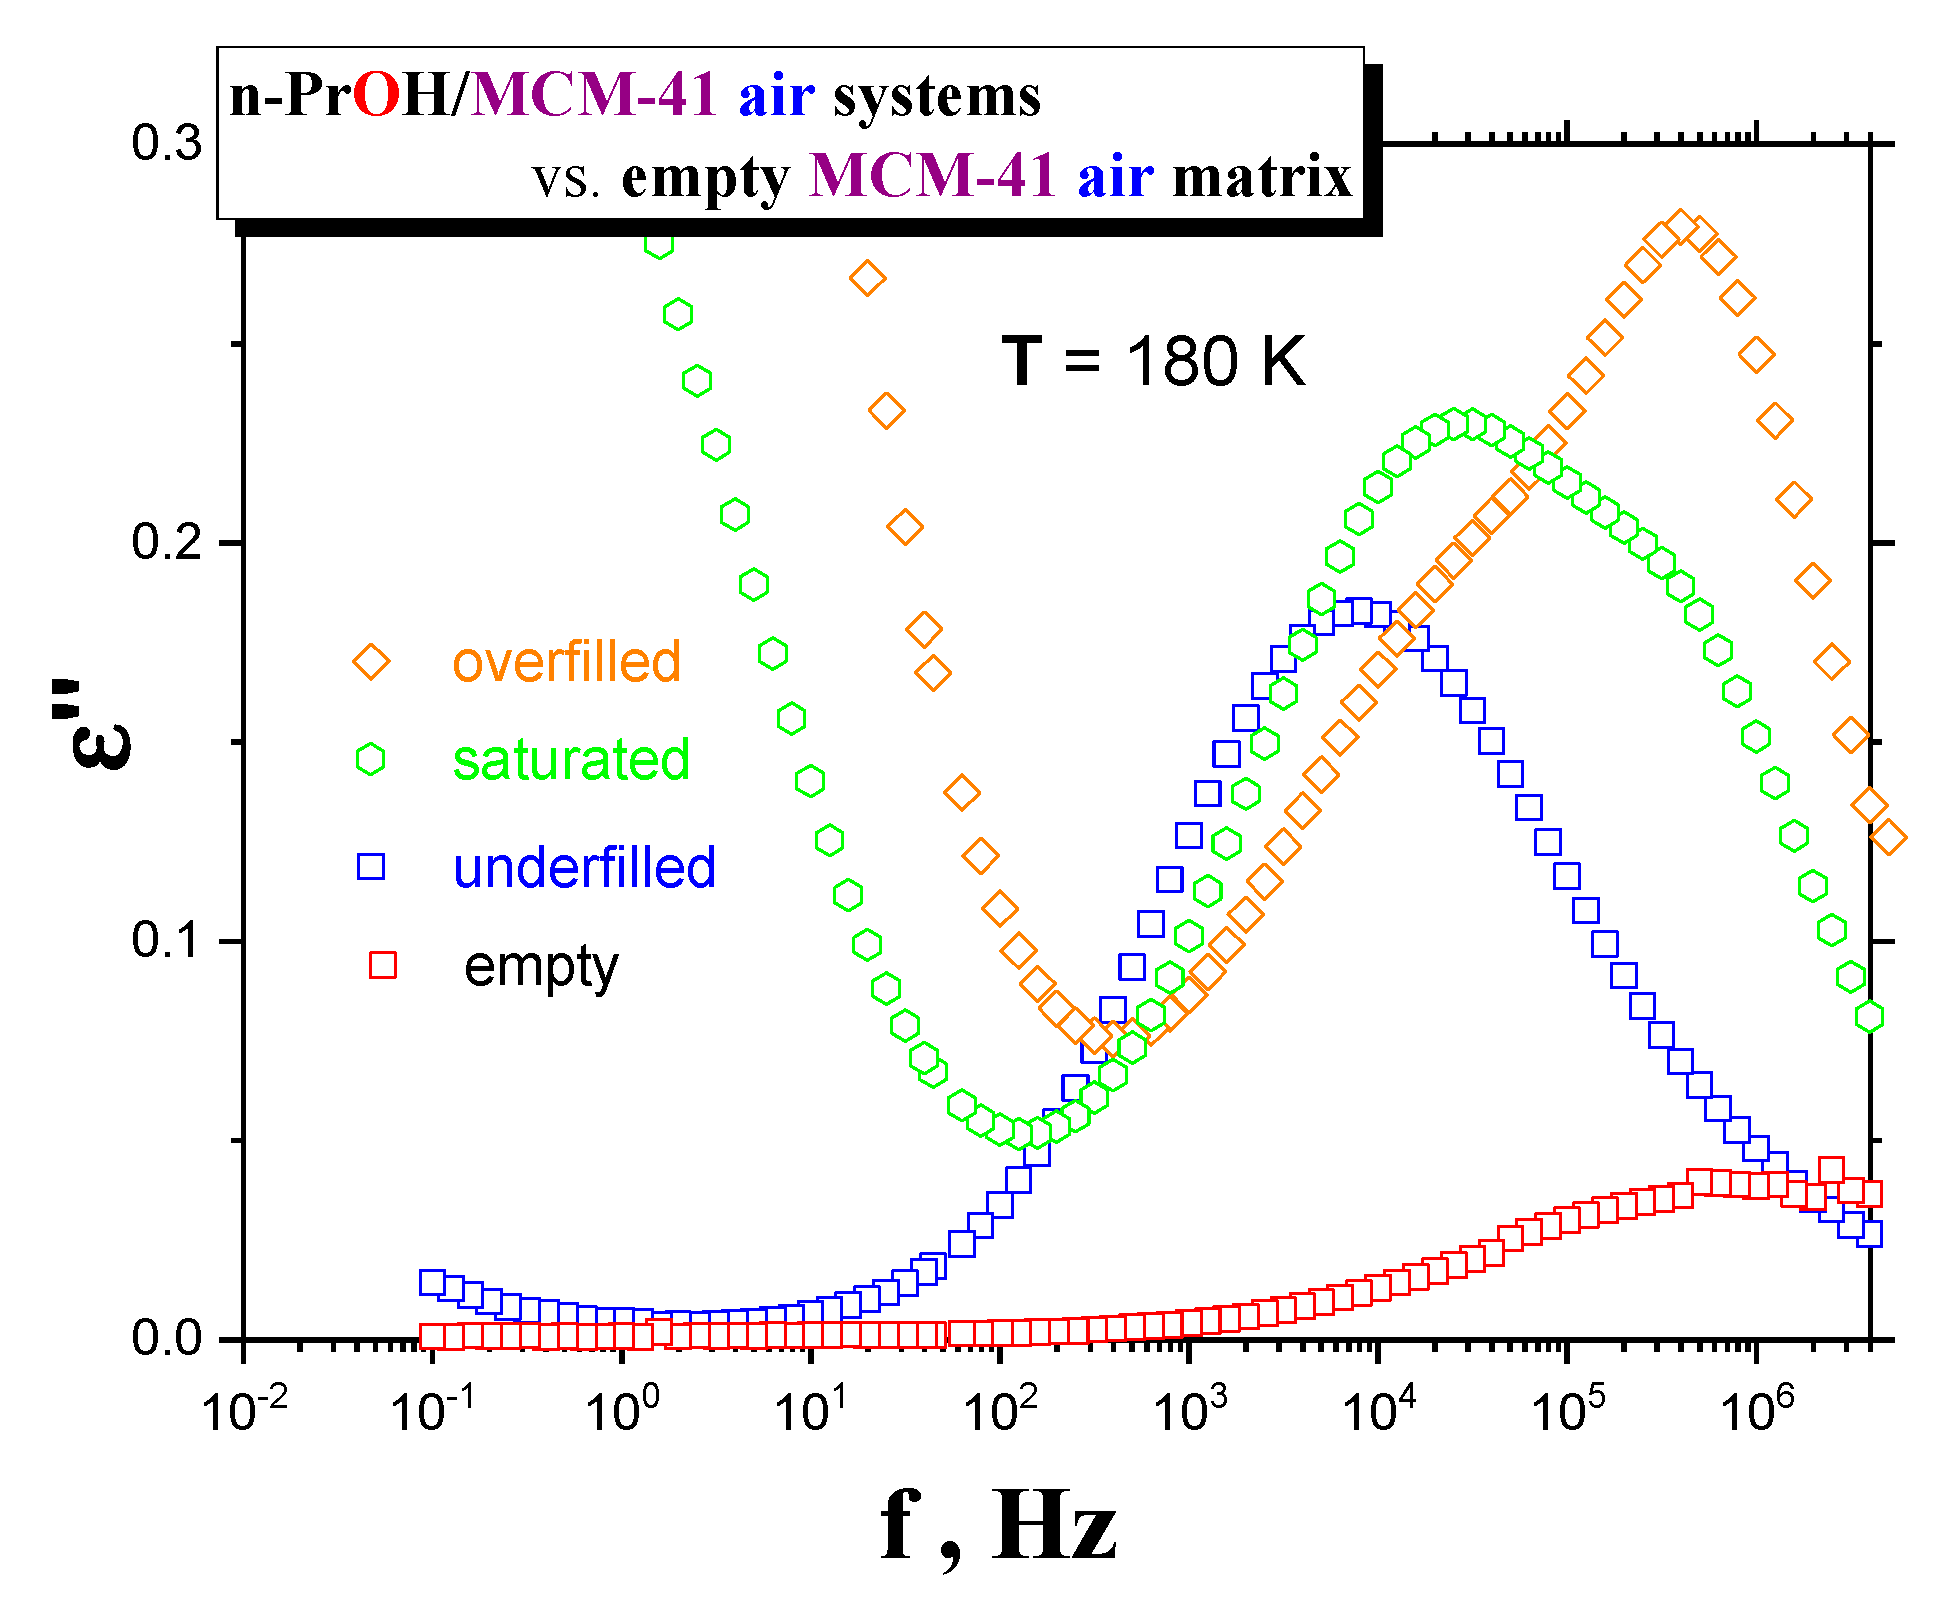
N2 atmosphere, respectively. Both spectral data at different atmospheres exhibit some similar and some different features. This is clearly demonstrated in
Figure 4 and
Figure 5, together with the respective spectral responses from the empty
MCM-41 matrices at one selected representative temperature, i.e., 180 K in both linear and logarithmic representations of dielectric loss.
A similar feature in all of the confined n-PrOH/MCM-41 systems is the presence of a small and broad peak (peak 1) at higher frequencies and lowest temperatures. On the other hand, significant differences consist in the character of dielectric spectra for different filling factors, regardless of the used atmosphere. For the overfilled and the saturated n-PrOH/MCM-41 systems, we observe a bimodal form of the respective spectra with peaks 2 and 3 at higher or lower frequency, respectively. In addition, for both of these types of confined systems differing in their filling fraction, the opposite trend in the peak intensities is evident, i.e., higher intensity of peak 2 with respect to that of peak 3, in accord with intuitive expectation. Although, in the case of the confined samples exposed to air during sample preparation, peak 2 may contain partial contribution from the losses of the bare MCM-41 matrix—the relative intensities of peaks 1 and 2 are of the same order as those for samples prepared under N2 atmosphere, where the dielectric loss of the MCM-41 is minimized. On the other hand, the underfilled n-PrOH/MCM-41 samples exhibit broad unimodal spectra with one spectral feature (peak 3). In general, the characteristic timescales for each of the processes mentioned above are only slightly dependent on the atmosphere under which samples were prepared (pore filling and capacitor preparation).
3.3. Effects of the Filling Fraction in the Confined n-PrOH/MCM-41, N2 Systems under the Most Optimal Atmosphere Conditions.
From the previous test BDS measurements, it is evident that the most optimal confined
n-PrOH/MCM-41 system treatment consists of
drying the empty
MCM-41 matrix in the VO at 120 °C for one day, with the subsequent pore and the capacitor fillings in the GB under
N2 atmosphere.
Figure 6 displays linear representations of the spectral evolution in all the three confined
n-PrOH/MCM-41 differing in the filling fraction. As already mentioned in the previous section, the dramatic qualitative difference between the underfilled
n-PrOH/MCM-41 and the saturated and overfilled
n-PrOH/MCM-41 ones can be found. In contrast to logarithmic representation in
Figure 3a,b, which emphases peak 1 at the lowest temperatures and the highest frequencies, linear representations of the LF-BDS spectra demonstrate more pronouncedly this difference in further peak features observed in intermediate temperatures of the BDS window. For the filling fraction 0.24, only one broad peak 3 at relatively lower frequencies exists, and in the latter ones, two peak features, i.e., peaks 3 and 2, are evident. Thus, in the saturated sample, peak 2 is relatively smaller than peak 3, and it appears over the intermediate temperature range at higher frequencies, while peak 3 is larger and situated at lower frequencies. Finally, for the overfilled system, the frequency positions of peaks 2 and 3 are similar as in the previous fully filled case, but their relative intensities are reversed.
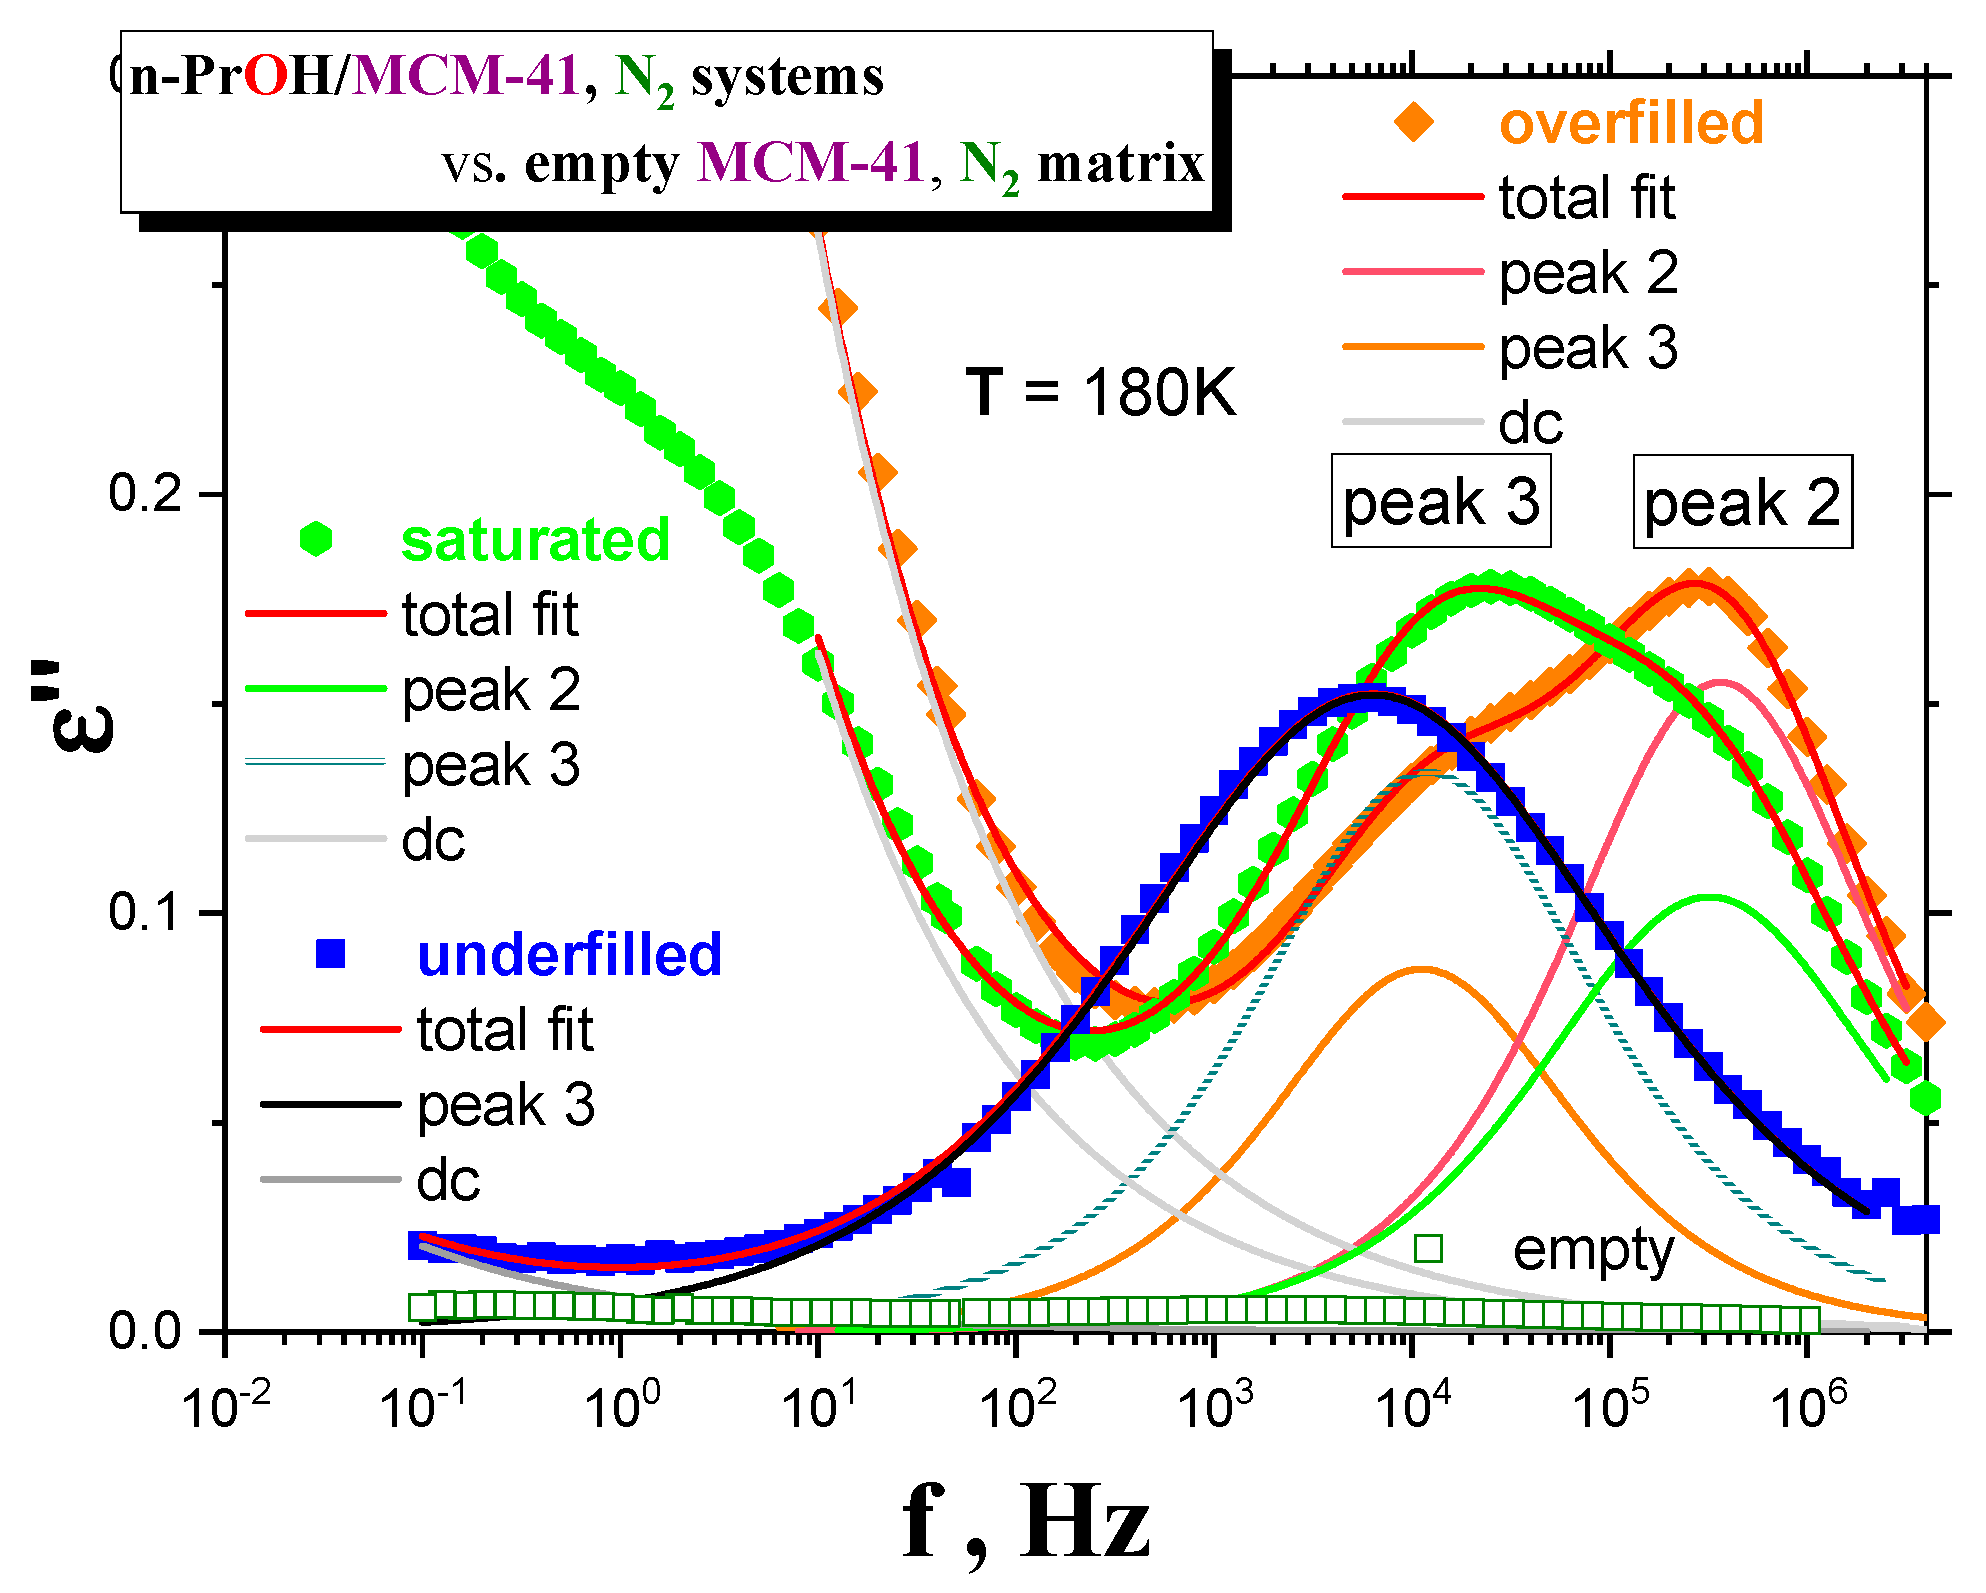
Dielectric spectra for the
most optimally treated
MCM-41 matrix and the confined
n-PrOH/MCM-41 systems were analyzed, using an additive model with the following relaxation function for the imaginary part of the dielectric permittivity ε″(ω):
The first term on the right-hand side of Equation (1) describes dielectric relaxation due to reorientation of molecules related to peaks i = 1, 2 and 3. We have adopted the Cole–Cole (CC) function [
7] for relaxation function for each component, where Δε
CC,
i and τ
CC,i represent a relaxation strength and characteristic times of ith dielectric relaxation with τ
max,i = τ
CC,i, respectively. The exponent α (0 ≤ α ≤ 1) is a measure of relaxation time distribution of τ
CC,i; when α = 1, the CC function reduces to the Debye (D) function with no distribution of τ
i. The last term is an “apparent” conductivity term accounting for dc-conductivity and additional Maxwell–Wagner–Sillar effects (MWS), due to the presence of multiple interphases.
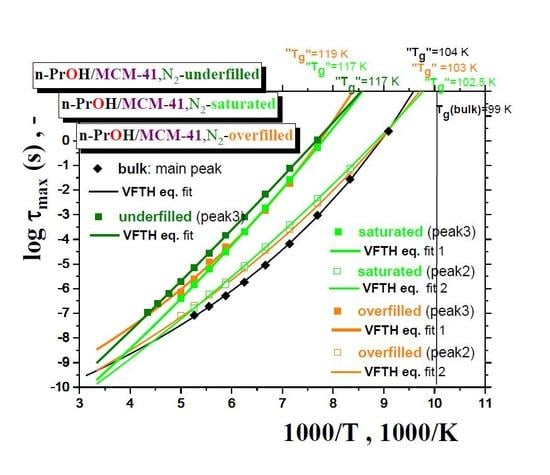
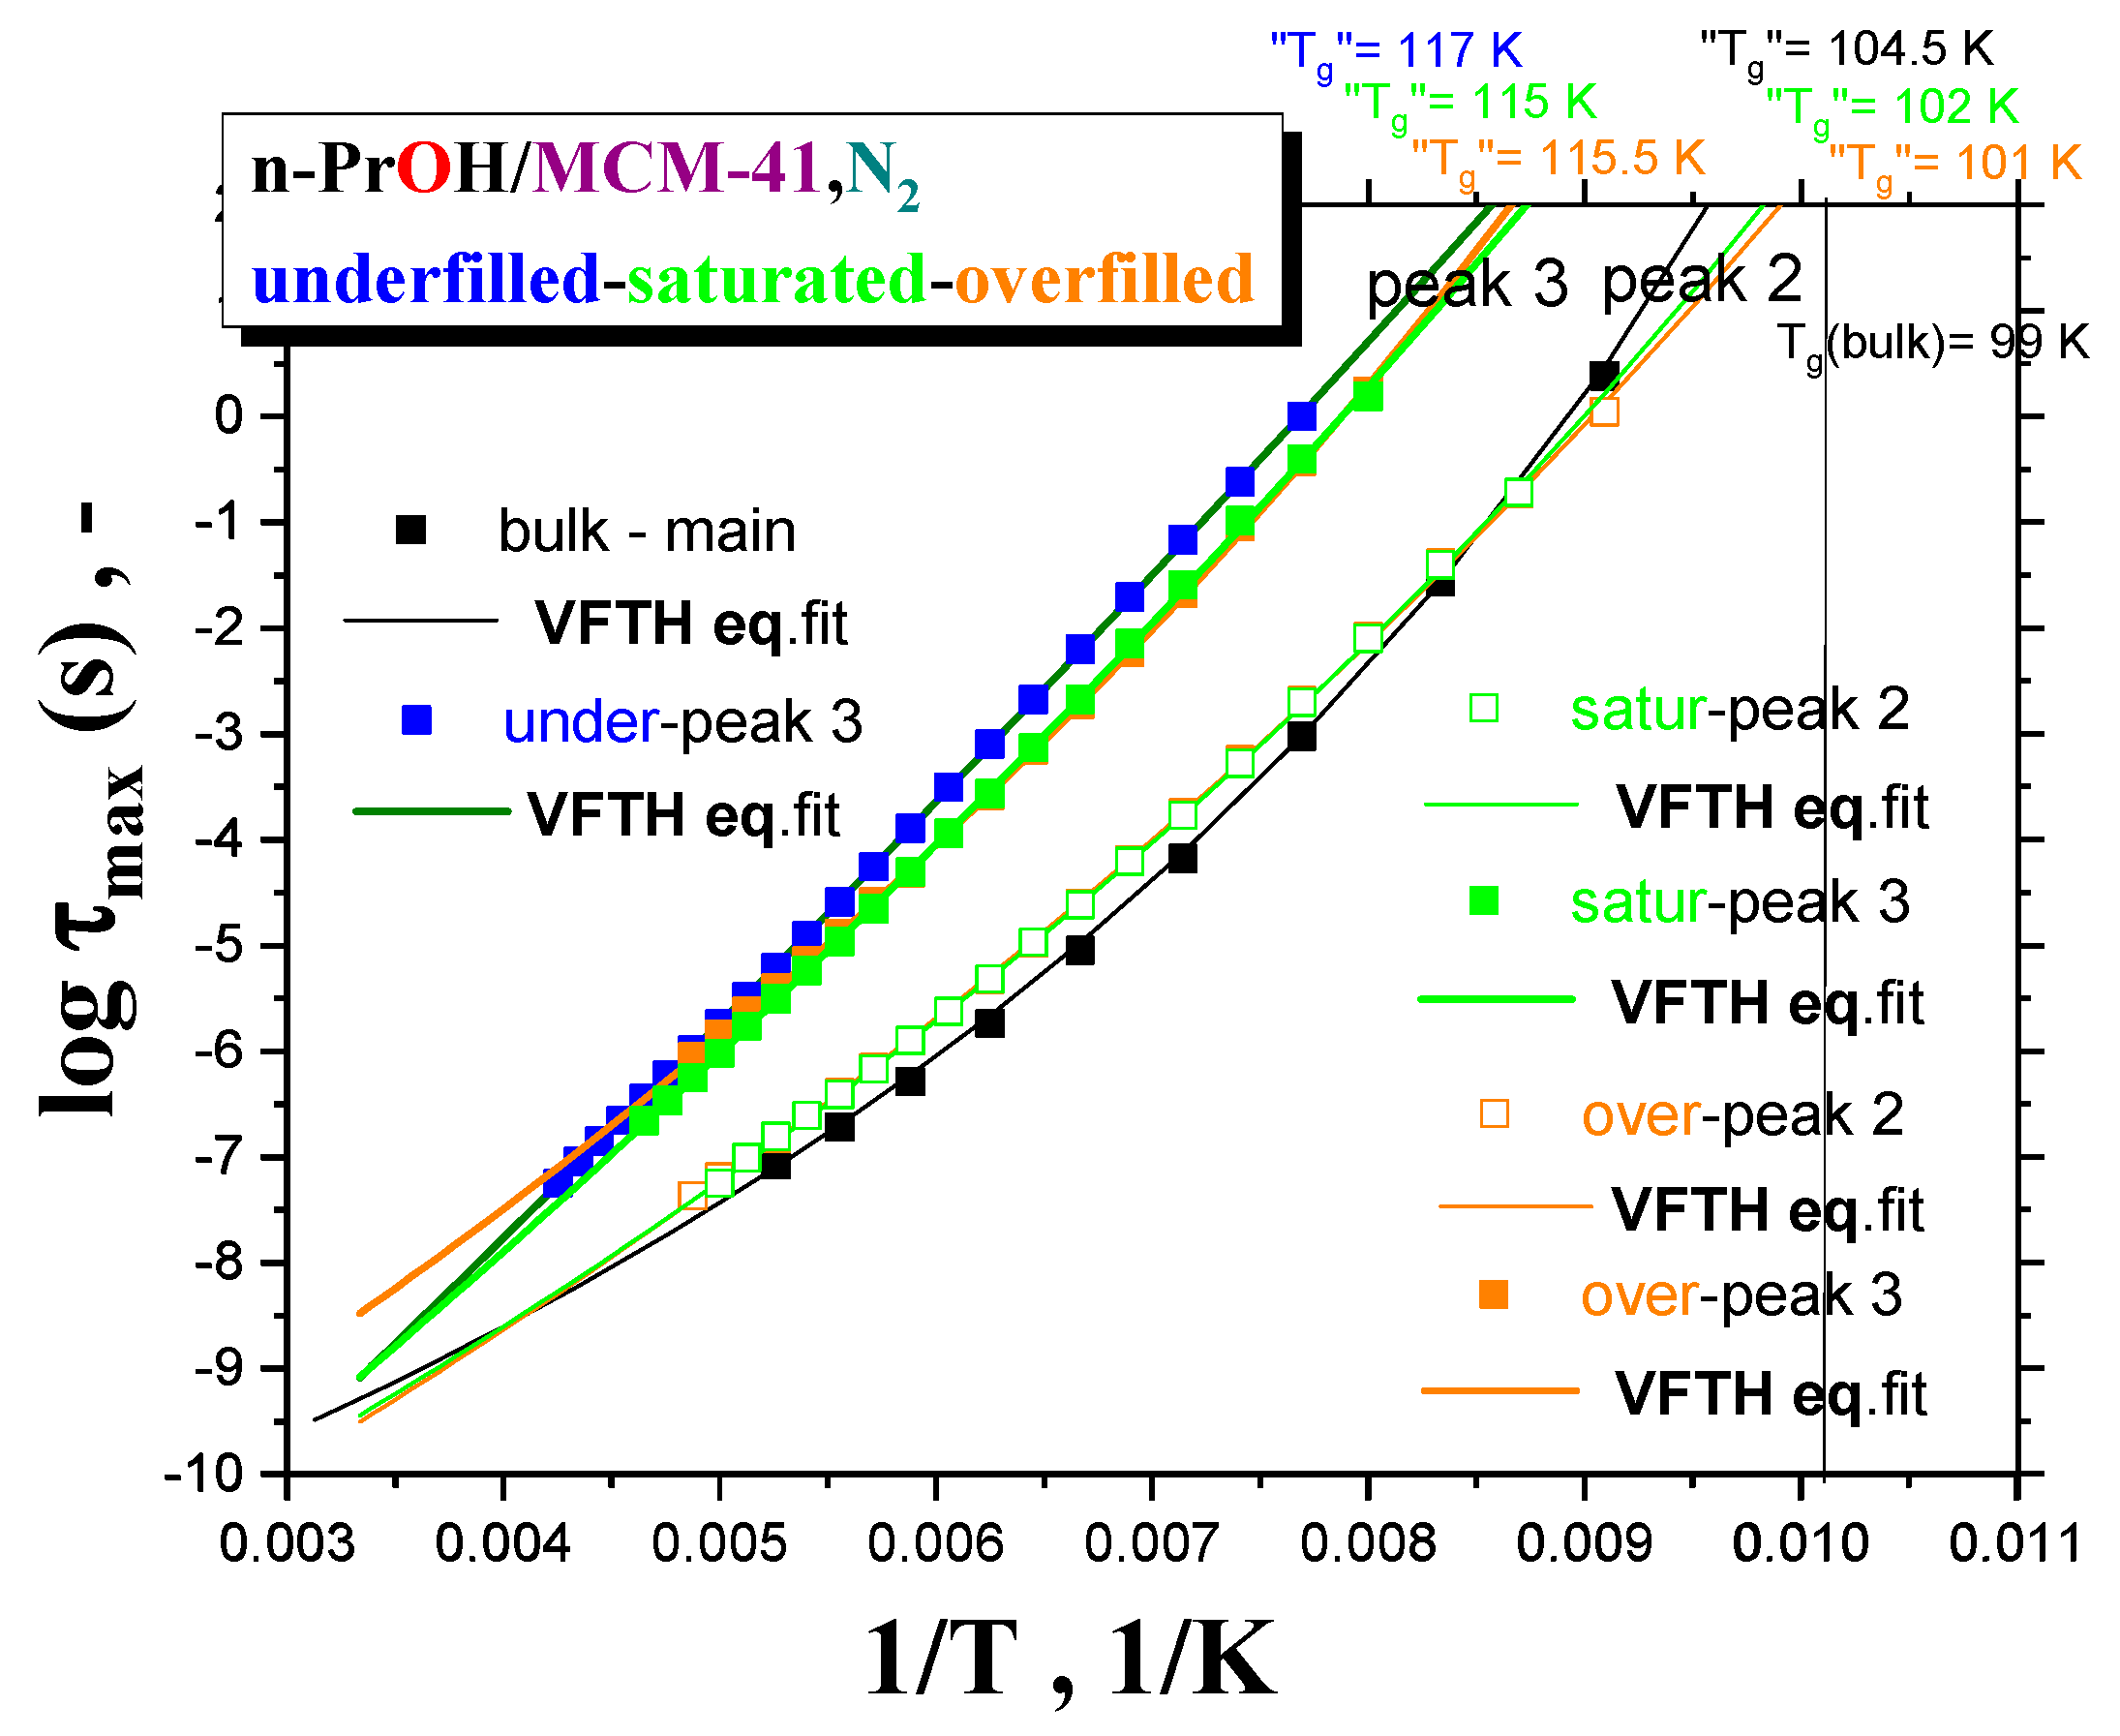
Figure 7 summarizes the maximum relaxation times,
τmax, for all the three
n-PrOH/MCM-41, N2 systems, as obtained from the detailed spectral fitting, using Equation (1), together with the peak maximum of the main peak (the so-called Debye relaxation) of the bulk
n-PrOH, as determined from the peak maxima. In all the bulk and confined cases, the non-Arrhenius character of the corresponding timescales of one or two main peaks (peaks 3 and 2) over the measured frequency range of the BDS technique is observed with the fitting parameters from the Vogel–Fulcher–Tamman–Hesse (VFTH) equation listed in
Table 2. In
Table 2, the fitting parameters from the Arrhenius equation for the secondary process (peak 1) in the confined states (data not plotted in
Figure 8) are also included together with those for the bulk state from the literature [
39,
40,
41].
Two groups of the timescales are clearly evident. The lower-frequency peak 3 appears in all the three confined underfilled, saturated and overfilled n-PrOH/MCM-41 systems, while in the former case, it is slower than in the remaining cases with the rather comparable timescales. On the other hand, the higher-frequency peak 2 is observable only in the saturated and overfilled n-PrOH/MCM-41 systems, with its frequency position lower, but quite close to that of the main peak in the bulk n-PrOH medium. Moreover, a slight difference does exist between the two confined cases in the spirit that the overfilled sample lies mostly in between the saturated n-PrOH/MCM-41 system and the bulk n-PrOH.
Further, short-range low-
T extrapolations of the corresponding VFTH equations provide the
pseudo glass transition temperatures, “
Tg”, operationally defined as the temperatures at which the peak maximum relaxation time reaches 100 s. In such a way determined “
Tg” values for two basic relaxations in the confined
n-PrOH/MCM-41 systems are as follows: “
Tg”(peak 3) = 116 ± 1 K and “
Tg”(peak 2) = 101.5 ± 0.5 K. The latter value is comparable with “
Tg”(bulk) = 104.5 K, as determined for the main peak in the bulk
n-PrOH medium. Note that, in the case of the bulk
n-PrOH, the main peak consists of the dominating, slower Debye process and the smaller and faster primary α relaxation, which correlates with the calorimetric and mechanical data. Consequently, this latter process is related to the
true glass transition temperature,
Tg(bulk) = 99 K, being lower than the
pseudo glass transition temperature, “
Tg”(bulk) = 104.5 K [
39,
46,
47,
48].
Figure 8a,b displays two further relaxation parameters, i.e., relaxation strengths, Δε
CC,i, and shape parameters, α
CC,i, of processes 3 and 2, as a function of temperature. By increasing the temperature, for the underfilled sample, the relaxation strength of process 3 remains quasi-constant. On the other hand, the mutually opposite trends in the relative strengths for processes 3 and 2 in the saturated and overfilled ones are observed. In particular, the corresponding quantities for process 3 decrease, while those for the process 2 increase with elevated temperature. Finally, the shape parameter gradually increases for the underfilled system, indicating the narrowing the relaxation-time distribution. As for the saturated and overfilled samples, a similar effect is found for the lower frequency process 3 with a quasi-saturation at higher-T region for the former, but with continuing narrowing for the later approaching that for the high-frequency process 2. As for the high-frequency process 2, for both the samples, the α
CC,i values are more or less close and quasi-constant with an increasing temperature.
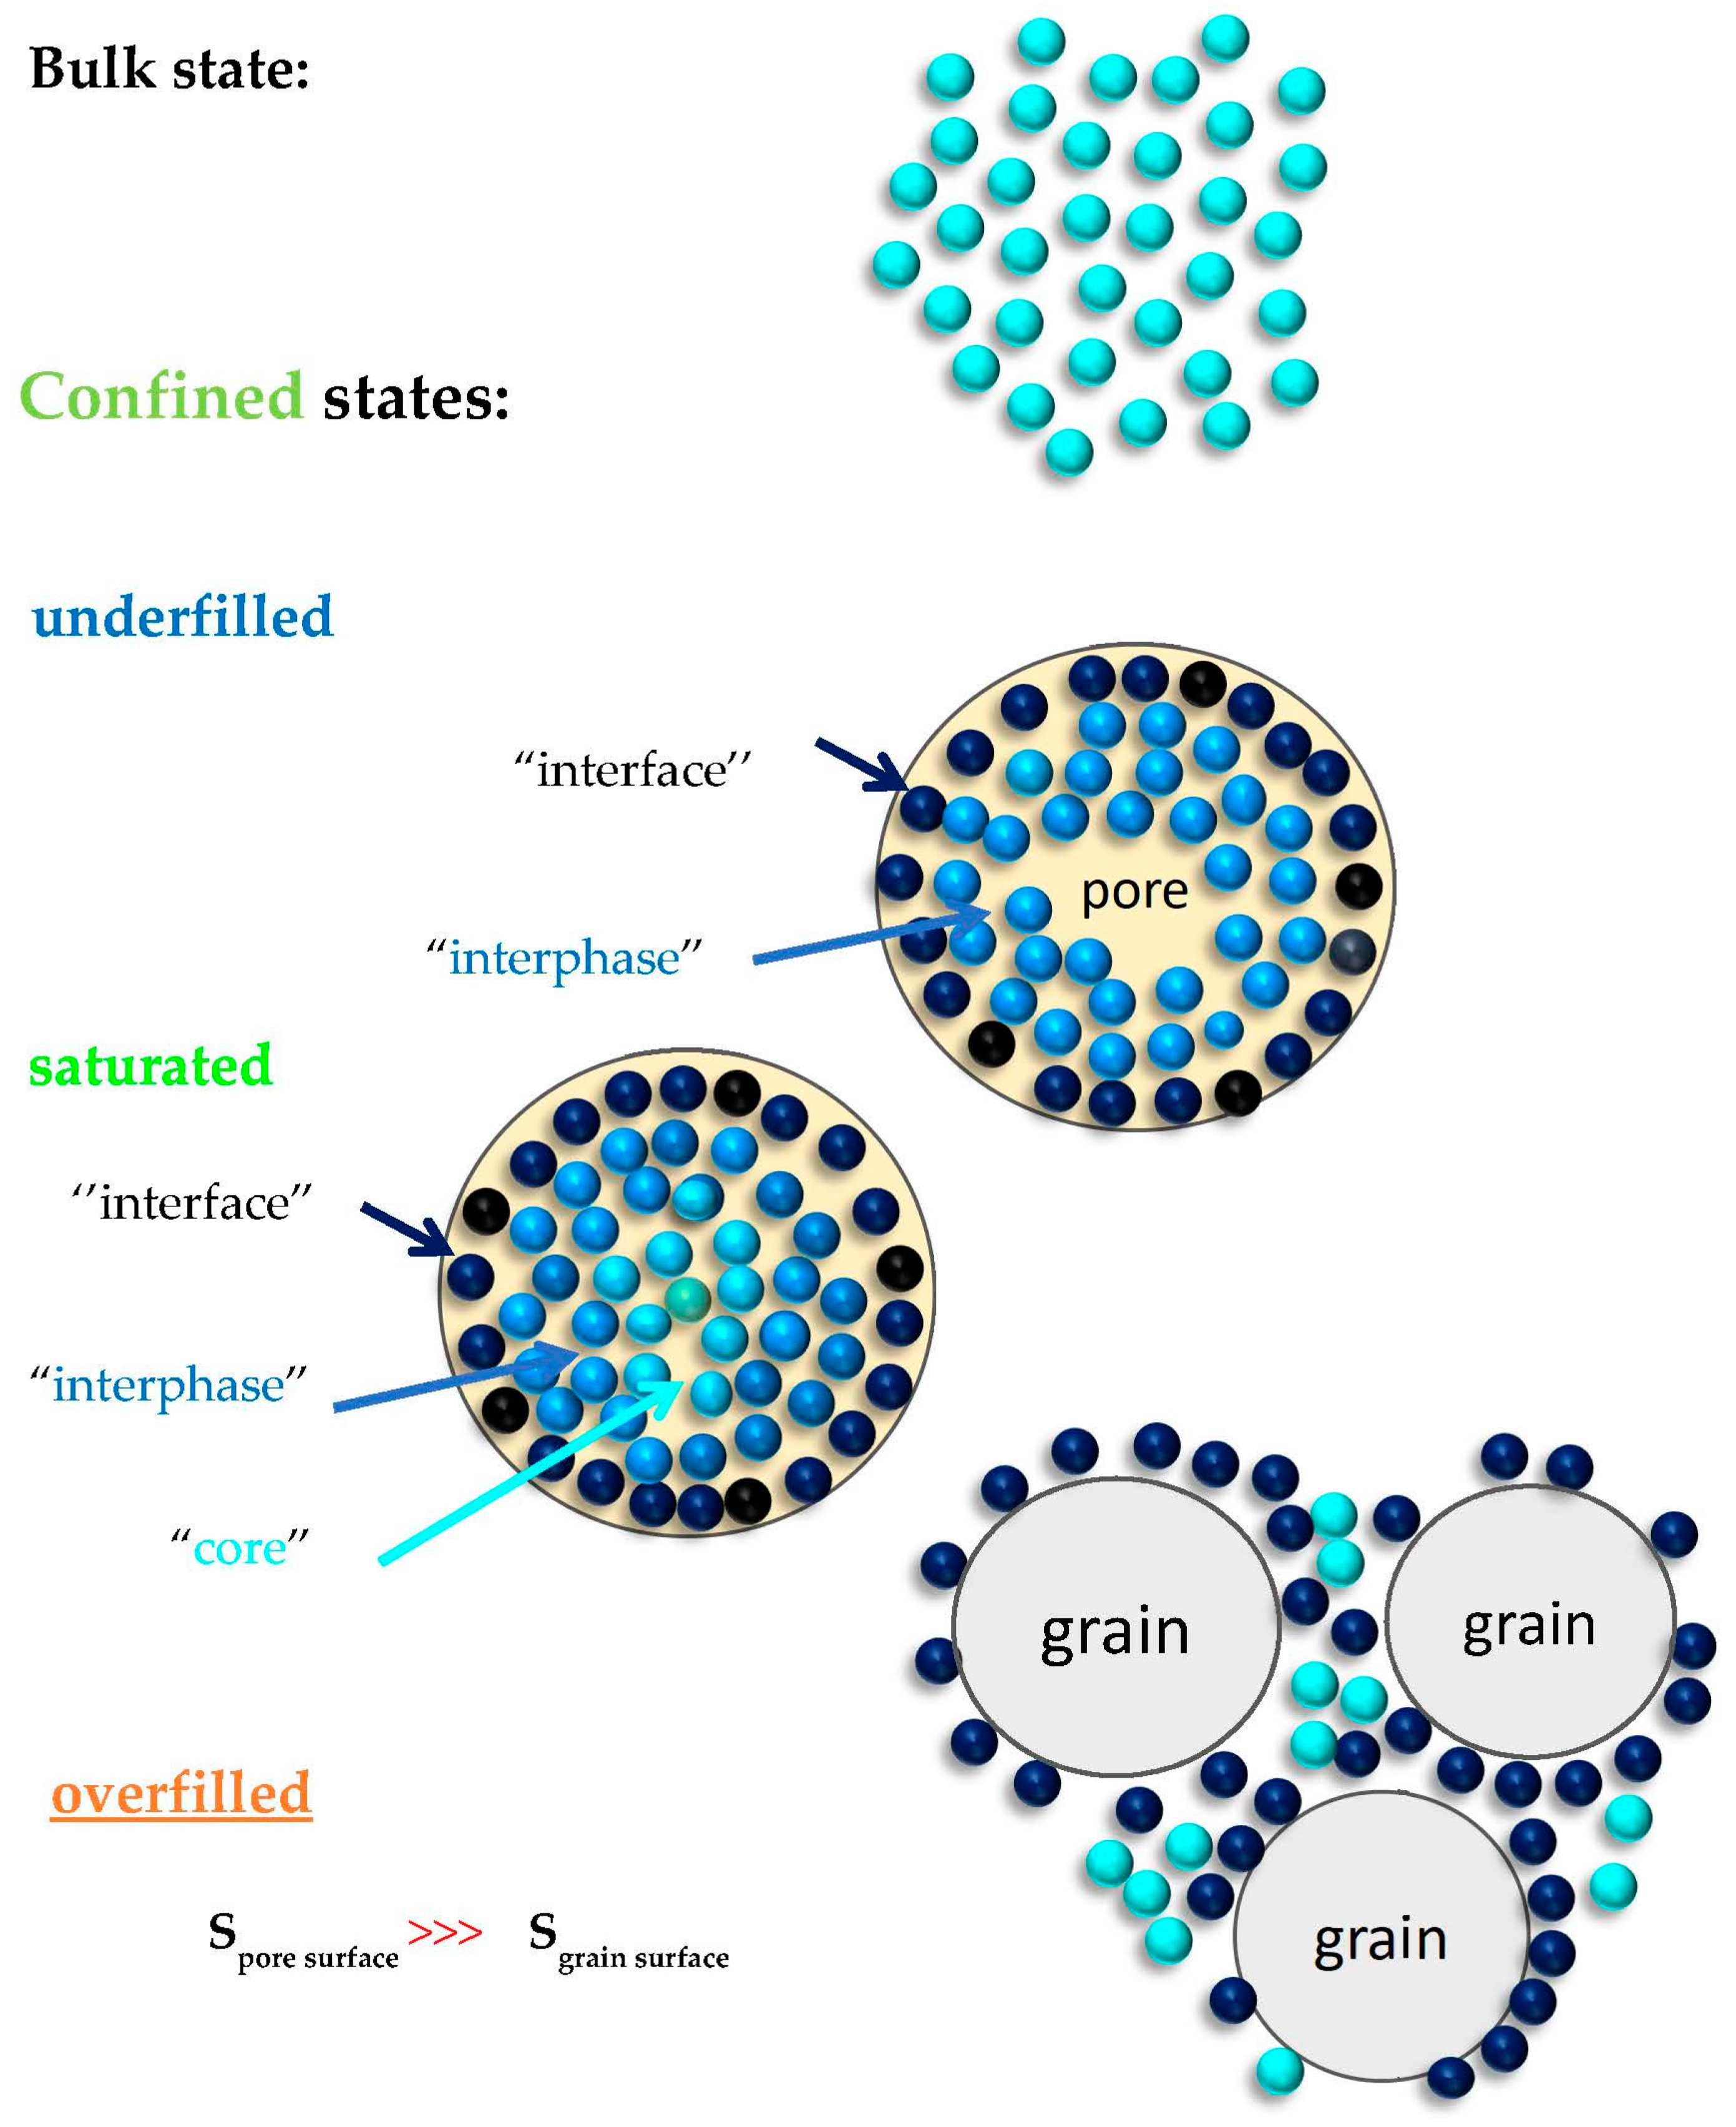
4. Discussion
On the basis of these experimental findings, we suggest the existence of one dynamic phase in the underfilled
samples, in contrast to the presence of two distinguishable dynamic ones in the saturated and overfilled
n-PrOH/MCM-41 systems almost independently on the preparation atmosphere. These distinct dynamic phases can be ascribed as follows (see also schematic heterogeneous dynamic model of protic polar
organic medium in polar
inorganic matrix in
Figure 9).
In the underfilled
n-PrOH/MCM-41 sample, the protic polar
n-PrOH molecules are localized at the polar wall of the pore surface due to their H-bonding interaction with the
silanol groups. Moreover, according to the very recent detailed systematic work, a series of the small molecular
alkanols ranging from
methanol to
octanol, also including
n-propanol, react with these surface silanol groups of the
MCM-41 matrix, even at room temperature, under forming the corresponding polar
alkoxy groups [
49]. Thus, the true
interface appears to contain three components, i.e., the rest adsorbed
H2O molecules, the intermolecularly
H-bonded
n-PrOH ones and the
alkoxy groups to the
silica surface. As our filling fraction of 0.24 exceeds the monomolecular layer case, i.e., true
interface sometimes called the contact layer, also the
adjacent layers of the
n-PrOH molecules named
interphase contribute to the dielectric response. This formation of one or a few layers adjacent to the contact layer is supported by the amphiphilic character of the
n-PrOH molecules, where the polar
hydroxyl group –
OH of the
n-PrOH medium are attached directly via
H-bonding to the polar
silanol groups and even covalently via
alkoxy groups ≡
SiO(CH2)
2CH3. On the other side, the apolar
propyl-
CH2CH2CH3 parts of the
n-PrOH molecules are directed into the pore, where it can preferentially interact with the same
propyl groups from the first adjacent layer. This probably gave rise to the more denser
interphase region with the higher orientational order which can be reduced in direction toward the central part of the pore of the
MCM-41 matrix. In addition to the overwhelming amount of
n-PrOH medium, the inevitable remaining
H2O molecules from the used drying procedure under
N2 atmosphere, as well as the potential
alkoxy groups, also contribute, to a minor extent, to the total spectrum, as evidenced from
Figure 2 and
Figure 5.
Next, for the almost saturated
n-PrOH/MCM-41 case, besides this combined
interface and
interphase slower regions, the additional faster dynamic component in the BDS spectra is attributed to the more distant
n-PrOH molecules from the pore surface which are localized in the central part, i.e., the so-called “core” region of the pore of the
MCM-41 matrix. As it is seen from
Figure 7, the
n-PrOH molecules in this central “core” region exhibit a somewhat slower dynamics compared to that in the bulk
n-PrOH medium, so that they exhibit the
bulk-like behavior.
Finally, in the overfilled
n-PrOH/MCM-41 system with f = 0.46, an exceeding part of the
n-PrOH medium over the saturated filling fraction 0.39 must be situated outside of the
MCM-41 grains. Consequently, while the dynamics of the
n-PrOH stemming from the confined part of the
n-PrOH in the intrapores is rather similar to that from the saturated case, the dynamics of the exceeding part of the
n-PrOH filler is a bit faster compared to the fully filled case, but still a bit slower than in the bulk
n-PrOH medium. This is also due to some contribution from the
n-PrOH molecules in the free space between the
MCM-41 grains which are partially bonded to the outer surface of the
MCM-41 grains. As the outer grain surface in the
MCM-41 matrix is essentially smaller than the inner pore surface within the pores of the
MCM-41 grains, the bounded
n-PrOH in this outer
interface (and eventually some
interphase) will contribute in significantly smaller extent, so that the higher relative intensity of peak 2 compared to peak 3 stems from the
n-PrOH medium in the intergrain (interpore) spaces with the
bulk-like behavior (
Figure 5 and
Figure 8).
The fact that process 2 is narrow and its shape does not change appreciably with temperature supports the interpretation of this process as originated by bulk-like n-PrOH molecules. Concerning the relative strength of processes 2 and 3 and their temperature dependence, it is consistent with the expectation that the number of molecules behaving as bulk-like increases with temperature due to an increase of mobility and a decrease of the size or number of cooperating molecules. Consistently, the strength of process 3 in the underfilled sample remains more or less constant, as in this sample, molecules just belong to the first monolayer interface and to interphase, and their number is too low to switch to a bulk-like behavior as temperature increases. In line with these observations, the T-dependence of the characteristic times of process 2 is more “fragile”, and process 3 becomes “stronger” the lower the n-PrOH content.
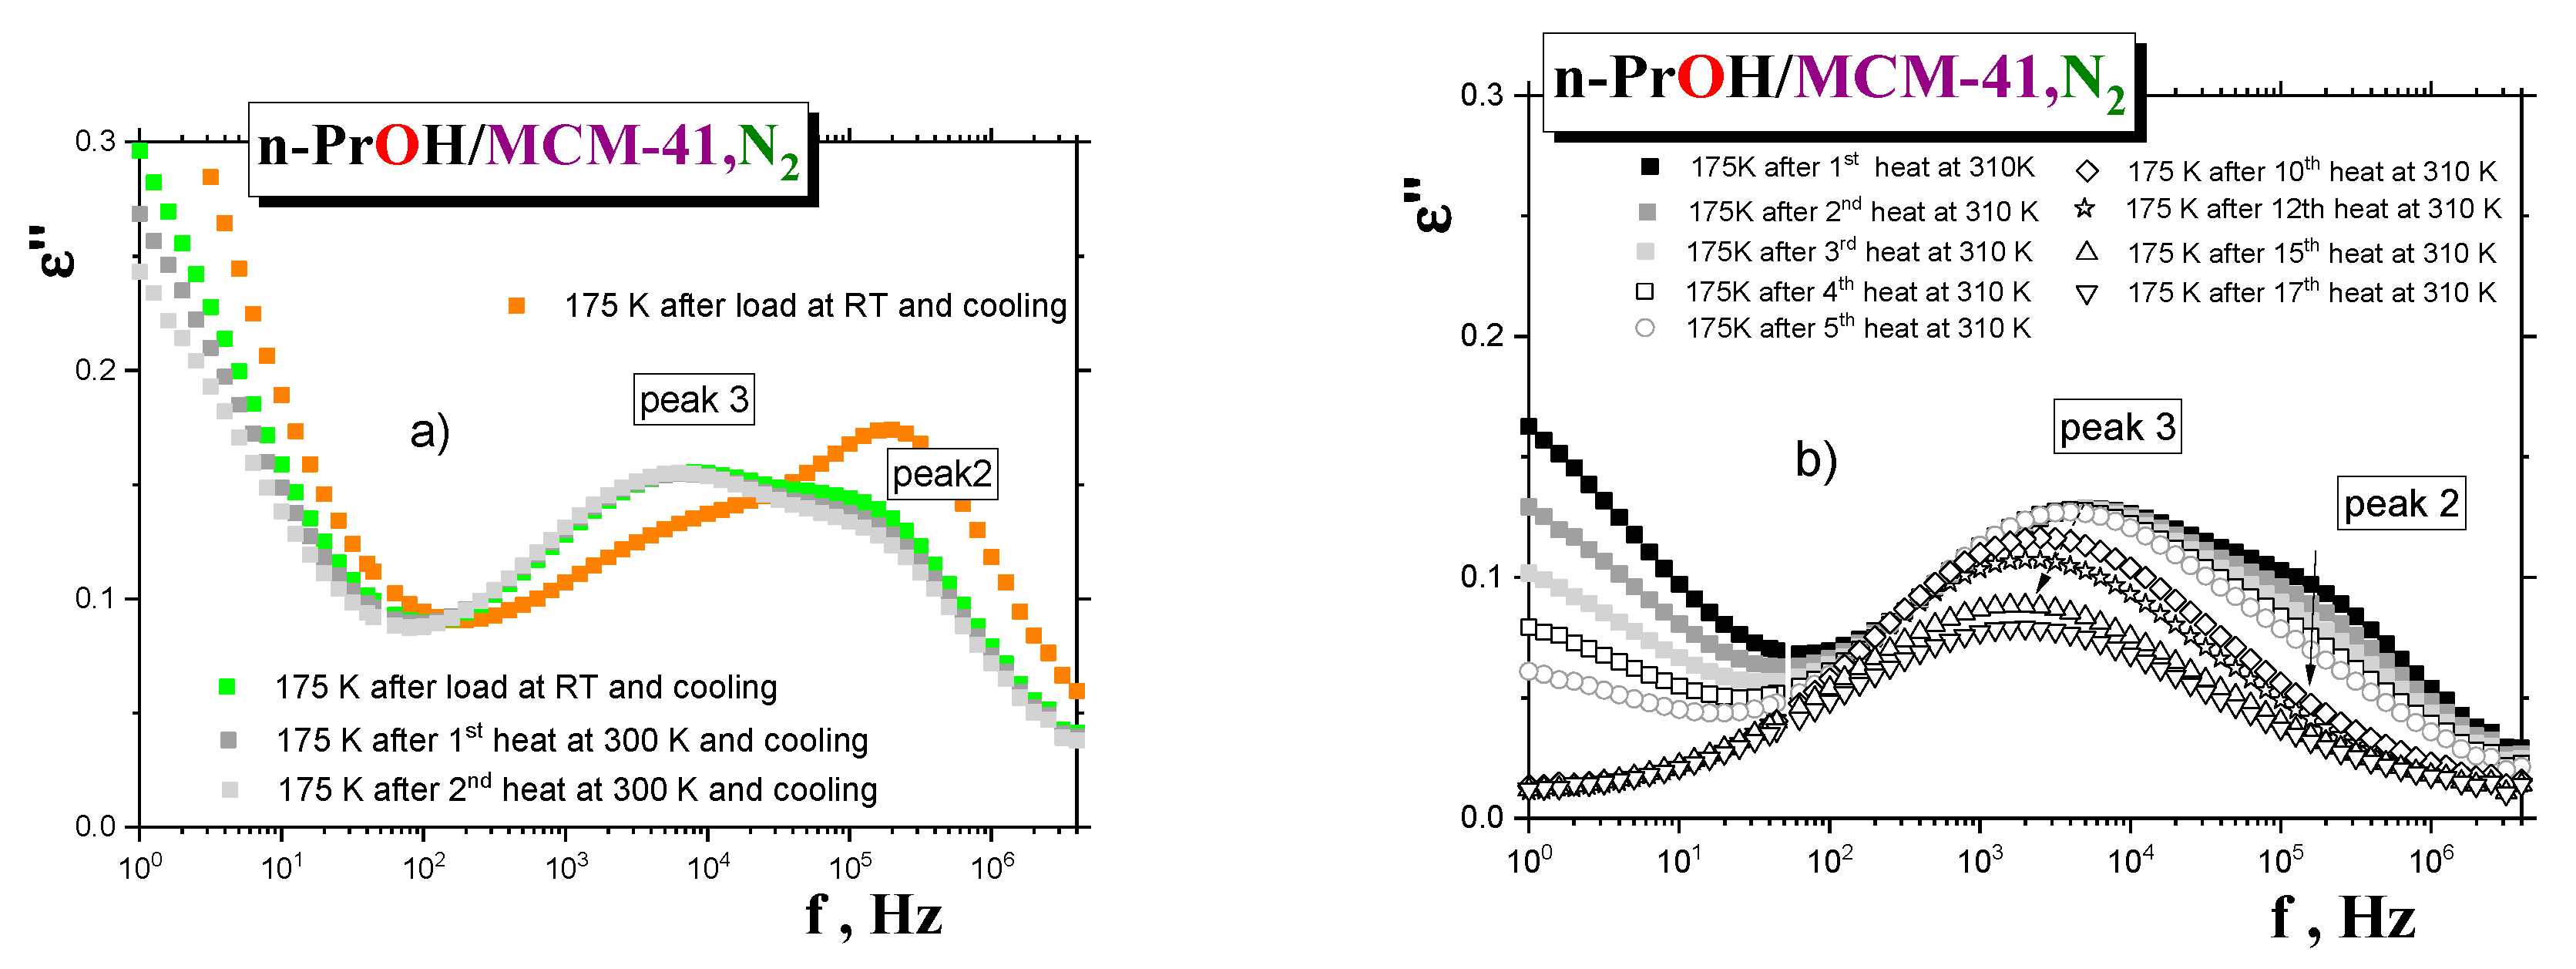
In connection with the aforementioned findings and their interpretation in terms of distinct dynamic phases, it is of interest to see how the BDS spectra of the saturated
n-PrOH/MCM-41, N2 sample evolves during simple gradual thermal treatment at 300 K, followed by that at 310 K, as performed directly in the BDS cell, i.e., during “drying”, the confined
n-PrOH/MCM-41,N2 system due to the release of the
n-PrOH medium. Figure 10a shows the spectral changes for the saturated
sample first cooled and measured at the selected temperature of 175 K (scan 1) and after two heatings that followed, for seven minutes, at 300 K. While peak 3 remains the same during all the heating cycles (scans 2 and 3), peak 2 at almost the same position decreased due to evaporation of the
n-PrOH medium from the central region of the pore of the
MCM-41 matrix, where the
n-PrOH molecules interact mutually by the weaker intermolecular forces than the
ones bounded directly to and being more adjacent to the polar surface wall of the pores of the
MCM-41 matrix. Comparison with the first scan of the overfilled
n-PrOH/MCM-41, N2 sample (
Figure 7) shows that the position of peak 3 is the same for both
samples. In contrast, peak 2 is more intense, indicating somewhat looser dynamics for this process in the overfilled
sample compared to the similar peak 2 in the saturated
sample. This would be evidence of the excess
n-PrOH medium localized outside the pores of the
MCM-41 matrix. Next, the temperature of this partially dried
sample was increased toward 310 K, and heating and cooling cycles were repeated 17 times, with subsequent detection of the spectra at 175 K (see
Figure 10b). As it can be seen, peak 2 is gradually fully eliminated, and peak 3 is also gradually reduced, with a slight shift toward the lower frequencies. Thus, all these observations appear to be consistent with the picture of two distinct dynamic phases and support the proposed schematic model in
Figure 9.

 ,
, 


