Abstract
This paper presents a comprehensive kinetic study of the catalytic pyrolysis of high-density polyethylene (HDPE) utilizing thermogravimetric analysis (TGA) data. Nine runs with different catalyst (HZSM-5) to polymer mass ratios (0.5, 0.77, and 1.0) were performed at different heating rates (5, 10, and 15 K/min) under nitrogen over the temperature range 303–973 K. Thermograms showed clearly that there was only one main reaction region for the catalytic cracking of HDPE. In addition, while thermogravimetric analysis (TGA) data were shifted towards higher temperatures as the heating rate increased, they were shifted towards lower temperatures and polymer started to degrade at lower temperatures when the catalyst was used. Furthermore, the activation energy of the catalytic pyrolysis of HDPE was obtained using three isoconversional (model-free) models and two non-isoconversional (model-fitting) models. Moreover, a set of 900 input-output experimental TGA data has been predicted by a highly efficient developed artificial neural network (ANN) model. Results showed a very good agreement between the ANN-predicted and experimental values (R2 > 0.999). Besides, A highly-efficient performance of the developed model has been reported for new input data as well.
1. Introduction
Plastic wastes have become an irritating worldwide issue particularly in many developed countries, where a massive quantity is produced and disposed of. The main source of plastic wastes is municipal solid wastes (MSW) [1]. Globally, most of the plastic wastes are either disposed of in landfills or incinerated [2]. While landfill disposal is still considered as undesired and expensive treatment, the waste destruction by incineration is also expensive and has problems with high emissions and thus environmental concerns.
Combustion as a primary recycling technique is used to treat plastic wastes, but it is still restricted by environmental legislation. However, plastic wastes reshaping, as a secondary recycling method, is limited to only 20 wt % plastic wastes [3].
Recently, research effort is more focused on tertiary recycling, by involving some sophisticated technology such as pyrolysis, gasification, and catalytic cracking in the recycling industries [3]. Pyrolysis has some advantages over the rest of waste disposal techniques because of its low volume products (gases, liquids, and char) that can be used as fuel and can be added to petroleum refinery feedstocks or act as chemical feedstocks [4,5]. However, pyrolysis needs to be achieved at high temperature to have the desired type of oil. To overcome this challenge, catalytic cracking is used to reduce the cracking temperature [6,7].
Pyrolysis of high-density polyethylene (HDPE), representing about 17.8% of MSW plastic waste, has attracted the attention of some researchers. Kinetic parameters such as activation energy was targeted to be obtained for the design purposes of industrial processes. Conesa et al. [8] studied the HDPE pyrolysis using isothermal and non-isothermal thermogravimetric analysis (TGA) data at heating rates of 5, 25, 50, and 100 K/min. The reported activation energy values were ranging between 185 and 221.5 kJ/mol.
Aboulkas et al. [9] studied the thermal decomposition of HDPE by Friedman, Flynn–Wall–Qzawa (FWO), and Kissinger–Akahira–Sunose (KAS) iso-conversional methods at 2, 10, 20, and 50 K/min. Activation energy values within the range of 238–247 kJ/mol were reported.
Chin et al. [10] examined the pyrolysis of HDPE using TGA data at 10–50 K/min heating rates and 323–1173 K temperature range. Activation energies were found within 242.13–278.14 kJ/mol.
Diaz Silvarrey and Phan [11] developed a kinetic model for the TGA pyrolysis of HDPE. They applied Málek, KAS, and linear model fitting to calculate the kinetic parameters. All their experiments were performed under an N2 atmosphere at 5, 10, 20, and 40 K/min heating rates, and temperature range of 303–973 K. They reported different values of activation energy by different methods (202.40 ± 9.47 kJ/mol and 375.59 ± 39.69 kJ/mol by KAS and Friedman methods, respectively).
Khedri and Elyasi [12] obtained the kinetics parameters of the pyrolysis of HDPE using non-isothermal and isothermal TGA data by model-free models at 40, 45, 50, and 55 K/min heating rates. The calculated activation energies were reported to heavily vary with conversion and used methods.
This study aims to obtain activation energy of the catalytic pyrolysis of HDPE at different catalyst to polymer ratios and heating rates using non-isothermal TGA data. Three isoconversional methods and two non-isoconversional models have been used. Additionally, a highly-efficient artificial neural network (ANN) model has been developed, for the first time, to predict the pyrolytic behavior of the catalytic cracking of HDPE.
2. Materials and Methods
2.1. Experimental Procedure
Catalytic cracking of HDPE using the HZSM-5 catalyst has been investigated. Polymer samples were obtained from Ipoh SY Recycle Plastic, Malaysia. The proximate and ultimate analysis of HDPE were conducted using PerkinElmer Simultaneous Thermal Analyzer (STA) 6000, and PerkinElmer 2400 Series II CHNS Elemental Analyzer, Waltham, MA, USA, respectively. The characterization data are presented in Table 1. HZSM-5 was obtained from zeolite (CBV3024E) in ammonia form (Alfa Aesar, Ward Hill, MA, USA) and then converted into hydrogen form by calcination at 823 K and 2 K/min heating rate for 2 h in a muffle furnace. The catalyst specifications and the experimental matrix details are shown in Table 2 and Table 3, respectively. The test samples have been prepared with different catalyst to polymer mass ratios (0.5, 0.77, and 1.0). The cracking studies were performed using Mettler Toledo TGA/SDTA851e (Polaris Parkway, Columbus, OH, USA) analyzer under 50 mL/min N2 as an inert gas. The results were evaluated with the V7.01 STARe software package. Heating rates of 5, 10, and 15 K/min were exerted. TGA equipment was used for the measurements in which the samples were heated from ambient temperature to 373 K for 5 min, and then heating continued to 523 K and was then held for 5 min. After that, heating continued to 973 K and the temperature was kept constant for another 5 min.

Table 1.
Ultimate and proximate analysis of high-density polyethylene (HDPE).
Table 2.
Specifications of HZSM-5 Catalyst.
Table 3.
Experimental matrix.
2.2. Kinetic Theory
For most kinetics, the rate of reaction (r) can be expressed as [13,14]:
where is conversion, t is time, A is the pre-exponential factor, E is the activation energy, R is the universal gas constant, T is temperature, and n is the reaction order. Conversion can be calculated as follows:
where:
- wo: is the weight of the sample at t = 0,
- w: is the weight of the sample at t = t,
- wf: is the weight of the sample at the experiment end.
Kinetic triple parameters can be obtained from TGA data using some models derived from Equation (1). The published models use either multiple TGA at different heating rates (called isoconversional or model-free methods) or one single TGA data (called non-isoconversional or model-fitting methods). Kinetic equations of some of the widely used isoconversional and non-isoconversional models (for first-order reactions) are shown in Table 4.
Table 4.
Equations of the selected models [14].
2.3. Artificial Neural Network (ANN) Modeling
To model an engineering process, a model must be developed based on available data, and then the model parameters are estimated. However, this is not an easy task especially for complex systems with non-linear relations. Alternatively, the artificial neural network (ANN) modeling can be a promising preferred tool to be used.
An ANN topology has three layers (input, output, and hidden layers of neurons) with different functions. Each layer has a bias vector (weight matrix) and an output vector [15]. Process variables must be fixed initially, and the available data must be representative and fall within the defined variable margin.
Additionally, the ANN architecture consists of several connected layers with their transfer functions. The best network architecture depends on the type of the represented problem. For high performance of ANN-prediction, a genetic algorithm is applied to optimize the ANN parameters such as the number of hidden layers, the number of neurons in each hidden layer, and the momentum and learning rates [14,16].
Recently, some researchers have developed ANN models to predict the pyrolytic behavior of the thermal decompositions of some materials using TGA data [14,17,18,19,20,21,22]. However, in this work, a highly-efficient ANN model is aimed to be developed to predict, for the first time, the catalytic pyrolysis of HDPE. The following statistical parameters are used to evaluate the performance of the developed ANN-model [14,16,23]:
where (W %)est, (W %)exp, and are the ANN model-estimated, experimental, and average values of mass left %, respectively.
3. Results and Discussion
3.1. Kinetics Study of Catalytic Pyrolysis of HDPE
Figure 1, Figure 2 and Figure 3 represent the thermogravimetric analysis (TGA), derivative thermogravimetric (DTG) and conversion curves of the pyrolysis of HDPE at different heating rates and catalyst to polymer ratio, respectively. Both DTG and conversion curves were obtained from the thermogravimetric (TG) data and conversion was calculated using Equation (2). Generally, as the heating rate increases, both DTG and conversion curves are shifted to the right (towards higher temperatures) which implies higher on-set, end-set, and decomposition peak temperatures. On the other hand, both curves are shifted to the left (towards lower temperatures) and polymer starts to degrade at lower temperatures when the catalyst is used due to the polymer catalytic cracking process.
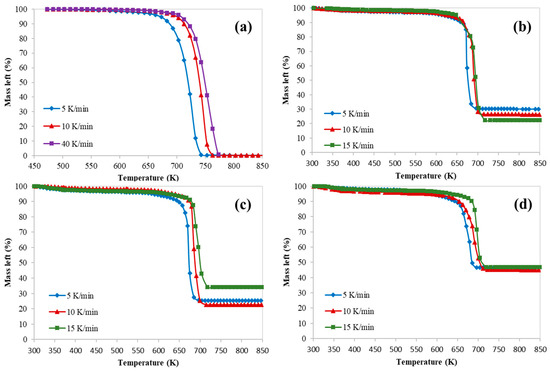
Figure 1.
Thermogravimetric analysis (TGA) curves of catalytic pyrolysis of HDPE at different catalyst to polymer mass ratio: (a) 0, (b) 0.5, (c) 0.77, and (d) 1.
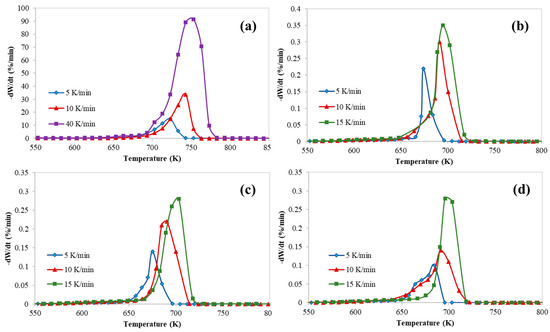
Figure 2.
Derivative thermogravimetric (DTG) thermograms of catalytic pyrolysis of HDPE at different catalyst to polymer mass ratio: (a) 0, (b) 0.5, (c) 0.77, and (d) 1.
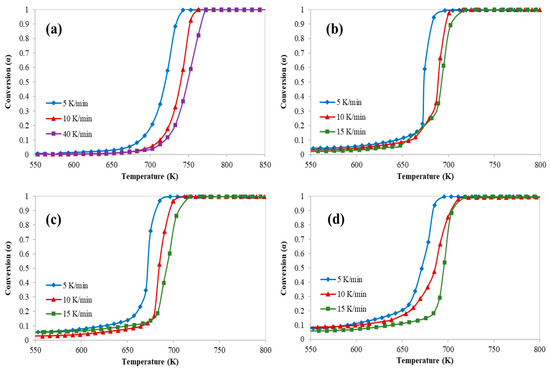
Figure 3.
Conversion curves of catalytic pyrolysis of HDPE at different catalyst to polymer mass ratio: (a) 0, (b) 0.5, (c) 0.77, and (d) 1.
In addition, these figures show clearly that there was only one main reaction region for the catalytic cracking of HDPE which is in a full agreement with the available literature [10]. However, the process of catalytic cracking of HDPE cannot be considered as an elementary reaction, whereas the kinetic parameters derived from TGA are obtained only for a short range of temperatures which represents only the range where the decomposition starts passing through the temperature of the maximum decomposition rate.
Figure 4 clearly shows the effect of the quantity of the used catalyst with respect to the tested polymer at different heating rates (5, 10, and 15 K/min). As the catalyst to polymer ratio increased the conversion increased (as shown in Figure 3) but a lower cracking activity (lower peak temperature) was observed, and the effect of the catalyst mass diminished with increasing the heating rate.
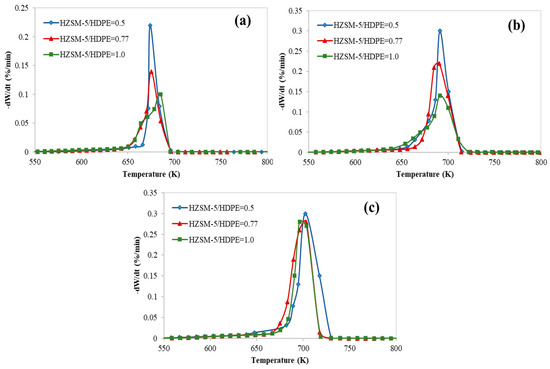
Figure 4.
DTG curves at different heating rates: (a) 5 K/min, (b) 10 K/min, and (c) 15 K/min.
Table 5 summarizes characteristic temperatures (Tonset, T5%, Tpeak, and Tendset) along with mass loss and residue percentages of the pyrolysis of HDPE at different catalyst to polymer ratios.
Table 5.
Thermogravimetric analysis data.
Table 6 presents the obtained values of activation energy (E) using three isoconversional (Friedman, FWO, and KAS) methods. These tables represent only data for the high conversion range (0.5–0.9) because of the low accuracy of the obtained values at low conversions [24]. In addition, Table 7 represents the activation energy data calculated by two non-isoconversional models (Arrhenius and Coat–Redfern).
Table 6.
Activation energies calculated by isoconversional models.
Table 7.
Activation energies calculated by non-isoconversional models.
The activation energy values, calculated by Friedman, FWO, and KAS at different conversions, shared the same trend as a function of the catalyst to polymer ratio. Additionally, it has been observed that E values calculated by the Friedman model at different catalyst to polymer ratios were the lowest and those obtained by FWO were the highest. However, the KAS model produced intermediate values with the highest R2. Different ranges of activation energy values were observed, expected, and reported (see [11,12]) and it depends on the used method. However, as expected by theory, the activation energy of the catalytic thermal decomposition of HDPE is still lower than that of pure HDPE [25,26]. Al-Salem et al. [27] attributed the decrease in the activation energy value to the effect of acid-base of the catalyst. The estimated apparent activation energy for catalytic and thermal cracking of HDPE from different sources fall within the range of 206–445 kJ/mol [27].
However, the average E values obtained by two non-isoconversional models were close. In addition, the effect of heating rate was dominating at low catalyst to polymer ratio and E values increased as heating increased. However, at high catalyst to polymer ratio, the effect of catalyst was dominating, and E values almost decreased as the ratio increased. Generally, E values increase as heating rate increases [28], and using catalysts increases the reaction rate and provides an opportunity for the reaction to occur at lower activation energy [29].
3.2. Prediction of Catalyst Pyrolysis by ANN Model
The TGA data of the catalytic pyrolysis of HDPE was targeted to be predicted by a developed highly-efficient ANN model. In the current study, an ANN model with a feed-forward back-propagation neural network (FFBPNN) scheme has been developed to predict the mass left % based on 900 experimental data points. While heating rate, temperature, and HZSM-5/HDPE mass ratio were the input variables, the mass left % was the output parameter of the network. The whole datasets were arbitrarily divided into three sets as follows: 70% (630 datasets) for training, 15% (135 datasets) for validation, and 15% (135 datasets) for testing.
Since the number of input and output layers neurons are fixed, the number of the neurons of the hidden layer is the controlled variable in predicting the performance and the accuracy of the ANN model. Besides, while little number of neurons will lead to the underfitting, which may lead to increase the training error of ANN, too many neurons may cause long time training where new datasets cannot be predicted (overfitting) [30,31].
Table 8 shows the prediction performance of different ANN structures with different numbers of neurons, hidden layers, and transfer functions. The most efficient network structure has been selected based on the value of R2. Additionally, mean square error (MSE) has been included as the second criterion.
Table 8.
Prediction performance of different artificial neural network (ANN)-architecture.
The ANN topology of the selected model (ANN11), shown in Figure 5, has two hidden layers with 10 neurons and tansig-logsig transfer functions. Although the Levenberg–Marquardt algorithm was used, other algorithms such as the scaled conjugate gradient and Bayesian regularization were tested as well. As shown in Figure 6, a very good agreement between ANN-predicted and experimental results has been observed.
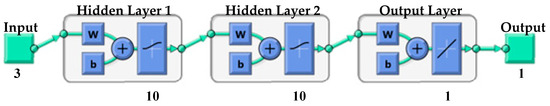
Figure 5.
Topology of the selected network.
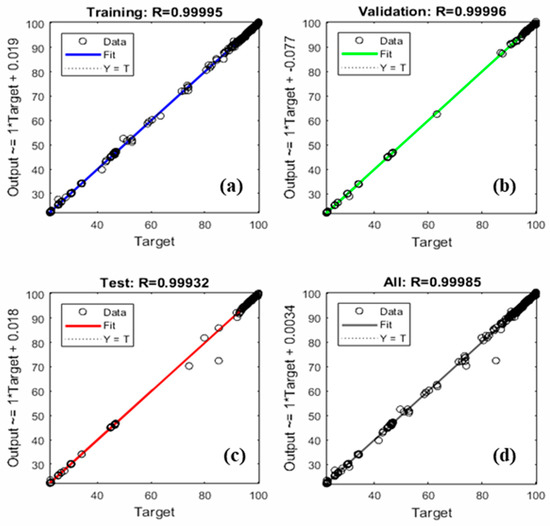
Figure 6.
Regression plots of (a) training data, (b) validation data, (c) test data, and (d) complete data set of the selected ANN model.
Then, the performance of the selected model was evaluated by different statistical parameters such as R2, MAE, RMSE, and MBE. Table 9 lists the values of these parameters. The high value of R2 along with very low values of MAE, RMSE, and MBE indicates a high-efficient performance of the selected model [14].
Table 9.
Statistical parameters of the ANN11 model.
After that, new 45 datasets were tested by the selected model (NN-3-10-10-1) as shown in Table 10 and Figure 7 clearly shows the high performance of the selected network (See Table 11 as well).
Table 10.
ANN-predicted results of the new input data.
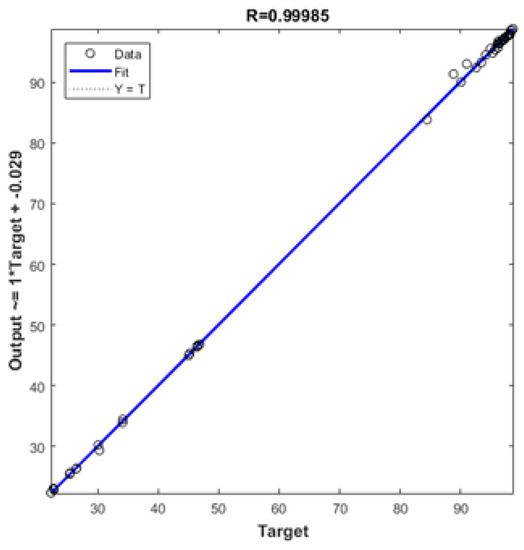
Figure 7.
Regression of simulated data for the selected ANN model.
Table 11.
Statistical parameters of the ANN12 model for the newly tested data.
4. Conclusions
Thermograms of the catalytic pyrolysis of HDPE showed the same shapes and trends at different HZSM-5/HDPE mass ratios and heating rates. Additionally, one reaction region, which can be fitted linearly, was observed and thermal degradation occurred at lower temperatures when the catalyst was used.
In this study, TGA kinetics data was modeled by two methods: using five isoconversional/non-isoconversional models, and a developed highly-efficient ANN model.
In the first method, the activation energy of the catalytic thermal decomposition of HDPE was calculated by Friedman, FWO, KAS, Coats–Redfern, and Arrhenius models at different heating rates and catalyst to polymer ratios.
In the second method, a highly-efficient ANN model, with two hidden layers, and Tansig-Logsig transfer functions, has been developed. Then, new input datasets have been predicted by the proposed ANN structure with a very high value of R2 (>0.9998) and very low RMSE, MAE, and MBE. This indicates the capability of the developed model to efficiently predict the non-isothermal TGA data of the catalytic thermal cracking of HDPE.
Author Contributions
Both authors contributed significantly to the completion of this article, but they had different roles in all aspects. Conceptualization, M.A.-Y., and I.D.; Data curation, I.D.; Formal analysis, M.A.-Y. and I.D.; Funding acquisition, M.A.-Y.; Investigation, M.A.-Y. and I.D.; Methodology, M.A.-Y., and I.D.; Project administration, M.A.-Y.; Software, I.D.; Validation, M.A.-Y.; Visualization, M.A.-Y.; Writing—original draft, I.D.; Writing—review & editing, M.A.-Y. All authors have read and agreed to the published version of the manuscript.
Funding
This research and the APC were funded by Deanship of Scientific Research (DSR) at King Faisal University (KFU) in Al-Ahsa, Saudi Arabia under the Research Group Support Track (Grant No. 17122013).
Acknowledgments
The authors acknowledge the Deanship of Scientific Research at King Faisal University (KFU) in Al-Ahsa for the financial support under the Research Group Support Track (Grant No. 1722013). Additionally, the authors would like to thank the Chemical Engineering Department at the University of Science Malaysia for the use of its lab. facilities.
Conflicts of Interest
The authors declare no conflict of interest.
References
- Cardona, S.C.; Corma, A. Tertiary recycling of polypropylene by catalytic cracking in a semi-batch stirred reactor. Appl. Catal. B 2000, 25, 151–162. [Google Scholar] [CrossRef]
- Miskolczi, N.; Bartha, L.; Dea’k, G. Thermal degradation of polyethylene and polystyrene from the packaging industry over different catalysts into fuel-like feedstocks. Polym. Degrad. Stabil. 2006, 91, 517–526. [Google Scholar] [CrossRef]
- Arandes, J.; Abajo, I.; Lopez-Valerio, D.; Fernandez, I.; Azkoiti, M.J.; Olazar, M.; Bilbao, J. Transformation of several plastic wastes into fuels by catalytic cracking. Ind. Eng. Chem. Res. 1997, 36, 4523–4529. [Google Scholar] [CrossRef]
- Chen, D.; Yin, L.; Wang, H.; He, P. Pyrolysis technologies for municipal solid waste: A review. Waste Manag. 2014, 34, 2466–2486. [Google Scholar] [CrossRef]
- Kaminsky, W.; Schlesselmann, B.; Simon, C.M. Thermal degradation of mixed plastic waste to aromatic and gas. Poly. Degrad. Stab. 1996, 53, 189–197. [Google Scholar] [CrossRef]
- Aguado, J.; Serrano, D.P.; Miguel, G.S.; Castro, M.C.; Madrid, S. Feedstock recycling of polyethylene in a two-step thermo-catalytic reaction system. J. Anal. Appl. Pyrolysis 2007, 79, 415–423. [Google Scholar] [CrossRef]
- Jan, M.R.; Shah, J.; Gulab, H. Catalytic conversion of waste high-density polyethylene into useful hydrocarbons. Fuel 2013, 105, 595–602. [Google Scholar] [CrossRef]
- Conesa, J.A.; Marcilla, A.; Font, R.; Caballero, J.A. Thermogravimetric studies on the thermal decomposition of polyethylene. J. Anal. Appl. Pyrolysis 1996, 36, 1–15. [Google Scholar] [CrossRef]
- Aboulkas, A.; el Harfi, K.; Bouadili, A. Thermal degradation behaviors of polyethylene and polypropylene. Part I Pyrolysis Kinet. Mech. Energy Convers. Manag. 2010, 51, 1363–1369. [Google Scholar] [CrossRef]
- Chin, B.L.F.; Yusup, S.; Al Shoaibi, A.; Kannan, P.; Srinivasakannan, C.; Sulaiman, S.A. Kinetic studies of co-pyrolysis of rubber seed shell with high-density polyethylene. Energy Convers. Manag. 2014, 87, 746–753. [Google Scholar] [CrossRef]
- Silvarrey, L.S.D.; Phan, A.N. Kinetic study of municipal plastic waste. Int. J. Hydrog. Energy 2016, 41, 16352–16364. [Google Scholar] [CrossRef]
- Khedri, S.; Elyasi, S. Kinetic analysis for thermal cracking of HDPE: A new isoconversional approach. Polym. Degrad. Stabil. 2016, 129, 306–318. [Google Scholar] [CrossRef]
- Chan, J.H.; Balke, S.T. The thermal degradation kinetics of polypropylene: Part III. Thermogravimetric analyses. Polym. Degrad. Stab. 1997, 57, 135–149. [Google Scholar] [CrossRef]
- Dubdub, I.; Al-Yaari, M. Pyrolysis of low-density polyethylene: Kinetic study using TGA data and ANN prediction. Polymers 2020, 12, 891. [Google Scholar] [CrossRef] [PubMed]
- Quantrille, T.E.; Liu, Y.A. Artificial Intelligence in Chemical Engineering; Elsevier Science: Amsterdam, The Netherlands, 1992. [Google Scholar]
- Govindan, B.; Jakka, S.C.B.; Radhakrishnan, T.K.; Tiwari, A.K.; Sudhakar, T.M.; Shanmugavelu, P.; Kalburgi, A.K.; Sanyal, A.; Sarkar, S. Investigation on kinetic parameters of combustion and oxy-combustion of calcined pet coke employing thermogravimetric analysis coupled to artificial neural network modeling. Energy Fuels 2018, 32, 3995–4007. [Google Scholar] [CrossRef]
- Conesa, J.A.; Caballero, J.A.; Reyes-Labarta, A.J. Artificial neural network for modeling thermal decompositions. J. Anal. Appl. Pyrolysis 2004, 71, 343–352. [Google Scholar] [CrossRef]
- Yıldız, Z.; Uzun, H.; Ceylan, S.; Topcu, Y. Application of artificial neural networks to co-combustion of hazelnut husk–lignite coal blends. Bioresour. Technol. 2016, 200, 42–47. [Google Scholar] [CrossRef]
- Çepelioğullar, Ö.; Mutlu, I.; Yaman, S.; Haykiri-Acma, H. A study to predict pyrolytic behaviors of refuse-derived fuel (RDF): Artificial neural network application. J. Anal. Appl. Pyrolysis 2016, 122, 84–94. [Google Scholar] [CrossRef]
- Charde, S.J.; Sonawane, S.S.; Sonawane, S.H.; Shimpi, N.G. Degradation kinetics of polycarbonate composites: Kinetic parameters and artificial neural network. Chem. Biochem. Eng. Q. 2018, 32, 151–165. [Google Scholar] [CrossRef]
- Chen, J.; Xie, C.; Liu, J.; He, Y.; Xie, W.; Zhang, X.; Chang, K.; Kuo, J.; Sun, J.; Zheng, L.; et al. Co-combustion of sewage sludge and coffee grounds under increased O2/CO2 atmospheres: Thermodynamic characteristics, kinetics, and artificial neural network modeling. Bioresour. Technol. 2018, 250, 230–238. [Google Scholar] [CrossRef]
- Naqvi, S.R.; Tariq, R.; Hameed, Z.; Ali, I.; Taqvi, S.A.; Naqvi, M.; Niazi, M.B.K.; Noor, T.; Farooq, W. Pyrolysis of high-ash sewage sludge: Thermo-kinetic study using TGA and artificial neural networks. Fuel 2018, 233, 529–538. [Google Scholar] [CrossRef]
- Halali, M.A.; Azari, V.; Arabloo, M.; Mohammadi, A.H.; Bahadori, A. Application of a radial basis function neural network to estimate pressure gradient in water–oil pipelines. J. Taiwan Inst. Chem. Eng. 2016, 58, 189–202. [Google Scholar] [CrossRef]
- Baloch, M.K.; Khurram, M.J.Z.; Durrani, G.F. Application of different methods for the thermogravimetric analysis of polyethylene samples. J. Appl. Polym. Sci. 2011, 120, 3511–3518. [Google Scholar] [CrossRef]
- García, R.A.; Serrano, D.P.; Otero, D. Catalytic cracking of HDPE over hybrid zeolitic-mesoporous materials. J. Anal. Appl. Pyrolysis 2005, 74, 379–386. [Google Scholar] [CrossRef]
- Gobin, K.; Manos, G. Thermogravimetric study of polymer catalytic degradation over microporous materials. Polym. Degrad. Stab. 2004, 86, 225–231. [Google Scholar] [CrossRef]
- Al-Salem, S.M.; Antelava, A.; Constantinou, A.; Manos, G.; Dutta, A. A review on thermal and catalytic pyrolysis of plastic solid waste (PSW). J. Environ. Manag. 2017, 197, 177–198. [Google Scholar] [CrossRef]
- Zhang, X.; Han, Y.; Li, Y.; Sun, Y. Effect of heating rate on pyrolysis behavior and kinetic characteristics of siderite. Materials 2017, 7, 211. [Google Scholar] [CrossRef]
- Chandrasekaran, S.R.; Kunwar, B.; Moser, B.R.; Rajagopalan, N.; Sharma, B.K. Catalytic thermal cracking of postconsumer waste plastics to fuels. 1. Kinetics and optimization. Energy Fuels 2015, 29, 6068–6077. [Google Scholar] [CrossRef]
- Al-Wahaibi, T.; Mjalli, F. Prediction of horizontal oil-water flow pressure gradient using artificial intelligence techniques. Chem. Eng. Commun. 2014, 201, 209–224. [Google Scholar] [CrossRef]
- Qinghua, W.; Honglan, Z.; Wei, L.; Junzheng, Y.; Xiaohong, W.; Wang, Y. Experimental study of horizontal gas-liquid two-phase flow in two medium-diameter pipes and prediction of pressure drop through BP neural networks. Int. J. Fluid Mach. Syst. 2018, 11, 255–264. [Google Scholar] [CrossRef]


© 2020 by the authors. Licensee MDPI, Basel, Switzerland. This article is an open access article distributed under the terms and conditions of the Creative Commons Attribution (CC BY) license (http://creativecommons.org/licenses/by/4.0/).